FLOW CHART 表格
- 格式:xls
- 大小:22.00 KB
- 文档页数:1

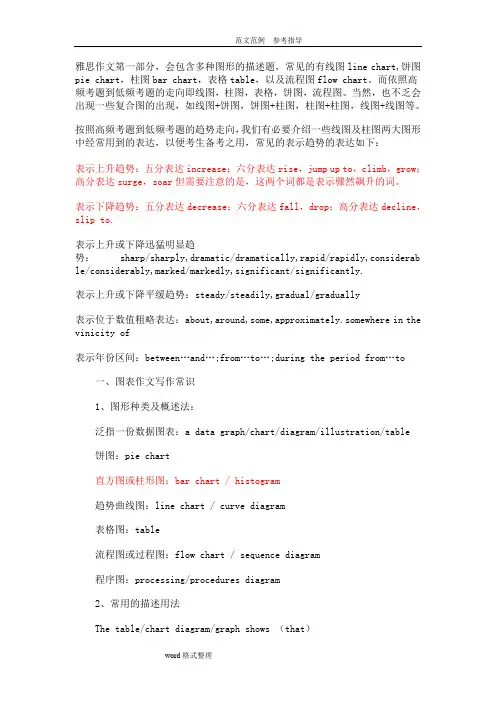
雅思作文第一部分,会包含多种图形的描述题,常见的有线图line chart,饼图pie chart,柱图bar chart,表格table,以及流程图flow chart。
而依照高频考题到低频考题的走向即线图,柱图,表格,饼图,流程图。
当然,也不乏会出现一些复合图的出现,如线图+饼图,饼图+柱图,柱图+柱图,线图+线图等。
按照高频考题到低频考题的趋势走向,我们有必要介绍一些线图及柱图两大图形中经常用到的表达,以便考生备考之用,常见的表示趋势的表达如下:表示上升趋势:五分表达increase;六分表达rise,jump up to,climb,grow;高分表达surge,soar但需要注意的是,这两个词都是表示骤然飙升的词。
表示下降趋势:五分表达decrease;六分表达fall,drop;高分表达decline,slip to.表示上升或下降迅猛明显趋势: sharp/sharply,dramatic/dramatically,rapid/rapidly,considerab le/considerably,marked/markedly,significant/significantly.表示上升或下降平缓趋势:steady/steadily,gradual/gradually表示位于数值粗略表达:about,around,some,approximately.somewhere in the vinicity of表示年份区间:between…and…;from…to…;during the period from…to一、图表作文写作常识1、图形种类及概述法:泛指一份数据图表:a data graph/chart/diagram/illustration/table饼图:pie chart直方图或柱形图:bar chart / histogram趋势曲线图:line chart / curve diagram表格图:table流程图或过程图:flow chart / sequence diagram程序图:processing/procedures diagram2、常用的描述用法The table/chart diagram/graph shows (that)According to the table/chart diagram/graphAs (is) shown in the table/chart diagram/graphAs can be seen from the table/chart/diagram/graph/figures,figures/statistics shows (that)……It can be seen from the figures/statisticsWe can see from the figures/statisticsIt is clear from the figures/statisticsIt is apparent from the figures/statisticstable/chart/diagram/graph figures (that)……table/chart/diagram/graph shows/describes/illustrates how……3、图表中的数据(Data)具体表达法数据(Data)在某一个时间段固定不变:fixed in time在一系列的时间段中转变:changes over time持续变化的data在不同情况下:增加:increase / raise / rise / go up ……减少:decrease / grow down / drop / fall ……波动:fluctuate / rebound / undulate / wave ……稳定:remain stable / stabilize / level off ……最常用的两种表达法:动词+副词形式(Verb+Adverb form)形容词+名词形式(Adjective+Noun form)二、相关常用词组1、主章开头图表类型:table、chart、diagramgraph、column chart、pie graph描述:show、describe、illustrate、can be seen from、clear、apparent、reveal、represent内容:figure、statistic、number、percentage、proportion2、表示数据变化的单词或者词组rapid/rapidly 迅速的,飞快的,险峻的dramatic/dramatically 戏剧性的,生动的significant/significantly 有意义的,重大的,重要的sharp/sharply 锐利的,明显的,急剧的steep/steeply 急剧升降的steady/steadily 稳固的,坚定不移的gradual/gradually 渐进的,逐渐的slow/slowly 缓慢的,不活跃的slight/slightly 轻微的、略微地stable/stably 稳定的3、其它在描述中的常用到的词significant changes 图中一些较大变化noticeable trend 明显趋势during the same period 在同一时期grow/grew 增长distribute 分布,区别unequally 不相等地in the case of adv. 在……的情况下in terms of / in respect of / regarding 在……方面in contrast 相反,大不相同government policy 政府政策market forces 市场规率measure n.尺寸,方法,措施v.估量,调节forecast n.先见,预见v.预测三、考研英语图表写作套句精选1.the table shows the changes in the number of……over the period from……to……该表格描述了在……年之……年间……数量的变化。
1、图形种类及概述法:泛指一份数据图表:a data graph(曲线图)/chart/diagram/illustration/table饼图:pie chart直方图或柱形图:bar chart/histogram趋势曲线图:line chart/curve diagram表格图:table流程图或过程图:flow chart/sequence diagram程序图:processing/procedures diagram2、常用的描述用法The table/chart diagram/graph shows (that)According to the table/chart diagram/graphAs (is) shown in the table/chart diagram/graphAs can be seen from the table/chart/diagram/graph/figures,figures/statistics shows (that)……It can be seen from the figures/statisticsWe can see from the figures/statisticsIt is clear from the figures/statisticsIt is apparent from the figures/statisticstable/chart/diagram/graph figures (that)……table/chart/diagram/graph shows/describes/illustrates 3、图表中的数据(Data)具体表达法数据(Data)在某一个时间段固定不变:fixed in time在一系列的时间段中转变:changes over time持续变化的data在不同情况下:增加:increase/raise/rise/go up ……减少:decrease/grow down/drop/fall ……波动:fluctuate/rebound/undulate/wave ……稳定:remain stable/stabilize/level off ……二、相关常用词组1、主章开头图表类型:table(表格)、chart(图表)、diagram(图标)、graph(多指曲线图)、column chart(柱状图)、pie graph(饼图)、tree diagram(树形图)描述:show、describe、illustrate、can be seen from、clear、apparent、reveal、represent内容:figure、statistic、number、percentage、proportion2、表示数据变化的单词或者词组rapid/rapidly 迅速的,飞快的,险峻的dramatic/dramatically 戏剧性的,生动的significant/significantly 有意义的,重大的,重要的sharp/sharply 锐利的,明显的,急剧的steep/steeply 急剧升降的steady/steadily 稳固的,坚定不移的gradual/gradually 渐进的,逐渐的slow/slowly 缓慢的,不活跃的slight/slightly 稍微的、略微地stable/stably 稳定的3、其它在描述中的常用到的词significant changes 图中一些较大变化noticeable trend 明显趋势during the same period 在同一时期grow/grew 增长distribute 分布unequally 不相等地in the case of 在……的情况下in terms of/in respect of/regarding 在……方面in contrast 相反,大不相同government policy 政府政策market forces 市场力量measuren n.尺寸,方法,措施v.估量,调节forecast n.先见,预见v.猜测三、图表描述套句精选1.the table shows the changes in the number of……over the period from……to……该表格描述了在……年之……年间……数量的变化。
1.Map(地图、天体图、布局图、专用图、图谱)Battle map 作战地图Highway map 公路图Genetic map 基因图谱2.Figure(图形、平面图)Geometric(al) figure 几何图形Dimension figure 尺寸图Plane figure 平面图3.Pattern(图案、图型、图样)Checkboard pattern 棋盘型图案Recording pattern 录像图型Circular pattern 圆形图样4.Sketch(草图、略图、简图)Eye sketch 目测草图Topographic sketch 地形略图Dimensional sketch 尺寸简图5.Scheme/shematic(图解、示意图、流程图、电路图)Flow scheme 流程图Induction scheme 感应电路图6.Draft(草图)Chisel draft 雕刻前在石头上画出边缘轮廓草图7.Curve(曲线图表)Algebraic curve 代数曲线Comfort curve 湿度舒适曲线8.Graph(曲线图表)Funtional graph 函数图(亦称plot)Bar graph 条形图(也称chart)9.View(视图)Plane view 平面视图10.Geometry(几何图)Plane geometry 平面几何Solid geometry 立体几何图11.Chart(航海图、图表)Aeronautical chart 领航图Demographic data chart 人口统计图表Pie chart 饼图Bar chart 柱图12.Drawing(工程图、插图)Drawing 建筑图Explanatory drawing 说明(插)图yout(布局图、规划图)1、图形种类及概述法:泛指一份数据图表:a data graph(曲线图)/chart/diagram/illustration/table饼图:pie chart直方图或柱形图:bar chart/histogram趋势曲线图:line chart/curve diagram表格图:table流程图或过程图:flow chart/sequence diagram程序图:processing/procedures diagram2、常用的描述用法The table/chart diagram/graph shows (that)According to the table/chart diagram/graphAs (is)shown in the table/chart diagram/graphAs can be seen from the table/chart/diagram/graph/figures,figures/statistics shows (that)……It can be seen from the figures/statisticsWe can see from the figures/statisticsIt is clear from the figures/statisticsIt is apparent from the figures/statisticstable/chart/diagram/graph figures (that)……table/chart/diagram/graph shows/describes/illustrates3、图表中的数据(Data)具体表达法数据(Data)在某一个时间段固定不变:fixed in time在一系列的时间段中转变:changes over time持续变化的data在不同情况下:增加:increase/raise/rise/go up ……减少:decrease/grow down/drop/fall ……波动:fluctuate/rebound/undulate/wave ……稳定:remain stable/stabilize/level off ……二、相关常用词组1、主章开头图表类型:table(表格)、chart(图表)、diagram(图标)、graph (多指曲线图)、column chart(柱状图)、pie graph(饼图)、tree diagram(树形图)描述:show、describe、illustrate、can be seen from、clear、apparent、reveal、represent内容:figure、statistic、number、percentage、proportion 2、表示数据变化的单词或者词组rapid/rapidly 迅速的,飞快的,险峻的dramatic/dramatically 戏剧性的,生动的significant/significantly 有意义的,重大的,重要的sharp/sharply 锐利的,明显的,急剧的steep/steeply 急剧升降的steady/steadily 稳固的,坚定不移的gradual/gradually 渐进的,逐渐的slow/slowly 缓慢的,不活跃的slight/slightly 稍微的、略微地stable/stably 稳定的3、其它在描述中的常用到的词significant changes 图中一些较大变化noticeable trend 明显趋势during the same period 在同一时期grow/grew 增长distribute 分布unequally 不相等地in the case of 在……的情况下in terms of/in respect of/regarding 在……方面in contrast 相反,大不相同government policy 政府政策market forces 市场力量measuren n.尺寸,方法,措施v.估量,调节forecast n.先见,预见v.猜测三、图表描述套句精选1.the table shows the changes in the number of……over theperiod from……to……该表格描述了在……年之……年间……数量的变化。
雅思作文第一部分,会包含多种图形的描述题,常见的有线图line chart,饼图pie chart,柱图bar chart,表格table,以及流程图flow chart。
而依照高频考题到低频考题的走向即线图,柱图,表格,饼图,流程图。
当然,也不乏会出现一些复合图的出现,如线图+饼图,饼图+柱图,柱图+柱图,线图+线图等。
按照高频考题到低频考题的趋势走向,我们有必要介绍一些线图及柱图两大图形中经常用到的表达,以便考生备考之用,常见的表示趋势的表达如下:表示上升趋势:五分表达increase;六分表达rise,jump up to,climb,grow;高分表达surge,soar但需要注意的是,这两个词都是表示骤然飙升的词。
表示下降趋势:五分表达decrease;六分表达fall,drop;高分表达decline,slip to.表示上升或下降迅猛明显趋势: sharp/sharply,dramatic/dramatically,rapid/rapidly,considerab le/considerably,marked/markedly,significant/significantly.表示上升或下降平缓趋势:steady/steadily,gradual/gradually表示位于数值粗略表达:about,around,some,approximately.somewhere in the vinicity of表示年份区间:between…and…;from…to…;during the period from…to一、图表作文写作常识1、图形种类及概述法:泛指一份数据图表:a data graph/chart/diagram/illustration/table饼图:pie chart直方图或柱形图:bar chart / histogram趋势曲线图:line chart / curve diagram表格图:table流程图或过程图:flow chart / sequence diagram程序图:processing/procedures diagram2、常用的描述用法The table/chart diagram/graph shows (that)According to the table/chart diagram/graphAs (is) shown in the table/chart diagram/graphAs can be seen from the table/chart/diagram/graph/figures,figures/statistics shows (that)……It can be seen from the figures/statisticsWe can see from the figures/statisticsIt is clear from the figures/statisticsIt is apparent from the figures/statisticstable/chart/diagram/graph figures (that)……table/chart/diagram/graph shows/describes/illustrates how……3、图表中的数据(Data)具体表达法数据(Data)在某一个时间段固定不变:fixed in time在一系列的时间段中转变:changes over time持续变化的data在不同情况下:增加:increase / raise / rise / go up ……减少:decrease / grow down / drop / fall ……波动:fluctuate / rebound / undulate / wave ……稳定:remain stable / stabilize / level off ……最常用的两种表达法:动词+副词形式(Verb+Adverb form)形容词+名词形式(Adjective+Noun form)二、相关常用词组1、主章开头图表类型:table、chart、diagramgraph、column chart、pie graph描述:show、describe、illustrate、can be seen from、clear、apparent、reveal、represent内容:figure、statistic、number、percentage、proportion2、表示数据变化的单词或者词组rapid/rapidly 迅速的,飞快的,险峻的dramatic/dramatically 戏剧性的,生动的significant/significantly 有意义的,重大的,重要的sharp/sharply 锐利的,明显的,急剧的steep/steeply 急剧升降的steady/steadily 稳固的,坚定不移的gradual/gradually 渐进的,逐渐的slow/slowly 缓慢的,不活跃的slight/slightly 轻微的、略微地stable/stably 稳定的3、其它在描述中的常用到的词significant changes 图中一些较大变化noticeable trend 明显趋势during the same period 在同一时期grow/grew 增长distribute 分布,区别unequally 不相等地in the case of adv. 在……的情况下in terms of / in respect of / regarding 在……方面in contrast 相反,大不相同government policy 政府政策market forces 市场规率measure n.尺寸,方法,措施v.估量,调节forecast n.先见,预见v.预测三、考研英语图表写作套句精选1.the table shows the changes in the number of……over the period from……to……该表格描述了在……年之……年间……数量的变化。
Stateflow Chart用法在软件开发中,Stateflow Chart是一种流程图形式的建模工具,它能够对系统的状态和事件进行建模和分析。
Stateflow Chart的使用在很多领域都有广泛的应用,比如控制系统、通信系统、汽车电子系统等等。
在本文中,我们将探讨Stateflow Chart的基本用法,并且分析其在不同领域的应用。
1. Stateflow Chart的基本概念Stateflow Chart是一种基于状态的建模工具,它通过状态、转移和动作来描述系统的行为。
在Stateflow Chart中,状态用方框表示,转移用箭头表示,动作用椭圆形表示。
通过这些基本元素的组合,可以描述出系统在不同状态下的行为,并且可以清晰地展现系统的状态转移过程。
2. Stateflow Chart的应用在控制系统中,Stateflow Chart常常用于描述系统的控制逻辑。
比如在汽车防抱死系统(ABS)中,Stateflow Chart可以很好地描述出车轮在不同状态下的制动逻辑。
在通信系统中,Stateflow Chart可以描述出数据包在网络中的传输过程。
在汽车电子系统中,Stateflow Chart 可以描述出车辆在不同行驶状态下的控制逻辑。
3. Stateflow Chart的优势与传统的文字描述相比,Stateflow Chart能够更直观地展现系统的行为。
通过图形化的表示,可以更容易地理解系统的状态转移过程。
另外,Stateflow Chart还可以方便地与Simulink等建模工具结合使用,从而可以对系统进行更全面的建模和分析。
4. 对Stateflow Chart的个人观点和理解我认为Stateflow Chart作为一种建模工具,在系统建模和分析中具有很大的优势。
它不仅能够更形象地展现系统的行为,还能够方便地与其他建模工具结合使用。
在我的工作中,我经常会使用Stateflow Chart来描述系统的控制逻辑,它确实为我提供了很大的方便。
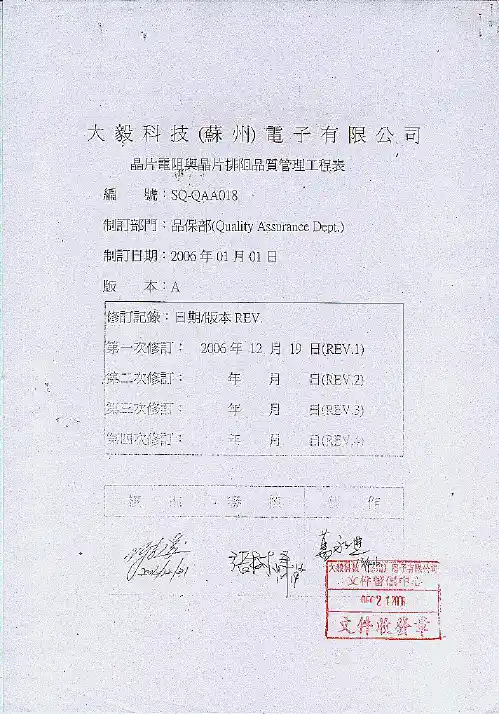
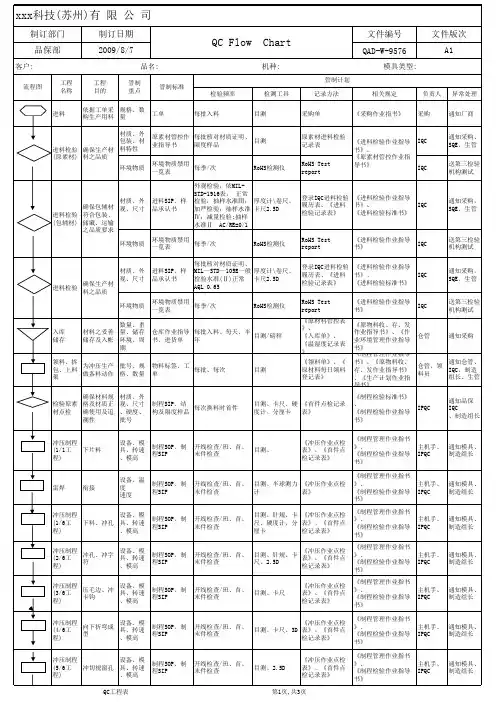
大 毅 科 技 (蘇州) 電 子 有 限 公 司
晶片電阻與晶片排阻品質管理工程表
TA-I Group
Passive Component
Passive Component
晶片電阻與晶片排阻品質管理工程表
TA-I Group
Passive Component
晶片電阻與晶片排阻品質管理工程表
TA-I Group
Passive Component
晶片電阻與晶片排阻品質管理工程表
TA-I Group
晶片電阻與晶片排阻品質管理工程表
TA-I Group
Passive Component
晶片電阻與晶片排阻品質管理工程表
TA-I Group
Passive Component
晶片電阻與晶片排阻品質管理工程表
TA-I Group
晶片電阻與晶片排阻品質管理工程表
TA-I Group
Passive Component
晶片電阻與晶片排阻品質管理工程表
TA-I Group
Passive Component
晶片電阻與晶片排阻品質管理工程表
TA-I Group
Passive Component。
![工艺流程图(Flow chart)[空白模板]](https://uimg.taocdn.com/87d34fe34a7302768f993916.webp)
样品工艺流程表格模板英文回答:Sample Process Flow Chart Template.Introduction:A process flow chart is a visual representation of the steps involved in a particular process. It helps to provide a clear understanding of the sequence of activities and decision points within the process. Here is a template for a sample process flow chart:Title: Sample Process Flow Chart.Step 1: Define the Objective.The first step in any process is to clearly define the objective. This involves understanding the desired outcome and the purpose of the process. For example, let's say weare creating a process flow chart for a product manufacturing process. The objective could be to ensure efficient and error-free production.Step 2: Identify the Activities.Next, we need to identify all the activities involved in the process. These are the individual tasks or steps that need to be completed to achieve the objective. For instance, in our manufacturing process, the activities could include sourcing raw materials, product assembly, quality control, and packaging.Step 3: Determine the Sequence.Once the activities are identified, it is important to determine the sequence in which they need to be performed. This helps to establish a logical flow of the process. For example, in our manufacturing process, the sequence could be sourcing raw materials, product assembly, quality control, and finally packaging.Step 4: Define Decision Points.Decision points are points in the process where a choice or decision needs to be made. These decisions can have different outcomes and may lead to different paths within the process. In our manufacturing process, a decision point could be whether to accept or reject a product based on quality control results.Step 5: Create the Flow Chart.Now it's time to create the actual flow chart using the information gathered in the previous steps. The flow chart should clearly depict the sequence of activities and decision points. It can be created using various software tools or even hand-drawn. The flow chart should be easy to understand and follow.Step 6: Review and Improve.Once the flow chart is created, it is important to review it for accuracy and clarity. This can be done byinvolving stakeholders or subject matter experts who are familiar with the process. Any necessary improvements or modifications can be made at this stage to ensure the flow chart accurately represents the process.Step 7: Communicate and Implement.The final step is to communicate the process flow chart to all relevant stakeholders and implement it in the actual process. This helps to ensure everyone involved understands the process and can follow it effectively. Regular updates and revisions to the flow chart may be necessary as the process evolves.中文回答:样品工艺流程表格模板。
表格英语作文写法表格类型的英语作文怎么写,怎么大概说清表达中的内容呢?下面是店铺给大家带来表格英语作文写作方法,供大家参阅!表格英语作文写作常识1、图形种类及概述法:泛指一份数据图表: a data graph/chart/diagram/illustration/table饼图:pie chart直方图或柱形图:bar chart / histogram趋势曲线图:line chart / curve diagram表格图:table流程图或过程图:flow chart / sequence diagram程序图:processing/procedures diagram2、常用的描述用法The table/chart diagram/graph shows (that)According to the table/chart diagram/graphAs (is) shown in the table/chart diagram/graphAs can be seen from the table/chart/diagram/graph/figures,figures/statistics shows (that)……It can be seen from the figures/statisticsWe can see from the figures/statisticsIt is clear from the figures/statisticsIt is apparent from the figures/statisticstable/chart/diagram/graph figures (that) ……table/chart/diagram/graph shows/describes/illustrates how……3、图表中的数据(Data)具体表达法数据(Data)在某一个时间段固定不变:fixed in time在一系列的时间段中转变:changes over time持续变化的data在不同情况下:增加:increase / raise / rise / go up ……减少:decrease / grow down / drop / fall ……波动:fluctuate / rebound / undulate / wave ……稳定:remain stable / stabilize / level off ……最常用的两种表达法:动词+副词形式(Verb+Adverb form)形容词+名词形式(Adjective+Noun form)表格英语作文写作套句11.the table shows the changes in the numbe r of……over the period from……to……该表格描述了在……年之……年间……数量的变化。