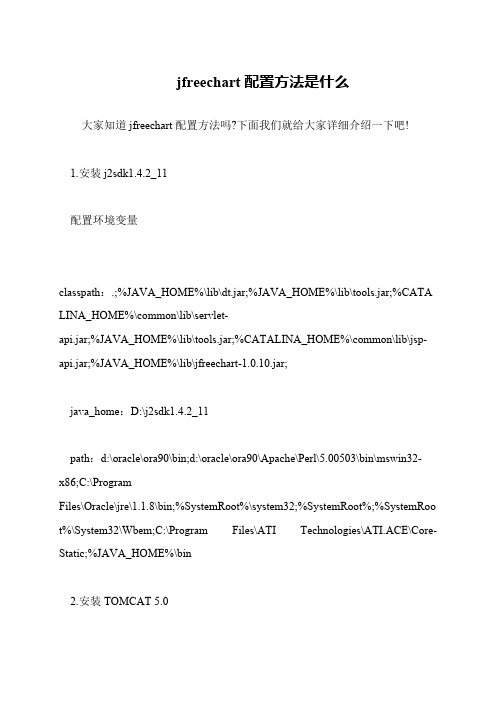
jFreeChart教程
- 格式:xls
- 大小:218.00 KB
- 文档页数:22
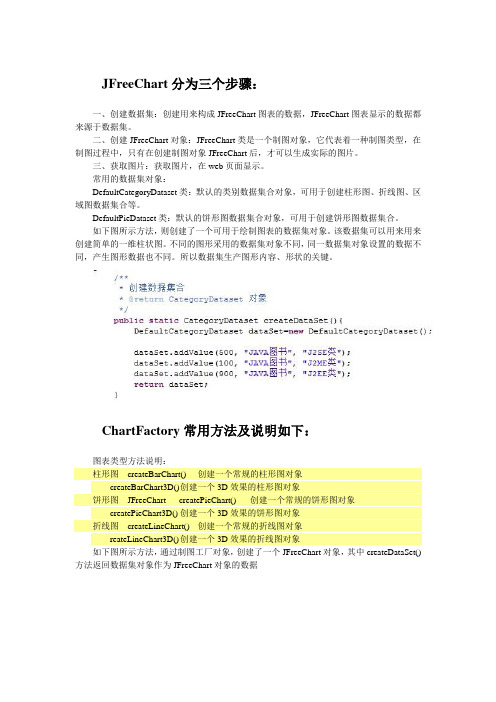
JFreeChart分为三个步骤:一、创建数据集:创建用来构成JFreeChart图表的数据,JFreeChart图表显示的数据都来源于数据集。
二、创建JFreeChart对象:JFreeChart类是一个制图对象,它代表着一种制图类型,在制图过程中,只有在创建制图对象JFreeChart后,才可以生成实际的图片。
三、获取图片:获取图片,在web页面显示。
常用的数据集对象:DefaultCategoryDataset类:默认的类别数据集合对象,可用于创建柱形图、折线图、区域图数据集合等。
DefaultPieDataset类:默认的饼形图数据集合对象,可用于创建饼形图数据集合。
如下图所示方法,则创建了一个可用于绘制图表的数据集对象。
该数据集可以用来用来创建简单的一维柱状图。
不同的图形采用的数据集对象不同,同一数据集对象设置的数据不同,产生图形数据也不同。
所以数据集生产图形内容、形状的关键。
ChartFactory常用方法及说明如下:图表类型方法说明:柱形图createBarChart() 创建一个常规的柱形图对象createBarChart3D() 创建一个3D效果的柱形图对象饼形图JFreeChart createPieChart() 创建一个常规的饼形图对象createPieChart3D() 创建一个3D效果的饼形图对象折线图createLineChart() 创建一个常规的折线图对象reateLineChart3D() 创建一个3D效果的折线图对象如下图所示方法,通过制图工厂对象,创建了一个JFreeChart对象,其中createDataSet()方法返回数据集对象作为JFreeChart对象的数据。
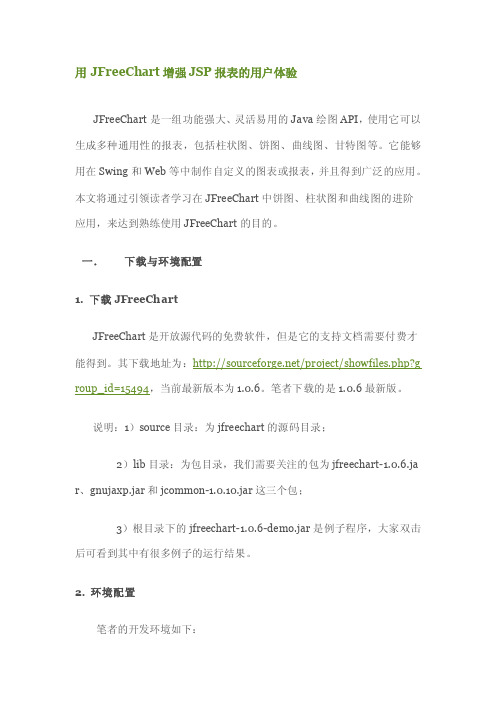
用JFreeChart增强JSP报表的用户体验JFreeChart是一组功能强大、灵活易用的Java绘图API,使用它可以生成多种通用性的报表,包括柱状图、饼图、曲线图、甘特图等。
它能够用在Swing和Web等中制作自定义的图表或报表,并且得到广泛的应用。
本文将通过引领读者学习在JFreeChart中饼图、柱状图和曲线图的进阶应用,来达到熟练使用JFreeChart的目的。
一.下载与环境配置1. 下载JFreeChartJFreeChart是开放源代码的免费软件,但是它的支持文档需要付费才能得到。
其下载地址为:/project/showfiles.php?g roup_id=15494,当前最新版本为1.0.6。
笔者下载的是1.0.6最新版。
说明:1)source目录:为jfreechart的源码目录;2)lib目录:为包目录,我们需要关注的包为jfreechart-1.0.6.ja r、gnujaxp.jar和jcommon-1.0.10.jar这三个包;3)根目录下的jfreechart-1.0.6-demo.jar是例子程序,大家双击后可看到其中有很多例子的运行结果。
2. 环境配置笔者的开发环境如下:JDK:1.5MyEclipse:5.1.1 GATomcat:5.5.28为了后续的“用JFreeChart创建基于Web的图表”的一个例子的展示,我们在MyEclipse中创建一个名为jfreechart的Web工程。
将下载的JFreeChart1.0.6下lib目录下的jar包拷贝到WebRoot/WEB-INF/lib目录下。
另外还需要在web.xml文件中增加如下配置:<servlet><servlet-name>DisplayChart</servlet-name><servlet-class>org.jfree.chart.servlet.DisplayChart</servlet-clas s></servlet><servlet-mapping><servlet-name>DisplayChart</servlet-name><url-pattern>/DisplayChart</url-pattern></servlet-mapping>二.柱状图在WebRoot目录下建立bar目录,用来存放柱状图的各个例子。
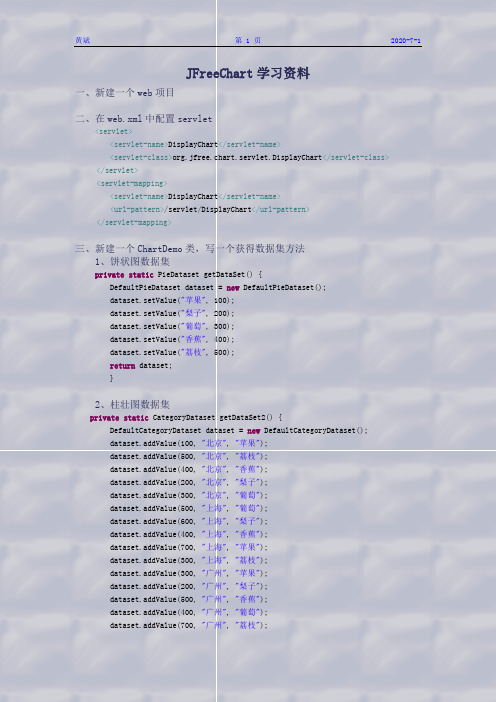
JFreeChart学习资料一、新建一个web项目二、在web.xml中配置servlet<servlet><servlet-name>DisplayChart</servlet-name><servlet-class>org.jfree.chart.servlet.DisplayChart</servlet-class> </servlet><servlet-mapping><servlet-name>DisplayChart</servlet-name><url-pattern>/servlet/DisplayChart</url-pattern></servlet-mapping>三、新建一个ChartDemo类,写一个获得数据集方法1、饼状图数据集private static PieDataset getDataSet() {DefaultPieDataset dataset = new DefaultPieDataset();dataset.setValue("苹果", 100);dataset.setValue("梨子", 200);dataset.setValue("葡萄", 300);dataset.setValue("香蕉", 400);dataset.setValue("荔枝", 500);return dataset;}2、柱壮图数据集private static CategoryDataset getDataSet2() {DefaultCategoryDataset dataset = new DefaultCategoryDataset();dataset.addValue(100, "北京", "苹果");dataset.addValue(500, "北京", "荔枝");dataset.addValue(400, "北京", "香蕉");dataset.addValue(200, "北京", "梨子");dataset.addValue(300, "北京", "葡萄");dataset.addValue(500, "上海", "葡萄");dataset.addValue(600, "上海", "梨子");dataset.addValue(400, "上海", "香蕉");dataset.addValue(700, "上海", "苹果");dataset.addValue(300, "上海", "荔枝");dataset.addValue(300, "广州", "苹果");dataset.addValue(200, "广州", "梨子");dataset.addValue(500, "广州", "香蕉");dataset.addValue(400, "广州", "葡萄");dataset.addValue(700, "广州", "荔枝");return dataset;}3、折线图数据集private static CategoryDataset getDataSet2() {DefaultCategoryDataset dataset = new DefaultCategoryDataset();dataset.addValue(100, "北京", "苹果");dataset.addValue(500, "北京", "荔枝");dataset.addValue(400, "北京", "香蕉");dataset.addValue(200, "北京", "梨子");dataset.addValue(300, "北京", "葡萄");dataset.addValue(500, "上海", "葡萄");dataset.addValue(600, "上海", "梨子");dataset.addValue(400, "上海", "香蕉");dataset.addValue(700, "上海", "苹果");dataset.addValue(300, "上海", "荔枝");dataset.addValue(300, "广州", "苹果");dataset.addValue(200, "广州", "梨子");dataset.addValue(500, "广州", "香蕉");dataset.addValue(400, "广州", "葡萄");dataset.addValue(700, "广州", "荔枝");return dataset;}四、写一个主方法用来构造要显示的图形1、饼状图public static String generatePieChart(HttpSession session, PrintWriter pw,int w, int h){String filename = null;PieDataset dataset = getDataSet();JFreeChart chart = ChartFactory.createPieChart3D("水果产量图", // 图表标题dataset, // 数据集true, // 是否显示图例false, // 是否生成工具false// 是否生成URL链接);chart.setBackgroundPaint(Color.pink);try {/*------得到chart的保存路径----*/ChartRenderingInfo info = new ChartRenderingInfo(newStandardEntityCollection());filename = ServletUtilities.saveChartAsPNG(chart, w, h, info,session);/*------使用printWriter将文件写出----*/ChartUtilities.writeImageMap(pw, filename, info, true);pw.flush();} catch (IOException e) {e.printStackTrace();}return filename;}2、柱状图public static String generateBarChart(HttpSession session, PrintWriter pw, int w, int h){String filename = null;CategoryDataset dataset = getDataSet2();JFreeChart chart = ChartFactory.createBarChart3D("水果产量图", // 图表标题"水果", // 目录轴的显示标签"产量", // 数值轴的显示标签dataset, // 数据集PlotOrientation.VERTICAL, // 图表方向:水平、垂直true, // 是否显示图例(对于简单的柱状图必须是false)false, // 是否生成工具false// 是否生成URL链接);try {/*------得到chart的保存路径----*/ChartRenderingInfo info = new ChartRenderingInfo(new StandardEntityCollection());filename = ServletUtilities.saveChartAsPNG(chart, w, h, info,session);/*------使用printWriter将文件写出----*/ChartUtilities.writeImageMap(pw, filename, info, true);pw.flush();} catch (IOException e) {// TODO自动生成 catch 块e.printStackTrace();}return filename;}3、折线图public static String generateLineChart(HttpSession session, PrintWriter pw, int w, int h){String filename = null;CategoryDataset dataset = getDataSet2();JFreeChart chart = ChartFactory.createLineChart("水果产量图", // 图表标题"水果", // 目录轴的显示标签"产量", // 数值轴的显示标签dataset, // 数据集PlotOrientation.VERTICAL, // 图表方向:水平、垂直true, // 是否显示图例(对于简单的柱状图必须是false)false, // 是否生成工具false// 是否生成URL链接);/*----------设置消除字体的锯齿渲染(解决中文问题)--------------*/chart.getRenderingHints().put(RenderingHints.KEY_TEXT_ANTIALIASING, RenderingHints.VALUE_TEXT_ANTIALIAS_OFF);/*------------配置图表属性--------------*/// 1,设置整个图表背景颜色chart.setBackgroundPaint(Color.pink);/*------------设定Plot参数-------------*/CategoryPlot plot = chart.getCategoryPlot();// 2,设置详细图表的显示细节部分的背景颜色//plot.setBackgroundPaint(Color.PINK);// 3,设置垂直网格线颜色plot.setDomainGridlinePaint(Color.black);//4,设置是否显示垂直网格线plot.setDomainGridlinesVisible(true);//5,设置水平网格线颜色plot.setRangeGridlinePaint(Color.blue);//6,设置是否显示水平网格线plot.setRangeGridlinesVisible(true);try {/*------得到chart的保存路径----*/ChartRenderingInfo info = new ChartRenderingInfo(new StandardEntityCollection());filename = ServletUtilities.saveChartAsPNG(chart, w, h, info,session);/*------使用printWriter将文件写出----*/ChartUtilities.writeImageMap(pw, filename, info, true);pw.flush();} catch (IOException e) {// TODO自动生成 catch 块e.printStackTrace();}return filename;}五、写一个调用JfreeChart的显示页面<%@ page contentType="text/html;charset=GBK"%><%@ page import="java.io.PrintWriter"%><jsp:directive.page import=".ChartDemo"/><html><head><title></title><%//以下部分为折线图象输出(调用不同的方法生成不同类型的图形)String fileName=ChartDemo.generateLineChart(session,newPrintWriter(out),580,250);String graphURL = request.getContextPath() + "/servlet/DisplayChart?filename="+ fileName;%></head><body bgcolor="#ffffff"><table width="580" border="0" cellspacing="0" cellpadding="0"><tr><td><img src="<%= graphURL %>"width=580 height=250 border=0 ></td></tr></table></body></html>六、将项目发布到web服务器,启动web服务器。
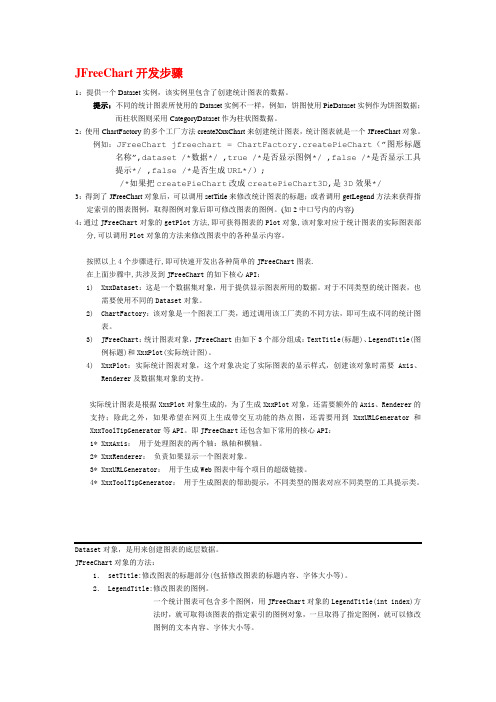
JFreeChart开发步骤1:提供一个Dataset实例,该实例里包含了创建统计图表的数据。
提示:不同的统计图表所使用的Dataset实例不一样,例如,饼图使用PieDataset实例作为饼图数据;而柱状图则采用CategoryDataset作为柱状图数据。
2:使用ChartFactory的多个工厂方法createXxxChart来创建统计图表,统计图表就是一个JFreeChart对象。
例如:JFreeChart jfreechart = ChartFactory.createPieChart(”图形标题名称”,dataset /*数据*/ ,true /*是否显示图例*/ ,false /*是否显示工具提示*/ ,false /*是否生成URL*/);/*如果把createPieChart改成createPieChart3D,是3D效果*/3:得到了JFreeChart对象后,可以调用setTitle来修改统计图表的标题;或者调用getLegend方法来获得指定索引的图表图例,取得图例对象后即可修改图表的图例。
(如2中口号内的内容)4:通过JFreeChart对象的getPlot方法,即可获得图表的Plot对象,该对象对应于统计图表的实际图表部分,可以调用Plot对象的方法来修改图表中的各种显示内容。
按照以上4个步骤进行,即可快速开发出各种简单的JFreeChart图表.在上面步骤中,共涉及到JFreeChart的如下核心API:1)XxxDataset:这是一个数据集对象,用于提供显示图表所用的数据。
对于不同类型的统计图表,也需要使用不同的Dataset对象。
2)ChartFactory:该对象是一个图表工厂类,通过调用该工厂类的不同方法,即可生成不同的统计图表。
3)JFreeChart:统计图表对象,JFreeChart由如下3个部分组成:TextTitle(标题)、LegendTitle(图例标题)和XxxPlot(实际统计图)。
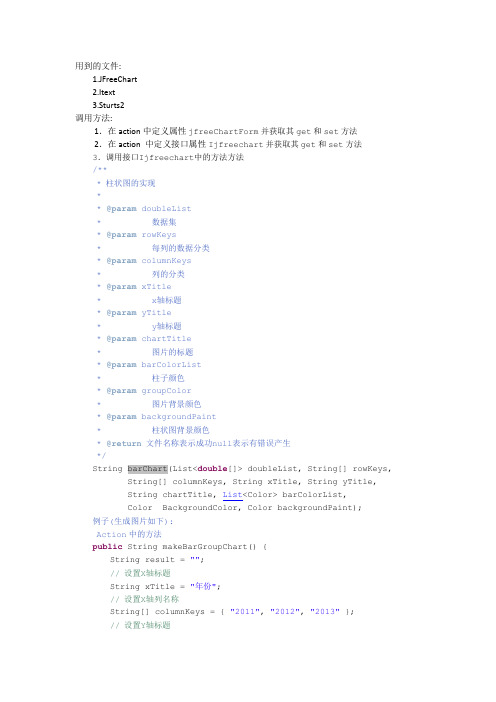
用到的文件:1.JFreeChart2.Itext3.Sturts2调用方法:1.在action中定义属性jfreeChartForm并获取其get和set方法2.在action 中定义接口属性Ijfreechart并获取其get和set方法3.调用接口Ijfreechart中的方法方法/***柱状图的实现**@param doubleList*数据集*@param rowKeys*每列的数据分类*@param columnKeys*列的分类*@param xTitle*x轴标题*@param yTitle*y轴标题*@param chartTitle*图片的标题*@param barColorList*柱子颜色*@param groupColor*图片背景颜色*@param backgroundPaint*柱状图背景颜色*@return文件名称表示成功null表示有错误产生*/String barChart(List<double[]> doubleList, String[] rowKeys, String[] columnKeys, String xTitle, String yTitle,String chartTitle, List<Color> barColorList,Color BackgroundColor, Color backgroundPaint);例子(生成图片如下):Action中的方法public String makeBarGroupChart() {String result = "";// 设置X轴标题String xTitle = "年份";// 设置X轴列名称String[] columnKeys = { "2011", "2012", "2013" };// 设置Y轴标题String yTitle = "设备数量";//初始化数据List<double[]> doubleList = new ArrayList<double[]>();String[] rowKeys = new String[]{"vpp设备","vph设备","工作站主机"};//添加数据doubleList.add(new double[] { 100, 150, 200 });doubleList.add(new double[] { 80, 130, 170 });doubleList.add(new double[] { 120, 170, 220 });// 设置图片标题String chartTitle = "设备数量图";// 获取每个柱子颜色的List<Color> (注意,系统取色的时候要使用16位的模式来查看颜色编码,这样比较准确)List<Color> barColorList = new ArrayList<Color>();barColorList.add(new Color(127,255,212));barColorList.add(new Color(220,220,220));barColorList.add(new Color(152,251,152));//定义图片背景颜色Color backgroundColor = Color.white;//定义柱形图颜色Color barColor = new Color(238,220,130);//调用方法生成图片获取返回值String fileName = this.jfreechart.barChart(doubleList, rowKeys, columnKeys, xTitle, yTitle, chartTitle, barColorList,backgroundColor, barColor);this.jfreeChartForm = new JFreeChartForm();this.jfreeChartForm.setFileName(fileName);if(fileName == null || fileName == ""){result = ERROR;}else{result = SUCCESS;}return result;}效果图:在JSP上的调用方法:<imgsrc="${pageContext.request.contextPath}/web/report/images/temp/${jfre eChartForm.fileName}">/***饼状图**@param data*数据集*@param datadescription*数据的业务逻辑*@param chartTitle*图片标题*@param pieKeys*分饼名称*@param pieColorList*分饼颜色*@param pieChartColor*饼图颜色*@param backgroundColor*图片背景色*@return 文件名称表示成功null表示有错误产生*/String createValidityComparePimChar(double[] data,String[] datadescription, String chartTitle, String[]pieKeys,List<Color> pieColorList, Color pieChartColor, ColorbackgroundColor);例子(生成图片如下):Action中的方法public String makePieChart() {String result = "";List<String> userNameList = erName();String[] Keys = new String[]{"vpp设备使用人数","vph设备使用人数","工作站设备使用人数"};//初始化数据double[] doubleList = new double[]{70,50,80};List<Color> barColorList = new ArrayList<Color>();Color backgroundColor = null;Color pieChartColor = null;String fileName =this.jfreechart.createValidityComparePimChar(doubleList, Keys,"饼状图", Keys, barColorList,pieChartColor, backgroundColor);this.jfreeChartForm = new JFreeChartForm();this.jfreeChartForm.setFileName(fileName);if(fileName == null || fileName == ""){result = ERROR;}else{result = SUCCESS;}return result;}效果图:在JSP上的调用方法:<imgsrc="${pageContext.request.contextPath}/web/report/images/temp/${jfre eChartForm.fileName}">/***折线图**@param rowKeys*每条线的数据点*@param columnKeys*X轴上的列名*@param chartTitle*图片标题*@param xName*x轴标题*@param yName*y轴标题*@param xyDataset*数据集*@return 文件名称表示成功null表示有错误产生*/String createTimeXYChar(String[] rowKeys, String[] columnKeys, String chartTitle, String xName, String yName,List<double[]> xyDataset, Color backgroundColor,Color lineChartColor, List<Color> barColorList);例子(生成图片如下):Action中的方法public String makeLineAndShapeChart() {String result = "";String xTitle = "年份";// 设置X轴列名称String[] columnKeys = { "2011", "2012", "2013" };// 设置Y轴标题String yTitle = "设备数量";//初始化数据List<double[]> doubleList = new ArrayList<double[]>();//添加数据String[] rowKeys = new String[]{"vpp设备","vph设备","工作站主机"};doubleList.add(new double[] { 100, 150, 200 });doubleList.add(new double[] { 80, 130, 170 });doubleList.add(new double[] { 120, 170, 220 });List<String> userNameList = erName();//设置图片背景色Color backgroundColor = null;//设置折线图背景色Color LineChartColor = null;//设置线的颜色List<Color> barColorList = new ArrayList<Color>();String fileName = this.jfreechart.createTimeXYChar(rowKeys, columnKeys, "折线图",xTitle, yTitle, doubleList,backgroundColor, LineChartColor, barColorList);this.jfreeChartForm = new JFreeChartForm();this.jfreeChartForm.setFileName(fileName);if(fileName == null || fileName == ""){result = ERROR;}else{result = SUCCESS;}return result;}在JSP上的调用方法:<imgsrc="${pageContext.request.contextPath}/web/report/images/temp/${jfre eChartForm.fileName}">下面是封装的方法:JFreeChart类:package .bis.gms.jfreechart;import java.awt.Color;import java.awt.Font;import java.awt.RenderingHints;import java.io.BufferedOutputStream;import java.io.File;import java.io.FileOutputStream;import java.io.IOException;import java.io.OutputStream;import java.io.PrintWriter;import java.text.DecimalFormat;import java.text.NumberFormat;import java.util.ArrayList;import java.util.Date;import java.util.List;import javax.servlet.http.HttpServletRequest;import javax.servlet.http.HttpServletResponse;import javax.servlet.jsp.PageContext;import javax.swing.JMenuItem;import javax.swing.JPopupMenu;import ng.StringUtils;import org.apache.struts2.ServletActionContext;import org.jfree.chart.ChartFactory;import org.jfree.chart.ChartPanel;import org.jfree.chart.ChartUtilities;import org.jfree.chart.JFreeChart;import org.jfree.chart.axis.CategoryAxis;import org.jfree.chart.axis.CategoryLabelPositions;import org.jfree.chart.axis.NumberAxis;import org.jfree.chart.axis.ValueAxis;import bels.StandardCategoryItemLabelGenerator; import bels.StandardPieSectionLabelGenerator; import org.jfree.chart.plot.CategoryPlot;import org.jfree.chart.plot.PiePlot;import org.jfree.chart.plot.PiePlot3D;import org.jfree.chart.plot.PlotOrientation;import org.jfree.chart.renderer.category.BarRenderer;import org.jfree.chart.renderer.category.LineAndShapeRenderer; import org.jfree.chart.title.LegendTitle;import org.jfree.chart.title.TextTitle;import org.jfree.data.category.CategoryDataset;import org.jfree.data.general.DatasetUtilities;import org.jfree.data.general.DefaultPieDataset;import com.lowagie.text.Rectangle;import com.lowagie.text.pdf.DefaultFontMapper;import com.lowagie.text.pdf.FontMapper;import .bis.core.base.web.action.BaseAction;import java.awt.Graphics2D;import java.awt.geom.Rectangle2D;import java.io.BufferedOutputStream;import java.io.File;import java.io.FileOutputStream;import java.io.IOException;import java.io.OutputStream;import java.text.SimpleDateFormat;import org.jfree.chart.ChartFactory;import org.jfree.chart.JFreeChart;import org.jfree.chart.axis.DateAxis;import org.jfree.chart.plot.XYPlot;import org.jfree.chart.renderer.xy.XYLineAndShapeRenderer; import org.jfree.chart.servlet.ServletUtilities;import org.jfree.data.time.Month;import org.jfree.data.time.TimeSeries;import org.jfree.data.time.TimeSeriesCollection;import org.jfree.data.xy.XYDataset;import com.lowagie.text.BadElementException;import com.lowagie.text.Document;import com.lowagie.text.DocumentException;import com.lowagie.text.Element;import com.lowagie.text.Image;import com.lowagie.text.Paragraph;import com.lowagie.text.Rectangle;import com.lowagie.text.pdf.DefaultFontMapper;import com.lowagie.text.pdf.FontMapper;import com.lowagie.text.pdf.PdfContentByte;import com.lowagie.text.pdf.PdfPCell;import com.lowagie.text.pdf.PdfPTable;import com.lowagie.text.pdf.PdfTemplate;import com.lowagie.text.pdf.PdfWriter;public class JfreeChart extends BaseAction implements Ijfreechart { public static final long serialVersionUID = 1;private String fileName;/***柱状图的实现**@param doubleList*数据集*@param rowKeys*每列的数据分类*@param columnKeys*列的分类*@param xTitle*x轴标题*@param yTitle*y轴标题*@param chartTitle*图片的标题*@param barColorList*柱子颜色*@param groupColor*图片背景颜色*@param backgroundPaint*柱状图背景颜色*@return文件名称表示成功null表示有错误产生*/public String barChart(List<double[]> doubleList, String[] rowKeys, String[] columnKeys, String xName, String yName, String chartTitle,List<Color> barColorList, Color backgroundColor,Color backgroundPaint) {// 初始化返回值String m_Result = "";// 校验传入的参数是否有误this.verifyInputBarValue(doubleList, rowKeys, columnKeys, xName, yName,chartTitle, barColorList, backgroundColor);// 表示没有存在有错误内容if (super.getFieldErrors().size() == 0) {// 初始化二维数组double[][] data = new double[doubleList.size()][];// 获取数据for (int i = 0; i < doubleList.size(); i++) {data[i] = doubleList.get(i);}// 根据数据获取支持生成图片的数据集CategoryDataset dataset =DatasetUtilities.createCategoryDataset(rowKeys, columnKeys, data);// 创建JFreChart对象JFreeChart chart = ChartFactory.createBarChart(chartTitle, // 图表标题xName, // 目录轴的显示标签yName, // 数值轴的显示标签dataset, // 数据集PlotOrientation.VERTICAL, // 图表方向:水平、垂直true, // 是否显示图例(对于简单的柱状图必须是false)true, // 是否生成工具true// 是否生成URL链接);// 设置字体格式(整体的字体格式)Font labelFont = new Font("SansSerif", Font.TRUETYPE_FONT, 12);// 设置文字锯齿chart.setTextAntiAlias(true);chart.getRenderingHints().put(RenderingHints.KEY_TEXT_ANTIALIASIN G,RenderingHints.VALUE_TEXT_ANTIALIAS_OFF);// 判断背景图片颜色是否设置if (backgroundColor == null) {// 设置默认颜色backgroundColor = Color.lightGray;} else {// 设置背景色chart.setBackgroundPaint(backgroundColor);}// 创建 plotCategoryPlot plot = chart.getCategoryPlot();// 设置横虚线可见plot.setRangeGridlinesVisible(true);// 虚线色彩plot.setRangeGridlinePaint(Color.gray);// 数据轴精度NumberAxis vn = (NumberAxis) plot.getRangeAxis();// 数据轴数据标签的显示格式DecimalFormat df = new DecimalFormat("#0.00");vn.setNumberFormatOverride(df);// x轴设置CategoryAxis domainAxis = plot.getDomainAxis();// x轴标题domainAxis.setLabelFont(labelFont);// x轴数值domainAxis.setTickLabelFont(labelFont);// 横轴上的Lable是否完整显示domainAxis.setMaximumCategoryLabelWidthRatio(0.6f);// 设置距离图片左端距离domainAxis.setLowerMargin(0.1);// 设置距离图片右端距离domainAxis.setUpperMargin(0.1);// 设置距离图片顶端距离plot.setDomainAxis(domainAxis);// 设置柱图背景色(注意,系统取色的时候要使用16位的模式来查看颜色编码,这样比较准确)if (backgroundPaint == null) {// 设置默认值plot.setBackgroundPaint(new Color(255, 255, 204));} else {// 将传入的参数设置为背景色plot.setBackgroundPaint(backgroundPaint);}// 设置X轴完毕// y轴设置// 获取y轴ValueAxis rangeAxis = plot.getRangeAxis();// y轴标题字体设置rangeAxis.setLabelFont(labelFont);// y轴数值字体设置rangeAxis.setTickLabelFont(labelFont);// 设置最高的一个 Item 与图片顶端的距离rangeAxis.setUpperMargin(0.2);// 设置最低的一个 Item 与图片底端的距离rangeAxis.setLowerMargin(0.15);plot.setRangeAxis(rangeAxis);// 初始化柱子对象BarRenderer renderer = new BarRenderer();// 设置柱子宽度renderer.setMaximumBarWidth(0.1);// 设置柱子高度renderer.setMinimumBarLength(0.2);// 设置柱子边框颜色renderer.setBaseOutlinePaint(Color.BLACK);// 设置柱子边框可见renderer.setDrawBarOutline(true);// 设置柱的颜色// 判断柱子颜色的List是否设置if (barColorList == null || barColorList.size() == 0) { // 设置默认颜色barColorList = new ArrayList<Color>();barColorList.add(Color.DARK_GRAY);} else {for (int i = 0; i < barColorList.size(); i++) {renderer.setSeriesPaint(i, barColorList.get(i));}}// 设置每个地区所包含的平行柱的之间距离renderer.setItemMargin(0.0);// 显示每个柱的数值,并修改该数值的字体属性renderer.setIncludeBaseInRange(true);renderer.setBaseItemLabelGenerator(new StandardCategoryItemLabelGenerator());renderer.setBaseItemLabelsVisible(true);plot.setRenderer(renderer);// 设置柱的透明度plot.setForegroundAlpha(1.0f);// 获取HttpServletResponseHttpServletResponse response =ServletActionContext.getResponse();// 获取HttpServletRequestHttpServletRequest request =ServletActionContext.getRequest();// 解决乱码// X轴文字乱码domainAxis.setTickLabelFont(new Font("sans-serif",Font.PLAIN, 15));// X轴标题乱码domainAxis.setLabelFont(new Font("宋体", Font.PLAIN, 17));// Y轴文字乱码rangeAxis.setTickLabelFont(new Font("sans-serif",Font.PLAIN, 15));// Y轴标题乱码rangeAxis.setLabelFont(new Font("宋体", Font.PLAIN, 17));// 标题乱码Font fontTitle = new Font("宋体", Font.PLAIN, 20);TextTitle title = new TextTitle(chartTitle, fontTitle);chart.setTitle(title);// 说明乱码chart.getLegend().setItemFont(new Font("宋体", Font.PLAIN, 15));try {// 输出流声称图片//ChartUtilities.writeChartAsPNG(response.getOutputStream(),chart, 700, 500);//response.reset();// 将图片保存为pdf格式fileName= barChartToPDF(chart, request, dataset, 500, 400, chartTitle,xName, yName);request.getInputStream().close();} catch (Exception e) {e.printStackTrace();// 设置返回值fileName = null;} finally {try {} catch (Exception e) {e.printStackTrace();// 设置返回值fileName = null;}}} else {fileName = null;}return fileName;}/***饼状图**@param data*数据集*@param datadescription*数据的业务逻辑*@param chartTitle*图片标题*@param pieKeys*分饼名称*@param pieColorList*分饼颜色*@param pieChartColor*饼图颜色*@param backgroundColor*图片背景色*@return SUCCESS表示成功ERROR表示有错误产生*/public String createValidityComparePimChar(double[] data,String[] datadescription, String chartTitle, String[] pieKeys,List<Color> pieColorList, Color pieChartColor, Color backgroundColor) {// 初始化返回值String m_Result = "";verifyInputPieValue(data, datadescription, chartTitle, pieKeys);if (super.getFieldErrors().size() == 0) {// 初始化一个支持生成饼图的数据集DefaultPieDataset dataset = new DefaultPieDataset();// 判断传入的数据是否为空if (data != null && datadescription != null) {// 判断传入的List长度是否和数据名称一样长if (data.length == datadescription.length) {// 遍历List获取数据for (int i = 0; i < data.length; i++) {// 将遍历到的数据加入数据集dataset.setValue(datadescription[i], data[i]);}}}// 创建JFreeChart对象JFreeChart chart = ChartFactory.createPieChart(chartTitle, // 图片标题dataset,// 支持生成饼图的数据集true,// 是否显示图例(对于简单的柱状图必须是false)true,// 是否生成工具false);// 是否生成URL链接// 使下说明标签字体清晰,去锯齿chart.getRenderingHints().put(RenderingHints.KEY_TEXT_ANTIALIASIN G,RenderingHints.VALUE_TEXT_ANTIALIAS_OFF);chart.setTextAntiAlias(true);// 图片背景色// 判断是否有图片背景色被传入if (backgroundColor == null) {// 设置图片的默认背景色chart.setBackgroundPaint(new Color(250,240,230));} else {// 设置图片背景色味传入的Colorchart.setBackgroundPaint(backgroundColor);}// 设置图标题的字体重新设置titleFont font = new Font("隶书", Font.BOLD, 25);TextTitle title = new TextTitle(chartTitle);title.setFont(font);chart.setTitle(title);// 获取PiePlot3D对象PiePlot plot = (PiePlot) chart.getPlot();// 图片中显示百分比:默认方式// 指定饼图轮廓线的颜色plot.setBaseSectionOutlinePaint(Color.BLACK);// 设置无数据时的信息plot.setNoDataMessage("无对应的数据,请重新查询。
JFreeChart使用流程JFreeChart,开放源代码的Java图表生成组件,可以创建饼图、曲线图、柱状图、甘特图,生成PNG、JPG等图片格式文件。
一.安装配置我们以版本0.9.20为例,下载jfreechart-0 .9.20.zip解压缩文件,jfreechart-0.9.20目录下的jfreechart-0.9.20.jar和lib/jcommon-0.9.5.jar,都是开发运行需要的文件,把这三个文件放置到应用的lib目录下。
然后在web.xml文件中增加以下内容:安装配置完成,现在可以写程序生成我们需要的图表了。
二.后台画图流程以画柱状图为例,1.准备数据(a) 首先利用JFreeChart提供的DefaultCategoryDataset类创建一个数据集合对象,即:DefaultCategoryDataset dataset = new DefaultCategoryDataset();(b) 连接数据库,获取画图所需数据;(c) 通过DefaultCategoryDataset 中的addV alue()方法将数据加载进数据集合对象dataset,即dataset.addV alue(纵坐标值,每个柱的标题,横坐标值);2.创建图表对象其中ChartFactory类中有创建各种类型图表的方法,org.jfree.chart.JfreeChart类中也有三个创建图表对象的构造函数,可以根据自己的需要进行调用。
3.对图表对象进行设置通过CategoryPlot类和BarRenderer类对图表对象的一些属性进行设置,如图的背景色、柱之间的距离、图的链接、图标题的字体等。
4.生成图表文件在临时文件夹中生成图表文件,可以定制图表的高度和宽度。
filename为图表文件名,即:5.将图表文件写入PrintWriter中,其中pw为PrintWriter对象;三.前台开发在jsp页面中,调用后台画图JavaBean生成图表文件并返回图表文件名称,通过一个叫DisplayChart的servlet(即上面web.xml文件描述的那个servlet)来显示图表。
About the T utorialThis tutorial describes various ways to incorporate JFreeChart in Java-based standalone and web-based applications. The tutorial is categorized into various chapters to provide a comprehensive and easy understanding of JFreeChart programming with Java applications.AudienceThis reference has been prepared for beginners to help them understand the basic-to-advanced concepts related to JFreeChart library.PrerequisitesBefore you start practicing the examples given in the tutorial, it is expected that you have a basic understanding of Java programming with JDK1.6 or later versions, Swing, file management and database management in Java.Copyright & Disclaimer© Copyright 2017 by Tutorials Point (I) Pvt. Ltd.All the content and graphics published in this e-book are the property of Tutorials Point (I) Pvt. Ltd. The user of this e-book is prohibited to reuse, retain, copy, distribute or republish any contents or a part of the contents of this e-book in any manner without written consent of the publisher.We strive to update the contents of our website and tutorials as timely and as precisely as possibly; however, the contents may contain inaccuracies or errors. Tutorials Point (I) provides no guarantee regarding the accuracy, timeliness, or completeness of our website or its contents including this tutorial. If you discover any errors on our website or in this tutorial, please notify us at **************************T able of ContentsAbout the Tutorial (i)Audience (i)Prerequisites (i)Copyright & Disclaimer (i)Table of Contents .................................................................................................................................... i i 1.JFREECHART ─ OVERVIE W (1)What is JFreeChart? (1)Why JFreeChart? (1)2.JFREECHART ─ INSTALL ATION (2)System Requirements (2)Installing JFreeChart (2)3.JFREECHART ─ ARCHITE CTURE (6)Class Level Architecture (6)Application Level Architecture (7)4.JFREECHART ─ REFEREN CED APIS (8)ChartFactory Class (8)ChartFrame Class (9)ChartPanel Class (10)ChartUtilities Class (10)JFreeChart Class (11)PiePlot Class (12)PiePlot3D Class (12)PlotOrientation Class (13)XYPlot Class (14)XYLineAndShapeRenderer Class (15)XYItemRenderer general datasets (16)PieDataset (16)DefaultPieDataset Class (16)SeriesException Class (17)DefaultCategoryDataset (17)Series Datasets (18)XYDataset (18)XYZDataset (18)XYSeries (18)XYSeriesCollection (19)Default XYZDataset (20)Time Series in JFreeCharts (20)TimeSeriesCollection (21)Second (22)Frames in JFreeCharts (22)ApplicationFrame (23)RefineryUtilities (23)5.JFREECHART ─ PIE CHA RT (24)Business data (24)AWT Based Application (24)JPEG Image Creation (26)6.JFREECHART ─ BAR CHA RT (28)Business Data (28)AWT Based Application (28)7.JFREECHART ─ LINE CH ART (33)Business Data (33)AWT Based Application (33)JPEG Image Creation (35)8.JFREECHART ─ XY CHAR T (37)Business Data (37)AWT Based Application (38)JPEG Image Creation (40)9.JFREECHART ─ 3D PIE/BAR CHART (43)3D Pie chart (43)3D Bar Chart (45)10.JFREECHART ─ BUBBLE CHART (48)Business Data (48)AWT Based Application (48)JPEG Image Creation (51)11.JFREECHART ─ TIMESER IES CHART (54)Business Data (54)AWT Based Application (54)JPEG Image Creation (56)12.JFREECHART ─ FILE IN TERFACE (59)Business Data (59)Chart Generation Based on File (59)13.JFREECHART ─ DATABAS E INTERFACE (62)Business Data (62)Chart Generation Using Database (62)JFreeChart6A chart is a graphical representation of information. There are various tools available, which can be used to create different types of charts. The JFreeChart project was founded in February 2000, by David Gilbert. Today, it is the most widely used charting library among Java developers.This tutorial will help you understand what exactly JFreeChart is, why is it required, and the various ways to create different types of charts within a Java-based application or independently.What is JFreeChart?JfreeChart is an open source library developed in Java. It can be used within Java based applications to create a wide range of charts. By using JFreeChart, we can create all the major type of 2D and 3D charts such as pie chart, bar chart, line chart, XY chart and 3D charts. Why JFreeChart?JFreeChart is open source and 100% free, which permits usage in the commercial applications without any cost. We have enlisted here some more points in favor of why you should use JFreeChart:∙It comes with well documented APIs, which makes it quite easy to understand. ∙ It supports a wide range of chart types such as Pie Chart, Line Chart, Bar Chart, Area Chart and 3D charts.∙ JFreeChart is easy to extend and can be used in both, the client-side, as well as the server-side applications.∙ It supports multiple output formats like PNG, JPEG, PDF, SVG etc.∙It allows extensive customizations of charts. Consider a situation where you are developing an application and you need to show the data in the form of charts, and the data itself is populated dynamically. In such case, displaying the data in the form of charts using JFreeChart programming is very simple.1.JFreeChart 7JFreeChart is popular for its efficient chart creation and user-friendly installation setup. This chapter describes the process of setting up JFreeChart on Windows and Linux. User administration is needed while installing JFreeChart.System RequirementsInstalling JFreeChartTo install JFreeChart, there are three following steps viz …Step 1: Verifying Java InstallationTo verify Java installation, open the console and execute the following java command:2.Once Java installation is done properly, then you should get the following output for both the operating systems:If you do not have Java installed, then install the Java Software Development Kit (SDK) from the link:/technetwork/java/javase/downloads/index.htmlWe assume that you have installed Java 1.7.0_60 version before proceeding for this tutorial.Step 2: Setting JAVA EnvironmentSet the JAVA_HOME environment variable to point to the base directory location where Java is installed on your machine. For example,Append Java compiler location to System Path.Verify the command java -version from the command prompted as explained above.Step 3: Installing JFreeChart8Download the latest version of JFreeChart.zip from the link /jfreechart/download/. Unzip the downloaded file at any location from where required libraries can be linked into your Java program. The following image shows the structure of the directories and files:Add complete path of jfreechart-1.0.18.jar and jcommon-1.0.22.jar files to the CLASSPATH as shown below:9JFreeChart10This chapter explains basic class level and application level architectures of JFreeChart to give you an idea about how JFreeChart interacts with different classes and how it fits in your Java based application.Class Level ArchitectureThe class level architecture explains how various classes from the library interact with each other to create various types of charts.Following is the detail of the units used in the above block diagram:3.JFreeChartApplication Level ArchitectureThe application level architecture explains where JFreeChart library sits inside a Java Application.The client program receives user data and then it uses standard Java and JFreeChart APIs based on requirements to generate the output in the form of either a frame, which can be displayed directly inside the application or independently in the image formats such as JPEG or PNG.11JFreeChart12In this chapter, we will discuss about some of the important packages, classes, and methods from JFreeChart library. These packages, classes, and methods are the most frequently used while creating a variety of charts using JFreeChart library.ChartFactory ClassChartFactory is an abstract class under the org.jfree.chart package. It provides a collection of utility methods for generating standard charts. Following is a list of few of the important methods:Class ConstructorClass Methods4.ChartFrame ClassChartFrame class under the org.jfree.chart package, provides all frame related functions and utilities. ChartFrame class inherits functionalities from parent classes such as Frame, Window, Container, and Component classes.13Class ConstructorClass MethodChartPanel ClassChartPanel class from the org.jfree.chart package is used as a swing GUI component for displaying JfreeChart object.Class Constructor14Class MethodChartUtilities ClassCharUtilites class from the org.jfree.chart package provides a collection of utility methods of JFreeCharts including methods for converting charts into image file format such as PNG, JPEG, and creating HTML image maps.Class ConstructorClass Method15JFreeChart ClassJFreeChart class is the core class under the org.jfree.chart package. This class provides JFreeChart method to create bar charts, line charts, pie charts, and xy plots including time series data.Class ConstructorClass MethodPiePlot ClassThis class is a part of org.jfree.chart.plot package and extends Plot class from the same package. This class provides methods to create Pie Plots.Class Constructor16Class MethodPiePlot3D ClassPiePlot3D class is a subclass of PiePlot class under the same package. Hence, this class has the same features as PiePlot class, except it is used to create 3D plots.Class ConstructorClass Method17PlotOrientation ClassThis is a serialized class available in org.jfree.chart.plot package and it is used to show the orientation of a 2D plot. The orientation can either be vertical or horizontal. It sets the orientation of Y-axis. A conventional plot has a vertical Y- axis.Field summaryClass MethodXYPlot ClassThis is a general class available in org.jfree.chart.plot package and it is used for the plotting data in the form of (x,y) pairs. This plot can use data from any other class that implements the XYDataSet Interface. XYPlot makes use of a XYItemRenderer to draw each point on the plot.1819Class ConstructorClass MethodNumberAxis ClassThis class is available in org.jfree.chart.axispackage and it can access the numerical data of any axis. When we set the range of any axis to default, it fits according to the range of the data. But using NumberAxis, class we can set the lower margin and upper margin of domain and range axes.Class ConstructorClass MethodXYLineAndShapeRenderer ClassThis is the class, available under org.jfree.chart.renderer.xy package, which takes care of connecting data points with lines and draws shapes at each data point. This renderer class is designed for use with the XYPlot class.Class ConstructorClass Method20XYItemRenderer general datasetsThis is an interface for rendering the format of a single (x, y) item on a XYPlot. The package is org.Jfree.data.general, which has classes and interfaces to define different types of datasets to construct charts.PieDatasetThis is an interface used as a general purpose dataset, where values are associated with keys. As the name suggests, you can use this dataset to supply data for pie charts. This interface extends KeyedValues and DataSet interfaces. All the methods used for this interface are taken from KeyedValues, Values, and Dataset interfaces.DefaultPieDataset ClassThis is a Default implementation class of a PieDataset interface.Class ConstructorClass Method21SeriesException ClassThis is an exception class. It raises an exception occurred in the time series of data in the dataset. Exceptions are raised on the occurrence of duplicate or invalid data. The time series must not be applied with duplicates and the format must be valid. DefaultCategoryDatasetThis is a default implementation class of CategoryDataset interface.Class ConstructorClass Method22Refer JFreeChart API for more information on various other methods and fields.Series DatasetsThe series dataset is used by XY charts. The package is org.Jfree.data.xy, which contains classes and interfaces belonging to xy charts. The core interface is XYDataset. XYDatasetThis is an interface through which data in the form of (x,y) items can be accessed. As the name suggests, you can use this dataset to serve XY chart. Some of the methods in this interface are taken from SeriesDateset interface.XYZDatasetThis is an interface through which data in the form of (x,y,z) items can be accessed. As the name suggests, you can use this dataset to serve XYZ chart. Some of the methods in this interface are taken from SeriesDateset.XYSeriesThis is a class, which represents a sequence of zero or more data items in the form (x, y). By default, the items in the series are sorted into ascending order by x-value, and duplicate x-values are permitted. Both the sorting and duplicate defaults can be changed in the constructor. Y-values can be denoted as null to represent missing values.Class Constructor23Class MethodThe above method is used in the tutorial example. If you want to learn the remaining methods and fields, please refer JFreeChart API.XYSeriesCollectionXYSeriesCollection class has parent classes like AbstractIntervelDataset, AbstractXYDatset, AbstractSeriesDataset and AbstractDataset. Some of the methods in this class belong to parent classes of this class.Class ConstructorClass Method2425Refer JFreeChart API for the remaining methods and fields.Default XYZDatasetDefaultXYZDataset class have parent classes like AbstractIntervelDataset, AbstractXYDatset, AbstractSeriesDataset, AbstractDataset and AbstractXYZDataset. Some of the methods in this class belong to parent classes of this class.Class ConstructorClass MethodPlease refer JFreeChart API for the remaining methods and fields.Time Series in JFreeChartsThe package is org.jfree.data.time . This package contains classes and interfaces, which are used for the time related data.TimeSeriesThis class represents a sequence of data items in the form of period values, where period is some instance ofRegularTimePeriod abstract class such as Time, Day, Hour, Minute, and Second classes.Class ConstructorClass MethodRefer JFreeChart API for the remaining methods and fields.TimeSeriesCollectionThis is a class used as a collection of time series objects. This class implements the XYDataset interface, as well as it extends IntervelXYDataset interface. This makes it convenient to collect series data objects.Class ConstructorClass Method26Please refer JFreeChart API for the remaining methods and fields.SecondThis class represents a second in a particular day. This class is immutable, which is a requirement for all RegularTimePeriod subclass.Class ConstructorClass Method27Please refer JFreeChart API for the remaining methods and fields.Frames in JFreeChartsThe package is org.jfree.ui. This is the package belongs to JCommons API of JFreeChart. It contains utility classes used for creating frames for pre-configured charts. ApplicationFrameThis is a base class for creating the main frame for simple applications. The frame listens for window closing events, and responds by shutting down the JVM. This is fine for small demo applications. For enterprise applications, you need to use something more robust. The main core methods in this class are taken from Component, Container, Window, Frame, and Jframe classes.Class ConstructorThis class helps to create AWT Frames. This is the reason for why we use this class as super class in this tutorial examples.The methods, which are taken form the parent classes are used for opening a frame, closinga frame, changing the size, changing the background or foreground color, and listeners.28RefineryUtilitiesThis is a class collection of utility methods relating to user interface.Class MethodThe above method is used in the tutorial example. Refer JFreeChart API for remaining methods and fields.29JFreeChartEnd of ebook previewIf you liked what you saw…Buy it from our store @ https://30。
JFreeChart教程--入门一、JFreeChart获取。
JFreeChart是JFreeChart公司在开源网站上的一个项目,该公司的主要产品有如下:1、JFreeReport:报表解决工具2、JFreeChart:Java图形解决方案(Application/Applet/Servlet/Jsp)3、JCommon:JFreeReport和JFreeChart的公共类库4、JFreeDesigner:JFreeReport的报表设计工具我们可以从jfree官方网站上获取最新版本和相关资料(但是jfree的document需要40美金才能获取),获取地址:/jfreechart/index.html(同时可以获得简明介绍)我们以当前最新版本:jfreechart_0.9.21.zip为例子进行说明。
二、JFreeChart配置安装1、解压jfreechart_0.9.21.zip到指定位置,其中source是jfreechart的源码,jfreechart-0.9.21-demo.jar是例子程序(该部分留给大家自己去研究)2、为了配置成功,我们需要关注的文件有如下三个:jfreechart-0.9.21.jar、lib\jcommon-0.9.6.jar、lib\gnujaxp.jar3、如果是Application开发,把上述三个文件拷贝到%JAVA_HOME%\LIB中,同时在环境变量CLASSPATH中加入如果是WEB开发,以TOMCAT中的一个WEB项目TEST为例子说明:把上述三个文件拷贝到TEST\WEB-INF\LIB中,然后修改TEST\WEB-INF\web.xml 文件,在其中加入如下代码:Java代码至此jfreechart的配置就完成了,下面就可以进行jfreechart的开发了。
这里值得提出的是jfreechart的类结构设计前后兼容性不是很好,不同版本的jfreechart中类库结构可能不一样,有时候可能需要查源码。
JFreeChart 是一组功能强大、灵活易用的Java绘图API,使用它可以生成多种通用性的报表,包括柱状图、饼图、曲线图、甘特图等。
它能够用在Swing和Web等 中制作自定义的图表或报表,并且得到广泛的应用。
本文将通过引领读者学习在JFreeChart中饼图、柱状图和曲线图的进阶应用,来达到熟练使用 JFreeChart的目的。
一.下载与环境配置1. 下载JFreeChartJFreeChart是开放源代码的免费软件,但是它的支持文档需要付费才能得到。
其下载地址为:/project/showfiles.php?group_id=15494,当前最新版本为1.0.13。
笔者下载的是1.0.13最新版。
说明:1)source目录:为jfreechart的源码目录;2)lib目录:为包目录,我们需要关注的包为jfreechart-1.0.13.jar、gnujaxp.jar和jcommon-1.0.16.jar这三个包; 3)根目录下的jfreechart-1.0.13-demo.jar是例子程序,大家双击后可看到其中有很多例子的运行结果。
2. 环境配置笔者的开发环境如下:JDK:1.6MyEclipse:6.6Tomcat:6.0.18为 了后续的“用JFreeChart创建基于Web的图表”的一个例子的展示,我们在MyEclipse中创建一个名为jfreechart的Web工程。
将下载的JFreeChart1.0.6下lib目录下的jar包拷贝到WebRoot/WEB-INF/lib目录下。
另外还需要在web.xml文件 中增加如下配置:<servlet><servlet-name>DisplayChart</servlet-name><servlet-class>org.jfree.chart.servlet.DisplayChart</servlet-class></servlet><servlet-mapping><servlet-name>DisplayChart</servlet-name><url-pattern>/DisplayChart</url-pattern></servlet-mapping>二. 柱状图在WebRoot目录下建立bar目录,用来存放柱状图的各个例子。
首先在该目录下建立一个sample1.jsp文件,让我们来看一个简单的柱状图的例子,修改后的sample1.jsp的内容如下所示:<%@ page contentType="text/html;charset=GBK"%><%@ page import="org.jfree.chart.ChartFactory,org.jfree.chart.JFreeChart,org.jfree.chart.plot.PlotOrientation,org.jfree.chart.servlet.ServletUtilities,org.jfree.data.category.DefaultCategoryDataset"%><%DefaultCategoryDataset dataset = new DefaultCategoryDataset();dataset.addValue(610, "Guangzhou", "Pig");dataset.addValue(220, "Guangzhou", "Beef");dataset.addValue(530, "Guangzhou", "Chicken");dataset.addValue(340, "Guangzhou", "Fish");JFreeChart chart = ChartFactory.createBarChart3D("肉类销量统计图","type","amount",dataset,PlotOrientation.VERTICAL,false,false,false);String filename = ServletUtilities.saveChartAsPNG(chart, 500, 300, null, session);String graphURL = request.getContextPath() + "/DisplayChart?filename=" + filename;%><img src="<%= graphURL %>" width=500 height=300 border=0 usemap="#<%= filename %>">在浏览器中输入地址:http://localhost:8080/jfreechart/bar/sample1.jsp,可看到如下柱状图:上面的这个柱状图比较简单,稍显单调,在有些情况下,我们需要用不同颜色来表示不同的种类,或者在 种类上标上具体数值,亦或需要加上3D水晶效果。
下面让我们来做更深一步的探讨。
接下来让我们看一个用不同颜色来表示不通种类的例子。
在WebRoot的 bar目录下新建sample2.jsp页面,将其代码修改如下:<%@ page contentType="text/html;charset=GBK"%><%@ page import="org.jfree.chart.ChartFactory,org.jfree.chart.JFreeChart,org.jfree.chart.plot.PlotOrientation,org.jfree.chart.servlet.ServletUtilities,org.jfree.data.category.CategoryDataset,org.jfree.data.general.DatasetUtilities"%><%double[][] data = new double[][] {{1310}, {720}, {1130}, {440}};String[] rowKeys = { "pig", "beef", "chicken", "fish" };String[] columnKeys = {""};CategoryDataset dataset = DatasetUtilities.createCategoryDataset(rowKeys, columnKeys, data);JFreeChart chart = ChartFactory.createBarChart3D("广州肉类销量统计图","type","amount",dataset,PlotOrientation.VERTICAL,true,false,false);String filename = ServletUtilities.saveChartAsPNG(chart, 500, 300, null, session);String graphURL = request.getContextPath() + "/DisplayChart?filename=" + filename;%><img src="<%= graphURL %>" width=500 height=300 border=0 usemap="#<%= filename %>">该页面的运行效果如下图所示:对比该例与前例,可看出createBarChart3D的倒数第三个参数修改成了true,该参 数可用来显示下方的方框 。
上两例我们显示的只是一个城市的肉类销量,有时候我们有对比显示多个城市的不同肉类,只要将上例稍作修改即可。
例如要在图中表示广州、深圳、东莞、佛山 四个城市的四个肉类的销售情况,只需要将如下三句稍做修改:double[][] data =newdouble[][] {{1310}, {720}, {1130}, {440}};String[] rowKeys = {"pig", "beef","chicken", "fish"};String[] columnKeys = {""};例如修改成:double[][] data =newdouble[][] {{1310, 1220, 1110, 1000},{720, 700, 680, 640},{1130, 1020, 980, 800},{440, 400, 360, 300}};String[] rowKeys = {"pig", "beef","chicken", "fish"};String[] columnKeys = {"Guangzhou", "Shenzhen", "Dongguan", "Foshan"};在运行该jsp页面,可看到如下界面:在上述几例中,在某个柱子上都没有显示相应的数值,下面让我们为每个柱子都加上它的数值,我们新建一个sample4.jsp页面,其内容如下:<%@ page contentType="text/html;charset=GBK"%><%@ page import="org.jfree.chart.ChartFactory,org.jfree.chart.JFreeChart,org.jfree.chart.plot.PlotOrientation,org.jfree.chart.servlet.ServletUtilities,org.jfree.data.category.CategoryDataset,org.jfree.data.general.DatasetUtilities,org.jfree.chart.plot.*,bels.*,org.jfree.chart.renderer.category.BarRenderer3D,java.awt.*,org.jfree.ui.*,org.jfree.chart.axis.AxisLocation"%><%double[][] data = new double[][] {{1310, 1220, 1110, 1000},{720, 700, 680, 640},{1130, 1020, 980, 800},{440, 400, 360, 300}};String[] rowKeys = { "pig", "beef", "chicken", "fish" };String[] columnKeys = { "Guangzhou", "Shenzhen", "Dongguan", "Foshan" };CategoryDataset dataset = DatasetUtilities.createCategoryDataset(rowKeys, columnKeys, data); JFreeChart chart = ChartFactory.createBarChart3D("肉类销量统计图","type","amount",dataset,PlotOrientation.VERTICAL,true,true,false);CategoryPlot plot = chart.getCategoryPlot();//设置网格背景颜色plot.setBackgroundPaint(Color.white);//设置网格竖线颜色plot.setDomainGridlinePaint(Color.pink);//设置网格横线颜色plot.setRangeGridlinePaint(Color.pink);//显示每个柱的数值,并修改该数值的字体属性BarRenderer3D renderer = new BarRenderer3D();renderer.setBaseItemLabelGenerator(new StandardCategoryItemLabelGenerator());renderer.setBaseItemLabelsVisible(true);//默认的数字显示在柱子中,通过如下两句可调整数字的显示//注意:此句很关键,若无此句,那数字的显示会被覆盖,给人数字没有显示出来的问题renderer.setBasePositiveItemLabelPosition(new ItemLabelPosition(ItemLabelAnchor.OUTSIDE12, TextAnchor.BASELINE_LEFT));renderer.setItemLabelAnchorOffset(10D);//设置每个地区所包含的平行柱的之间距离//renderer.setItemMargin(0.3);plot.setRenderer(renderer);//设置地区、销量的显示位置//将下方的“肉类”放到上方plot.setDomainAxisLocation(AxisLocation.TOP_OR_RIGHT);//将默认放在左边的“销量”放到右方plot.setRangeAxisLocation(AxisLocation.BOTTOM_OR_RIGHT);String filename = ServletUtilities.saveChartAsPNG(chart, 700, 400, null, session);String graphURL = request.getContextPath() + "/DisplayChart?filename=" + filename; %><img src="<%= graphURL %>" width=700 height=400 border=0 usemap="#<%= filename %>">运行效果如下所示:注意:jfreechart的很多版本不兼容,请大家在运行此例时确认下载了对应的版本。