
Frequency estimates for statistical word similarity measures
- 格式:pdf
- 大小:1.00 MB
- 文档页数:8


SCI论文摘要中常用的表达方法要写好摘要,需要建立一个适合自己需要的句型库(选择的词汇来源于SCI高被引用论文)引言部分(1)回顾研究背景,常用词汇有review, summarize, present, outline, describe等(2)说明写作目的,常用词汇有purpose, attempt, aim等,另外还可以用动词不定式充当目的壮语老表达(3)介绍论文的重点内容或研究范围,常用词汇有study, present, include, focus, emphasize, emphasis, attention等方法部分(1)介绍研究或试验过程,常用词汇有test study, investigate, examine,experiment, discuss, consider, analyze, analysis等(2)说明研究或试验方法,常用词汇有measure, estimate, calculate等(3)介绍应用、用途,常用词汇有use, apply, application等结果部分(1)展示研究结果,常用词汇有show, result, present等(2)介绍结论,常用词汇有summary, introduce,conclude等讨论部分(1)陈述论文的论点和作者的观点,常用词汇有suggest, repot, present, expect, describe 等(2)说明论证,常用词汇有support, provide, indicate, identify, find, demonstrate, confirm, clarify等(3)推荐和建议,常用词汇有suggest,suggestion, recommend, recommendation, propose,necessity,necessary,expect等。
摘要引言部分案例词汇review•Author(s): ROBINSON, TE; BERRIDGE, KC•Title:THE NEURAL BASIS OF DRUG CRA VING - AN INCENTIVE-SENSITIZATION THEORY OF ADDICTION•Source: BRAIN RESEARCH REVIEWS, 18 (3): 247-291 SEP-DEC 1993 《脑研究评论》荷兰SCI被引用1774We review evidence for this view of addiction and discuss its implications for understanding the psychology and neurobiology of addiction.回顾研究背景SCI高被引摘要引言部分案例词汇summarizeAuthor(s): Barnett, RM; Carone, CD; 被引用1571Title: Particles and field .1. Review of particle physicsSource: PHYSICAL REVIEW D, 54 (1): 1-+ Part 1 JUL 1 1996:《物理学评论,D辑》美国引言部分回顾研究背景常用词汇summarizeAbstract: This biennial review summarizes much of Particle Physics. Using data from previous editions, plus 1900 new measurements from 700 papers, we list, evaluate, and average measuredproperties of gauge bosons, leptons, quarks, mesons, and baryons. We also summarize searches for hypothetical particles such as Higgs bosons, heavy neutrinos, and supersymmetric particles. All the particle properties and search limits are listed in Summary Tables. We also give numerous tables, figures, formulae, and reviews of topics such as the Standard Model, particle detectors, probability, and statistics. A booklet is available containing the Summary Tables and abbreviated versions of some of the other sections of this full Review.SCI摘要引言部分案例attentionSCI摘要方法部分案例considerSCI高被引摘要引言部分案例词汇outline•Author(s): TIERNEY, L SCI引用728次•Title:MARKOV-CHAINS FOR EXPLORING POSTERIOR DISTRIBUTIONS 引言部分回顾研究背景,常用词汇outline•Source: ANNALS OF STATISTICS, 22 (4): 1701-1728 DEC 1994•《统计学纪事》美国•Abstract: Several Markov chain methods are available for sampling from a posterior distribution. Two important examples are the Gibbs sampler and the Metropolis algorithm.In addition, several strategies are available for constructing hybrid algorithms. This paper outlines some of the basic methods and strategies and discusses some related theoretical and practical issues. On the theoretical side, results from the theory of general state space Markov chains can be used to obtain convergence rates, laws of large numbers and central limit theorems for estimates obtained from Markov chain methods. These theoretical results can be used to guide the construction of more efficient algorithms. For the practical use of Markov chain methods, standard simulation methodology provides several Variance reduction techniques and also gives guidance on the choice of sample size and allocation.SCI高被引摘要引言部分案例回顾研究背景presentAuthor(s): L YNCH, M; MILLIGAN, BG SC I被引用661Title: ANAL YSIS OF POPULATION GENETIC-STRUCTURE WITH RAPD MARKERS Source: MOLECULAR ECOLOGY, 3 (2): 91-99 APR 1994《分子生态学》英国Abstract: Recent advances in the application of the polymerase chain reaction make it possible to score individuals at a large number of loci. The RAPD (random amplified polymorphic DNA) method is one such technique that has attracted widespread interest.The analysis of population structure with RAPD data is hampered by the lack of complete genotypic information resulting from dominance, since this enhances the sampling variance associated with single loci as well as induces bias in parameter estimation. We present estimators for several population-genetic parameters (gene and genotype frequencies, within- and between-population heterozygosities, degree of inbreeding and population subdivision, and degree of individual relatedness) along with expressions for their sampling variances. Although completely unbiased estimators do not appear to be possible with RAPDs, several steps are suggested that will insure that the bias in parameter estimates is negligible. To achieve the same degree of statistical power, on the order of 2 to 10 times more individuals need to be sampled per locus when dominant markers are relied upon, as compared to codominant (RFLP, isozyme) markers. Moreover, to avoid bias in parameter estimation, the marker alleles for most of these loci should be in relatively low frequency. Due to the need for pruning loci with low-frequency null alleles, more loci also need to be sampled with RAPDs than with more conventional markers, and sole problems of bias cannot be completely eliminated.SCI高被引摘要引言部分案例词汇describe•Author(s): CLONINGER, CR; SVRAKIC, DM; PRZYBECK, TR•Title: A PSYCHOBIOLOGICAL MODEL OF TEMPERAMENT AND CHARACTER•Source: ARCHIVES OF GENERAL PSYCHIATRY, 50 (12): 975-990 DEC 1993《普通精神病学纪要》美国•引言部分回顾研究背景,常用词汇describe 被引用926•Abstract: In this study, we describe a psychobiological model of the structure and development of personality that accounts for dimensions of both temperament and character. Previous research has confirmed four dimensions of temperament: novelty seeking, harm avoidance, reward dependence, and persistence, which are independently heritable, manifest early in life, and involve preconceptual biases in perceptual memory and habit formation. For the first time, we describe three dimensions of character that mature in adulthood and influence personal and social effectiveness by insight learning about self-concepts.Self-concepts vary according to the extent to which a person identifies the self as (1) an autonomous individual, (2) an integral part of humanity, and (3) an integral part of the universe as a whole. Each aspect of self-concept corresponds to one of three character dimensions called self-directedness, cooperativeness, and self-transcendence, respectively. We also describe the conceptual background and development of a self-report measure of these dimensions, the Temperament and Character Inventory. Data on 300 individuals from the general population support the reliability and structure of these seven personality dimensions. We discuss the implications for studies of information processing, inheritance, development, diagnosis, and treatment.摘要引言部分案例•(2)说明写作目的,常用词汇有purpose, attempt, aimSCI高被引摘要引言部分案例attempt说明写作目的•Author(s): Donoho, DL; Johnstone, IM•Title: Adapting to unknown smoothness via wavelet shrinkage•Source: JOURNAL OF THE AMERICAN STATISTICAL ASSOCIATION, 90 (432): 1200-1224 DEC 1995 《美国统计学会志》被引用429次•Abstract: We attempt to recover a function of unknown smoothness from noisy sampled data. We introduce a procedure, SureShrink, that suppresses noise by thresholding the empirical wavelet coefficients. The thresholding is adaptive: A threshold level is assigned to each dyadic resolution level by the principle of minimizing the Stein unbiased estimate of risk (Sure) for threshold estimates. The computational effort of the overall procedure is order N.log(N) as a function of the sample size N. SureShrink is smoothness adaptive: If the unknown function contains jumps, then the reconstruction (essentially) does also; if the unknown function has a smooth piece, then the reconstruction is (essentially) as smooth as the mother wavelet will allow. The procedure is in a sense optimally smoothness adaptive: It is near minimax simultaneously over a whole interval of the Besov scale; the size of this interval depends on the choice of mother wavelet. We know from a previous paper by the authors that traditional smoothing methods-kernels, splines, and orthogonal series estimates-even with optimal choices of the smoothing parameter, would be unable to perform in a near-minimax way over many spaces in the Besov scale.Examples of SureShrink are given. The advantages of the method are particularly evident when the underlying function has jump discontinuities on a smooth backgroundSCI高被引摘要引言部分案例To investigate说明写作目的•Author(s): OLTV AI, ZN; MILLIMAN, CL; KORSMEYER, SJ•Title: BCL-2 HETERODIMERIZES IN-VIVO WITH A CONSERVED HOMOLOG, BAX, THAT ACCELERATES PROGRAMMED CELL-DEATH•Source: CELL, 74 (4): 609-619 AUG 27 1993 被引用3233•Abstract: Bcl-2 protein is able to repress a number of apoptotic death programs. To investigate the mechanism of Bcl-2's effect, we examined whether Bcl-2 interacted with other proteins. We identified an associated 21 kd protein partner, Bax, that has extensive amino acid homology with Bcl-2, focused within highly conserved domains I and II. Bax is encoded by six exons and demonstrates a complex pattern of alternative RNA splicing that predicts a 21 kd membrane (alpha) and two forms of cytosolic protein (beta and gamma). Bax homodimerizes and forms heterodimers with Bcl-2 in vivo. Overexpressed Bax accelerates apoptotic death induced by cytokine deprivation in an IL-3-dependent cell line. Overexpressed Bax also counters the death repressor activity of Bcl-2. These data suggest a model in which the ratio of Bcl-2 to Bax determines survival or death following an apoptotic stimulus.SCI高被引摘要引言部分案例purposes说明写作目的•Author(s): ROGERS, FJ; IGLESIAS, CA•Title: RADIATIVE ATOMIC ROSSELAND MEAN OPACITY TABLES•Source: ASTROPHYSICAL JOURNAL SUPPLEMENT SERIES, 79 (2): 507-568 APR 1992 《天体物理学杂志增刊》美国SCI被引用512•Abstract: For more than two decades the astrophysics community has depended on opacity tables produced at Los Alamos. In the present work we offer new radiative Rosseland mean opacity tables calculated with the OPAL code developed independently at LLNL. We give extensive results for the recent Anders-Grevesse mixture which allow accurate interpolation in temperature, density, hydrogen mass fraction, as well as metal mass fraction. The tables are organized differently from previous work. Instead of rows and columns of constant temperature and density, we use temperature and follow tracks of constant R, where R = density/(temperature)3. The range of R and temperature are such as to cover typical stellar conditions from the interior through the envelope and the hotter atmospheres. Cool atmospheres are not considered since photoabsorption by molecules is neglected. Only radiative processes are taken into account so that electron conduction is not included. For comparison purposes we present some opacity tables for the Ross-Aller and Cox-Tabor metal abundances. Although in many regions the OPAL opacities are similar to previous work, large differences are reported.For example, factors of 2-3 opacity enhancements are found in stellar envelop conditions.SCI高被引摘要引言部分案例aim说明写作目的•Author(s):EDV ARDSSON, B; ANDERSEN, J; GUSTAFSSON, B; LAMBERT, DL;NISSEN, PE; TOMKIN, J•Title:THE CHEMICAL EVOLUTION OF THE GALACTIC DISK .1. ANALYSISAND RESULTS•Source: ASTRONOMY AND ASTROPHYSICS, 275 (1): 101-152 AUG 1993 《天文学与天体物理学》被引用934•Abstract:With the aim to provide observational constraints on the evolution of the galactic disk, we have derived abundances of 0, Na, Mg, Al, Si, Ca, Ti, Fe, Ni, Y, Zr, Ba and Nd, as well as individual photometric ages, for 189 nearby field F and G disk dwarfs.The galactic orbital properties of all stars have been derived from accurate kinematic data, enabling estimates to be made of the distances from the galactic center of the stars‘ birthplaces. 结构式摘要•Our extensive high resolution, high S/N, spectroscopic observations of carefully selected northern and southern stars provide accurate equivalent widths of up to 86 unblended absorption lines per star between 5000 and 9000 angstrom. The abundance analysis was made with greatly improved theoretical LTE model atmospheres. Through the inclusion of a great number of iron-peak element absorption lines the model fluxes reproduce the observed UV and visual fluxes with good accuracy. A new theoretical calibration of T(eff) as a function of Stromgren b - y for solar-type dwarfs has been established. The new models and T(eff) scale are shown to yield good agreement between photometric and spectroscopic measurements of effective temperatures and surface gravities, but the photometrically derived very high overall metallicities for the most metal rich stars are not supported by the spectroscopic analysis of weak spectral lines.•Author(s): PAYNE, MC; TETER, MP; ALLAN, DC; ARIAS, TA; JOANNOPOULOS, JD•Title:ITERA TIVE MINIMIZATION TECHNIQUES FOR ABINITIO TOTAL-ENERGY CALCULATIONS - MOLECULAR-DYNAMICS AND CONJUGA TE GRADIENTS•Source: REVIEWS OF MODERN PHYSICS, 64 (4): 1045-1097 OCT 1992 《现代物理学评论》美国American Physical Society SCI被引用2654 •Abstract: This article describes recent technical developments that have made the total-energy pseudopotential the most powerful ab initio quantum-mechanical modeling method presently available. In addition to presenting technical details of the pseudopotential method, the article aims to heighten awareness of the capabilities of the method in order to stimulate its application to as wide a range of problems in as many scientific disciplines as possible.SCI高被引摘要引言部分案例includes介绍论文的重点内容或研究范围•Author(s):MARCHESINI, G; WEBBER, BR; ABBIENDI, G; KNOWLES, IG;SEYMOUR, MH; STANCO, L•Title: HERWIG 5.1 - A MONTE-CARLO EVENT GENERA TOR FOR SIMULATING HADRON EMISSION REACTIONS WITH INTERFERING GLUONS SCI被引用955次•Source: COMPUTER PHYSICS COMMUNICATIONS, 67 (3): 465-508 JAN 1992:《计算机物理学通讯》荷兰Elsevier•Abstract: HERWIG is a general-purpose particle-physics event generator, which includes the simulation of hard lepton-lepton, lepton-hadron and hadron-hadron scattering and soft hadron-hadron collisions in one package. It uses the parton-shower approach for initial-state and final-state QCD radiation, including colour coherence effects and azimuthal correlations both within and between jets. This article includes a brief review of the physics underlying HERWIG, followed by a description of the program itself. This includes details of the input and control parameters used by the program, and the output data provided by it. Sample output from a typical simulation is given and annotated.SCI高被引摘要引言部分案例presents介绍论文的重点内容或研究范围•Author(s): IDSO, KE; IDSO, SB•Title: PLANT-RESPONSES TO ATMOSPHERIC CO2 ENRICHMENT IN THE FACE OF ENVIRONMENTAL CONSTRAINTS - A REVIEW OF THE PAST 10 YEARS RESEARCH•Source: AGRICULTURAL AND FOREST METEOROLOGY, 69 (3-4): 153-203 JUL 1994 《农业和林业气象学》荷兰Elsevier 被引用225•Abstract:This paper presents a detailed analysis of several hundred plant carbon exchange rate (CER) and dry weight (DW) responses to atmospheric CO2 enrichment determined over the past 10 years. It demonstrates that the percentage increase in plant growth produced by raising the air's CO2 content is generally not reduced by less than optimal levels of light, water or soil nutrients, nor by high temperatures, salinity or gaseous air pollution. More often than not, in fact, the data show the relative growth-enhancing effects of atmospheric CO2 enrichment to be greatest when resource limitations and environmental stresses are most severe.SCI高被引摘要引言部分案例介绍论文的重点内容或研究范围emphasizing •Author(s): BESAG, J; GREEN, P; HIGDON, D; MENGERSEN, K•Title: BAYESIAN COMPUTATION AND STOCHASTIC-SYSTEMS•Source: STATISTICAL SCIENCE, 10 (1): 3-41 FEB 1995《统计科学》美国•SCI被引用296次•Abstract: Markov chain Monte Carlo (MCMC) methods have been used extensively in statistical physics over the last 40 years, in spatial statistics for the past 20 and in Bayesian image analysis over the last decade. In the last five years, MCMC has been introduced into significance testing, general Bayesian inference and maximum likelihood estimation. This paper presents basic methodology of MCMC, emphasizing the Bayesian paradigm, conditional probability and the intimate relationship with Markov random fields in spatial statistics.Hastings algorithms are discussed, including Gibbs, Metropolis and some other variations. Pairwise difference priors are described and are used subsequently in three Bayesian applications, in each of which there is a pronounced spatial or temporal aspect to the modeling. The examples involve logistic regression in the presence of unobserved covariates and ordinal factors; the analysis of agricultural field experiments, with adjustment for fertility gradients; and processing oflow-resolution medical images obtained by a gamma camera. Additional methodological issues arise in each of these applications and in the Appendices. The paper lays particular emphasis on the calculation of posterior probabilities and concurs with others in its view that MCMC facilitates a fundamental breakthrough in applied Bayesian modeling.SCI高被引摘要引言部分案例介绍论文的重点内容或研究范围focuses •Author(s): HUNT, KJ; SBARBARO, D; ZBIKOWSKI, R; GAWTHROP, PJ•Title: NEURAL NETWORKS FOR CONTROL-SYSTEMS - A SURVEY•Source: AUTOMA TICA, 28 (6): 1083-1112 NOV 1992《自动学》荷兰Elsevier•SCI被引用427次•Abstract:This paper focuses on the promise of artificial neural networks in the realm of modelling, identification and control of nonlinear systems. The basic ideas and techniques of artificial neural networks are presented in language and notation familiar to control engineers. Applications of a variety of neural network architectures in control are surveyed. We explore the links between the fields of control science and neural networks in a unified presentation and identify key areas for future research.SCI高被引摘要引言部分案例介绍论文的重点内容或研究范围focus•Author(s): Stuiver, M; Reimer, PJ; Bard, E; Beck, JW;•Title: INTCAL98 radiocarbon age calibration, 24,000-0 cal BP•Source: RADIOCARBON, 40 (3): 1041-1083 1998《放射性碳》美国SCI被引用2131次•Abstract: The focus of this paper is the conversion of radiocarbon ages to calibrated (cal) ages for the interval 24,000-0 cal BP (Before Present, 0 cal BP = AD 1950), based upon a sample set of dendrochronologically dated tree rings, uranium-thorium dated corals, and varve-counted marine sediment. The C-14 age-cal age information, produced by many laboratories, is converted to Delta(14)C profiles and calibration curves, for the atmosphere as well as the oceans. We discuss offsets in measured C-14 ages and the errors therein, regional C-14 age differences, tree-coral C-14 age comparisons and the time dependence of marine reservoir ages, and evaluate decadal vs. single-year C-14 results. Changes in oceanic deepwater circulation, especially for the 16,000-11,000 cal sp interval, are reflected in the Delta(14)C values of INTCAL98.SCI高被引摘要引言部分案例介绍论文的重点内容或研究范围emphasis •Author(s): LEBRETON, JD; BURNHAM, KP; CLOBERT, J; ANDERSON, DR•Title: MODELING SURVIV AL AND TESTING BIOLOGICAL HYPOTHESES USING MARKED ANIMALS - A UNIFIED APPROACH WITH CASE-STUDIES •Source: ECOLOGICAL MONOGRAPHS, 62 (1): 67-118 MAR 1992•《生态学论丛》美国•Abstract: The understanding of the dynamics of animal populations and of related ecological and evolutionary issues frequently depends on a direct analysis of life history parameters. For instance, examination of trade-offs between reproduction and survival usually rely on individually marked animals, for which the exact time of death is most often unknown, because marked individuals cannot be followed closely through time.Thus, the quantitative analysis of survival studies and experiments must be based oncapture-recapture (or resighting) models which consider, besides the parameters of primary interest, recapture or resighting rates that are nuisance parameters. 结构式摘要•T his paper synthesizes, using a common framework, these recent developments together with new ones, with an emphasis on flexibility in modeling, model selection, and the analysis of multiple data sets. The effects on survival and capture rates of time, age, and categorical variables characterizing the individuals (e.g., sex) can be considered, as well as interactions between such effects. This "analysis of variance" philosophy emphasizes the structure of the survival and capture process rather than the technical characteristics of any particular model. The flexible array of models encompassed in this synthesis uses a common notation. As a result of the great level of flexibility and relevance achieved, the focus is changed from fitting a particular model to model building and model selection.SCI摘要方法部分案例•方法部分•(1)介绍研究或试验过程,常用词汇有test,study, investigate, examine,experiment, discuss, consider, analyze, analysis等•(2)说明研究或试验方法,常用词汇有measure, estimate, calculate等•(3)介绍应用、用途,常用词汇有use, apply, application等SCI高被引摘要方法部分案例discusses介绍研究或试验过程•Author(s): LIANG, KY; ZEGER, SL; QAQISH, B•Title: MULTIV ARIATE REGRESSION-ANAL YSES FOR CATEGORICAL-DATA •Source:JOURNAL OF THE ROY AL STA TISTICAL SOCIETY SERIES B-METHODOLOGICAL, 54 (1): 3-40 1992《皇家统计学会志,B辑:统计方法论》•SCI被引用298•Abstract: It is common to observe a vector of discrete and/or continuous responses in scientific problems where the objective is to characterize the dependence of each response on explanatory variables and to account for the association between the outcomes. The response vector can comprise repeated observations on one variable, as in longitudinal studies or genetic studies of families, or can include observations for different variables.This paper discusses a class of models for the marginal expectations of each response and for pairwise associations. The marginal models are contrasted with log-linear models.Two generalized estimating equation approaches are compared for parameter estimation.The first focuses on the regression parameters; the second simultaneously estimates the regression and association parameters. The robustness and efficiency of each is discussed.The methods are illustrated with analyses of two data sets from public health research SCI高被引摘要方法部分案例介绍研究或试验过程examines•Author(s): Huo, QS; Margolese, DI; Stucky, GD•Title: Surfactant control of phases in the synthesis of mesoporous silica-based materials •Source: CHEMISTRY OF MATERIALS, 8 (5): 1147-1160 MAY 1996•SCI被引用643次《材料的化学性质》美国•Abstract: The low-temperature formation of liquid-crystal-like arrays made up of molecular complexes formed between molecular inorganic species and amphiphilic organic molecules is a convenient approach for the synthesis of mesostructure materials.This paper examines how the molecular shapes of covalent organosilanes, quaternary ammonium surfactants, and mixed surfactants in various reaction conditions can be used to synthesize silica-based mesophase configurations, MCM-41 (2d hexagonal, p6m), MCM-48 (cubic Ia3d), MCM-50 (lamellar), SBA-1 (cubic Pm3n), SBA-2 (3d hexagonal P6(3)/mmc), and SBA-3(hexagonal p6m from acidic synthesis media). The structural function of surfactants in mesophase formation can to a first approximation be related to that of classical surfactants in water or other solvents with parallel roles for organic additives. The effective surfactant ion pair packing parameter, g = V/alpha(0)l, remains a useful molecular structure-directing index to characterize the geometry of the mesophase products, and phase transitions may be viewed as a variation of g in the liquid-crystal-Like solid phase. Solvent and cosolvent structure direction can be effectively used by varying polarity, hydrophobic/hydrophilic properties and functionalizing the surfactant molecule, for example with hydroxy group or variable charge. Surfactants and synthesis conditions can be chosen and controlled to obtain predicted silica-based mesophase products. A room-temperature synthesis of the bicontinuous cubic phase, MCM-48, is presented. A low-temperature (100 degrees C) and low-pH (7-10) treatment approach that can be used to give MCM-41 with high-quality, large pores (up to 60 Angstrom), and pore volumes as large as 1.6 cm(3)/g is described.Estimates 介绍研究或试验过程SCI高被引摘要方法部分案例•Author(s): KESSLER, RC; MCGONAGLE, KA; ZHAO, SY; NELSON, CB; HUGHES, M; ESHLEMAN, S; WITTCHEN, HU; KENDLER, KS•Title:LIFETIME AND 12-MONTH PREV ALENCE OF DSM-III-R PSYCHIATRIC-DISORDERS IN THE UNITED-STA TES - RESULTS FROM THE NATIONAL-COMORBIDITY-SURVEY•Source: ARCHIVES OF GENERAL PSYCHIATRY, 51 (1): 8-19 JAN 1994•《普通精神病学纪要》美国SCI被引用4350次•Abstract: Background: This study presents estimates of lifetime and 12-month prevalence of 14 DSM-III-R psychiatric disorders from the National Comorbidity Survey, the first survey to administer a structured psychiatric interview to a national probability sample in the United States.Methods: The DSM-III-R psychiatric disorders among persons aged 15 to 54 years in the noninstitutionalized civilian population of the United States were assessed with data collected by lay interviewers using a revised version of the Composite International Diagnostic Interview. Results: Nearly 50% of respondents reported at least one lifetime disorder, and close to 30% reported at least one 12-month disorder. The most common disorders were major depressive episode, alcohol dependence, social phobia, and simple phobia. More than half of all lifetime disorders occurred in the 14% of the population who had a history of three or more comorbid disorders. These highly comorbid people also included the vast majority of people with severe disorders.Less than 40% of those with a lifetime disorder had ever received professional treatment,and less than 20% of those with a recent disorder had been in treatment during the past 12 months. Consistent with previous risk factor research, it was found that women had elevated rates of affective disorders and anxiety disorders, that men had elevated rates of substance use disorders and antisocial personality disorder, and that most disorders declined with age and with higher socioeconomic status. Conclusions: The prevalence of psychiatric disorders is greater than previously thought to be the case. Furthermore, this morbidity is more highly concentrated than previously recognized in roughly one sixth of the population who have a history of three or more comorbid disorders. This suggests that the causes and consequences of high comorbidity should be the focus of research attention. The majority of people with psychiatric disorders fail to obtain professional treatment. Even among people with a lifetime history of three or more comorbid disorders, the proportion who ever obtain specialty sector mental health treatment is less than 50%.These results argue for the importance of more outreach and more research on barriers to professional help-seekingSCI高被引摘要方法部分案例说明研究或试验方法measure•Author(s): Schlegel, DJ; Finkbeiner, DP; Davis, M•Title:Maps of dust infrared emission for use in estimation of reddening and cosmic microwave background radiation foregrounds•Source: ASTROPHYSICAL JOURNAL, 500 (2): 525-553 Part 1 JUN 20 1998 SCI 被引用2972 次《天体物理学杂志》美国•The primary use of these maps is likely to be as a new estimator of Galactic extinction. To calibrate our maps, we assume a standard reddening law and use the colors of elliptical galaxies to measure the reddening per unit flux density of 100 mu m emission. We find consistent calibration using the B-R color distribution of a sample of the 106 brightest cluster ellipticals, as well as a sample of 384 ellipticals with B-V and Mg line strength measurements. For the latter sample, we use the correlation of intrinsic B-V versus Mg, index to tighten the power of the test greatly. We demonstrate that the new maps are twice as accurate as the older Burstein-Heiles reddening estimates in regions of low and moderate reddening. The maps are expected to be significantly more accurate in regions of high reddening. These dust maps will also be useful for estimating millimeter emission that contaminates cosmic microwave background radiation experiments and for estimating soft X-ray absorption. We describe how to access our maps readily for general use.SCI高被引摘要结果部分案例application介绍应用、用途•Author(s): MALLAT, S; ZHONG, S•Title: CHARACTERIZATION OF SIGNALS FROM MULTISCALE EDGES•Source: IEEE TRANSACTIONS ON PATTERN ANALYSIS AND MACHINE INTELLIGENCE, 14 (7): 710-732 JUL 1992•SCI被引用508次《IEEE模式分析与机器智能汇刊》美国•Abstract: A multiscale Canny edge detection is equivalent to finding the local maxima ofa wavelet transform. We study the properties of multiscale edges through the wavelet。
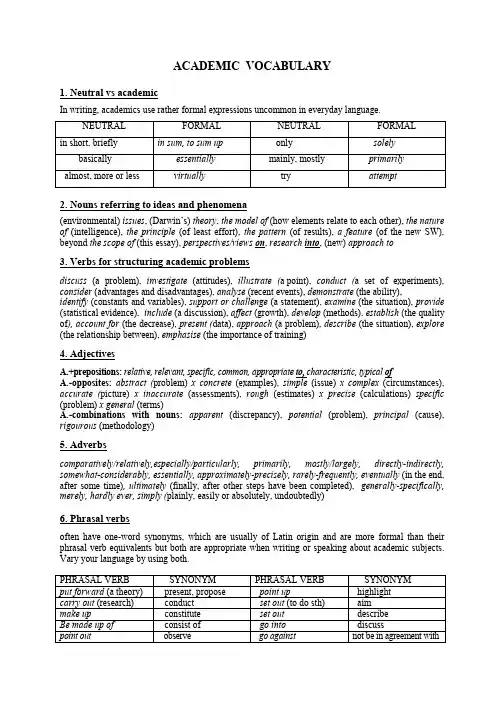
ACADEMIC VOCABULARY1. Neutral vs academicIn writing, academics use rather formal expressions uncommon in everyday language.NEUTRAL FORMAL NEUTRAL FORMALin short, briefly in sum, to sum up only solelybasically essentially mainly, mostly primarilyalmost, more or less virtually try attempt2. Nouns referring to ideas and phenomena(environmental) issues, (Darwin’s) theory, the model of (how elements relate to each other), the nature of(intelligence), the principle(of least effort), the pattern(of results), a feature(of the new SW), beyond the scope of (this essay), perspectives/views on, research into, (new) approach to3. Verbs for structuring academic problemsdiscuss (a problem), investigate (attitudes), illustrate (a point), conduct (a set of experiments), consider (advantages and disadvantages), analyse (recent events), demonstrate (the ability),identify (constants and variables), support or challenge (a statement), examine (the situation), provide (statistical evidence), include (a discussion), affect (growth), develop (methods), establish (the quality of), account for (the decrease), present (data), approach (a problem), describe (the situation), explore (the relationship between), emphasise (the importance of training)4. AdjectivesA.+prepositions: relative, relevant, specific, common, appropriate to, characteristic, typical ofA.-opposites:abstract (problem) x concrete (examples), simple (issue) x complex (circumstances), accurate (picture) x inaccurate (assessments), rough (estimates) x precise (calculations) specific (problem) x general (terms)A.-combinations with nouns:apparent (discrepancy), potential (problem), principal (cause), rigourous (methodology)5. Adverbscomparatively/relatively,especially/particularly, primarily, mostly/largely, directly-indirectly, somewhat-considerably, essentially, approximately-precisely, rarely-frequently, eventually (in the end, after some time), ultimately (finally, after other steps have been completed), generally-specifically, merely, hardly ever, simply (plainly, easily or absolutely, undoubtedly)6. Phrasal verbsoften have one-word synonyms, which are usually of Latin origin and are more formal than their phrasal verb equivalents but both are appropriate when writing or speaking about academic subjects. Vary your language by using both.PHRASAL VERB SYNONYM PHRASAL VERB SYNONYMput forward (a theory) present, propose point up highlightcarry out (research) conduct set out (to do sth) aimmake up constitute set out describeBe made up of consist of go into discusspoint out observe go against not be in agreement with7. Nouns and the words they combine withN. + adjectivescontact – useful, valuable, personal, constant, close, frequent, intermittentdebate – considerable, heated, intense, public, animatedelements – crucial, decisive, fundamental, conflicting, constituentphenomenon – common, isolated, natural, recent, universalresults – conflicting, in/conclusive, unforeseen, preliminary, encouragingrole – decisive, challenging, influential, key, majorsample – random, representativein... terms – absolute, relative, general, practicalway – alternative, efficient, practical, convenient, proper, acceptableN. + verbscontact – come into c. with, establish, maintain, break off, losedebate – engage in, contribute to, d. surrounding an issueelements – combine, differentiate, discern,phenomena – observe, investigate, explainresults – collect, question, invalidate, falsify, publishrole – define, strenghten, play, take onsample – take, provide, analyseway – discover, devise, work out, develop8. Adjectives + nounsAdjectives of importance + nounsimportant – aspect, contribution, difference, implications, point, question, reason, element significant – increase, reduction, number, proportionmajor/minor - role, changes, problem, factor, issue, concern, difference, theme, contribution, pointenormous/considerable – amount, expansion, number, range, diversity, differnece, variation, extent, degree, impact, power, influence, significance, interestparticular – interest, attention, significance, importance, concernAdjectives of frequency + nounsWidespread – belief, acceptance, support, opposition, assumption, use.Common (frequent) – experience, practice, use, concern(shared) – knowledge, ground, feature, interestSpecific – context, information, case, type, form, purpose, characteristics, conditions, example. Other adjective + noun combinationsInevitable combines with words relating to results or changes – consequence, outcome, collapse, decline, conflict, effect, developmentsExplicit combines with words relating to how things are presented – reference, statements, comparison, account, mentionRelevant combines with words relating to evidence – data, documents, information, details, factors 9. Verbs + nouns + adverbsVerb Noun Adverbsto be based on research, theory, story,mainly, partly, looselyhypothesisto associate with word, idea, theorem, term generally,commonly, invariablyto discuss idea, problem, issue, question,at length, briefly, thoroughlytopic, themeto establish relationship, connection firmly, clearly, conclusivelyto examine facts, evidence, effects, aspects briefly, critically, thoroughlyclearly, convincinglyto demostrate existence, need, effects,importanceclearly, correctly, closelyto identify causes, factors, issues,properties, needs, approach,origin10. Prepositional phrasesIN conjuction, in comparison, in line with; in general, in particular; in addition to, in spite of, in terms of; in some ways, in turn, in most respects;ON the whole, on the one hand ... on the other hand; on the basis of, on behalf ofw ith the exception of; as a result (of), at this point/stage; for the most part11. Verbs + prepositionsto draw, comment, concentrate, focus, rely/rest onto be exposed, attributed, traced, to amount, attend (deal with, give one’s attention) toto associate, provide, couple, equip withto depart, benefit, exclude fromto write, speak of (rather formal), convince, dispose ofto account search, call argue for12. Nouns + prepositionsbook, article, essay, lecture, project, assignment about, onresearch, investigation, insight, inquiry intoanalysis, examination, exploration, study, issue ofproblem, difficulty of, withreason, motivation, rationale forlook, attempt atchanges, differences, increase, decrease ininfluence, emphasis, effect onbasis, idea, lack, means ofreason, need, basis, case, preference forrelation, approach, response, attention toattitude, tendency, move, progress to/towardsprinciple, assumptions, rationale, logic behindrelationship, difference, distinction between13. Referring to source materialsThe… literature suggests that, the … draws its data from/draws primarily on, several secondary sources were also consulted, … proved a valuable resource, I also surveyed the literature on, I directly/indirectly cite those works which, an extensive body of literature exists on, as noted, is often attributed to, …. Is dealt with in, … is treated separately from the main body of…14. Degrees of certaintyBeing tentativeThere is some evidence that…, it can be argued that…, it may not be the case that…, it would seem/appear that…, we can presume that…, there seems/appears to be some evidence that…, we can draw the tentative conclusion that…It is true or almost trueIt is undoubtedly true that…, it is, of course…, it is evident that…, the research will probably lead to…, there is a tendency for…, there is every likelihood that…The writer is unsure… has allegedly come to some…conclusions, … is reportedly…15. Criticism of/ reference to an author… asserts/claims/believes that, in his/her view, … touches on, … calls for,… underestimates/overestimates, ignores, … is not persuasive, … does not ring true, worse, the evidence is … at best16. Organizing your writingWorking through a list of different things – firstly, secondly, thirdly, next, lastly/finally Changing topic/bringing in new points / we now/ let us (now) turn toReferring forward – below, in the next section, later,Referring back - above, in the preceding section, earlier, as we have seenReferring to examples, diagrams, pages / as can bee seen, see, for exampleSource: McCarthy, Michael, O’Dell, Felicity. Academic Vocabulary in Use. Cambridge: Cambridge University Press, 2008。

Research, Development, and TechnologyTurner-Fairbank Highway Research Center6300 Georgetown Pike McLean, VA 22101-2296IntroductionA conflict is a scenario where two road users will likely collide without evasive action. Figure 1 illustrates an example of a conflict, where a vehi-cle is angling across two lanes to the left-turn bay and has abruptly cut in front of another vehicle that must decelerate to avoid collision. Traffic conflicts have been studied since the late 1960s as a technique to assess the safety of a location, with the understanding that conflict frequency is correlated with the risk of actual collision.Conflict studies traditionally utilize personnel trained to identify and record conflicts observed at an intersection. In this research, the SSAM software application was developed to automate conflict analysis by directly processing vehicle trajectory data. Researchers specified an open-standard, “universal” vehicle trajectory data format designed to provide the location and dimensions of each vehicle approximately every tenth of a second. It is hoped that in the coming years video processing technology will be capable of automatically extracting vehicle trajectory data adequate for SSAM processing. However, the trajectory file format is currently supported as an export option by four traffic microsimulation models: VISSIM, AIMSUN, Paramics, and TEXAS.Assessment MethodTo assess a traffic facility with SSAM, the facility is first modeled in one of the aforementioned simulation models and then simulated with desired traffic conditions (typically simulating several replications with different random number seeds). Each simulation run results in a corresponding trajectory file, referred to as a TRJ file corresponding to the .trj filename extension. Then, SSAM is used as a post-processor to analyze the batch of T RJ files. SSAM analyzes vehicle-to-vehicle interactions to identify conflict events and catalogs all events found. For each such event, SSAM also calculates several surrogate safety measures, including the following:• Minimum time-to-collision (TTC).• Minimum post-encroachment time (PET).• Initial deceleration rate (DR).• Maximum deceleration rate (MaxD).• Maximum speed (MaxS).• Maximum speed differential (DeltaS).• Classification as lane-change, rear-end, or path-crossing event type.• Vehicle velocity change had the event pro-ceeded to a crash (DeltaV)SSAM provides the following features:• A table of all conflicts identified in the batch of analyzed TRJ files, including file, time, location, vehicles identifications, and several measures of conflict severity.• A summary of conflict counts by type and file, with average values of surrogate measures over all conflicts.• A filtering mechanism that allows the isolation of subsets of conflicts by ranges of surrogate safety measures, conflict type, network link, or a rectangular region of the network.• A facility for statistical comparisons of the conflict frequencies and values of surrogate safety measures for two alternative cases or designs using the Student t distribution for hypothesis testing.• A display of the location of conflicts on the network map, with icons of different shapes and colors assignable to different conflict types or severities.Figure 2 is a screenshot of the map display in SSAM, with conflict icons color coded according to their time-to-collision values.2ValidationTo assess the capabilities of SSAM, researchers conducted theoretical validation, field valid-ation, and sensitivity analysis.The theoretical validation effort considered 11 pairs of intersection designs (e.g., right-turn bay versus no right-turn bay; SPUI versus dia-mond interchange; roundabout versus diamond interchange). The relative safety assessments of SSAM were compared to assessments using traditional, theoretical crash-prediction equa-tions. The results yielded interesting insights, though it was often the case that design A had more conflicts than design B, while design B had higher severity conflicts than design A, pointing to the need for further research in interpreting and comparing surrogate safety measures.The field validation effort was concerned with the absolute accuracy of surrogate safety assessment, in contrast to the relative safety assessments of the theoretical validation. A set of 83 field sites were selected—all were four-leg, urban, signalized intersections—and were modeled in VISSIM and simulated and assessed with SSAM. T he conflict analysis results of these intersections were compared to actual crash histories (based on historical insurance claims records) using five statistical tests. This effort also provided an opportunity for benchmark comparison of surrogate safety estimates ver-sus traditional crash-prediction models based on average daily traffic volumes (ADT).The simulation-based intersection conflicts data provided by SSAM were significantly correlated with the crash data collected in the field, with the exception of conflicts during path-crossing maneuvers (e.g., left turns colliding with opposing through-traffic), which were under-represented in the simulation. Intersection rankings based on total conflict frequency correlated with intersection rankings based on total crash frequency with a Spearman rank coefficient of 0.463 (and similarly for rear-end and lane-change incidents). The relationship between total conflicts and total crashes in this study (shown in figure 3) exhibits a correlation (R-squared) value of 0.41.This correlation of conflicts to crashes is consistent with the range of correlations reported in several studies between ADT and crashes for urban, signalized intersections. T his result was achieved despite simulating only morning peak-hour volumes. Crash prediction models based on a yearly average of 24-hour ADT volumes exhibited a correlation (R-squared) value of 0.68 with actual crash frequencies. This study also found a conflict-to-crash ratio of approximately 20,000 to 1, though that ratio varied by conflict type.The sensitivity analysis effort compared an assessment of five intersections (of the aforementioned 83) conducted separately using each of the four microsimulation models: VISSIM, AIMSUN, Paramics, and TEXAS. Crashes (vehicles driving through each other) were found in all simulations, and SSAM proved particularly useful in revealing questionable simulated behavior (due to user-configuration of the model in some cases and underlying34Researchers —This study was performed by the Intelligent T ransportation Systems Business Unit of Siemens Energy and Automation, Inc. (Siemens ITS); Principal Investigators Douglas Gettman, andSteven Shelby. For more information about this research, contact Clayton Chen, FHWA Project Manager, HRDSat(202)493-3054,********************.Distribution —This T echBrief is being distributed according to a standard distribution. Direct distribution is being made to the Divisions and Resource Center.Availability —The T echBrief may be obtained from the FHWA Product Distribution Center by e-mail to *********************,faxto(814)239-2156,phoneto(814)239-1160, or online at / safety.Key Words —Surrogate safety measures, T raffic conflicts, Intersection safety, and Simulation.Notice —This document is disseminated under the sponsorship of the U.S. Department of T ransportation in the interest of information exchange. T he U.S. Government assumes no liability for the use of the infor-mation contained in this document. T he U.S. Government does not endorse products or manufacturers. Trademarks or manufacturers’ names appear in this report only because they are considered essential to the objective of the document.Quality Assurance Statement —The Federal Highway Administration (FHWA) provides high-quality information to serve the Government, industry, and public in a manner that promotes public understand-ing. Standards and policies are used to ensure and maximize the quality, objectivity, utility, and integrity of its information. FHWA periodically reviews quality issues and adjusts its programs and processes to ensure continuous quality improvement.simulation logic in other cases). This has notably prompted some revisions (so far by TEXAS and VISSIM) to improve the behavior of the underlying simulation models.RecommendationsSSAM provides a compelling new option to assess the safety of traffic facilities using popular microsimulation software. This approach circumvents the need to wait for “abnormally high” crashes to actually occur, allows assessments of hypothetical designs and control alternatives, and is applicable to facilities where traditional, volume-based crash-prediction models (and norms) havenot been established. Research is ongoing in this area, and as simulation models and video technology improve, this technique is expected to grow in use.Additional InformationSSAM documentation is available in two FHWA reports: Surrogate Safety Assessment Model and Validation: Final Report, FHWA-HRT -08-051 and Surrogate Safety Assessment Model (SSAM): Software User Manual, FHWA-HRT -08-050 (/safety/intersect.htm). The SSAM software is available from Siemens Energy and Automation (/research/ssam/).。

最新-学年度第⼆学期统计分析软件SAS考试试卷(A)(答案)暨南⼤学考试试卷⼀、填空题(共10空,每空2分,共20分)1. ⼀个完整的SAS 程序由⼆部分组成: _数据 __步与_ 过程 __步.2. 多元统计分析中的判别分析与聚类分析的本质区别是: _类别是否已知,若已知,则为判别分析;否则为聚类分析 _.3. 进⾏数值资料的描述统计描述的两个基本SAS 过程是: _MEANS _过程与__ _UNIVARIATE _过程.4. 把多个SAS 数据集进⾏横向合并、纵向合并所⽤的语句分别是_MERGE _ 语句、__SET _语句.5. 进⾏分类资料的统计分析的两个基本SAS 过程是: _ LOGISTIC __过程与_ FREQ __过程.6. 进⾏数值资料的⽅差分析的两个基本SAS 过程是: _ ANOVA __过程与_ GLM __过程.7. 在SAS 中,可⽤于进⾏相关分析的过程常⽤的有:简单线性相关及等级相关的_ CORR _过程与典型相关的_ CANCORR _过程.8. 秩和检验的SAS 过程中最常⽤的有⼆种:⼀是⽤于配对设计数值变量资料符号秩和验的 UNIVARIATE _过程,另⼀是⽤于成组设计两样本⽐较及多个样本⽐较的秩和检验的 _ NPAR1WAY _过程.9. GLM 过程可⽤于:进⾏(1)⾮均衡设计资料的⽅差分析 _、(2)协⽅差分析及建⽴(3)_ 多项式 _回归.10. 在SAS 中,可⽤于进⾏数值资料回归分析的过程常⽤的有:⼀元及多元线性回归的 REG _过程与⾮线性回归的_ NLIN _过程.(⼀)SAS 数据集E3是对20名25∽34岁的健康妇⼥进⾏体检取得的,现需要建⽴由头肌⽪褶厚度(1X ,cm),⼤腿围(2X ,cm)及中臂围(3X ,cm)预测⾝体脂肪(Y ,cm)分布的⽅程. 运⾏SAS 某些过程,有以下SAS 运⾏结果:The REG ProcedureModel: M1Dependent Variable: yAnalysis of VarianceSum of MeanSource DF Squares Square F Value Pr > F Model 3 396.98461 132.32820 21.52 <.0001Error 16 98.40489 6.15031Corrected Total 19 495.38950Root MSE 2.47998 R-Square 0.8014Dependent Mean 20.19500 Adj R-Sq 0.7641Coeff Var 12.28017Parameter EstimatesParameter Standard Variance Variable DF Estimate Error t Value Pr > |t| Inflation Intercept 1 117.08469 99.78240 1.170.2578 0 x1 1 4.33409 3.01551 1.44 0.1699 708.84291 x2 1 -2.85685 2.58202 -1.11 0.2849 564.34339 x3 1 -2.186061.59550 -1.37 0.1896 104.60601The PRINCOMP ProcedureCorrelation Matrixx1 x2 x3x1 1.0000 0.9238 0.4578x2 0.9238 1.0000 0.0847x3 0.4578 0.0847 1.0000Eigenvalues of the Correlation MatrixEigenvalue Difference Proportion Cumulative1 2.06647268 1.13367198 0.6888 0.68882 0.93280070 0.93207408 0.3109 0.99983 0.00072662 0.0002 1.0000Eigenvectorsz1 z2 z3x1 0.694696 -.050106 -.717557x2 0.629428 -.440509 0.640135x3 0.348164 0.896349 0.274482The REG ProcedureModel: M2Dependent Variable: yAnalysis of VarianceSum of MeanSource DF Squares Square F Value Pr > FModel 3 396.98461 132.32820 21.52 <.0001Error 16 98.40489 6.15031Corrected Total 19 495.38950Root MSE 2.47998 R-Square 0.8014Dependent Mean 20.19500 Adj R-Sq 0.7641 Coeff Var 12.28017Parameter EstimatesParameter Standard Variance Variable DF Estimate Error t Value Pr > |t| Inflation Intercept 1 20.19500 0.55454 36.42 <.0001 0 z1 1 2.93576 0.39578 7.42 <.0001 1.00000 z2 1 -1.64976 0.58908 -2.80 0.0128 1.00000 z3 1 -27.38341 21.10659 -1.300.2129 1.000001.为建⽴Y 关于321,,X X X 的线性回归⽅程,需应⽤的SAS 过程为:A. LOGISTIC 过程B.NLIN 过程C.GLM 过程D.REG 过程 2.由所建⽴的线性回归⽅程可见: ⽤321,,X X X 来解释Y 的变动,只可以解释其中的( )%, 在0.05的显著性⽔平之下,有显著影响的因素有( )个, ⽽且三因素间( )共线性现象.A.80.14%, 0, 存在B. 80.14%, 0, 不存在C.76.41%, 0, 不存在D. 80.14%, 3, 存在3.根据对321,,X X X 所作的主成分分析,SAS 运⾏结果表明, 相关矩阵的最⼤特征值为( ),实际应⽤中(按80%的原则),需要选取的主成分为( )个. A. 2.06647268,1 B. 1.13367198,1 C. 2.06647268,2 D. 1.13367198,24.根据对321,,X X X 所作的主成分分析,SAS 运⾏结果表明,第⼀主成分为=1ZA. 3213481.06294.06947.0X X X ++B. 3212745.06401.07176.0X X X ++-C.3218963.04405.00501.0X X X +--D.以上结果都不对5. 根据SAS 运⾏结果,取Y 关于主成分321,,Z Z Z 的线性回归⽅程,能有效地消除多重共线性,所得的线性回归⽅程为 3322111950.20?Z Z Z Y βββ+++=,其中: =1βA. 0.8014B. 2.93576C.0.39578D. 7.42(⼆)为110名7岁男童⾝⾼资料(SAS数据集名为P6),试编制频数表,计算描述性统计量并进⾏正态性检验. 运⾏SAS某些过程,有以下SAS运⾏结果:The UNIVARIATE ProcedureVariable: xMomentsN 110 Sum Weights 110Mean 119.727273 Sum Observations 13170Std Deviation 4.74132543 Variance 22.4801668Skewness 0.15461074 Kurtosis -0.0252871Uncorrected SS 1579258.52 Corrected SS 2450.33818Coeff Variation 3.96010476 Std Error Mean 0.45206764Basic Statistical MeasuresLocation VariabilityMean 119.7273 Std Deviation 4.74133Median 119.9000 Variance 22.48017Mode 114.3000 Range 24.30000Interquartile Range 6.40000NOTE: The mode displayed is the smallest of 5 modes with a count of 3.Tests for NormalityTest --Statistic--- -----p Value------Shapiro-Wilk W 0.993143 Pr < W 0.8623Kolmogorov-Smirnov D 0.055958 Pr > D >0.1500Cramer-von Mises W-Sq 0.036956 Pr > W-Sq >0.2500Anderson-Darling A-Sq 0.231585 Pr > A-Sq >0.2500回答以下问题:6.为编制频数表,所使⽤的SAS过程为:A. FREQ 过程B. MEANS 过程C. UNIVARIATE 过程D.TTEST 过程7.要计算诸如除均值,标准差,最值之外的统计量,还要计算众数,中位数,四分位间距等描述性统计量,需要使⽤的SAS过程为:A. FREQ 过程B. MEANS 过程C. UNIVARIATE 过程D.REG 过程8.为进⾏分布的正态性检验, 需在所使⽤的UNIVARIATE过程( )语句中加上NORMAL选项.A. VAR 语句B. PROC UNIVARIATE 语句C. MODEL 语句D.BY 语句9.根据SAS运⾏结果, 样本中位数为:A. 119.7273B. -0.0253C. 119.9000D. 114.300010.根据SAS运⾏结果, 可认为在显著性⽔平( )下所给的⾝⾼资料( )正态分布.A.0.05,服从B. 0.5, 服从C. 0.05,不服从D. 0.5 不服从调查1329名⾎中胆固醇(CHO)含量及成⼈⾎压(SBP)和冠⼼病(D)的关系,得到如下表所⽰的列联表:要求进⾏相应的统计分析. 运⾏SAS某些过程,有以下SAS运⾏结果:The FREQ ProcedureSummary Statistics for case by choCochran-Mantel-Haenszel Statistics (Based on Table Scores)Statistic Alternative Hypothesis DF Value Prob ---------------------------------------------------------------1 Nonzero Correlation 1 26.1475 <.00012 Row Mean Scores Differ 1 26.1475 <.00013 General Association 3 35.0021 <.0001The FREQ ProcedureSummary Statistics for case by sbpCochran-Mantel-Haenszel Statistics (Based on Table Scores)Statistic Alternative Hypothesis DF Value Prob ---------------------------------------------------------------1 Nonzero Correlation 1 21.9444 <.00012 Row Mean Scores Differ 1 21.9444 <.00013 General Association 3 28.9441 <.0001The LOGISTIC ProcedureModel InformationData Set WORK.EX_905Response Variable caseNumber of Response Levels 2Frequency Variable countModel binary logitOptimization Technique Fisher's scoringProbability modeled is case=1.NOTE: 1 observation having nonpositive frequency or weight was excluded since it does not contribute to the analysis. Model Convergence StatusConvergence criterion (GCONV=1E-8) satisfied.Deviance and Pearson Goodness-of-Fit StatisticsCriterion Value DF Value/DF Pr > ChiSqDeviance 14.8472 13 1.1421 0.3170Pearson 13.4287 13 1.0330 0.4153Model Fit StatisticsInterceptIntercept andCriterion Only CovariatesAIC 670.831 630.952SC 676.024 646.529-2 Log L 668.831 624.952Testing Global Null Hypothesis: BETA=0Test Chi-Square DF Pr > ChiSqLikelihood Ratio 43.8791 2 <.0001Score 43.3635 2 <.0001Wald 40.2202 2 <.0001The LOGISTIC ProcedureAnalysis of Maximum Likelihood EstimatesStandard WaldParameter DF Estimate Error Chi-Square Pr > ChiSqIntercept 1 -5.0916 0.4428 132.2333 <.0001。