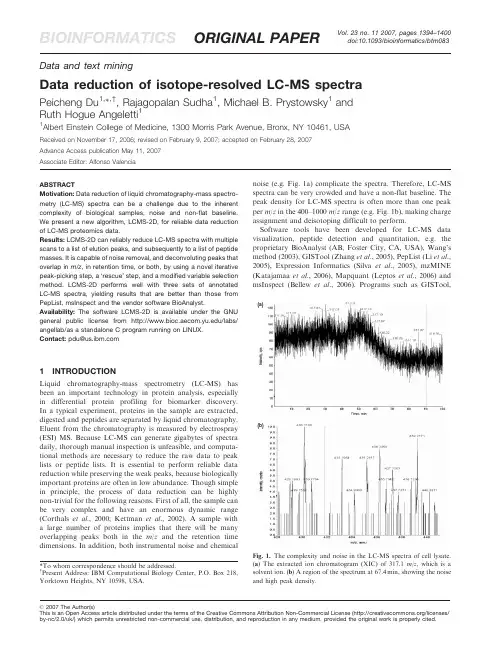
Vol.23no.112007,pages1394–1400 BIOINFORMATICS ORIGINAL PAPER doi:10.1093/bioinformatics/btm083 Data and text miningData reduction of isotope-resolved LC-MS spectraPeicheng Du1,Ã,†,Rajagopalan Sudha1,Michael B.Prystowsky1andRuth Hogue Angeletti11Albert Einstein College of Medicine,1300Morris Park Avenue,Bronx,NY10461,USAReceived on November17,2006;revised on February9,2007;accepted on February28,2007Advance Access publication May11,2007Associate Editor:Alfonso ValenciaABSTRACTMotivation:Data reduction of liquid chromatography-mass spectro-metry(LC-MS)spectra can be a challenge due to the inherent complexity of biological samples,noise and non-flat baseline. We present a new algorithm,LCMS-2D,for reliable data reduction of LC-MS proteomics data.Results:LCMS-2D can reliably reduce LC-MS spectra with multiple scans to a list of elution peaks,and subsequently to a list of peptide masses.It is capable of noise removal,and deconvoluting peaks that overlap in m/z,in retention time,or both,by using a novel iterative peak-picking step,a‘rescue’step,and a modified variable selection method.LCMS-2D performs well with three sets of annotated LC-MS spectra,yielding results that are better than those from PepList,msInspect and the vendor software BioAnalyst. Availability:The software LCMS-2D is available under the GNU general public license from /labs/ angellab/as a standalone C program running on LINUX.Contact:pdu@1INTRODUCTIONLiquid chromatography-mass spectrometry(LC-MS)has been an important technology in protein analysis,especially in differential protein profiling for biomarker discovery. In a typical experiment,proteins in the sample are extracted, digested and peptides are separated by liquid chromatography. Eluent from the chromatography is measured by electrospray (ESI)MS.Because LC-MS can generate gigabytes of spectra daily,thorough manual inspection is unfeasible,and computa-tional methods are necessary to reduce the raw data to peak lists or peptide lists.It is essential to perform reliable data reduction while preserving the weak peaks,because biologically important proteins are often in low abundance.Though simple in principle,the process of data reduction can be highly non-trivial for the following reasons.First of all,the sample can be very complex and have an enormous dynamic range (Corthals et al.,2000;Kettman et al.,2002).A sample with a large number of proteins implies that there will be many overlapping peaks both in the m/z and the retention time dimensions.In addition,both instrumental noise and chemical noise(e.g.Fig.1a)complicate the spectra.Therefore,LC-MS spectra can be very crowded and have a non-flat baseline.The peak density for LC-MS spectra is often more than one peak per m/z in the400–1000m/z range(e.g.Fig.1b),making charge assignment and deisotoping difficult to perform.Software tools have been developed for LC-MS data visualization,peptide detection and quantitation, e.g.the proprietary BioAnalyst(AB,Foster City,CA,USA),Wang’s method(2003),GISTool(Zhang et al.,2005),PepList(Li et al., 2005),Expression Informatics(Silva et al.,2005),mzMINE (Katajamaa et al.,2006),Mapquant(Leptos et al.,2006)and msInspect(Bellew et al.,2006).Programs such as GISTool,*To whom correspondence should be addressed.y Present Address:IBM Computational Biology Center,P.O.Box218, Yorktown Heights,NY10598,USA.(a)(b)Fig.1.The complexity and noise in the LC-MS spectra of cell lysate.(a)The extracted ion chromatogram(XIC)of317.1m/z,which is a solvent ion.(b)A region of the spectrum at67.4min,showing the noise and high peak density.ß2007The Author(s)This is an Open Access article distributed under the terms of the Creative Commons Attribution Non-Commercial License(/licenses/ by-nc/2.0/uk/)which permits unrestricted non-commercial use,distribution,and reproduction in any medium,provided the original work is properly cited.Expression Informatics and PepList perform peak-picking, charge assignment and deisotoping on a scan-to-scan basis, i.e.the1D approach,and are not making full use of the 2D nature of LC-MS data.For programs that perform2D peak-picking(Bellew et al.,2006;Hastings et al.,2002; Katajamaa et al.,2006;Wang et al.,2003),the noise removal and deconvolution of overlapping peaks or isotope series are either not described or have room for improvements. Furthermore,some of the above programs are not tested with annotated datasets of a reasonable size because spectrum annotation is time-consuming.In this article,the algorithm LCMS-2D is introduced,which performs data reduction for LC-MS spectra using the2D approach.It first reduces the spectra to a list of elution peaks, then further reduces the list of elution peaks to a list of peptide ions.We show that the fidelity of data reduction is very good by testing with three annotated LC-MS datasets and comparing with existing software packages.2METHODS2.1File preparationFiles are originally in the instrument format for Qstar Pulsar (Applied Biosystems,Foster City,CA,USA).They are first converted to mzXML format(Pedrioli et al.,2004)and then to text files using the programs mzStar and mzxml2other(),with an additional step to recover zero-intensity points based on the linear relationship between m/z spacing and the square root of m/z.Then a simple running-average smoothing procedure is applied along the retention time axis to reduce scan-to-scan noise with a window size of 11scans,chosen to remove scan-to-scan noise at the cost of ignoring most ions appearing in fewer than5–6scans.To prevent one-shot wonder,the window size should be set between three scans to the expected minimum peak width.2.2Iterative detection of elution peaksPeak-picking with noisy elution profiles,crowded elution peaks and non-flat baseline can be highly non-trivial.The strategy is to find the strongest elution peak first,remove it from consideration,then look for the next strongest elution peak,and repeat until no more elution peaks can be found above the preset signal-to-noise(S/N)ratio,chosen to be2.5.Initially,the spectrum for each scan is converted to a list of single-scan peaks,which may include chemical and instrumental noise. Then,the single-scan peaks for all scans are pooled to form a super list of single-scan peaks.Next,a seed is chosen to be the strongest single-scan peak.An extracted ion chromatogram(XIC)is constructed within þ/Àdm window of the m/z of the seed peak.The size of dm is set to be the maximum spread of a peak centroid over multiple scans, and dm¼0.15for three datasets tested.Then a peak-picking routine is applied to find elution peaks above the preset S/N ratio.If such an elution peak exists,all single-scan peaks contained in this elution peak, e.g.single-scan peaks within dm m/z of the seed and within the retention time range of this elution peak,are removed from the super list.In rare cases when no elution peak can be found,those single-scan peaks within dm m/z of the seed and within5scans of the seed peak are removed from the super list.In the next iteration,a new seed is chosen as the strongest single-scan peak in the current super list,and the process continues until no more elution peaks can be found above the preset S/N ratio.Because in theory any local maximum is a peak,the goal of peak-picking is not to find all local maxima,but to find elution peaks typical for peptides that are clearly distinguished from noise.A peptide elution peak typically spans5–300scans in the LC conditions used for LC-MS datasets described below in Section2.4.An advantage of using preset peak width is that some solvent peaks which appear throughout the run are removed,e.g.Figure1a.In practice,the range of peak width for expected peptide elution peaks may need to be adjusted to reflect different LC-conditions and noise levels.2.3Converting elution peaks to a peptide listIn this step,LCMS-2D finds elution peaks with similar retention times and performs charge assignment and deisotoping to reduce them to a list of peptide monoisotopic masses.This is made difficult due to noise and possible presence of other isotope series with similar m/z and retention time.Initially,a super list of all elution peaks is created. Then LCMS-2D finds the strongest elution peak as the‘template peak’, and builds a cluster of elution peaks by collecting all other elution peaks that have similar retention time with the template peak or with any of the peaks in the cluster.Note that two peaks in the same cluster may still have dissimilar retention times.Two elution peaks are defined as having similar retention times if the peak apexes are within5scans,or if for any peak,more than half of the peak area above the half peak height overlaps with that of another peak.This criterion is chosen such that it effectively reduces the cluster size,while avoiding separating isotopic peaks of the same peptide into different clusters.For peaks in the same cluster,charge assignment and deisotoping are performed with the variable selection method(Du and Angeletti,2006), which aims to find the least number of peptide ions which explain the spectrum well according to the principal of variable selection.Because peaks in the same cluster may still have dissimilar retention times, a modification is made to the above method such that only peaks with similar retention times may be assigned to the same isotope series. All peptide ions reported are added to the list of detected peptides. All peaks in the cluster are then removed from the super list of elution peaks.On the other hand,peaks that are not explained well by detected peptides,e.g.with poor goodness of fit to the expected isotope profiles (Senko et al.,1995;Wehofsky et al.,2001),and peaks that belong to single-member clusters are added to a list of‘unexplained peaks’.In the following iteration,the next strongest elution peak in the super list is used as a new template,and so on.Eventually the list of detected peptides contains a list of peptide masses.If applicable,peptides with the same mass and retention time but different charge states are combined,i.e.their intensities are summed together.A‘rescue’procedure is performed in an attempt to interpret strong peaks in the list of unexplained peaks.This step is useful because it looks for alternative interpretations for peaks not explained well, and can be used to interpret peaks for which neighboring isotopic peaks are not detected due to elution peak overlapping.Figure2a shows an example where the elution peak of the second isotopic peak forms a shoulder peak at70.3min.For an unexplained elution peak,the basic idea of rescue is to perform1D peak-picking,deisotoping and charge assignment at the scan of elution peak apex,the spectrum at Figure2b. Therefore,even if the elution peak of any single isotopic peak is not detected by the2D peak-picking procedure due to peak overlapping, the isotope series may still be detected as long as at least one of the isotopic peaks form a clear elution peak.To avoid false positives, the rescue procedure is restricted to unexplained elution peaks for which the S/N is at least5.The peptide list can be optionally filtered to improve reliability based on empirical criteria.Most chemical noise peaks can be removed from the list by removing singly charged ions with monoisotopic masses below600Da,at the risk of removing some peptide ions.In addition, ions of four or more charges without any corresponding lower charge states can also be filtered out.Data reduction of isotope-resolved LC-MS spectra13952.4Method evaluation with annotated dataTo evaluate the performance of LCMS-2D,the LC-ESI-MS spectra of a mixture of standard peptides are used,referred to as ‘16-mix’in this article.The 16-mix contains 16known synthetic peptides with eightunique masses,i.e.for each unique mass there are two peptides.The monoisotopic masses of them are:947.55,948.54,962.53,963.51,1023.58,1024.57,1038.56and 1039.54,respectively.The mixture is known to have some contaminants.The experimental conditions for the 16-mix have been described previously (Du and Angeletti,2006).Briefly,samples are analyzed by a Qq-TOF mass spectrometer (Qstar Pulsar,AB,Foster City,CA,USA).The 2%CH3CN/0.1%formic acid is used as solvent A.The 80%CH3CN/0.1%formic acid is used as solvent B.A C18column with 300m m i.d.Â15cm (Dionex,CA,USA)is used for the separation.The following gradient is used for LC:30min at 5%solvent B (desalting)followed by 5–55%B from 30to 80min.The flow rate is 3m l/min.Microelectrospray sources with 20m m-i.d.capillary is used for ESI.TOF-MS scan is performed in the m /z 300–1800with a scan time of 1s.The instrument is calibrated using CsI-peptide mixture as suggested by the vendor.The 16-mix containing 2.5Â10À9M concentration of each peptide in a 50m l volume is injected.A second annotated LC-MS dataset is a cell lysate fraction of the cell line FaDu (Rangan,1972).Proteins are extracted from the cell line,and digested.Subsequently,the peptides are injected into a strong cation exchange column with step gradient at salt concentrations of 0,10,20,30,40,60,100,200,300and 600mm.Each fraction is then injected into the C18column and the LC-MS spectra are collected under the same conditions as the 16-mix.The LC-MS spectra of the fraction at 100mm salt are manually annotated and used in this study.A total of 980ions are visually inspected to be present in the spectra.A third dataset is used where two synthetic peptides are added as internal markers to cell lysate fractions of the cell line SCC25(American Type Culture Collection,CRL-1628).The first peptide sequence is VFLQYLKN,with a monoisotopic mass of 1023.58.The second peptide shares the same sequence,except that the two leucines are labeled with 15N.The two peptides should co-elute with 2Da apart around 70min.Except for cell line differences,the SCC25cell lysate fractions are prepared under the same conditions as that used for the second dataset.These fractions are also collected at 100mm salt.The LC-MS conditions are the same as well.Nine replicates are performed for SCC25(Sudha et al .,in preparation).The two synthetic peptides are added to every replicate.Results from other programs for the three datasets are also collected for comparison.There are very few parameter inputs required to run PepList and msInspect,except the option of ‘Strategy ¼Feature Strategy Peak Clusters’is chosen to run msInspect (revision 3296).The vendor software is Analyst QS 1.1and BioAnalyst 1.1.5(Applied Biosystems,Foster City,CA,USA).Peptide features are extracted from 16-mix spectra with ‘LCMS Reconstruct’with the default S/N threshold of 10,and the mass tolerance of 0.15Da instead of the default 0.2Da.Feature extraction for the cell lysate fractions is unable to be performed with the vendor software BioAnalyst,perhaps because the file contains a few MS/MS spectra.3RESULTS AND DISCUSSION 3.1Results of the 16-mix spectraFor the 16-mix spectra,the programs used and the total numbers of ions reported are:LCMS-2D,636;msInspect,240;PepList,84;BioAnalyst:2134.The differences in the number of ions may simply be due to different S/N threshold used by different programs.Since there are impurities in the 16-mix mixture,the goal is to check if LCMS-2D or other programs can find the 16peptides.Table 1lists the results for all programs.LCMS-2D finds both the singly charged and doubly charged ions for all 16peptides except for the singly charged(a)(b)68.56969.57070.57171.5I n t e n s i t yI n t e n s i t y0200400600800481.5482482.5483483.5484484.5Time (min)m /z (a.m.u)Fig.2.An example for the rescue procedure from the 16-mix spectra showing the mass 962.53at 70.3min is detected by the rescue procedure.(a )The solid line is the XIC of 482.78,showing the shoulder at 70.3min.The dotted line is the XIC of 482.29.(b )The corresponding spectrum at 70.3min.P.Du et al.1396ion for mass1038.56at retention time of72.6min,because the two strongest isotopic peaks for that ion are both below S/N of 2.5.The program msInspect misses the doubly charged ions for three peptides,and the singly charged ions of nine peptides. The program PepList misses the doubly charged ions of eight peptides,and the singly charged ions of10peptides.BioAnalyst misses both the singly and doubly charged ions of five peptides. LCMS-2D stands out as the only program that detects almost all charge states for all16peptides.LCMS-2D detects all the strong doubly charged ions for the16peptides while no other program is able to.It is possible that some programs have difficulty separating overlapping isotope series,such as masses 947.55and948.55Da,both at retention time of67.4min and 1Da apart.It is also possible that overlapping elution peaks can lead to missing peptide ions for some programs, e.g.Figure 2.Even in the absence of overlapping isotope series or elution peaks,some programs still miss peptide ions. It should be noted that msInspect and PepList are not designed specifically for Qstar data.LCMS-2D overcomes overlapping elution profiles by either picking up the overlapping elution peaks when the overlapping is not severe,or by triggering the rescue procedure when any of the isotopic peaks has a strong elution profile above S/N of5. When the rescue procedure is turned off,three ions would be missing that would otherwise be detected with the procedure. An example of how one of the three ions is rescued is shown in Figure2,where the second isotopic peak forms a shoulder peak at70.3min.The rescue procedure essentially is to use the scan-to-scan approach for unexplained strong elution peaks,which avoids the drawback of relying on foolproof elution peak detection.By using the rescue procedure,LCMS-2D effectively combines the advantages of both the2D approach and the scan-to-scan approach.Visual examination shows that the rescue procedure does not generate unambiguous false positives.Surprisingly,LCMS-2D has the best mass accuracy among all four programs used(Table1).For13of the16peptides, masses calculated by LCMS-2D either are the most accurate,or tie with the most accurate.The fact that LCMS-2D gives the most accurate masses is not expected,because LCMS-2D simply uses the strongest scan for each elution peak to calculate the peptide mass.Because the16-mix is a small dataset,whether LCMS-2D improves mass accuracy in general still remains to be tested with more data.Though it is true that the test datasets are not blind to LCMS-2D but are blind to other programs,the difference in results may be explained by the algorithms used instead of parameter selection.PepList is a scan-by-scan,or1D method which has limited capabilities in resolving overlapping peaks or handling noise.It calculates the elution profile of a peptide by summing up the intensity of all isotopic peaks for the peptide in each scan(Li et al.,2005).It will encounter problems when any of the isotopic peaks overlap with others during the entire elution peak,which often happens for a complex peptide mixture.It is expected that PepList would have problems with the16-mix where peaks are close in m/z and in retention time to mimic the behavior of complex samples.For msInspect,the performance is better than BioAnalyst.However,one of the reasons msInspect missed ions is probably because it‘assemble all the isotopes into groups that appear,maximize and then disappear at similar times,an indication of an eluting isotopic distribution potentially from the same peptide’(Bellew et al., 2006).Therefore it is likely to run into the same problem as PepList.Moreover,it in unclear how msInspect treats unassigned peaks.In addition,results of LCMS-2D on the16-mix are not sensitive to parameter changes within a reasonable range, including the minimum S/N cutoff,the m/z window dm,and the criterion of retention-time similarity.Table1.Results of the16-mix spectra from LCMS-2D,msInspect,PepList and BioAnalystTrue Mass/Da True retention time/min LCMS-2D,charge/dm MsInspect,charge/dm PepList,charge/dm BioAnalyst,charge/dm 947.5565.51,2/0.021,2/0.051,2/0.031,2/0.03 947.5567.41,2/50.012/50.01948.5467.41,2/0.011/0.011,2/0.02 948.5469.31,2/0.031,2/50.011,2/0.04962.5367.51,2/0.011,2/0.011/50.011,2/0.02 962.5370.31,2/50.012/0.01963.5169.61,2/0.021,2/0.031,2/0.031,2/0.04 963.5172.21,2/0.021,2/0.011,2/0.031,2/0.03 1023.5870.91,2/0.032/0.041023.5872.71,2/50.012/0.041,2/0.04 1024.5772.71,2/0.012/0.032/0.011,2/0.04 1024.5774.61,2/0.011,2/0.031/0.021,2/0.04 1038.5672.61,2/0.032/0.041,2/0.03 1038.5675.92/0.021039.5474.41,2/0.022/0.062/0.041,2/0.04 1039.5477.61,2/0.042/0.062/0.041,2/0.04 True mass:the peptide mass calculated from chemical formula.True retention time:manually annotated retention time.‘charge/dm’:charge is the charge state(s) detected,and‘dm’is the mass deviation from the true mass in Dalton.In cases of multiple charge states,the strongest one is used to calculate dm.Empty cells represents that no ion is detected for that peptide.Data reduction of isotope-resolved LC-MS spectra13973.2Results of the cell lysate fractionTo show the effects of sample complexity,noise and subtlety in the spectra of the digests of a large number of proteins,the LC-MS spectra for a cell lysate fraction are used to test the performance of LCMS-2D.The cell lysate spectra have been manually annotated to have980ions.The list generated by LCMS-2D for the cell lysate spectra has1597ions above the S/N ratio of2.5.To determine if LCMS-2D misses peptides in the annotated list,defined as false negatives assuming that the annotated list is correct,the first 500strongest ions in the annotated list are compared to the ion list by LCMS-2D.The first500strongest ions are used because they are the most reliable of the ions.Results are summarized in Table2.A total of47ions among the list of500annotated ions are missed by LCMS-2D.Of the47ions,43would have been detected if a lower S/N cutoff is used.For three of the 47missing ions,the elution peaks of one of the two strongest isotopic peaks severely overlap with others,and the S/N of other isotopic peaks for the ions are not above5to trigger the‘rescue’procedure.Specifically for the top two strongest missing ions,i.e.the doubly charged mass of1314.78at 65.5min(monoisotopic peak at658.39m/z)and the singly charged mass of657.34at65.86min(monoisotopic peak at 658.34m/z),the elution peaks of at least one of the strongest isotopic peaks overlap severely with others(Fig.3).One of the 47ions is missing because of ambiguous charge state.The ion list by LCMS-2D is also compared to the annotated list to look for false positives,assuming the annotated list is correct.The first500strongest ions from the LCMS-2D list are compared to ions in the annotated list.The result is that89ions in the500list from LCMS-2D are not in the annotated list. None of the89ions is strong,which shows LCMS-2D does not generate false positives with strong intensities for this dataset. Of the89ions,68are actually real;19are ambiguous;and two weak ions are assigned the wrong charge states due to the interference of noise.The fact that68ions are real implies that manual annotation may miss real ions for the spectra of complex protein mixture,which is expected because manual annotation is not a systematic approach,and is subject to analyst fatigue.Despite that,manual annotation is still a valuable standard especially for measuring the false positive rate,which is usually harder to measure than the false negative rate because of the presence of chemical noise,protein modifications and impurities.As with the16-mix spectra,the rescue procedure is also helpfulin reducing the number of missing ions for the cell lysate spectra. With the rescue feature turned off,the number of false negatives increases to62,compared to47when rescue is turned on.For comparison,results for the same cell lysate spectra from other programs are also analyzed and shown in Table2.A total of406ions are reported by msInspect.The number of ions among the top500strongest annotated ions that are missed by msInspect is236,including at least a dozen strong-to-medium intensity ions.Strangely,the program PepList only reports 52ions for the cell lysate spectra,of which51are in the annotated list.The only ion which is not real is assigned the wrong charge of four while the true charge state should be three. Results from BioAnalyst are not available for comparison.3.3Result of internal markers in SCC25cell lysatefractionsIn order to test if LCMS-2D can detect peptides among complex peptide mixtures,the spectra of SCC25cell lysate fractions at100mm salt are processed for all nine replicates. The goal is to see if LCMS-2D can detect the two marker peptides in all replicates.Results are shown in Table3.Except for replicate9where marker1025.58is too weak to detect, LCMS-2D finds all marker peptides.For most markers,both singly and doubly charged ions are found.In comparison, msInspect and PepList often miss the marker peptide of 1025.58(data not shown).For this dataset the mass accuracyTime (min)IntensityIntensity(a)m/z (a.m.u)Fig.3.Overlapping elution peaks around65.5min.(a)The black,red and green lines:the XIC of658.3,658.8and659.3m/z,respectively. The black and green lines are flat,probably due to three overlapping peaks at65.2,65.6and65.8min.(b)The black,red and green lines are the spectrum at65.18,65.58and65.82min,respectively,showing two singly charged ions at65.18and65.82min,and a doubly charged ion at65.58min.Table2.Results of the cell lysate spectrumLCMS-2D msInspect PepListTotal ions reported159740652 Among top500strongest annotatedions,but not reported47a236449cAmong top500strongest reportedions,but absent in annotation89b N/A1a Among the47missing ions,43could have been detected with lower S/N cutoff,b Among the89ions,68are real by visual inspection;19are ambiguous;2are wrong andc500subtracted by51,the number of real ions.P.Du et al. 1398of LCMS-2D and msInspect are similar.Therefore,the fact that LCMS-2D has the best mass accuracy for the16-mix could be due to chance.3.4Reducing LC-MS spectra to a list of elution peaks It is essentially a process of information compression to convert a list of elution peaks to a list of peptides.Due to reasons such as noise,overlapping isotope series,unknown isotope profiles of solvent ions and unknown atomic composition of peptides, this process is susceptible to error and information loss. An obvious way to eliminate the errors is to skip this step and use the list of elution peaks as the results.Another advantage is that information loss is minimized because even if only the strongest peak in an isotope series is detected,the peak is not discarded.The peak would be discarded if elution peaks have to be converted to peptides.As a result,using the elution peaks directly should increase the sensitivity and extend thedynamic range.For a small peptide of400Da.,the sensitivity increase can be almost5-fold because the intensity ratio of the two strongest isotopic peaks is about5:1.A possible disadvan-tage of skipping this step is that interpretation becomes less straightforward since more than one elution peak corresponds to one peptide.A second disadvantage is that it becomes diffi-cult to filter out non-peptide ions because isotope profiles are not checked against the expected isotope profiles for peptides. An additional concern is that using a single peak without sister isotopic peaks could increase the false positive rate. By examining the reproducibility of peaks across multiple replicates,it is possible to differentiate noise from peptide ions.3.5The2D approach versus the1D approachThe advantage of the scan-to-scan,i.e.1D approach,is that it does not rely on foolproof detection of elution peaks.However, it can be difficult or even impossible to distinguish peptide peaks from noise peaks based on an individual scan,which may be possible with the2D approach by examining the elution profiles,as noted by Hastings and coworkers(2002). For example,Figure1a is the XIC of a solvent ion at317.1 m/z showing no clear elution peaks and elevated baseline,while Figure4a shows typical XIC of peptide ions.An additional difficulty for the1-D approach is to perform deconvolution in regions of high peak density,e.g.at432–438m/z in Figure1b,while the2D approach may be able to tackle the complexity by examining peaks with similar retention time apex at a time. Furthermore,the1D approach may have trouble performing deisotoping with unexpected isotope profiles,while the2D approach may stop after reducing the spectrum to a set of elution peaks without deisotoping.The2D algorithm can produce a list of elution peaks,which avoids errors in deisotoping and charge assignment completely and can also increase the sensitivity and dynamic range.Yet an additional difficulty for the1D approach is how to handle isotope profiles distorted by scan-to-scan noise.Figure4shows an example of the distorted isotope profiles for three successive scans,while the expected intensity ratio of peaks425.7and426.2at the elution peak apex is2:1.By only examining the elution peak apex where S/N is the strongest,the2D approach can alleviate the noise problem.For a fair comparison between the1D and2D approach,the program LCMS-1D by the authors(unpublished data)which uses the1D approach is tested with the three annotated spectra. The main difference between LCMS-1D and other programs based on the scan-to-scan approach is it uses variable selection to separate overlapping isotope series and peaks(Du and Angeletti,2006).For the16-mix spectra,LCMS-1D can also find all16peptides.At the same time,it generates several false positives due to the scan-to-scan noise at regions of low S/N.IntensityIntensity(a)(b)m/z (a.m.u)m/z (a.m.u)Fig.4.The elution profiles and spectra of three successive scans of the doubly charged isotopic series starting from425.73m/z of the cell lysate spectra,showing the scan-to-scan noise and how it distorts the isotope profile.(a)The black and red lines represent the XIC of425.7and 426.2m/z,respectively.(b)The black,red and green lines represent the spectrum at59.075,59.127and59.179min,respectively.The peak height ratios for425.7and426.2m/z for the three scans are:15:9,8:6 and9:8,respectively.Table3.Results of internal markers in SCC25cell lysate fractionsReplicate number Marker1023.58Mass(charge)IntensityMarker1025.58Mass(charge)Intensity11023.59(1,2)396.61025.58(1,2)208.221023.51(1,2)198.31025.53(2)94.931023.50(1,2)344.41025.50(1,2)238.941023.53(1,2)249.01025.50(1,2)223.551023.56(1,2)243.61025.56(1,2)209.561023.54(1,2)247.61025.55(1,2)221.971023.59(1,2)291.81025.56(1,2)281.281023.51(1,2)618.61025.53(2)56.691023.64(1,2)538.9Too weak to detectData reduction of isotope-resolved LC-MS spectra1399。