高三英语图表作文
- 格式:pptx
- 大小:1.58 MB
- 文档页数:8
高考英语指导写作专题:图表说明文一,图表说明1,分类:数字表、函数关系图、曲线图(graph);表格(table);几何图形(figure);图形表、饼状图(pie chart);条状图、柱状图(bar chart);平面图、示意图、外形图(diagram)。
2,一般可分三个层次来写:按照题目要求描述图表反映的总情况,即概括大意。
对数字进行仔细的比较,抓住特点进行分析、归纳并找出产生变化的原因。
读图表后的想法、结论、评论或针对反映出的问题采取的解决措施。
二.表达方式:1,常用的描述句型The table/chart/diagram/graph shows that ...According to the table/chart/diagram/graph...As is shown in the table/chart/diagram/graph...As can be seen from the table/chart/diagram/graph/figures...We can see from the figures/statistics...It is clear/ apparent from the figures/statistics...2.图表中数据(data)的具体表达法数据(data)在某一个时间段固定不变:fixed in time在一系列的时间段中转变:changes over time增加:increase/raise/rise/...减少:decrease/grow down/drop/fall/decline稳定:remain stable3.描写变化的形容词及副词rapid/rapidly,dramatic/dramatically,significant/significantly,sharp/sharplysteep/steeply,steady/steadily,gradual/gradually,slow/slowly,slight/slightly三、写作模板As (is) shown/indicated by the figure/in the table/graph/pie chart/chart,_____ has been increased/decreased significantly/steadily from _____ to_____. From the sharp decline/rise in the chart,it goes without saying that_____.There are at least two reasons accounting for / contributing to ____. On the one hand, _____ On the other hand, _____. _____is due to the fact that_____. In addition,_____is responsible for_____. Maybe there are other reasons to show. But it is generally believed that the above mentioned reasons are commonlyconvincing/persuasive.As far as I am concerned,I hold the view that_____. I am sure my opinion is both sound and well-grounded.四,作文范例1,最近你校对中学生的消费情况进行了调查。
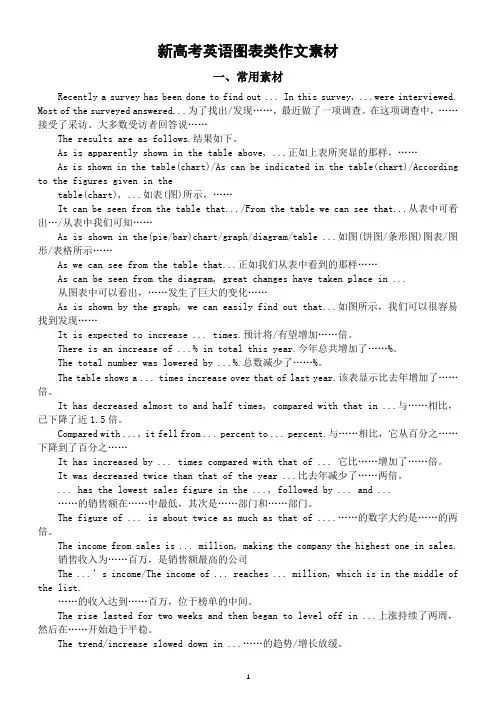
新高考英语图表类作文素材一、常用素材Recently a survey has been done to find out ... In this survey, ...were interviewed. Most of the surveyed answered...为了找出/发现……,最近做了一项调查。
在这项调查中,……接受了采访。
大多数受访者回答说……The results are as follows.结果如下。
As is apparently shown in the table above, ...正如上表所突显的那样,……As is shown in the table(chart)/As can be indicated in the table(chart)/According to the figures given in thetable(chart), ...如表(图)所示,……It can be seen from the table that.../From the table we can see that...从表中可看出…/从表中我们可知……As is shown in the(pie/bar)chart/graph/diagram/table ...如图(饼图/条形图)图表/图形/表格所示……As we can see from the table that...正如我们从表中看到的那样……As can be seen from the diagram, great changes have taken place in ...从图表中可以看出,……发生了巨大的变化……As is shown by the graph, we can easily find out that...如图所示,我们可以很容易找到发现……It is expected to increase ... times.预计将/有望增加……倍。
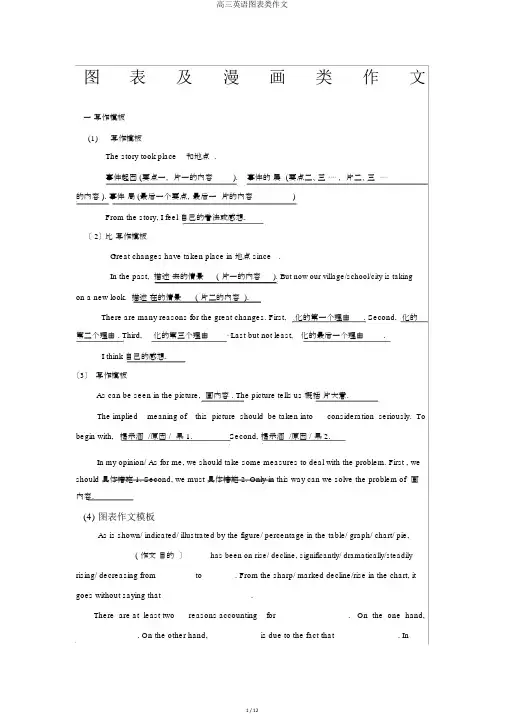
图表及漫画类作文一写作模板(1)写作模板The story took place 和地点 .事件起因 (要点一,片一的内容).事件的展(要点二、三⋯⋯ ,片二、三⋯⋯的内容 ). 事件局 (最后一个要点,最后一片的内容)From the story, I feel 自己的看法或感想.〔 2〕比写作模板Great changes have taken place in 地点 since .In the past, 描述去的情景(片一的内容). But now our village/school/city is takingon a new look. 描述在的情景(片二的内容 ).There are many reasons for the great changes. First,化的第一个理由. Second, 化的第二个理由 . Third,化的第三个理由⋯Last but not least,化的最后一个理由.I think 自己的感想.〔3〕写作模板As can be seen in the picture, 画内容 . The picture tells us 概括片大意.The implied meaning of this picture should be taken into consideration seriously. To begin with,揭示涵/原因/果1.Second, 揭示涵 /原因 /果 2.In my opinion/ As for me, we should take some measures to deal with the problem. First , we should 具体措施 1. Second, we must 具体措施 2. Only in this way can we solve the problem of 画内容.(4)图表作文模板As is shown/ indicated/ illustrated by the figure/ percentage in the table/ graph/ chart/ pie,_____________ ( 作文目的〕has been on rise/ decline, significantly/ dramatically/steadily rising/ decreasing from ________ to _______. From the sharp/ marked decline/rise in the chart, it goes without saying that ____________________.There are at least two reasons accounting for _______________. On the one hand, ______________. On the other hand, ___________ is due to the fact that ______________. Inaddition, ___________ is responsible for _______________. Maybe there are some other reasons to show________________. But it is generally believed that the above mentioned reasons are commonly convincing.As far as I am concerned, I hold the point of view that______________________.二范文〔1 〕组图组图通常呈现一件事情发生的始末,考生要根据几幅图的先后顺序介绍事情的全过程。
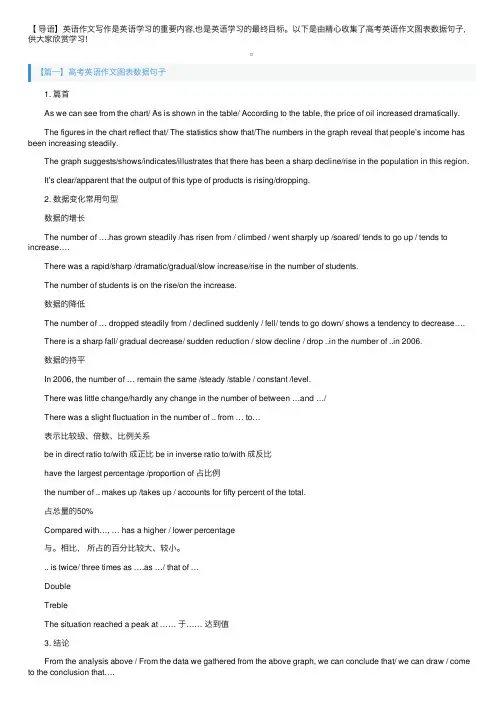
【导语】英语作⽂写作是英语学习的重要内容,也是英语学习的最终⽬标。
以下是由精⼼收集了⾼考英语作⽂图表数据句⼦,供⼤家欣赏学习!【篇⼀】⾼考英语作⽂图表数据句⼦ 1. 篇⾸ As we can see from the chart/ As is shown in the table/ According to the table, the price of oil increased dramatically. The figures in the chart reflect that/ The statistics show that/The numbers in the graph reveal that people’s income has been increasing steadily. The graph suggests/shows/indicates/illustrates that there has been a sharp decline/rise in the population in this region. It’s clear/apparent that the output of this type of products is rising/dropping. 2. 数据变化常⽤句型 数据的增长 The number of ….has grown steadily /has risen from / climbed / went sharply up /soared/ tends to go up / tends to increase…. There was a rapid/sharp /dramatic/gradual/slow increase/rise in the number of students. The number of students is on the rise/on the increase. 数据的降低 The number of … dropped steadily from / declined suddenly / fell/ tends to go down/ shows a tendency to decrease…. There is a sharp fall/ gradual decrease/ sudden reduction / slow decline / drop ..in the number of ..in 2006. 数据的持平 In 2006, the number of … remain the same /steady /stable / constant /level. There was little change/hardly any change in the number of between …and …/ There was a slight fluctuation in the number of .. from … to… 表⽰⽐较级、倍数、⽐例关系 be in direct ratio to/with 成正⽐ be in inverse ratio to/with 成反⽐ have the largest percentage /proportion of 占⽐例 the number of .. makes up /takes up / accounts for fifty percent of the total. 占总量的50% Compared with…, … has a higher / lower percentage 与。
英语图表作文模板及精选4篇(经典版)编制人:__________________审核人:__________________审批人:__________________编制单位:__________________编制时间:____年____月____日序言下载提示:该文档是本店铺精心编制而成的,希望大家下载后,能够帮助大家解决实际问题。
文档下载后可定制修改,请根据实际需要进行调整和使用,谢谢!并且,本店铺为大家提供各种类型的经典范文,如总结报告、合同协议、规章制度、条据文书、策划方案、心得体会、演讲致辞、教学资料、作文大全、其他范文等等,想了解不同范文格式和写法,敬请关注!Download tips: This document is carefully compiled by this editor. I hope that after you download it, it can help you solve practical problems. The document can be customized and modified after downloading, please adjust and use it according to actual needs, thank you!Moreover, our store provides various types of classic sample essays, such as summary reports, contract agreements, rules and regulations, doctrinal documents, planning plans, insights, speeches, teaching materials, complete essays, and other sample essays. If you want to learn about different sample formats and writing methods, please pay attention!英语图表作文模板及精选4篇学而不思则罔,思而不学则殆,以下是本店铺给大伙儿收集整理的英语图表作文模板及精选4篇,欢迎参考。
英语图表高中作文【优秀3篇】(经典版)编制人:__________________审核人:__________________审批人:__________________编制单位:__________________编制时间:____年____月____日序言下载提示:该文档是本店铺精心编制而成的,希望大家下载后,能够帮助大家解决实际问题。
文档下载后可定制修改,请根据实际需要进行调整和使用,谢谢!并且,本店铺为大家提供各种类型的经典范文,如工作资料、求职资料、报告大全、方案大全、合同协议、条据文书、教学资料、教案设计、作文大全、其他范文等等,想了解不同范文格式和写法,敬请关注!Download tips: This document is carefully compiled by this editor.I hope that after you download it, it can help you solve practical problems. The document can be customized and modified after downloading, please adjust and use it according to actual needs, thank you!In addition, this shop provides you with various types of classic model essays, such as work materials, job search materials, report encyclopedia, scheme encyclopedia, contract agreements, documents, teaching materials, teaching plan design, composition encyclopedia, other model essays, etc. if you want to understand different model essay formats and writing methods, please pay attention!英语图表高中作文【优秀3篇】There are differences between high school in China and that in the United States。
图表式作文It is obvious in the graphic/table that the rate/number/amount of Y has undergone dramatic changes. It has gone up/grown/fallen/dropped considerably in recent years (as X varies). At the point of X1, Y reaches its peak value of ...(多少).What is the reason for this change? Mainly there are ... (多少) reasons behind the situation reflected in the graphic/table. First of all, ...(第一个原因). More importantly, ...(第二个原因). Most important of all, ...(第三个原因).第一段:The table/graph/chart shows, as far as ______(is/are)concerned, _______________________.第二段:(第二段分为三种情况:1、一直上升;2、一直下降;3、一部分上升,一部分下降。
下面针对这三种情况进行结构模仿)。
1、(以1978年到1998年城镇乡村收入的稳步较长图为例)。
a.一直上升According to the figures show in the graph, we can see that________, had been increasing at a steady rate from the year of 1978 to 1998. In addition, during the period, ____________had raise from 349.9 Yuan to 5425 Yuan, morethan 5 times .Meanwhile, _______had also grown from 133.6 Yuan to 2100 Yuan.b. 一直下降According to the figures show in the graph, we can see that___________, had been decreasing at e steady rate from the year of 1978 to 1998. In addition, during the periond,____________had reduced from 349.9 Yuan to 5425 Yuan, more than 5 times .Meanwhile ,_______had also gone down 133.6 Yuan to 2100 Yuan.2、[以从1995年到1999年西安人的日常生活支出(食物、服装和娱乐)的变化为例]c. 一部分上升,一部分下降:According to the figures in the graph, we can see that__________had been increasing by 9% and 7%, respectively from the year of 1995 to1999. However,___________(the expenses on food)had been decline by30% ,during the same period. The statistics of rise and fall seem to exist in isolation but closely to one another. 第三段:There are several reasons for that phenomenon. On the hand, _____;On the other hand,_________,___________.注:横线部分为自己需填充的内容,这只是整篇文章的格式,红色横线部分视考题而定,可填充的内容经济类/发展类/旅游类/文化交流类:1. The policy of reformation and opening spreader widely in China should be taken into account firstly, when considering the reason for the steady increase of the citizen's income.2. The people of China has the spirit of working hard in order to improve their living.3. China's rapid economic development lays the base.4. In the past twenty five years, remarkable changes have taken place in China's tourism rank in the world.5. The economy of China has developed so fast in twenty years that China now becomes more and more important in the world.6. I'm confident that with the development of China the numbers of visitors and the foreign exchange earrings will certainly continues to increase in the future.7. With the rapid development of technology and the global economy ,the world is becoming international, cultural exchanges are becoming more and more frequent ,which is inevitably improving our mutual understanding and friendship with other countries.食品类:1、In order to live a healthy long life, we have to restrict our calorie intake eating the food with less fat.2、We should make our diet more nutritional and balance the calorie intake to enjoy a healthy life.3、To improve the bad situation, people should eat calcium-enriched food, such as fish,milk,beancurd and so on . 娱乐类/体育类:如看书/看电视1、We should make a balance between them to benefit themselves.2、The age in which we live now is an information one.3、People should go to the gym and take part in some sports, such as basketball, volleyball, swimming and so .All the exercise help people keep healthy.友谊类/文化交流类:1、People all over the world love and respect each other. The best way to show our love is to help others when they are in difficulties.2、Everyone should be encouraged required to try to be self-reliant.3、When one in trouble, others should help him.PS:经典句子:1、Scientists have warned that unless effective measures are taken, the problem of pollution will eventually get out of hand.2、For citizens ,they are supposed to conform to rules and regulations of the traffic.3、And the government should educate people in this respect ,which will draw people's attention of the serious problem.4、For drivers their speed should be restricted . Otherwise, they should be punished severely.5、It is time the anchorites concerned took proper steps the traffic problem.6、As long as each of us takes actions. I deeply believe the problem will be well resolved to an extend作文中可用的谚语或句子:As a saying goes:俗话说1、A good beginning is half done. 良好的开端是成功的一半。
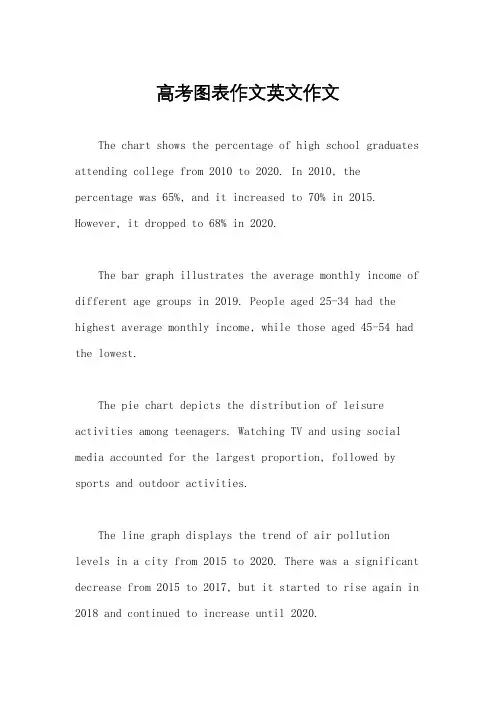
高考图表作文英文作文The chart shows the percentage of high school graduates attending college from 2010 to 2020. In 2010, the percentage was 65%, and it increased to 70% in 2015. However, it dropped to 68% in 2020.The bar graph illustrates the average monthly income of different age groups in 2019. People aged 25-34 had the highest average monthly income, while those aged 45-54 had the lowest.The pie chart depicts the distribution of leisure activities among teenagers. Watching TV and using social media accounted for the largest proportion, followed by sports and outdoor activities.The line graph displays the trend of air pollution levels in a city from 2015 to 2020. There was a significant decrease from 2015 to 2017, but it started to rise again in 2018 and continued to increase until 2020.The table compares the consumption of fast food in three different countries. The United States had the highest consumption, followed by the United Kingdom and Canada.The scatter plot shows the relationship between hours of study and exam scores. It indicates a positive correlation, as students who studied more hours tended to achieve higher scores.The diagram represents the sources of greenhouse gas emissions. It reveals that the majority of emissions come from the energy sector, followed by agriculture and industrial processes.The flow chart illustrates the process of recycling plastic bottles. It involves collection, sorting, cleaning, shredding, melting, and finally, the production of new plastic products.。
英语图表作文模板及范文(通用12篇)(经典版)编制人:__________________审核人:__________________审批人:__________________编制单位:__________________编制时间:____年____月____日序言下载提示:该文档是本店铺精心编制而成的,希望大家下载后,能够帮助大家解决实际问题。
文档下载后可定制修改,请根据实际需要进行调整和使用,谢谢!并且,本店铺为大家提供各种类型的经典范文,如工作总结、工作计划、合同协议、条据文书、策划方案、句子大全、作文大全、诗词歌赋、教案资料、其他范文等等,想了解不同范文格式和写法,敬请关注!Download tips: This document is carefully compiled by this editor. I hope that after you download it, it can help you solve practical problems. The document can be customized and modified after downloading, please adjust and use it according to actual needs, thank you!Moreover, our store provides various types of classic sample essays for everyone, such as work summaries, work plans, contract agreements, doctrinal documents, planning plans, complete sentences, complete compositions, poems, songs, teaching materials, and other sample essays. If you want to learn about different sample formats and writing methods, please stay tuned!英语图表作文模板及范文(通用12篇)英语图表作文模板及范文第1篇The table/chart diagram/graph shows (that)According to the table/chart diagram/graphAs (is)shown in the table/chart diagram/graphAs can be seen from the table/chart/diagram/graph/figures,figures/statistics shows (that)……It can be seen from the figures/statisticsWe can see from the figures/statisticsIt is clear from the figures/statisticsIt is apparent from the figures/statisticstable/chart/diagram/graph figures (that)……table/chart/diagram/graph shows/describes/illustrates图表类英语作文范文The past years have witnessed a mounting number of Chinese scholars returning from overseas.As is lively illustrated by the column chart, the number of returnees climbed from a mere thousand in 20XX to over thousand in 20XX, at an annual increase rate of around 50%.A multitude of factors may have led to the tendency revealed by the chart, but the following are the critical ones from my perspective.First and foremost, along with the development ofChinese economy and society, the number of Chinese studying abroad has been soaring in the past years, which has provided an eXpanding base for the number of returnees.In the second place, the government has enacted a series of preferential policies to attract overseas Chinese scholars back st but not least, the booming economy, science and technology in this country have generated more attative job opportunites for scholars returning from overseas.The waves of returnees will definitely contribute to this nation’s development, since they have brought back not only advanced science and technology but also pioneering concepts of education and management.With more scholars coming back from overseas, and with the concerted efforts of the whole nation,we have reasons to eXpect a faster rejuvenation of this country.更多培训课程:苏州个人提升英语更多学校信息:苏州虎丘区朗阁教育机构咨询电话:英语图表作文模板及范文第2篇Students tend to use computers more and more frequently nowadays.Reading this chart, we can find that the average number of hours a student spends on the computer per week has increased sharply.In 1990, it was less than 2 hours; and in 1995, it increased to almost 4 hours, and in 2000, the numbersoared to 20 hours.Obviously computers are becoming increasingly popular.There are several reasons for this change.First,computers facilitate us in more aspects of life.Also, the fast development of the Internet enlarges our demands for using computers.We can easily contact with friends in remote places through the Internet.Besides, the prices of computers are getting lower and lower,which enables more students to purchase them.However, there still eXist some problems, such as poor quality, out-of-date designs and so on.And how to balance the time between using computers and studying is also a serious problem.Anyhow, we will benefit a lot from computers as long as we use them properly.英语图表作文模板及范文第3篇As can be clearly seen from the graph/table/chart (As is shown in the table/figure), great changed have taken place in_______,The_________have/has skyrocketed/jumped from _____to _____.When it comes to the reasons for the changes,different people give different eXplanations.Here I shall just give a begin with, ______What’s more,___________, Last but not least, ________.While it is desirable that ___________,there are still some problems and difficulties for __________Firstly, __________,In addition, __________,In a word, __________.以上就是为大家整理的英语专四图表作文范文模板,希望能够对大家有所帮助。
图表描述类英语作文(4篇)图表描述类英语作文篇一The above bar chart informs us of the phenomenon that there exist some differences in additional working hours among diverse careers, especially between self-employed businessmen and civil servants. Self-employed businessmen spend nearly 2 hours per day in working overtime. On the contrary, civil servants’ additional working hours is the shortest, only less than 50 minutes per day. The overtime of scientific researchers, cultural and sports workers and teachers is 80 minutes, 70 minutes and 55 minutes respectively.Ample reasons can account for this phenomenon. Firstly, to make more profits, self-employed businessmen have to spend more time in manufacturing products, attracting customers, providing after-sale services and managing staff. Moreover, with the competition becoming fiercer, they have no alternative but to work overtime to avoid being eliminated by the market and their rivals. When it comes to civil servants, things have gone otherwise. Confronted with less risks as well as pressures and leading a steady and routine life, they don’t have to work overtime frequently.Working overtime is a two-bladed sword. Surely, it will generate considerable benefits. However, it will give rise to some damages, especially to our health. We should balance our work, life and health or we will eventually become a machine and salve of work.四级英语作文图表类篇二图片模板:It seems to me that the cartoon / drawing issending a message about ____________(图画内容),which reveals ____________(稍作评价).In myperspective of view, ____________ (表明个人观点)。
图表英语作文范文带翻译Title: The Importance of Graphs and Charts in Presenting Information。
Graphs and charts play a crucial role in conveying complex information effectively. In today's data-driven world, they are indispensable tools for analyzing trends, making comparisons, and illustrating relationships. This essay will explore the significance of graphs and charts in presenting information, examining their various types, and discussing their advantages and limitations.To begin with, graphs and charts offer a visual representation of data, which enhances understanding and interpretation. For instance, a line graph can illustrate changes over time, such as fluctuations in stock prices or temperature variations throughout the year. Similarly, a bar chart can depict comparisons between different categories, like sales figures for various products or the population distribution across different regions. Bypresenting data visually, graphs and charts simplify complex information, making it easier for audiences to grasp key insights at a glance.Moreover, graphs and charts facilitate data analysis by highlighting patterns and trends. Through visualizations, researchers and analysts can identify correlations, outliers, and other significant features in the data. For example, a scatter plot can reveal the relationship between two variables, such as the correlation between study hours and exam scores. By plotting data points on a graph, patterns emerge, enabling researchers to draw conclusions and make informed decisions based on evidence.Furthermore, graphs and charts aid in effective communication by presenting information in a clear and concise manner. In presentations or reports, visual aids like pie charts or histograms can convey key findings more compellingly than lengthy text or numerical tables. Visual representations engage audiences and help them absorb information more readily. Additionally, graphs and charts can be customized with colors, labels, and annotations toemphasize important points or differentiate between data sets, enhancing clarity and impact.However, it is essential to acknowledge the limitations of graphs and charts. While they excel at summarizing large datasets and identifying trends, they can also oversimplify complex phenomena. Misleading visualizations, such as distorted scales or truncated axes, can distort the true nature of the data and lead to erroneous conclusions. Therefore, it is crucial to critically evaluate the design and accuracy of graphs and charts to ensure they accurately represent the underlying information.In conclusion, graphs and charts are invaluable tools for presenting information effectively in various fields, from scientific research to business analytics. They offer visual clarity, facilitate data analysis, and enhance communication by simplifying complex concepts. However, it is essential to use them judiciously and critically evaluate their accuracy to avoid misinterpretation. Ultimately, when used appropriately, graphs and charts are powerful instruments for conveying insights and drivinginformed decision-making.标题,图表在呈现信息中的重要性。
英语高考图表作文范文The bar chart shows the percentage of different age groups participating in regular physical exercise. As we can see, the age group of 18-24 has the highest percentage, with over 70% of people engaging in regular physical exercise. On the other hand, the age group of 65 and above has the lowest percentage, with only around 20% of people participating in regular physical exercise.The line graph illustrates the change in the average temperature over the course of a year. It is evident that there is a clear seasonal pattern, with the temperature peaking in the summer months and dropping to its lowest point in the winter. The difference between the highest and lowest temperatures is quite significant, indicating a wide range of temperature fluctuations throughout the year.The pie chart displays the distribution of household expenses in a typical family. It is apparent that the largest portion of the expenses goes towards housing,accounting for nearly 40% of the total expenditure. This is followed by transportation and food, each making up around 20% of the expenses. Other categories, such as healthcare, entertainment, and education, make up the remaining 20% of the household expenses.The table provides information on the top 10 countries with the highest GDP per capita. It is notable that Luxembourg ranks first, with a GDP per capita of over $100,000, followed by Switzerland and Norway. On the other hand, countries like India and Indonesia have significantly lower GDP per capita, with values below $10,000.In conclusion, the various types of graphs and charts provide valuable insights into different aspects of society and the economy. By analyzing and interpreting these visual representations, we can gain a better understanding of the world around us.。
英语作文图表分析范文(汇总30篇)(经典版)编制人:__________________审核人:__________________审批人:__________________编制单位:__________________编制时间:____年____月____日序言下载提示:该文档是本店铺精心编制而成的,希望大家下载后,能够帮助大家解决实际问题。
文档下载后可定制修改,请根据实际需要进行调整和使用,谢谢!并且,本店铺为大家提供各种类型的经典范文,如工作总结、工作计划、合同协议、条据文书、策划方案、句子大全、作文大全、诗词歌赋、教案资料、其他范文等等,想了解不同范文格式和写法,敬请关注!Download tips: This document is carefully compiled by this editor. I hope that after you download it, it can help you solve practical problems. The document can be customized and modified after downloading, please adjust and use it according to actual needs, thank you!Moreover, our store provides various types of classic sample essays for everyone, such as work summaries, work plans, contract agreements, doctrinal documents, planning plans, complete sentences, complete compositions, poems, songs, teaching materials, and other sample essays. If you want to learn about different sample formats and writing methods, please stay tuned!英语作文图表分析范文(汇总30篇)英语作文图表分析范文第1篇图表类写作模版(1)模版1According to the chart / graph / diagram / table, we clearly learn that _________.As early as _________,___________.Then,_________.Last,__________.In contrast, by _________,__________.There are many reasons accounting for _________.Firstly, _________.Secondly,__________.Finally,_________.As a result,_________.As far as I am concerned,_________.For one thing,__________.For another,________.In brief, I hold that__________.(2)模版2What is shown in the chart / graph / diagram / table above indicates that in recent years, more and more people payattention to _________.The number of those who _________has increased ________,and furthermore,____________.There are two factors responsible for the changes.In the first place,_________.Moreover,__________.Yet, it is noticeable that __________.From the analysis, we can safely draw the conclusion that__________.It is possible that in the future,the tendency will__________.(3)模版3As is shown in the chart / graph / diagram / table above,__________has charged drastically in the past _________.While ___________,now the percentage of__________is __________.Meanwhile,the number of _________has soared up to ________.There are mainly two possible reasons contributing to the rapid changes.The first is that _________.Secondly,__________.In my point of view, the changes have a great influence on _________.At the same time,_______.To sum up ,_________.英语作文图表分析范文第2篇1、图形种类及概述法:泛指一份数据图表: a data graph/chart/diagram/illustration/table饼图:pie chart直方图或柱形图:bar chart / histogram趋势曲线图:line chart / curve diagram表格图:table流程图或过程图:flow chart / sequence diagram程序图:processing/procedures diagram2、常用的描述用法The table/chart diagram/graph shows (that)According to the table/chart diagram/graphAs (is)shown in the table/chart diagram/graphAs can be seen from the table/chart/diagram/graph/figures,figures/statistics shows (that)……It can be seen from the figures/statisticsWe can see from the figures/statisticsIt is clear from the figures/statisticsIt is apparent from the figures/statisticstable/chart/diagram/graph figures (that)……table/chart/diagram/graph shows/describes/illustrates how……3、图表中的数据(Data)具体表达法数据(Data)在某一个时间段固定不变:fiXed in time在一系列的时间段中转变:changes over time持续变化的data在不同情况下:增加:increase / raise / rise / go up ……减少:decrease / grow down / drop / fall ……波动:fluctuate / rebound / undulate / wave ……稳定:remain stable / stabilize / level off ……最常用的两种表达法:动词+副词形式(Verb+Adverb form)形容词+名词形式(Adjective+Noun form)英语作文图表分析范文第3篇雅思考试学术类图表作文分析考试学术类图表作文要求考生观察一幅图表并用自己的语言呈现出图表中的信息。
高考英语写作素材之作文精选:图表类(共16篇)精选X文一:最近,你作为研究性学习课题组的成员就高中英语教材的看法在同学中间开展了一次调查,调查的结果如下:请根据以上调查结果,写一120左右的调查报告。
报告的开头已给出。
I recently surveyed my classmates about their views on the new English textbook…One possible version:I recently surveyed my classmates about their views on the new English textbook. According to the survey, 80% of the students were quite satisfied with it, while 15% disliked it and 5% had no opinion. Students who liked it said the pictures with the texts were very attractive, which greatly aroused their interests in learning. Moreover, the book was very interesting, covering many hot topics and providing lots of cultural knowledge of the world. However, students who disliked it plained there were too many new words and difficult sentences, making the texts difficult to understand. In conclusion, the new English textbook has helped most students improve their English enormously.精选X文二:面对中学生“出国热”,社会对此有不同的看法。
高考图表作文英文作文下载温馨提示:该文档是我店铺精心编制而成,希望大家下载以后,能够帮助大家解决实际的问题。
文档下载后可定制随意修改,请根据实际需要进行相应的调整和使用,谢谢!并且,本店铺为大家提供各种各样类型的实用资料,如教育随笔、日记赏析、句子摘抄、古诗大全、经典美文、话题作文、工作总结、词语解析、文案摘录、其他资料等等,如想了解不同资料格式和写法,敬请关注!Download tips: This document is carefully compiled by theeditor. I hope that after you download them,they can help yousolve practical problems. The document can be customized andmodified after downloading,please adjust and use it according toactual needs, thank you!In addition, our shop provides you with various types ofpractical materials,such as educational essays, diaryappreciation,sentence excerpts,ancient poems,classic articles,topic composition,work summary,word parsing,copyexcerpts,other materials and so on,want to know different data formats andwriting methods,please pay attention!The High School Entrance Examination (HSEE) is an important event in the lives of Chinese students. It is a highly competitive exam that determines their future educational opportunities. The HSEE is a topic of great interest and debate among students, parents, and educators.One aspect of the HSEE that is often discussed is the pressure it puts on students. Many students feel immense pressure to perform well on the exam, as it is seen as a reflection of their abilities and potential. The competition is fierce, and the stakes are high. Students spend countless hours studying and preparing for the exam, often sacrificing their free time and social lives. The pressure can be overwhelming, leading to stress, anxiety, and even depression.Another aspect of the HSEE that is frequently debatedis its fairness. Critics argue that the exam is biased towards students from privileged backgrounds, who haveaccess to better resources and preparation. They believethat the exam should be more inclusive and take intoaccount factors other than academic performance, such as extracurricular activities and personal achievements. Proponents of the exam, on the other hand, argue that it is a merit-based system that rewards hard work and intelligence.The HSEE also has a significant impact on the education system in China. Schools and teachers are judged based on their students' performance on the exam, which can lead toa narrow focus on exam preparation and rote learning. This, in turn, can stifle creativity and critical thinking skills among students. Critics argue that the exam should be reformed to encourage a more holistic approach to education, one that values creativity, problem-solving, and independent thinking.Despite its flaws, the HSEE is seen by many as a necessary evil. It is believed to be a fair and objective way to assess students' abilities and determine theirfuture educational opportunities. It provides a levelplaying field for students from different backgrounds and regions. However, there is a growing consensus that the exam needs to be reformed to address its shortcomings and better serve the needs of students.In conclusion, the High School Entrance Examination is a topic of great importance and debate in China. It puts immense pressure on students, raises questions of fairness, and has a significant impact on the education system. While it is seen by many as a necessary evil, there is a growing call for reform to address its flaws and better serve the needs of students.。