
利用Matlab绘制Word文档中的函数曲线
- 格式:pdf
- 大小:2.15 MB
- 文档页数:2

matlab里的模糊工具箱绘制隶属度函数曲线导入到word的方法在fuzzy logic toolbox里有fuzzy membership function可以编辑隶属度函数,非常方便,但是我们写论文一般要把相应的曲线导入到word里,怎样将隶属度函数曲线导入到word里呢?本人也苦苦的寻找了好久。
方法如下:先看看matlab帮助怎么说的:plotmfPlot all of the membership functions for a given variableSyntaxplotmf(fismat,varType,varIndex)DescriptionThis function plots all of the membership functions in the FIS called fismat associated with a given variable whose type and index are respectively given b y (varType 'input'or 'o u tpu t'), and varIndex. This function can also be used with the MATLAB function, subplot.Examplesa = readfis('t ipper');plotmf(a,'inpu t',1)看明白了吧?原来强大的matlab给我们提供了这个函数给我们用,plotmf(模糊名,‘输入还是输出’,第几个输入或输出)。
就可以画出来图像,然后和平时的方法一样再进行edit》copy figure就可以了。
使用MATLAB绘图时,如何保存高清矢量图
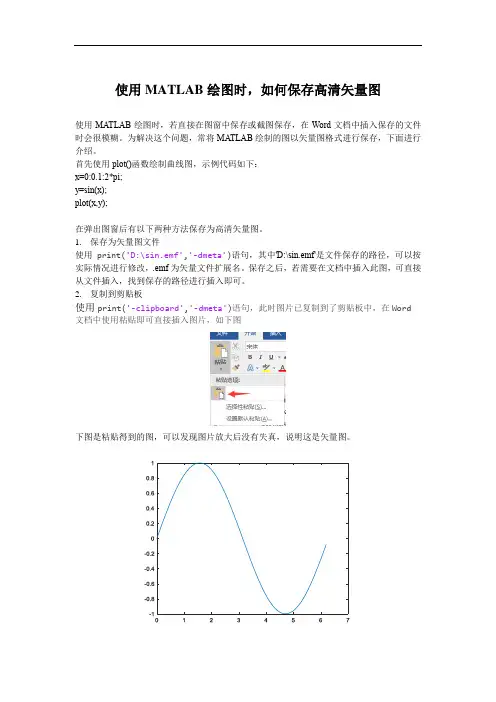
使用MA TLAB绘图时,若直接在图窗中保存或截图保存,在Word文档中插入保存的文件时会很模糊。
为解决这个问题,常将MA TLAB绘制的图以矢量图格式进行保存,下面进行介绍。
首先使用plot()函数绘制曲线图,示例代码如下:
x=0:0.1:2*pi;
y=sin(x);
plot(x,y);
在弹出图窗后有以下两种方法保存为高清矢量图。
1.保存为矢量图文件
使用print('D:\sin.emf','-dmeta')语句,其中'D:\sin.emf'是文件保存的路径,可以按实际情况进行修改,.emf为矢量文件扩展名。
保存之后,若需要在文档中插入此图,可直接从文件插入,找到保存的路径进行插入即可。
2.复制到剪贴板
使用print('-clipboard','-dmeta')语句,此时图片已复制到了剪贴板中,在Word 文档中使用粘贴即可直接插入图片,如下图
下图是粘贴得到的图,可以发现图片放大后没有失真,说明这是矢量图。

fun ctio n ceshi_Word%利用MATLAB生成Word文档% ceshi_Word%% Copyright 2009 - 2010 xiezhh.% $Revisio n: 1.0.0.0 $ $Date: 2009/12/14 12:37:00 $%设定测试Word文件名和路径测试.doc'];%判断Word是否已经打开,若已打开,就在打开的Word中进行操作,否则就打开try%若Word服务器已经打开,返回其句柄WordWord = actxGetR unnin gServer('Word.Applicati on');catch%创建一个Microsoft Word服务器,返回句柄WordWord = actxserver('Word.Applicatio n');en d;%设置Word属性为可见Word.Visible = 1; % 或set(Word, 'Visible', 1);%若测试文件存在,打开该测试文件,否则,新建一个文件,并保存,文件名为测试if exist(filespec_user,'file');Docume nt = Word.Docume nts.Ope n(filespec_user);% Docume nt = in voke(Word.Docume nts,'Ope n',filespec_user);elseDocume nt = Word.Docume nts.Add;% Docume nt = in voke(Word.Docume nts, 'Add');Docume nt.SaveAs(filespec_user);endContent = Document.Content; % 返回Content 接口句柄Selection = Word.Selection; % 返回Selection 接口句柄Paragraphformat = Selection.ParagraphFormat; % 返回ParagraphFormat 接口句柄%页面设置Docume nt.PageSetup.TopMarg in = 60;Docume nt.PageSetup.BottomMarg in = 45;Docume nt.PageSetup.LeftMarg in = 45;Docume nt.PageSetup.RightMarg in = 45;%设定文档内容的起始位置和标题Con te nt.Start = 0; %设置文档内容的起始位置Word .doc%上边距60磅%下边距45磅%左边距45磅%右边距45磅title ='试卷分析';Conten t.Text = title;%输入文字内容 Conten t.F on t.Size =16 ; %设置字号为16 Co nten t.Fo nt.Bold =4 ; %字体加粗 Con te nt.P aragraphs.Alig nment = 'wdAlig nParagraphCe nter :Select ion. TypeParagraph; xueqi = ' ( 2009— 2010 学年第一学期)’;Selection.Text = xueqi; % 在当前位置输入文字内容 Selectio n.Fo nt.Size = 12; % 设置字号为 12 Selectio n.Fo nt.Bold = 0; % 字体不加粗Tables = Docume nt.Tables.Add(Selectio n.Ra nge,12,9); %返回第1个表格的句柄DTI = Document.Tables.ltem(1); % 或 DTI = Tables; %设置表格边框DTI.Borders.OutsideLi neStyle = 'wdLi neStyleSi ngle'; DTI.Borders.OutsideLi neWidth = 'wdL in eWidth150pt'; DTI.Borders.I nsideLi neStyle = 'wdLi neStyleSi ngle'; DTI.Borders.I nsideLi neWidth = 'wdL in eWidth150pt'; DTI.Rows.Alig nment = 'wdAlig nRowCe nter';DTI.Rows.ltem(8).Borders.ltem(1).Li neStyle = 'wdL in eStyleNo ne'; DTI.Rows.ltem(8).Borders.lte m( 3).Li neStyle = 'wdL in eStyleNo ne';DTI.Rows.Item(11).Borders.Item(1).Li neStyle = 'wdLi neStyleNo ne'; DTI.Rows.ltem(11).Borders.ltem(3).Li neStyle = 'wdLi neStyleNo ne'; %设置表格列宽和行高column_width = [53.7736,85.1434,53.7736,35.0094,...35.0094,76.6981,55.1887,52.9245,54.9057];% 定义列宽向量row_height = [28.5849,28.5849,28.5849,28.5849,25.4717,25.4717,...32.8302,312.1698,17.8302,49.2453,14.1509,18.6792]; % 定义行高向量%通过循环设置表格每列的列宽 for i = 1:9DTI.Colu mn s.Item(i).Width = colu mn _width(i);%居中对齐Selectio n.Start = Conten t.e nd; %设定下面内容的起始位置%回车,另起一段 Selectio n.MoveDow n;%光标下移(取消选中)paragraphformat.Alig nment = 'wdAlig nParagraphCe nter : Select ion. TypeParagraph; %回车,另起一段 Select ion. TypeParagraph;%回车,另起一段Selection.Font.Size = 10.5; % 设置字号为 10.5%居中对齐%在光标所在位置插入一个12行9列的表格end%通过循环设置表格每行的行高for i = 1:12DTI.Rows.ltem(i).Height = row_height(i);end%通过循环设置每个单元格的垂直对齐方式for i = 1:12for j = 1:9DTI.Cell(i,j).VerticalAlig nment = 'wdCellAlig nV erticalCe nter'; endend%合并单元格DTI.Cell(1,4).Merge(DTI.Cell(1,5));DTI.Cell(2, 4).Merge(DTI.Cell(2, 5));DTI.Cell(3, 4).Merge(DTI.Cell(3, 5));DTI.Cell(4, 4).Merge(DTI.Cell(4, 5));DTI.Cell(5, 2).Merge(DTI.Cell(5, 5));DTI.Cell(5, 3).Merge(DTI.Cell(5, 6));DTI.Cell(6, 2).Merge(DTI.Cell(6, 5));DTI.Cell(6, 3).Merge(DTI.Cell(6, 6));DTI.Cell(5, 1).Merge(DTI.Cell(6, 1));DTI.Cell(7, 1).Merge(DTI.Cell(7, 9));DTI.Cell(8, 1).Merge(DTI.Cell(8, 9));DTI.Cell(9, 1).Merge(DTI.Cell(9, 3));DTI.Cell(9, 2).Merge(DTI.Cell(9, 3));DTI.Cell(9, 3).Merge(DTI.Cell(9, 4));DTI.Cell(9, 4).Merge(DTI.Cell(9, 5));DTI.Cell(10, 1).Merge(DTI.Cell(10, 9));DTI.Cell(11,5).Merge(DTI.Cell(11,9));DTI.Cell(12, 5).Merge(DTI.Cell(12, 9));DTI.Cell(11, 1).Merge(DTI.Cell(12, 4));Selection.Start = Content.end; % 设置光标位置在文档内容的结尾Select ion. TypeParagraph; %回车,另起一段Selection.Text ='主管院长签字:年月日';%输入文字内容Paragraphformat.Alig nment = 'wdAlig nParagraphRight'; % 右对齐Selection.MoveDown; % 光标下移%写入表格内容DTI.Cell(1,1).Range.Text ='课程名称';DTI.Cell(1,3).Range.Text ='课程号';DTI.Cell(1,5).Range.Text ='任课教师学院’;DTI.Cell(1,7).Range.Text ='任课教师 DTI.Cell(2,1).Range.Text ='授课班级 DTI.Cell(2,3).Range.Text ='考试日期 DTI.Cell(2,5).Range.Text ='应考人数 DTI.Cell(2,7).Range.Text ='实考人数 DTI.Cell(3,1).Range.Text ='出卷方式 DTI.Cell(3,3).Range.Text ='阅卷方式'; DTI.Cell(3,5).Range.Text ='选用试卷 A/B : DTI.Cell(3,7).Range.Text ='考试时间'; DTI.Cell(4,1).Range.Text ='考试方式'; DTI.Cell(4,3).Range.Text ='平均分'; DTI.Cell(4,5).Range.Text ='不及格人数 DTI.Cell(4,7).Range.Text ='及格率'; DTI.Cell(5,1).Range.Text ='成绩分布'; DTI.Cell(5,2).Range.Text = '90 分以上 DTI.Cell(5,3).Ra nge.Text = '80---89 分 DTI.Cell(6,2).Ra nge.Text = '70--79 分 DTI.Cell(6,3).Ra nge.Text = '60---69 分DTI.Cell(7,1).Ra nge.Text =['试卷分析(含是否符合教学大纲、难度、知识覆'盖面、班级分数分布分析、学生答题存在的共性问题与知识掌握情况、教学中 '存在的问题及改进措施等内容) '];DTI.Cell(7,1).Ra nge.ParagraphFormat.Alig nment = 'wdAlig nParagraphLeft :DTI.Cell(9,2).Range.Text ='签字:: DTI.Cell(9,4).Range.Text ='年 月 日'; DTI.Cell(10,1).Range.Text ='教研室审阅意见:’;DTI.Cell(10,1).Ra nge.ParagraphFormat.Alig nment = 'wdAlig nParagraphLeft'; DTI.Cell(10,1).VerticalAlig nment = 'wdCellAlig nVerticalTop'; DTI.Cell(11,2).Range.Text ='教研室主任(签字):年 月 日';DTI.Cell(11,2).Ra nge.ParagraphFormat.Alig nment = 'wdAlig nParagraphLeft'; DTI.Cell(8,1).Ra nge.P aragraphFormat.Alig nment = 'wdAlig nParagraphLeft'; DTI.Cell(8,1).VerticalAlig nment = 'wdCellAlig nV erticalTop'; DTI.Cell(9,2).Borders.ltem(2).L in eStyle = 'wdLi neStyleN on e'; DTI.Cell(9,2).Borders.ltem(4).L in eStyle = 'wdLi neStyleN on e'; DTI.Cell(9,3).Borders.Item(4).L in eStyle = 'wdLi neStyleN on e'; DTI.Cell(11,1).Borders.Item(4).Li neStyle = 'wdL in eStyleNo ne'; %如果当前工作文档中有图形存在,通过循环将图形全部删除Shape = Document.Shapes; % 返回 Shapes 接口的句柄 ShapeCount = Shape.Count; % 返回文档中 Shape 对象的个数 if ShapeCou nt ~= 0;for i = 1:ShapeCo unt;Shape.Item(1).Delete; % 删除第 1 个 Shape 对象 en d;en d;%产生标准正态分布随机数,画直方图,并设置图形属性人占%'; 人占 %'; 人占%'; 人占%';zft = figure(' un its',' no rmalized','positi on',...[0.280469 0.553385 0.428906 0.251302],'visible','off); % 新建图形窗口,设为不可见set(gca,'position',[0.1 0.2 0.85 0.75]); % 设置坐标系的位置和大小data = normrnd(0,1,1000,1); % 产生标准正态分布随机数hist(data); %绘制标准正态分布随机数的频数直方图grid on; % 添加参考网格xlabel('考试成绩'); %为X轴加标签ylabel('人数'); %为Y轴加标签%将图形复制到粘贴板hgexport(zft, '-clipboard');%将图形粘贴到当前文档里(表格的第8行第1列的单元格里),并设置图形版式为浮于文字上方% Select ion .Ra nge.PasteSpecial;DTI.Cell(8,1).Ra nge. Paragraphs.ltem(1).Ra nge. PasteSpecial;Shape.ltem(1).WrapFormat.Type = 3;Shape.ltem(1).ZOrder('msoBringlnFrontOfText'); % 设置图片叠放次序为浮于文字上方delete(zft); %删除图形句柄Document.ActiveWindow.ActivePane.View.Type = 'wdPrintView'; % 设置视图方式为页面Document.Save; % 保存文档口Love is n ot a maybe thing. You know whe n you love some one.。
