数学建模美赛写作各部分模板
- 格式:doc
- 大小:113.50 KB
- 文档页数:27
数模美国赛总结部分英文第一篇:数模美国赛总结部分英文Conclusions1、As our team set out to come up with a strategy on what would be the most efficient way to 我们提出了一种最有效的方法去解决……2、The first aspect that we took into major consideration was…….Other important findings through research made it apparent that the standard 首先我们考虑到……,其他重要的是我们通过研究使4、We have used mathematical modeling in a……to analyze some of the factors associated with such an activity。
为了分析这类问题的一些因素,我们运用数学模型……5、This “cannon problem” has been used in many forms in many differential equations courses in the Department of Mathematical Sciences for several years.这些年这些问题已经以不同的微分方程形式运用于自然科学部门。
6、In conclusion our team is very certain that the methods we came up with in 总之,我们很确定我们提出的方法7、We already know how well our results worked for…… 我们已经知道我们结果对……8、Now that the problem areas have been defined, we offer some ways to reduce the effect of these problems.既然已经定义了结果,我们提出一些方法减少对问题的影响。
The Keep-Right-Except-To-Pass RuleSummaryAs for the first question, it provides a traffic rule of keep right except to pass, requiring us to verify its effectiveness. Firstly, we define one kind of traffic rule different from the rule of the keep right in order to solve the problem clearly; then, we build a Cellular automaton model and a Nasch model by collecting massive data; next, we make full use of the numerical simulation according to several influence factors of traffic flow; At last, by lots of analysis of graph we obtain, we indicate a conclusion as follow: when vehicle density is lower than 0.15, the rule of lane speed control is more effective in terms of the factor of safe in the light traffic; when vehicle density is greater than 0.15, so the rule of keep right except passing is more effective In the heavy traffic.As for the second question, it requires us to testify that whether the conclusion we obtain in the first question is the same apply to the keep left rule. First of all, we build a stochastic multi-lane traffic model; from the view of the vehicle flow stress, we propose that the probability of moving to the right is 0.7and to the left otherwise by making full use of the Bernoulli process from the view of the ping-pong effect, the conclusion is that the choice of the changing lane is random. On the whole, the fundamental reason is the formation of the driving habit, so the conclusion is effective under the rule of keep left.As for the third question, it requires us to demonstrate the effectiveness of the result advised in the first question under the intelligent vehicle control system. Firstly, taking the speed limits into consideration, we build a microscopic traffic simulator model for traffic simulation purposes. Then, we implement a METANET model for prediction state with the use of the MPC traffic controller. Afterwards, we certify that the dynamic speed control measure can improve the traffic flow .Lastly neglecting the safe factor, combining the rule of keep right with the rule of dynamical speed control is the best solution to accelerate the traffic flow overall.Key words:Cellular automaton model Bernoulli process Microscopic traffic simulator model The MPC traffic controlContentContent (2)1. Introduction (3)2. Analysis of the problem (3)3. Assumption (3)4. Symbol Definition (3)5. Models (4)5.1 Building of the Cellular automaton model (4)5.1.1 Verify the effectiveness of the keep right except to pass rule (4)5.1.2 Numerical simulation results and discussion (5)5.1.3 Conclusion (8)5.2 The solving of second question (8)5.2.1 The building of the stochastic multi-lane traffic model (9)5.2.2 Conclusion (9)5.3 Taking the an intelligent vehicle system into a account (9)5.3.1 Introduction of the Intelligent Vehicle Highway Systems (9)5.3.2 Control problem (9)5.3.3 Results and analysis (9)5.3.4 The comprehensive analysis of the result (10)6. Improvement of the model (11)6.1 strength and weakness (11)6.1.1 Strength (11)6.1.2 Weakness (11)6.2 Improvement of the model (11)7. Reference (13)1. IntroductionAs is known to all, it’s essential for us to drive automobiles, thus the driving rules is crucial important. In many countries like USA, China, drivers obey the rules which called “The Keep-Right-Except-To-Pass (that is, when driving automobiles, the rule requires drivers to drive in the right-most unless theyare passing another vehicle)”.2. Analysis of the problemFor the first question, we decide to use the Cellular automaton to build models,then analyze the performance of this rule in light and heavy traffic. Firstly,we mainly use the vehicle density to distinguish the light and heavy traffic; secondly, we consider the traffic flow and safe as the represent variable which denotes the light or heavy traffic; thirdly, we build and analyze a Cellular automaton model; finally, we judge the rule through two different driving rules,and then draw conclusions.3. AssumptionIn order to streamline our model we have made several key assumptions●The highway of double row three lanes that we study can representmulti-lane freeways.●The data that we refer to has certain representativeness and descriptive●Operation condition of the highway not be influenced by blizzard oraccidental factors●Ignore the driver's own abnormal factors, such as drunk driving andfatigue driving●The operation form of highway intelligent system that our analysis canreflect intelligent system●In the intelligent vehicle system, the result of the sampling data hashigh accuracy.4. Symbol Definitioni The number of vehiclest The time5. ModelsBy analyzing the problem, we decided to propose a solution with building a cellular automaton model.5.1 Building of the Cellular automaton modelThanks to its simple rules and convenience for computer simulation, cellular automaton model has been widely used in the study of traffic flow in recent years. Let )(t x i be the position of vehicle i at time t , )(t v i be the speed of vehicle i at time t , p be the random slowing down probability, and R be the proportion of trucks and buses, the distance between vehicle i and the front vehicle at time t is:1)()(1--=-t x t x gap i i i , if the front vehicle is a small vehicle.3)()(1--=-t x t x gap i i i , if the front vehicle is a truck or bus.5.1.1 Verify the effectiveness of the keep right except to pass ruleIn addition, according to the keep right except to pass rule, we define a new rule called: Control rules based on lane speed. The concrete explanation of the new rule as follow:There is no special passing lane under this rule. The speed of the first lane (the far left lane) is 120–100km/h (including 100 km/h);the speed of the second lane (the middle lane) is 100–80km8/h (including80km/h);the speed of the third lane (the far right lane) is below 80km/ h. The speeds of lanes decrease from left to right.● Lane changing rules based lane speed controlIf vehicle on the high-speed lane meets control v v <, ),1)(min()(max v t v t gap i f i +≥, safe b i gap t gap ≥)(, the vehicle will turn into the adjacent right lane, and the speed of the vehicle after lane changing remains unchanged, where control v is the minimum speed of the corresponding lane.● The application of the Nasch model evolutionLet d P be the lane changing probability (taking into account the actual situation that some drivers like driving in a certain lane, and will not takethe initiative to change lanes), )(t gap f i indicates the distance between the vehicle and the nearest front vehicle, )(t gap b i indicates the distance between the vehicle and the nearest following vehicle. In this article, we assume that the minimum safe distance gap safe of lane changing equals to the maximum speed of the following vehicle in the adjacent lanes.Lane changing rules based on keeping right except to passIn general, traffic flow going through a passing zone (Fig. 5.1.1) involves three processes: the diverging process (one traffic flow diverging into two flows), interacting process (interacting between the two flows), and merging process (the two flows merging into one) [4].Fig.5.1.1 Control plan of overtaking process(1) If vehicle on the first lane (passing lane) meets ),1)(min()(max v t v t gap i f i +≥ and safe b i gap t gap ≥)(, the vehicle will turn into the second lane, the speed of the vehicle after lane changing remains unchanged.5.1.2 Numerical simulation results and discussionIn order to facilitate the subsequent discussions, we define the space occupation rate as L N N p truck CAR ⨯⨯+=3/)3(, where CAR N indicates the number ofsmall vehicles on the driveway,truck N indicates the number of trucks and buses on the driveway, and L indicates the total length of the road. The vehicle flow volume Q is the number of vehicles passing a fixed point per unit time,T N Q T /=, where T N is the number of vehicles observed in time duration T .The average speed ∑∑⨯=T it i a v T N V 11)/1(, t i v is the speed of vehicle i at time t . Take overtaking ratio f p as the evaluation indicator of the safety of traffic flow, which is the ratio of the total number of overtaking and the number of vehicles observed. After 20,000 evolution steps, and averaging the last 2000 steps based on time, we have obtained the following experimental results. In order to eliminate the effect of randomicity, we take the systemic average of 20 samples [5].Overtaking ratio of different control rule conditionsBecause different control conditions of road will produce different overtaking ratio, so we first observe relationships among vehicle density, proportion of large vehicles and overtaking ratio under different control conditions.(a) Based on passing lane control (b) Based on speed control Fig.5.1.3Fig.5.1.3 Relationships among vehicle density, proportion of large vehicles and overtaking ratio under different control conditions.It can be seen from Fig. 5.1.3:(1) when the vehicle density is less than 0.05, the overtaking ratio will continue to rise with the increase of vehicle density; when the vehicle density is larger than 0.05, the overtaking ratio will decrease with the increase of vehicle density; when density is greater than 0.12, due to the crowding, it willbecome difficult to overtake, so the overtaking ratio is almost 0.(2) when the proportion of large vehicles is less than 0.5, the overtaking ratio will rise with the increase of large vehicles; when the proportion of large vehicles is about 0.5, the overtaking ratio will reach its peak value; when the proportion of large vehicles is larger than 0.5, the overtaking ratio will decrease with the increase of large vehicles, especially under lane-based control condition s the decline is very clear.● Concrete impact of under different control rules on overtaking ratioFig.5.1.4Fig.5.1.4 Relationships among vehicle density, proportion of large vehicles and overtaking ratio under different control conditions. (Figures in left-hand indicate the passing lane control, figures in right-hand indicate the speed control. 1f P is the overtaking ratio of small vehicles over large vehicles, 2f P is the overtaking ratio of small vehicles over small vehicles, 3f P is the overtaking ratio of large vehicles over small vehicles, 4f P is the overtaking ratio of large vehicles over large vehicles.). It can be seen from Fig. 5.1.4:(1) The overtaking ratio of small vehicles over large vehicles under passing lane control is much higher than that under speed control condition, which is because, under passing lane control condition, high-speed small vehicles have to surpass low-speed large vehicles by the passing lane, while under speed control condition, small vehicles are designed to travel on the high-speed lane, there is no low- speed vehicle in front, thus there is no need to overtake. ● Impact of different control rules on vehicle speedFig. 5.1.5 Relationships among vehicle density, proportion of large vehicles and average speed under different control conditions. (Figures in left-hand indicates passing lane control, figures in right-hand indicates speed control.a X is the average speed of all the vehicles, 1a X is the average speed of all the small vehicles, 2a X is the average speed of all the buses and trucks.).It can be seen from Fig. 5.1.5:(1) The average speed will reduce with the increase of vehicle density and proportion of large vehicles.(2) When vehicle density is less than 0.15,a X ,1a X and 2a X are almost the same under both control conditions.Effect of different control conditions on traffic flowFig.5.1.6Fig. 5.1.6 Relationships among vehicle density, proportion of large vehicles and traffic flow under different control conditions. (Figure a1 indicates passing lane control, figure a2 indicates speed control, and figure b indicates the traffic flow difference between the two conditions.It can be seen from Fig. 5.1.6:(1) When vehicle density is lower than 0.15 and the proportion of large vehicles is from 0.4 to 1, the traffic flow of the two control conditions are basically the same.(2) Except that, the traffic flow under passing lane control condition is slightly larger than that of speed control condition.5.1.3 ConclusionIn this paper, we have established three-lane model of different control conditions, studied the overtaking ratio, speed and traffic flow under different control conditions, vehicle density and proportion of large vehicles.5.2 The solving of second question5.2.1 The building of the stochastic multi-lane traffic model5.2.2 ConclusionOn one hand, from the analysis of the model, in the case the stress is positive, we also consider the jam situation while making the decision. More specifically, if a driver is in a jam situation, applying ))(,2(x P B R results with a tendency of moving to the right lane for this driver. However in reality, drivers tend to find an emptier lane in a jam situation. For this reason, we apply a Bernoulli process )7.0,2(B where the probability of moving to the right is 0.7and to the left otherwise, and the conclusion is under the rule of keep left except to pass, So, the fundamental reason is the formation of the driving habit.5.3 Taking the an intelligent vehicle system into a accountFor the third question, if vehicle transportation on the same roadway was fully under the control of an intelligent system, we make some improvements for the solution proposed by us to perfect the performance of the freeway by lots of analysis.5.3.1 Introduction of the Intelligent Vehicle Highway SystemsWe will use the microscopic traffic simulator model for traffic simulation purposes. The MPC traffic controller that is implemented in the Matlab needs a traffic model to predict the states when the speed limits are applied in Fig.5.3.1. We implement a METANET model for prediction purpose[14].5.3.2 Control problemAs a constraint, the dynamic speed limits are given a maximum and minimum allowed value. The upper bound for the speed limits is 120 km/h, and the lower bound value is 40 km/h. For the calculation of the optimal control values, all speed limits are constrained to this range. When the optimal values are found, they are rounded to a multiplicity of 10 km/h, since this is more clear for human drivers, and also technically feasible without large investments.5.3.3 Results and analysisWhen the density is high, it is more difficult to control the traffic, since the mean speed might already be below the control speed. Therefore, simulations are done using densities at which the shock wave can dissolve without using control, and at densities where the shock wave remains. For each scenario, five simulations for three different cases are done, each with a duration of one hour. The results of the simulations are reported in Table 5.1, 5.2, 5.3.●Enforced speed limits●Intelligent speed adaptationFor the ISA scenario, the desired free-flow speed is about 100% of the speed limit. The desired free-flow speed is modeled as a Gaussian distribution, with a mean value of 100% of the speed limit, and a standard deviation of 5% of the speed limit. Based on this percentage, the influence of the dynamic speed limits is expected to be good[19].5.3.4 The comprehensive analysis of the resultFrom the analysis above, we indicate that adopting the intelligent speed control system can effectively decrease the travel times under the control of an intelligent system, in other words, the measures of dynamic speed control can improve the traffic flow.Evidently, under the intelligent speed control system, the effect of the dynamic speed control measure is better than that under the lane speed control mentioned in the first problem. Because of the application of the intelligent speed control system, it can provide the optimal speed limit in time. In addition, it can guarantee the safe condition with all kinds of detection device and the sensor under the intelligent speed system.On the whole, taking all the analysis from the first problem to the end into a account, when it is in light traffic, we can neglect the factor of safe with the help of the intelligent speed control system.Thus, under the state of the light traffic, we propose a new conclusion different from that in the first problem: the rule of keep right except to pass is more effective than that of lane speed control.And when it is in the heavy traffic, for sparing no effort to improve the operation efficiency of the freeway, we combine the dynamical speed control measure with the rule of keep right except to pass, drawing a conclusion that the application of the dynamical speed control can improve the performance of the freeway.What we should highlight is that we can make some different speed limit as for different section of road or different size of vehicle with the application of the Intelligent Vehicle Highway Systems.In fact, that how the freeway traffic operate is extremely complex, thereby,with the application of the Intelligent Vehicle Highway Systems, by adjusting our solution originally, we make it still effective to freeway traffic.6. Improvement of the model6.1 strength and weakness6.1.1 Strength●it is easy for computer simulating and can be modified flexibly to consideractual traffic conditions ,moreover a large number of images make the model more visual.●The result is effectively achieved all of the goals we set initially, meantimethe conclusion is more persuasive because of we used the Bernoulli equation.●We can get more accurate result as we apply Matlab.6.1.2 Weakness●The relationship between traffic flow and safety is not comprehensivelyanalysis.●Due to there are many traffic factors, we are only studied some of the factors,thus our model need further improved.6.2 Improvement of the modelWhile we compare models under two kinds of traffic rules, thereby we come to the efficiency of driving on the right to improve traffic flow in some circumstance. Due to the rules of comparing is too less, the conclusion is inadequate. In order to improve the accuracy, We further put forward a kinds of traffic rules: speed limit on different type of cars.The possibility of happening traffic accident for some vehicles is larger, and it also brings hidden safe troubles. So we need to consider separately about different or specific vehicle types from the angle of the speed limiting in order to reduce the occurrence of traffic accidents, the highway speed limit signs is in Fig.6.1.Fig .6.1Advantages of the improving model are that it is useful to improve the running condition safety of specific type of vehicle while considering the difference of different types of vehicles. However, we found that the rules may be reduce the road traffic flow through the analysis. In the implementation it should be at the 85V speed of each model as the main reference basis. In recent years, the85V of some researchers for the typical countries from Table 6.1[ 21]:Author Country ModelOttesen and Krammes2000 AmericaLC DC L DC V C ⨯---=01.0012.057.144.10285Andueza2000Venezuela ].[308.9486.7)/894()/2795(25.9885curve horizontal L DC Ra R V T++--=].[tan 819.27)/3032(69.10085gent L R V T +-= Jessen2001America][00239.0614.0279.080.86185LSD ADT G V V P --+=][00212.0432.010.7285NLSD ADT V V P -+=Donnell2001 America22)2(8500724.040.10140.04.78T L G R V --+=22)3(85008369.048.10176.01.75T L G R V --+=22)4(8500810.069.10176.05.74T L G R V --+=22)5(8500934.008.21.83T L G V --=BucchiA.BiasuzziK. And SimoneA.2005Italy DCV 124.0164.6685-= DCE V 4.046.3366.5585--=2855.035.1119.0745.65DC E DC V ---=FitzpatrickAmericaKV 98.17507.11185-= Meanwhile, there are other vehicles driving rules such as speed limit in adverseweather conditions. This rule can improve the safety factor of the vehicle to some extent. At the same time, it limits the speed at the different levels.7. Reference[1] M. Rickert, K. Nagel, M. Schreckenberg, A. Latour, Two lane trafficsimulations using cellular automata, Physica A 231 (1996) 534–550.[20] J.T. Fokkema, Lakshmi Dhevi, Tamil Nadu Traffi c Management and Control inIntelligent Vehicle Highway Systems,18(2009).[21] Yang Li, New Variable Speed Control Approach for Freeway. (2011) 1-66。
建模美赛获奖范文全文共四篇示例,供读者参考第一篇示例:近日,我校数学建模团队在全国大学生数学建模竞赛中荣获一等奖的喜讯传来,这是我校首次在该比赛中获得如此优异的成绩。
本文将从建模过程、团队合作、参赛经验等方面进行详细介绍,希望能为更多热爱数学建模的同学提供一些借鉴和参考。
让我们来了解一下比赛的背景和要求。
全国大学生数学建模竞赛是由中国工程院主办,旨在促进大学生对数学建模的兴趣和掌握数学建模的基本方法和技巧。
比赛通常会设置一些实际问题,参赛队伍需要在规定时间内通过建立数学模型、分析问题、提出解决方案等步骤来完成任务。
最终评选出的优胜队伍将获得一等奖、二等奖等不同级别的奖项。
在本次比赛中,我们团队选择了一道关于城市交通拥堵研究的题目,并从交通流理论、路网优化等角度进行建模和分析。
通过对城市交通流量、拥堵原因、路段限制等方面的研究,我们提出了一种基于智能交通系统的解决方案,有效缓解了城市交通拥堵问题。
在展示环节,我们通过图表、数据分析等方式清晰地呈现了我们的建模过程和成果,最终赢得了评委的认可。
在整个建模过程中,团队合作起着至关重要的作用。
每个成员都发挥了自己的专长和优势,在分析问题、建模求解、撰写报告等方面各司其职。
团队内部的沟通和协作非常顺畅,大家都能积极提出自己的想法和看法,达成共识后再进行实际操作。
通过团队合作,我们不仅完成了比赛的任务,也培养了团队精神和合作能力,这对我们日后的学习和工作都具有重要意义。
参加数学建模竞赛是一次非常宝贵的经历,不仅能提升自己的数学建模能力,也能锻炼自己的解决问题的能力和团队协作能力。
在比赛的过程中,我们学会了如何快速建立数学模型、如何分析和解决实际问题、如何展示自己的成果等,这些能力对我们未来的学习和工作都将大有裨益。
在未来,我们将继续努力,在数学建模领域不断学习和提升自己的能力,为更多的实际问题提供有效的数学解决方案。
我们也希望通过自己的经验和教训,为更多热爱数学建模的同学提供一些指导和帮助,共同进步,共同成长。
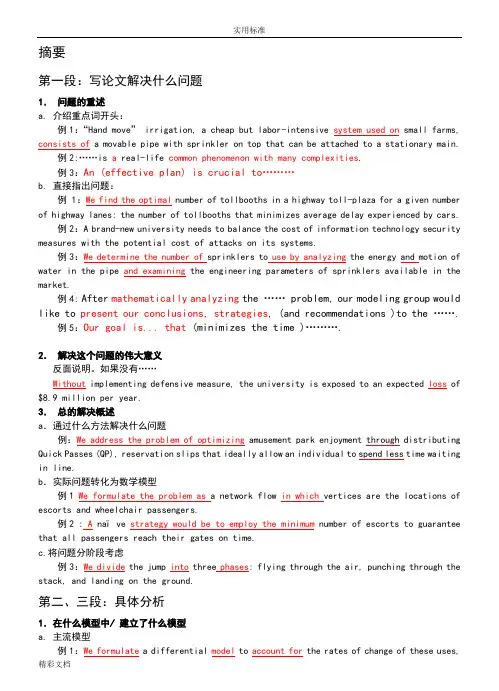
摘要第一段:写论文解决什么问题1.问题的重述a. 介绍重点词开头:例1:“Hand move” irrigation, a cheap but labor-intensive system used on small farms, consists of a movable pipe with sprinkler on top that can be attached to a stationary main.例2:……is a real-life common phenomenon with many complexities.例3:An (effective plan) is crucial to………b. 直接指出问题:例 1:We find the optimal number of tollbooths in a highway toll-plaza for a given number of highway lanes: the number of tollbooths that minimizes average delay experienced by cars.例2:A brand-new university needs to balance the cost of information technology security measures with the potential cost of attacks on its systems.例3:We determine the number of sprinklers to use by analyzing the energy and motion of water in the pipe and examining the engineering parameters of sprinklers available in the market.例4: After mathematically analyzing the …… problem, our modeling group would like to present our conclusions, strategies, (and recommendations )to the …….例5:Our goal is... that (minimizes the time )……….2.解决这个问题的伟大意义反面说明。


美赛memo的格式英文回答:As a team member of the MCM/ICM contest, I understand the importance of a well-structured and well-written memo. The format of the memo is crucial in conveying our ideas and solutions effectively. Therefore, it is essential to follow a clear and organized structure when writing the memo.The memo should begin with a brief introduction, providing background information on the problem at hand. This sets the stage for the reader and helps them understand the context of the issue. It is important to be concise yet informative in this section, as it lays the foundation for the rest of the memo.Following the introduction, the memo should present the analysis of the problem. This is where we delve into the details of the problem, using mathematical models, dataanalysis, and any other relevant methods to provide a thorough understanding of the issue. It is crucial to be clear and logical in our explanations, ensuring that the reader can follow our thought process.After the analysis, the memo should propose solutions to the problem. This is the crux of the memo, where we showcase our creativity and critical thinking skills. It is important to present multiple solutions, weighing the pros and cons of each, and ultimately recommending the most effective approach. Providing real-life examples or case studies can further strengthen our argument.Finally, the memo should conclude with a summary of the key points and recommendations. This section should reiterate the main findings and emphasize the proposed solutions. It is important to leave the reader with a clear understanding of our conclusions and the next steps to be taken.Overall, the memo should be well-organized, clear, and persuasive. By following a structured format and providingcompelling content, we can effectively communicate ourideas and solutions to the judges.中文回答:作为数学建模竞赛的团队成员,我深知一份结构良好、写作规范的备忘录的重要性。

CONTENTSAbstract (1)Ⅰ Introduction (2)ⅡGeneral Assumptions (3)ⅢKey Terminology (3)ⅣModel Development.......................................................................... (3)4.1 (4)4.1.1 (4)4.1.2 (4)4.1.3 (4)4.2 (5)4.2.1 (5)4.2.2 …………………………………................................................................ .64.2.3 (9)4.3 (9)4.3.1 (9)4.3.2 (10)4.3.3 (10)4.4 (10)4.4.1 (10)4.4.2 (10)4.4.3 (10)4.5 (13)4.5.1 (13)4.5.2 (13)4.5.3 (13)ⅤStrengths and Weakness (14)ⅥConclusion (15)ⅦReferences (16)ⅧAppendix (16)TITLEAbstract♦In our essay, we first develop a basic model to account for the fundamental but important phenomena in baseball game and then three improved models for some details. When developing the basic model, in order to analyze overall hitting process clearly, we focus on simplifying the practical problem into a mechanical model.We resolve basic model through three steps, each step considering one important part of the model that greatly impacts our searching for the “sweet spot”. After resolving the basic model, we begin to revise the model to make it more practical.♦Before resolving the basic model, we establish a criteria for evaluation-the proportion of effective energy transmission r, a criteria used to determine at which spot of the bat the maximum proportion of energy output by human is transferred to the ball. Our three steps are designed as follows:⑴In our first step, we mainly investigate the action process between the simplified baseball bat andbaseball. Ignoring other influencial factors, we find one “sweet spot”.⑵In our second step, our focus moves to the relationship between the hand and the bat. Ignoringother influencial factors, we find another “sweet spot”.⑶In our last step, we integrate merits of each “sweet spot ” in above two steps so that we find out a“sweet spot zone”. Then we figure out the variation of r in “sweet spot zone”and find the maximum r.♦After resolving the basic model, we revise our model in three aspects to make it more practical.⑴In our first improvement, we restore the simplified line and particle with objects of different shapeand find out the “sweet spot”after revision.⑵In our second improvement, we consider the shape change of the baseball bat when the bat hits theball and also calculate the lost energy consumed by the shape change of bat made of different material.After revision, we find that the position of the practical “sweet spot”should be a bit more closely than that of “sweet spot”calculated in basic model to the thin end of the bat.⑶In our last improvement, we take into account the vibration that might also impact our searchingfor the “sweet spot”.After detailed analysis, we calculated the lost energy consumed by vibration when the ball hits different spot on the bat and figure out that the position of the practical “sweet spot”should also be a bit more closely than that of “sweet spot”calculated in basic model to the thin end of the bat.♦ⅠIntroductionOn the softball field, hitters usually attempt their best to hit the baseball.In addition to the physical strength the player applied to the baseball, the hitting spot also has great influence on our searching for the sweet spot. Usually, according to the moment of momentum theorem, it seems that the fat end of the baseball bat should be the best hitting spot. However, this is known to be empirically incorrect. Experienced player usually chooses a spot called “sweet spot”to be the best hitting spot, at which the maximum power is transferred to the baseball, thus the hit ball travelling the longest distance. Howard Brody(1989) conducted a series of experiments and investigated that vibration of the baseball would affect the choice of the best hitting spot. Rod Cross(1998) proved that both center of percussion and vibration of the bat affect the searching for the sweet spot through a series of experiment. However, none of scientistshas given a theoretical method to find out the solution. In our essay, we attempt to find out and explain that the sweet spot does not lies on the end of the bat.ⅡGeneral Assumption♦The baseball and baseball bat are assumed to move at uniform velocity. Air friction and gravity can be neglected♦The direction of the velocity of the particle is assumed to collinear that of the linear veloc ity of the action point.♦Baseball bats made of different materials are assumed to attain identical energy after accelerated by human.ⅢKey TerminologyTable 1.Symbols.Symbols Description UnitsⅣModel Development4.1 Simplifying the situationIn order to address the problem, we need to simplify the hitting process. It is reasonable to abstract the process as follows: replacing the baseball bat with a single line, on which the mass is distributed uniformly, and substituting a particle for the baseball; fixing one end of the line so that the line can oscillate on the smooth ground freely; using the process that a baseball hits an oscillating rod to simulate the process that a baseball hits a bat.This is the basic and simplest model that we can extract from hitting process, based on which we can analyze the most basic motion of these two objects. However, we cannot ignore the importance of the elasticity, the vibration and the antihunt action, which might also have impact on our searching for the sweet spot.4.1.1 Basic ModelWe analyze the whole hitting process:Step oneAt the beginning of hitting, the particle moves at a fixed velocity to the line that is oscillating at a fixed angular velocity and linear velocity. The moment of the momentum of the overall system with respect to o is:1112o L m v d J ω=-+, (1) After the hitting, the particle and the line separate and move respectively. The moment of the momentum ofthe overall system with respect to o is2112o L m v d J ω''=+As exterior impulsive moment vanishes, we can then get:12o o L L =that is112112m v d J m v d J ωω''-+=+ (2) Given the material of the line and the particle, we can achieve the coefficient of the restitution between the line and the particle, a coefficient that will help us to achieve the relationships of the linear velocity of the line and the particle.1212v v k v v ''-=+ (3)22v d ω= , 22v d ω''= (4)Putting .Eq (1),(2),(3)and (4) together, we have junctions()221122121221233d m v l m v k v v v m d m l-+++⎡⎤⎣⎦'=+ (4) ()22111222222123133d k m v d km L m d m l m ωωω-+-+'=+ (5)When considering at which spot of the line the maximum power is transferred to the particle, we attempt to work out a spot at which the hit particle reaches the fastest velocity. Differentiating 1v 'with respect to d , we will achieve that when123d m ω=(6)the hit particle reaches the fastest velocity. We just define this spot as the spot of moment(SOM).Step twoIt is necessary for us to take the function of the hands into account if we want to simulate the hitting process exactly. At the instant of hitting the particle, the impulse of the particle will rotate the line unless the particle hits a specified spot on the line-the center of percussion(COP) at which the impulse will only move the translationally with no rotation. According to the momentum theorem()22221111122ox I m l m l m v v ωω''=--+ (7)If the particle hits the COP exactly, the momentum theorem o x I should be 0. Inserting .Eq (4) and (5) into .Eq (7)leads to equation:()()()1212212132062w k d l lm mvd d m l m ω+-+=+ (8)Because all of the parameters in .Eq (8)are greater than 0, only under condition that 320d l -= can the .Eq (8) result in a proper solution. Then we can know the position of the COP:23C O P d l =(9)Step threeAccording to the investigation of ……..(), if viewing hand as soft tissue, we can get the relationship between the force pressed on the tissue and the degree at which the hands ’ shape changes012aseF a-= (10)where♦ 0F represents the force pressed on hands♦ s denotes the relative displacement of the point on palm♦ b and c are constants which have been discussed in !!!!!!!!!!!!!!!!!!!!!!!!!文献As the the force pressed on palm generates the relative displacement, the hand apply negative force on the line, thereby absorbing part of the energy transferred from our arms to the particle. We can easily figure out the lost energy through definite integral:100s w F ds =⎰(11)212ase asa-+-=At the instant of hitting, the energy transferred from the line to the particle is:22222221126w J m l ωω== (12)The energy achieved by the particle is:22011111122w m v m v '=- (13) To transfer the maximum proportion of power output from the human body to the particle, we define this proportion as12w p w w =+ (14)Plugging .Eq (4),(5),(10),(11),(12),(13) into .Eq (14),we have()()()2222211121222112222122231122310.3672as m d m v K l m v dl m K m v d m l mp easaωω-+++-++=-+-+空As the value of p varies when the hitting spot on the rod changes, the variation of p with respect to0d and K is pictured in Fig.14.1.2 Improvement ⅠWith the purpose of improving the practicability, we have to restore the single line and the particle with bodies of axisymmetry (In effect, both the baseball and the bat are axisymmetry). In this way, our model more closely resembles the real hitting process. In this situation, we regard the two bodies as rigid bodies. Unlike the moment of inertia of a line, the moment of inertia of the bat has to be calculated through definite integral. Since we cannot attain the equation of the generating line of the equation, here is an example to compute the moment of inertia of a circular cone to illustrate our methods.In practice, the motion state of an axisymmetrical body, the mass of which is distributed uniformly, is usually equivalent to that of its axis line, on which the mass of the body concentrates. However, the mass is unevenly distributed on the axis line. By computing the moment of inertia of the axis line, we will reach the same result as calculating the moment of inertia of the circular cone. Like circular cone, all of the axisymmetrical bodies can also be figured out in this way.4.1.4 Improvement ⅡAssume that the ball is completely elastic and the energy dissipation mainly stems from the deformation of the bat. As suggested by Adair (2002), the hitting between the bat and the baseball can be reasonably modeled by a ball and a flat without introducing large error. This collision can be simply described as Figure 1. Denoting by R the radius of the ball and by δ the depth of the indentation, the equation of the sphere, on the surface of contact, is[]222()r z R R δ++-= (14)Figure 1. The indentation by a baseball.For shallow indentations /1R δ and /1z R , where in the second inequality the coordinate z is meant to be on the indented surface. According to Asaro and Lubarda (2006), the distributed force takes theform1/2202()1r q r q a ⎛⎫=- ⎪⎝⎭ (15)The total hitting force is1/22200202213a r P q rdr a q a ππ⎛⎫=-=⎪⎝⎭⎰(16)The displacement of the indented surface is given as22212a r w R a ⎛⎫=- ⎪⎝⎭r a ≤ (17) or alternatively, in terms of the depth δ of the indentation,22rw Rδ=-r ≤ (18)Consequently, the energy bat E absorbed by the bat can be expressed as4200232d 55a bat q a a P E qwr r RRππ==⎰(19)4.1.4 Improvement ⅢBy employing the d ’Alembert ’s Principle, one gets the equilibrium equation:()()22,s s s F y x dx F F dx f x t dx t x ρ∂∂⎛⎫=-++ ⎪∂∂⎝⎭(20)where()x ρdenotesthe quality of the unit lengths F is shear force(),f x t is external excitation.Here the shear deformation and the rotation of the cross section are neglected. The small element satisfies the momentum balance which requires(),02s Mdx M dx M F dx f x t dxx ∂⎛⎫+---= ⎪∂⎝⎭(21)Droping the high order small quantity yieldss M F x∂=∂ (22)According to the mechanics of materials, the moment relates the deflection by:()()()2,,y x tM x t E I x x∂=∂ (23) Inserting .Eq (22) and (23) into (21) leads to:()()()()()222222,,,y x t y x t EI x x f x t x x t ρ⎡⎤∂∂∂+=⎢⎥∂∂∂⎣⎦(24)The dynamic equation (24) provides unified theoretical framwork for considering the vibration arbitrayrod or beam. When the rod is uniform, in both quality and shape, the .Eq (24) reduces to()()()4242,,,y x t y x t EIfx t xtρ∂∂+=∂∂ (25)Under our current interest, namely, the hitting between the baseball and the rod, the impulse reads()(),,0F x d tfx t δ⎧-=⎨⎩(26)Where F represents the impulse force By writing()()(),y x t x q t φ=we have()()()2200qt q t E I x ωφωρφ⎧+=⎪⎨''''-=⎪⎩(27) ()()()440x x φβφ-= (28)Obiviously, the solution of ()q t is()()sin q t A t ωθ=+ (29)The homogeneous solution of (27)is()1234cos sin cosh sinh x c x c x c x c x φββββ=+++ (30) Where ()1,2,3,4i c i =are constants which are yet to be determined by following boundary conditions:()()()()()00, 000EI K l l φφφφφ'''=-=⎧⎪⎨'''''==⎪⎩(31) From .Eq (31),we obtain the frequency equation()()()()()()c o s h s i n c o s s i n h 0K l K c o n s l E I l E I l l βββββββ+⋅+-= (32)If 0K =, .Eq (32) reduces tot a n t a n h l l ββ=(33)Normalizing .Eq (32)as:()()()()()00cosh cos sin cos sinh 0K l K l l l l βββββ++-=⎡⎤⎣⎦ (34)with 0K K EI β=Assigning K with a certain value ranged from 0 to 1, we attempt to find out the numerical solution offrequency.The variation of .Eq (34) with respect to l β is illustrated in Fig.1. As can be seen from the figure, the first two-oder frequencies are 3.87701 and 7.01587, respectively, when 0.1K =.重画图4.2 Model ⅡBecause wood has been removed from the bat and replaced by some substance with a s maller density than the wood, not only is the bat lighter, but the center of the gravity of the bat moves closer to the thin end. Since center of percussion(COP) and is relavant to the center of the gravity , the COP also movesJ M α=212t t ωαϕα=⎧⎪⎨=⎪⎩22αϕω⇒= We can get the mechanical energy of the bat:212E J ω=122E J J αϕαϕ=⋅=E Mϕ=4.2.14.2.24.2.34.3 Model Ⅲ4.3.14.3.24.3.34.44.4.14.4.24.4.34.54.5.14.5.24.5.3ⅤStrengths and WeaknessesStrengths♦Our basic model’s strength is that we consider the whole process of energy transmission, energy from hand to bat to baseball.♦We view the palm of the hand as soft tissue and consider the shape change of the hand so that we can model the strengths the hand press on the bat.♦The improvement in basic model take into account the energy loss from vibration, and we develop the “simple support and spring” model to model the function of human hand.♦We consider and compute the lost energy consumed by the shape change of the bat.WeaknessesSince neglecting the data of several parameters in the model, we have difficulty in deducing a perfect solution. We introduce some examples so as to illustrate our method.ⅥConclusionⅦReferencesⅧAppendix。
建模美赛获奖范文标题:《探索与创新:建模美赛获奖作品范文解析》建模美赛(MCM/ICM)是全球大学生数学建模竞赛的盛事,每年都吸引了众多优秀的学生参与。
在这个舞台上,获奖作品往往展现了卓越的数学建模能力、创新思维和问题解决技巧。
本文将解析一份获奖范文,带您领略建模美赛获奖作品的风采。
一、背景与问题阐述(此处详细描述范文所针对的问题背景、研究目的和意义,以及问题的具体阐述。
)二、模型建立与假设1.模型分类与选择:根据问题特点,范文选择了适当的模型进行研究和分析。
2.假设条件:明确列出建模过程中所做的主要假设,并解释其合理性。
三、模型求解与结果分析1.数据收集与处理:介绍范文中所用数据来源、处理方法及有效性验证。
2.模型求解:详细阐述模型的求解过程,包括算法选择、计算步骤等。
3.结果分析:对求解结果进行详细分析,包括图表展示、敏感性分析等。
四、模型优化与拓展1.模型优化:针对原模型存在的问题,范文提出了相应的优化方案。
2.拓展研究:对模型进行拓展,探讨其在其他领域的应用和推广价值。
五、结论与建议1.结论总结:概括范文的研究成果,强调其创新点和贡献。
2.实践意义:分析建模结果在实际问题中的应用价值和意义。
3.建议:针对问题解决,提出具体的建议和措施。
六、获奖亮点与启示1.创新思维:范文在模型选择、求解方法等方面展现出创新性。
2.严谨论证:文章结构清晰,逻辑严密,数据充分,论证有力。
3.团队合作:建模美赛强调团队协作,范文体现了成员间的紧密配合和分工合作。
总结:通过分析这份建模美赛获奖范文,我们可以学到如何从问题背景出发,建立合理的模型,进行严谨的求解和分析,以及如何优化和拓展模型。
同时,也要注重创新思维和团队合作,才能在建模美赛中脱颖而出。

内容格式:AbstractIntroductionAssumptionsAnalysis of the problemTask 1 : predicting survivorshipTask2 : achieving stability….Sensitivity analysisStrengthsWeaknessesConclusionReferencesTitle(use Arial 14)First author , second author , the other (use Arial 14)Full address of first author . Including country and mail(use Arial 11)Full address of second author . Including country and mailList all distinct addresses in the same wayKeywords(use Arial 11)Abstract1985:模型概述-考虑因素-使用理由We modelled…. Since…–we used …. We included…which were to be chosen in order to…假设条件-数据处理方法We assumed that…We used actual data to estimate realistic ranges on the parameters in the model.评估标准-衡量方法-得到结论-结论的可靠性We defined…We then used…we found…We examined the results for different values of the mortality parameters and found them to be the same . Therefore ,our solution appears to be stable with respect to environmental conditions.2000:背景设置-模型引入…in order to determine …, we develop models using…解决问题-模型解决(层次排比)For the solution of …, we develop… model based … to … . For the solution of … , we employ…What is more , a self-adaptive traffic light is employed to …according to …模型检验-模型修正By comparison of …simulation results , the models are evaluated . …is formulated to judge which solution is effective .2002:The task is to … we begin by constructing a model of … base on … Using this model we can … Using… , we model … through … and obtain … we compare the performance of our model in … simulations show that …2001:We examine the … . Such evacuations been required due to … . in order to … , we begin with an analysis of … . For a more realistic estimate , including the effects of … , we formulate models of … . The model we construct is based on … .This model leads to a … and it further show that … what’ more , it agrees with …2004:(修正递进式模型摘要模板)The purpose of this paper is to propose … . We propose that … . To build a solid foundation , we define and test a simple model for … . We then develop …system , but we find it would be far from optimal in practice . We then propose that the best model is one that adapts to … . We implement … . We simulate the …with …and we find this system quickly converges to a nearly optimal solution subject to our constraints . It is , however , sensitive to some parameters . We discuss the effects of these findings on the expected effectiveness of the system in a real environment . We conclude that … is a good solution .问题分析句式:… is a real-life common phenomenon with many complexities .For a better view of … , we …To give a clear expression, we will introduce the method presented by …模型引入句式:In this paper , we present … model to simulate efficient methods for …We also apply … methods to solve …We address the problem of …. through ….We formulate the problem as …We formulate a … model to account for …Base on … , we establish a model ….We build a model to determine …We modify the model to reflect …To provide a more complete account for … , ... model has been employed .In this paper , in order to … , we design a … model based on …We propose a solution that …We have come up with an … for … andStrong evidence of ... , and powerful models have been created to estimate ...模型推进:… will scale up to an effective model for …模型求解:We employ …, one based on …and the other …, whose results agree closely.To combat this , we impose …结合数据:Using data from … , we determine …To ground this model in reality , we incorporate extensive demographic data ….We use data assembled by …Using a wide scale regression , we found that …We extrapolate from longevity data and explore the long-term behavior of …The base we developed was based off real-life data that gathered by …We estimate these characteristic numbers for a representative sample of …We fit the modified model to data , we conclude that …By statistical processing to results of …By analyzing the … on the basis of historic data in the same way mentioned in …结果给出句式:Results of this computation are presented , and ….We elicit that a conclusion …We conclude with a series of recommendations for …Given a …deviation in the value of the parameter , we calculate the percentage change in the value that the system converges to …As we can find out , in the situation of …. , …. is subject to the logistic regression .We conclude through analyzing that ….it is apparent that …Through comparing the … , we conclude that …According to the laws of … , we draw a conclusion of …From the formula , we know that …Thus we arrive at the conclusion :We elicit that a conclusion …As a consequence , we can get …模型可行性:Our suggested solution , which is easy to ….Since our model is based on … it can be applied to …Importantly , we use some practical data to test our model and analysis its stability , we simulate this model and receive a well effect .Therefore , we trust this model as an accurate testing ground for …Our algorithm is broad enough to accommodate various …定理可靠说明:That is the theoretical basis for … in many application areas .模型简化With further simplification, utilizing … we can reach …承上启下:In addition to the model , we also discuss …Because the movement of … operates by the same laws and equations as the movement of … , we can ….Based on the above discussion, considering …., let’s …误差句式:… does not deviate more than … from the target value .Theoretically , error due to … should not play a tremendous role under our model .Up to this point , we have made many approximations , not all of which are justified theoretically , but the results of algorithm are quite reasonable .This is a naïve approach which may mot ensure the …. , however if we … , the error is negligible .Context:方程给出:We derive the equation expressing the … as a function of… we haveA simple formula determined by the … is given by the equation :… can be written as the following system of equations :In particular , the … is defined in terms of … ,It is convenient to rewrite equations into the vector form:The expression of … can be expanded as …Equation (1) is reduced to ..Substitute the values into equation (1) ,we get …So its expression can be derived from equation (1) with small changes .Our results are summarized in the formula for …Plugging (1) into the equation for (2) , we obtain …Therefore , from (1)(2)(3) , we have the junction that …We use the following initial conditions to determine …When computing , we suppose … ,so this suppose doesn’t … ,then by … , we can get :According to equation (1)(2) , we can eliminate … ,then we can acquire :By connecting equation (6)(7) , we get the conclusion that …Then we can acquire … through the following equation :Its solution is the following …, in which … is …客观条件引入:A commonly accepted fact is that …A lot of research has been done to explain and find …In our model , we prefer to follow the conclusion used by …Here , we cite the model constructed by …There is one paper from … ,which concluded that …We get performance of … by citing the experimental results of …Here, we will introduce some terms used to address the problem, and we …方法给出句式:We construct …intelligent algorithms , a conservative approach , and an enthusiastic system to ..We formulate a simplified differential equation governing …This equation will be based on …The above considerations lead us to formulate the … asGiven this , it is easy to determine …To analyze the accuracy of our model , and determine a reasonable value for …We will evaluate the performance of our … by …We tabulate the … as a function of …Analysis for the … can be carried out exactly in the same fashion as …The main goal in attempting to model … is to determine … and … should be considered .The first requirement that the model reproduce is to determine if the model is reasonable .We begin our analysis of the phenomenon of congestion with the question of …In modeling this behavior , we begin with …In laying down the mathematics of this model , we begin with …When … is not taken into account ,it is …We give the criterion that …We fix A and examine the change of B with respect to CAttention has been draw to determine …To reveal the trend of … in a long horizonTo deal with the problem, we need figure out …图表句式:We can graph … with …,and such a plot is shown in …According to the above data , we can see that … . This phenomenon shows that … . Hence, we can safely arrive the conclusion that …Table 7 reports the general statistics under …文献句式:There is rather substantial literature on models for evaluating regional health condition, and most models fall into one of two categories: microscopic and macroscopic. Nevertheless, to get a more accurate understanding, we need to conduct quantitative modeling in our call for a better evaluation and predictive model.假设句式:In order to present our solution , we have made numerous simplifications tothe given problem . we made several assumptions regarding either the problem domain itself , or …For the sake of simplicity , we will generally assume in our discussions that …… are assumed to have …We assume … are …Due to the symmetry of the image we can assume that …We came up with a few different hypotheses that …For simplicity we consider …We will use the following symbols and definitions in the description of the model:To get the general picture of the … , we rely on the assumption that …Hence we are bale to …This assumption makes sense , because we expect …Assumption … is valid , since if it was not the case , the … would …Make the following assumptions to approximate and simplify the problem …As a sweet spot , there is no doubt that … ,if not , …For the purpose of reaching a conclusion conveniently , we assume …We adopt a set of assumptions as follows …模型验证:To test our model , we developed a …simulator based on …, and thesimulator was written in … and can be executed on several platforms .To demonstrate how our model works , we apply it to …跨段内容:For a further discussion of this model , please see Appendix A .The underlying idea is fairly simple内容引导:What we are really interested in is …With this consideration in mind , we now …Our goal is to … , one that would …We must restate the problem mathematically by narrowing our focus and defining our goals in order to obtain a good model .Given this idea , it is clear that we cannot compromise the …This immediately leads to useful conclusions . For example , …Given these assumptions , the following results can be quickly derived …We will pursue this goal …We turn our attention to …We restrict our attention to …In addition to the model , we also discuss policies for …In our paper , we take … factors into consideration to …… is not as simple a task as it might seem , because …For the … , we only take … into account .As the next step , we will introduce our advanced method to …Under the premise of this , …On the basis of previous analyses , we find the …效果评价:This is a good indication that our simulations are producing reasonable results .The results of our simulations ,shown in …indicate that the performance of …This is no surprise the distinguishing features of …This would appear very encouraging indeed , were it not …We therefore regard this model as reasonable .Here very little congestion occurs …As we will see when we apply our model to … ,this model works well . It should be noted ,though that this is not the only way to define the location of generator points , but it is a very good firs approach .//数据缺乏的理论化模型Of course , only theoretical explanations are not completely convincing . But mass of data relevant to our calculation can be obtained through experiments . Owing to our limit conditions , we only quote some experimental results from other literatures to assist and analyze our derived theoreticalconclusion .变量指定句式:Let … denote … , and … to be …The … is … , where … is , W stands for , and … stands for bucks .For better description we assign …Note for brief description of the model , we will denote …解释句式:In fact , this assumption is reasonable not only because … but also that …In other word , …The key feature of this algorithm is …It is important to note that … can no longer be ignored when considering …If … , we can gain more insight into the nature of …The reason we care about … is that … ,the problem is determining …, if … so we ..Our approach weighs heavily on …To show that … are negligible , we vary …This is likely due to …修正:We modify … according to …We modify the model to reflect … and generalize the model to …影响:Because the effect of … and omit the resistance of …As the effect of …The model also incorporates the …At other impact points , the impact may …... has been implicated as the major component of ...图表用语:However , from this figure it is clear that the …From this figure one can see that …,one also notices that …This graph can be compared to the results of the symbolic model to see how well the model agrees with our simulated …The two plots at above which show … .According to …, there exists the fact that …According to …, it is no doubt that…拟合近似,模拟:Given the above assumptions , we may approximate …In simulations over a suitably long time period , we find …For each run of the simulation we fire enough blobs so that results are …An appropriate estimate for the … can be obtain as follows .In assessing the accuracy of a mathematical model , …We now propose a way to extend our model using a computer simulation of …It is obvious , however , that this is a highly subjective value that must be determined through experiment for each … that our model is applied to .This model leads to a computer simulation of …主要因素:Analyzing what parameters have the greatest effect on the simulation results indicates the things that we should focus on in order to produce a more effective evacuation scheme .Sensitivity analysisWe use the sensitivity analysis to defend our model . The sensitivity of a model is a measure of how sensitive the result changes at small changes of parameters . A good model is corresponding to low sensitiveness .Considering the parameters used in our solutions , here we provide following discussion .The above models we have built is based on … ,which has well solved … . To the final issue , we have take … into account in order to …Strength:On the whole , we have hound our model to be quite natural and easy to apply . Here , we list some of the advantages of our approach to the problem .The most distinct advantage of our model is that …Our methods can incorporate various scenarios : ….This model is simple enough for … to understand .Our method is robust (健壮), so that other variables or situations can be easily introduced .Our model … and is not overly sensitive to small changes in …Additionally , we avoided harsh assumptions that would constrain the possible …Most of the assumptions we did make could be accounted for as well in a more general model .We use random events to simulate the chaos of real world .The key insight to our model is that ….Our model also takes into account the …The model allows … which is more close to reality .The model is able to handle a range of …Besides rigorous theoretical derivation , we also citing the research results of numerous experts and scholars to test the result of our method .Weakness:Of course , there are many ways to attack a problem such as this one , In this section , we discuss some of the drawbacks of our approach to the problem , and some things that could have been done to deal with these issues .Some special data can’t be found , and it makes that we have to do some proper assumption before the solution of our models . A more abundant data resource can guarantee a better result in our model .The model responds slowly to dramatic changes in …The method does not allow … , which might be possible with a more radical model .However , … constraints arise when pursuing this methodology .Additionally , this method would have required … , which would …However , the algorithms do have unique strengths and weaknesses when …Our model does take into account the complicated effects that …Factors considered in our method is relatively unitary , we only take the important factor into consideration .Lacking brief numerical calculation in our method , though we display rigorous theoretical derivation .。
The Keep-Right-Except-To-Pass RuleSummaryAs for the first question, it provides a traffic rule of keep right except to pass, requiring us to verify its effectiveness. Firstly, we define one kind of traffic rule different from the rule of the keep right in order to solve the problem clearly; then, we build a Cellular automaton model and a Nasch model by collecting massive data; next, we make full use of the numerical simulation according to several influence factors of traffic flow; At last, by lots of analysis of graph we obtain, we indicate a conclusion as follow: when vehicle density is lower than 0.15, the rule of lane speed control is more effective in terms of the factor of safe in the light traffic; when vehicle density is greater than 0.15, so the rule of keep right except passing is more effective In the heavy traffic.As for the second question, it requires us to testify that whether the conclusion we obtain in the first question is the same apply to the keep left rule. First of all, we build a stochastic multi-lane traffic model; from the view of the vehicle flow stress, we propose that the probability of moving to the right is 0.7and to the left otherwise by making full use of the Bernoulli process from the view of the ping-pong effect, the conclusion is that the choice of the changing lane is random. On the whole, the fundamental reason is the formation of the driving habit, so the conclusion is effective under the rule of keep left.As for the third question, it requires us to demonstrate the effectiveness of the result advised in the first question under the intelligent vehicle control system. Firstly, taking the speed limits into consideration, we build a microscopic traffic simulator model for traffic simulation purposes. Then, we implement a METANET model for prediction state with the use of the MPC traffic controller. Afterwards, we certify that the dynamic speed control measure can improve the traffic flow .Lastly neglecting the safe factor, combining the rule of keep right with the rule of dynamical speed control is the best solution to accelerate the traffic flow overall.Key words:Cellular automaton model Bernoulli process Microscopic traffic simulator model The MPC traffic controlContentContent (2)1. Introduction (3)2. Analysis of the problem (3)3. Assumption (3)4. Symbol Definition (3)5. Models (3)5.1 Building of the Cellular automaton model (3)5.1.1 Verify the effectiveness of the keep right except to pass rule (4)5.1.2 Numerical simulation results and discussion (5)5.1.3 Conclusion (8)5.2 The solving of second question (8)5.2.1 The building of the stochastic multi-lane traffic model (8)5.2.2 Conclusion (8)5.3 Taking the an intelligent vehicle system into a account (8)5.3.1 Introduction of the Intelligent Vehicle Highway Systems (9)5.3.2 Control problem (9)5.3.3 Results and analysis (9)5.3.4 The comprehensive analysis of the result (9)6. Improvement of the model (10)6.1 strength and weakness (10)6.1.1 Strength (10)6.1.2 Weakness (10)6.2 Improvement of the model (10)7. Reference (12)1. IntroductionAs is known to all, it ’s essential for us to drive automobiles, thus the driving rules is crucial important. In many countries like USA, China, drivers obey the rules which called “The Keep-Right-Except-To-Pass (that is, when driving automobiles, the rule requires drivers to drive in the right-most unless they are passing another vehicle)”.2. Analysis of the problemFor the first question, we decide to use the Cellular automaton to build models, then analyze the performance of this rule in light and heavy traffic. Firstly, we mainly use the vehicle density to distinguish the light and heavy traffic; secondly, we consider the traffic flow and safe as the represent variable which denotes the light or heavy traffic; thirdly, we build and analyze a Cellular automaton model; finally, we judge the rule through two different driving rules, and then draw conclusions.3. AssumptionIn order to streamline our model we have made several key assumptions● The highway of double row three lanes that we study can representmulti-lane freeways.● The data that we refer to has certain representativeness and descriptive● Operation condition of the highway not be influenced by blizzard or accidental factors ● Ignore the driver's own abnormal factors, such as drunk driving and fatigue driving ● The operation form of highway intelligent system that our analysis can reflectintelligent system● In the intelligent vehicle system, the result of the sampling data has high accuracy.4. Symbol Definitioni The number of vehiclest The time5. ModelsBy analyzing the problem, we decided to propose a solution with building a cellular automaton model.5.1 Building of the Cellular automaton modelThanks to its simple rules and convenience for computer simulation, cellular automaton model has been widely used in the study of traffic flow in recent years.Let )(t x i be the position of vehicle i at time t , )(t v i be the speed of vehicle i at time t ,p be the random slowing down probability, and R be the proportion of trucks and buses, the distance between vehicle i and the front vehicle at time t is:1)()(1--=-t x t x gap i i i , if the front vehicle is a small vehicle.3)()(1--=-t x t x gap i i i , if the front vehicle is a truck or bus.5.1.1 Verify the effectiveness of the keep right except to pass ruleIn addition, according to the keep right except to pass rule, we define a new rule called: Control rules based on lane speed. The concrete explanation of the new rule as follow:There is no special passing lane under this rule. The speed of the first lane (the far left lane) is 120–100km/h (including 100 km/h);the speed of the second lane (the middle lane) is 100–80km8/h (including80km/h);the speed of the third lane (the far right lane) is below 80km/ h. The speeds of lanes decrease from left to right.● Lane changing rules based lane speed controlIf vehicle on the high-speed lane meets control v v <, ),1)(min()(max v t v t gap i f i +≥, safe b i gap t gap ≥)(, the vehicle will turn into the adjacent right lane, and the speed of the vehicle after lane changing remains unchanged, where control v is the minimum speed of the corresponding lane.● The application of the Nasch model evolutionLet d P be the lane changing probability (taking into account the actual situation that some drivers like driving in a certain lane, and will not take the initiative to change lanes), )(t gap f i indicates the distance between the vehicle and the nearest front vehicle, )(t gap b i indicates the distance between the vehicle and the nearest following vehicle. In this article, we assume that the minimum safe distance gap safe of lane changing equals to the maximum speed of the following vehicle in the adjacent lanes.● Lane changing rules based on keeping right except to passIn general, traffic flow going through a passing zone (Fig. 5.1.1) involves three processes: the diverging process (one traffic flow diverging into two flows), interacting process (interacting between the two flows), and merging process (the two flows merging into one)[4].Fig.5.1.1 Control plan of overtaking process(1) If vehicle on the first lane (passing lane) meets ),1)(min()(max v t v t gap i f i +≥ and safe b i gap t gap ≥)(, the vehicle will turn into the second lane, the speed of the vehicle after lane changing remains unchanged.5.1.2 Numerical simulation results and discussionIn order to facilitate the subsequent discussions, we define the space occupation rate as L N N p truck CAR ⨯⨯+=3/)3(, where CAR N indicates the number of small vehicles on the driveway,truck N indicates the number of trucks and buses on the driveway, and L indicates the total length of the road. The vehicle flow volume Q is the number of vehicles passing a fixed point per unit time,T N Q T /=, where T N is the number of vehicles observed in time duration T .The average speed ∑∑⨯=T it i a v T N V 11)/1(, t i v is the speed of vehicle i at time t . Take overtaking ratio f p as the evaluation indicator of the safety of traffic flow, which is the ratio of the total number of overtaking and the number of vehicles observed. After 20,000 evolution steps, and averaging the last 2000 steps based on time, we have obtained the following experimental results. In order to eliminate the effect of randomicity, we take the systemic average of 20 samples [5].Overtaking ratio of different control rule conditionsBecause different control conditions of road will produce different overtaking ratio, so we first observe relationships among vehicle density, proportion of large vehicles and overtaking ratio under different control conditions.(a) Based on passing lane control (b) Based on speed controlFig.5.1.3Fig.5.1.3Relationships among vehicle density, proportion of large vehicles and overtaking ratio under different control conditions.It can be seen from Fig. 5.1.3:(1) when the vehicle density is less than 0.05, the overtaking ratio will continue to rise with the increase of vehicle density; when the vehicle density is larger than 0.05, the overtaking ratio will decrease with the increase of vehicle density; when density is greater than 0.12, due to the crowding, it will become difficult to overtake, so the overtaking ratio is almost 0.(2) when the proportion of large vehicles is less than 0.5, the overtaking ratio will rise with the increase of large vehicles; when the proportion of large vehicles is about 0.5, the overtaking ratio will reach its peak value; when the proportion of large vehicles is larger than 0.5, the overtaking ratio will decrease with the increase of large vehicles, especially under lane-based control condition s the decline is very clear.Concrete impact of under different control rules on overtaking ratioFig.5.1.4Fig.5.1.4 Relationships among vehicle density, proportion of large vehicles and overtaking ratio under different control conditions. (Figures in left-hand indicate the passing lane control, figures in right-hand indicate thespeed control. 1f P is the overtaking ratio of small vehicles over large vehicles, 2f P is the overtaking ratio ofsmall vehicles over small vehicles, 3f P is the overtaking ratio of large vehicles over small vehicles, 4f P is the overtaking ratio of large vehicles over large vehicles.).It can be seen from Fig. 5.1.4:(1) The overtaking ratio of small vehicles over large vehicles under passing lane control is much higher than that under speed control condition, which is because, under passing lane control condition, high-speed small vehicles have to surpass low-speed large vehicles by the passing lane, while under speed control condition, small vehicles are designed to travel on the high-speed lane, there is no low- speed vehicle in front, thus there is no need to overtake. ● Impact of different control rules on vehicle speedFig. 5.1.5 Relationships among vehicle density, proportion of large vehicles and average speed under different control conditions. (Figures in left-hand indicates passing lane control, figures in right-hand indicates speed control. a X is the average speed of all the vehicles, 1a X is the average speed of all the small vehicles, 2a X is the average speed of all the buses and trucks.).It can be seen from Fig. 5.1.5:(1) The average speed will reduce with the increase of vehicle density and proportion of large vehicles.(2) When vehicle density is less than 0.15,a X ,1a X and 2a X are almost the same under both control conditions.● Effect of different control conditions on traffic flowFig.5.1.6Fig. 5.1.6Relationships among vehicle density, proportion of large vehicles and traffic flow under different control conditions. (Figure a1 indicates passing lane control, figure a2 indicates speed control, and figure b indicates the traffic flow difference between the two conditions.It can be seen from Fig. 5.1.6:(1) When vehicle density is lower than 0.15 and the proportion of large vehicles is from 0.4 to 1, the traffic flow of the two control conditions are basically the same.(2) Except that, the traffic flow under passing lane control condition is slightly larger than that of speed control condition.5.1.3 ConclusionIn this paper, we have established three-lane model of different control conditions, studied the overtaking ratio, speed and traffic flow under different control conditions, vehicle density and proportion of large vehicles.5.2 The solving of second question5.2.1 The building of the stochastic multi-lane traffic model5.2.2 ConclusionOn one hand, from the analysis of the model, in the case the stress is positive, we also consider the jam situation while making the decision. More specifically, if a driver is in a jam BP(situation, applying ))results with a tendency of moving to the right lane for this,2(xRdriver. However in reality, drivers tend to find an emptier lane in a jam situation. For this reason, we apply a Bernoulli process )7.0,2(B where the probability of moving to the right is 0.7and to the left otherwise, and the conclusion is under the rule of keep left except to pass, So, the fundamental reason is the formation of the driving habit.5.3 Taking the an intelligent vehicle system into a accountFor the third question, if vehicle transportation on the same roadway was fully under the control of an intelligent system, we make some improvements for the solution proposed by usto perfect the performance of the freeway by lots of analysis.5.3.1 Introduction of the Intelligent Vehicle Highway SystemsWe will use the microscopic traffic simulator model for traffic simulation purposes. The MPC traffic controller that is implemented in the Matlab needs a traffic model to predict the states when the speed limits are applied in Fig.5.3.1. We implement a METANET model for prediction purpose[14].5.3.2 Control problemAs a constraint, the dynamic speed limits are given a maximum and minimum allowed value. The upper bound for the speed limits is 120 km/h, and the lower bound value is 40 km/h. For the calculation of the optimal control values, all speed limits are constrained to this range. When the optimal values are found, they are rounded to a multiplicity of 10 km/h, since this is more clear for human drivers, and also technically feasible without large investments.5.3.3 Results and analysisWhen the density is high, it is more difficult to control the traffic, since the mean speed might already be below the control speed. Therefore, simulations are done using densities at which the shock wave can dissolve without using control, and at densities where the shock wave remains. For each scenario, five simulations for three different cases are done, each with a duration of one hour. The results of the simulations are reported in Table5.1, 5.2, 5.3.●Enforced speed limits●Intelligent speed adaptationFor the ISA scenario, the desired free-flow speed is about 100% of the speed limit. The desired free-flow speed is modeled as a Gaussian distribution, with a mean value of 100% of the speed limit, and a standard deviation of 5% of the speed limit. Based on this percentage, the influence of the dynamic speed limits is expected to be good[19].5.3.4 The comprehensive analysis of the resultFrom the analysis above, we indicate that adopting the intelligent speed control system can effectively decrease the travel times under the control of an intelligent system, in other words, the measures of dynamic speed control can improve the traffic flow.Evidently, under the intelligent speed control system, the effect of the dynamic speed control measure is better than that under the lane speed control mentioned in the first problem. Becauseof the application of the intelligent speed control system, it can provide the optimal speed limit in time. In addition, it can guarantee the safe condition with all kinds of detection device and the sensor under the intelligent speed system.On the whole, taking all the analysis from the first problem to the end into a account, when it is in light traffic, we can neglect the factor of safe with the help of the intelligent speed control system.Thus, under the state of the light traffic, we propose a new conclusion different from that in the first problem: the rule of keep right except to pass is more effective than that of lane speed control.And when it is in the heavy traffic, for sparing no effort to improve the operation efficiency of the freeway, we combine the dynamical speed control measure with the rule of keep right except to pass, drawing a conclusion that the application of the dynamical speed control can improve the performance of the freeway.What we should highlight is that we can make some different speed limit as for different section of road or different size of vehicle with the application of the Intelligent Vehicle Highway Systems.In fact, that how the freeway traffic operate is extremely complex, thereby, with the application of the Intelligent Vehicle Highway Systems, by adjusting our solution originally, we make it still effective to freeway traffic.6. Improvement of the model6.1 strength and weakness6.1.1 Strength●it is easy for computer simulating and can be modified flexibly to consider actual trafficconditions ,moreover a large number of images make the model more visual.●The result is effectively achieved all of the goals we set initially, meantime the conclusion ismore persuasive because of we used the Bernoulli equation.●We can get more accurate result as we apply Matlab.6.1.2 Weakness●The relationship between traffic flow and safety is not comprehensively analysis.●Due to there are many traffic factors, we are only studied some of the factors, thus ourmodel need further improved.6.2 Improvement of the modelWhile we compare models under two kinds of traffic rules, thereby we come to the efficiency of driving on the right to improve traffic flow in some circumstance. Due to the rules of comparing is too less, the conclusion is inadequate. In order to improve the accuracy, Wefurther put forward a kinds of traffic rules: speed limit on different type of cars.The possibility of happening traffic accident for some vehicles is larger, and it also brings hidden safe troubles. So we need to consider separately about different or specific vehicle types from the angle of the speed limiting in order to reduce the occurrence of traffic accidents, the highway speed limit signs is in Fig.6.1.Fig.6.1Advantages of the improving model are that it is useful to improve the running condition safety of specific type of vehicle while considering the difference of different types of vehicles. However, we found that the rules may be reduce the road traffic flow through the analysis. In the implementation it should be at the85V speed of each model as the main reference basis. Inrecent years, the85V of some researchers for the typical countries from Table 6.1[ 21]:Author Country ModelOttesen andKrammes2000America LCDCLDCVC⨯---=01.0012.057.144.10285Andueza2000 Venezuela].[308.9486.7)/894()/2795(25.9885curvehorizontalLDCRaRVT++--=].[tan819.27)/3032(69.10085gentLRVT+-=Jessen2001 America][00239.0614.0279.080.86185LSDADTGVVP--+=][00212.0432.010.7285NLSDADTVVP-+=Donnell2001 America22)2(8500724.040.10140.04.78TLGRV--+=22)3(85008369.048.10176.01.75TLGRV--+=22)4(8500810.069.10176.05.74TLGRV--+=22)5(8500934.008.21.83TLGV--=BucchiA.BiasuzziK.And SimoneA.2005 ItalyDCV124.0164.6685-=DCEV4.046.3366.5585--=Meanwhile, there are other vehicles driving rules such as speed limit in adverse weather conditions. This rule can improve the safety factor of the vehicle to some extent. At the same time, it limits the speed at the different levels.7. Reference[1] M. Rickert, K. Nagel, M. Schreckenberg, A. Latour, Two lane traffic simulations usingcellular automata, Physica A 231 (1996) 534–550.[20] J.T. Fokkema, Lakshmi Dhevi, Tamil Nadu Traffic Management and Control inIntelligent Vehicle Highway Systems,18(2009).[21] Yang Li, New Variable Speed Control Approach for Freeway. (2011) 1-66。
T eam Control NumberFor office use only0000For office use onlyT1 F1T2 F2T3 Problem Chosen F3T4 A F42014 Mathematical Contest in Modeling (MCM) Summary Sheet(Attach a copy of this page to each copy of your solution paper.)Repeaters Coordination And DistributionFebruary 6,2015AbstractIn this paper, it aims to computing problem on Relay Strategy (repeaters coordination and distribution). According to advanced radio cellular coverage technology, usage of frequency attenuation and geometric mapping methods, Hata model, cellular coverage solution and FDM (Frequency Division Multiplexing) model were established. The algorithms used MATLAB to simulate, with the final modeling results of sensitivity analysis and improvement & promotion on models.Question one : For a circular flat area of radius 40 miles radius, determine the minimum number of repeaters necessary to accommodate 1,000 simultaneous users. Assume that the spectrum available is 145 to 148 MHz, the transmitter frequency in a repeater is either 600 kHz above or 600 kHz below the receiver frequency, and there are 54 different PL tones available.Answer:1. Based on Frequency attenuation expression and calculation with MATLAB, it figuredout the eligible coverage radiuses, which are 30km for BS (base station), and 14.9km for repeater.2. Assuming the users in a given area under uniform distribution, using advancedcellular coverage solution, we can calculate that minimum number of required repeater is 36 under cellular features.3. Based on the US VHF spectrum allocation standard, the minimum spacing for adjacentchannels is 30kHz. And with up to 54 different PL tones, maximum 4320 channels can be allocated to provide 1000 simultaneous users to use at the same time. Conclusion:The minimum number of repeaters necessary to accommodate 1,000 simultaneous users is 36.Question Two : How does your solution change if there are 10,000 users?Answer:1. Since the given spectrum is in a fixed range, even if 54 different PL tones can not be allocated enough channels for 10,000 simultaneous users. So the number of repeaters will be increased, meanwhile, the given area will be divided into different parts.2. On the assumption that uniform distribution of the population in the given area, it will be divided into 3 sub-regions equally by analyzing the binding domain, frequency spectrum and PL tones three independent factors. And then the number of repeaters within each sub-region will be classified discussion.3. The FDM (Frequency Division Multiplexing) model is established here to improve channel efficiency to accommodate up to 10,000 simultaneous users Conclusion:The minimum number of repeaters necessary to accommodate 10,000 simultaneous users is 126.Question Three : Discuss the case where there might be defects in line-of-sight propagation caused by mountainous areas. Answer:Basically, under the same condition for question 1&2, the mountainous area will be analyzed as following:1. The function for relationship between radio attenuation x caused by obstacles and the eligible coverage radius d for repeater is 2249.354371.4110x d -=, which is to analyze the impact on the number of repeaters under full signal coverage. 2. For the mountain barrier, based on the different situation of mountains, the addition of repeaters on the suitable location will be discussed to achieve full coverage. This paper describes model established by using of cellular coverage technology and frequency attenuation expression, to achieve simple, fast, accurate algorithm. And also illustrated the effect takes the entire article. In the end, the sensitivity analysis and error calculation are applied for modeling, making the model practically.Key words: Cellular Coverage technology, frequency attenuation expression, channel allocation, MatlabRepeaters coordination and distributionContent1 Restatement of the Problem (1)1.1 Introduction (1)1.2 The Problem (1)2 Simplifying Assumption (1)3 Phrase explain (1)4 Model (2)4.1 Model I (2)4.1.1 Analysis of the Problem (2)4.1.2 Model Design (2)5 Sensitivity analysis (2)6 Model extension (2)7 Evaluating our model (2)7.1 The strengths of model (2)7.2 The weaknesses of model (2)References (3)1 Restatement of the Problem1.1 IntroductionThe VHF radio spectrum involves line-of-sight transmission and reception. This limitation can be overcome by “repeaters,” which pick up weak signals, amplify them, and retransmit them on a different frequency. Thus, using a repeater, low-power users (such as mobile stations) can communicate with one another in situations where direct user-to-user contact would not be possible. However, repeaters can interfere with one another unless they are far enough apart or transmit on sufficiently separated frequencies.1.2 The ProblemYour job is to:◆Design a scheme that determines the minimum number of repeaters necessaryto accommodate 1,000 simultaneous users in a circular flat area of radius40 miles radius.And assume that the spectrum available is 145 to 148 MHz,the transmitter frequency in a repeater is either 600 kHz above or 600 kHz below the receiver frequency, and there are 54 different PL tones available.◆Change your scheme to accommodate 1,0000 simultaneous users base on yourmodel.◆Discuss the case where there might be defects in line-of-sight propagationcaused by mountainous areas.2 Simplifying Assumption3 Phrase explain4 Model4.1 Model I4.1.1 Analysis of the Problem4.1.2 Model Design5 Sensitivity analysisSymbol◆N: the number of total repeaters in the circle area ◆Q: the number of the users in the circle area◆k: the number of the red circle in figure 2最前面最好有一个Symbol List6 Model extension7 Evaluating our model7.1 The strengths of model7.2 The weaknesses of modelReferences参考文献不要引用非常差的期刊的论文,要引用比较厉害的英文期刊,证明你有足够的阅读文献量。
Summary:clearly describe your approach to the problem and,most prominently,your most important conclusions.●Restatement and clarification of the problem:State in your own words what you aregoing to do.●Explain assumptions and rationale(principle)/justification:Emphasize the assumptionsthat bear on the problem.Clearly list all variables used in your model.●Include your model design and justification for type model used or developed.●Describe model testing and sensitivity analysis,including error analysis,etc.●Discuss the strengths and weaknesses of your model or approach摘要第一段:写论文解决什么问题.1.问题的重述a.介绍重点词开头:例1:“Hand move”irrigation,a cheap but labor-intensive system used on small farms,consists of a movable pipe with sprinkler on top that can be attached to a stationary main.例2:……is a real-life common phenomenon with many complexities.例3:An(effective plan)is crucial to………b.直接指出问题:例1:We find the optimal number of tollbooths in a highway toll-plaza for a given number of highway lanes:the number of tollbooths that minimizes average delay experienced by cars.我们找到了在给定XX的情况下最佳的……例2:A brand-new university needs to balance the cost of information technology security measures with the potential cost of attacks on its systems.XX需要具有B性能的C例3:We determine the number of sprinklers to use by analyzing the energy and motion of water in the pipe and examining the engineering parameters of sprinklers available in the market.我们通过分析参数B确定A,并且检验了现实情况C例4:After mathematically analyzing the……problem,our modeling group would like to present our conclusions,strategies,(and recommendations)to the…….在数学分析B后,我们的模型组将呈现了我们的结论和建议We begin by considering only the rigid recoil effects of the bat–ball col-LisionOur main goal is to understand the sweet spot.A secondary goal is tounderstand the differences between the sweet spots of different bat types.Because the collision happens on such a short time-scale(around1ms),we treat the bat as a free body.That is to say,we are not concerned with the batter’s hands exerting force on the bat that may be transferred to the ball....Our paper is organized as follows....例5:Our goal is...that(minimizes the time)……….2.解决这个问题的伟大意义反面说明。
美赛-数学建模-写作模版(各部分)摘要第一段:写论文解决什么问题1.问题的重述a. 介绍重点词开头:例1:“Hand move” irrigation, a cheap but labor-intensive system used on small farms, consists of a movable pipe with sprinkler on top that can be attached to a stationary main.例2:……is a real-life common phenomenon with many complexities.例3:An (effective plan) is crucial to………b. 直接指出问题:例 1:We find the optimal number of tollbooths in a highway toll-plaza for a given number of highway lanes: the number of tollbooths that minimizes average delay experienced by cars.例2:A brand-new university needs to balance the cost of information technology security measures with the potential cost of attacks on its systems.例3:We determine the number of sprinklers to use by analyzing the energy and motion of water in the pipe and examining the engineering parameters of sprinklers available in the market.例4: After mathematically analyzing the …… problem, our modeling group would like to present our conclusions, strategies, (and recommendations )to the …….例5:Our goal is... that (minimizes the time )……….2.解决这个问题的伟大意义反面说明。
论文reference 格式中文解说版总体要求1 正文中引用的文献与文后的文献列表要完全一致.ν文中引用的文献可以在正文后的文献列表中找到;文献列表的文献必须在正文中引用。
2 文献列表中的文献著录必须准确和完备。
3 文献列表的顺序文献列表按著者姓氏字母顺序排列;姓相同,按名的字母顺序排列;著者姓和名相同,按出版年排列。
νν相同著者,相同出版年的不同文献,需在出版年后面加a、b、c、d……来区分,按文题的字母顺序排列。
如: Wang, M. Y。
(2008a). Emotional……Wang, M。
Y。
(2008b). Monitor……Wang,M。
Y. (2008c). Weakness……4 缩写chap. chapter 章ed。
edition 版Rev. ed。
revised edition 修订版2nd ed. second edition 第2版Ed. (Eds。
)Editor (Editors)编Trans. Translator(s) 译n.d. No date 无日期p。
(pp。
)page (pages)页Vol. Volume (as in Vol。
4) 卷vols。
volumes (as in 4 vols.)卷No。
Number 第Pt。
Part 部分Tech. Rep. Technical Report 技术报告Suppl. Supplement 增刊5 元分析报告中的文献引用ν元分析中用到的研究报告直接放在文献列表中,但要在文献前面加星号*。
并在文献列表的开头就注明*表示元分析用到的的文献。
正文中的文献引用标志在著者—出版年制中,文献引用的标志就是“著者”和“出版年”,主要有两种形式:(1)正文中的文献引用标志可以作为句子的一个成分,如:Dell(1986)基于语误分析的结果提出了音韵编码模型,…….汉语词汇研究有庄捷和周晓林(2001)的研究。
(2)也可放在引用句尾的括号中,如:在语言学上,音节是语音结构的基本单位,也是人们自然感到的最小语音片段。
[DOC]-数学建模美赛论文标准格式参考--中英文对照数学建模美赛论文标准格式参考--中英文对照Your Paper's Title Starts Here: Please Centeruse Helvetica (Arial) 14论文的题目从这里开始:用Helvetica (Arial)14号FULL First Author1, a, FULL Second Author2,b and Last Author3,c 第一第二第三作者的全名1Full address of first author, including country第一作者的地址全名,包括国家2Full address of second author, including country第二作者的地址全名,包括国家3List all distinct addresses in the same way第三作者同上aemail, bemail, cemail第一第二第三作者的邮箱地址Keywords: List the keywords covered in your paper. These keywords will also be used by the publisher to produce a keyword index.关键字: 列出你论文中的关键词。
这些关键词将会被出版者用作制作一个关键词索引。
For the rest of the paper, please use Times Roman (Times New Roman) 12论文的其他部分请用Times Roman (Times New Roman) 12号字Abstract. This template explains and demonstrates how to prepareyour camera-ready paper for Trans Tech Publications. The best is to read these instructions and follow the outline of this text.Please make the page settings of your word processor to A4 format(21 x 29,7 cm or 8 x 11 inches); with the margins: bottom 1.5 cm (0.59 in) and top 2.5 cm (0.98 in), right/left margins must be 2 cm (0.78 in).摘要:这个模板解释和示范供稿技术刊物有限公司时,如何准备你的供相机使用文件。
第一段:写论文解决什么问题1.问题的重述a. 介绍重点词开头:例1:“Hand move” irrigation, a cheap but labor-intensive small farms, a movable pipe with sprinkler on top that can be attached to a stationary main.例2:……is a real-life common phenomenon with many complexities.例3:An (effective plan) is crucial to………b. 直接指出问题:例1:number of tollbooths in a highway toll-plaza for a given number of highway lanes: the number of tollbooths that minimizes average delay experienced by cars.例2:A brand-new university needs to balance the cost of information technology security measures with the potential cost of attacks on its systems.例3:We determine the number of sprinklers to use by analyzing the energy and motion of water in the pipe the engineering parameters of sprinklers available in the market.数学建模美赛论文例4: After mathematically analyzing the …… problem, our modeling group would like to present our conclusions, strategies, (and recommendations )to the …….例5:Our goal is... that (minimizes the time )……….2.解决这个问题的伟大意义反面说明。
如果没有……implementing defensive measure, the university is exposed to an expected of $8.9 million per year.3.总的解决概述a.通过什么方法解决什么问题例:amusement park enjoyment through distributing Quick Passes (QP), reservation slips that ideally allow an individual to spend less time waiting in line.b.实际问题转化为数学模型例1 a network flow vertices are the locations of escorts and wheelchair passengers.例2 : A naïve strategy would be to employ the minimum number of escorts to guarantee that all passengers reach their gates on time.c.将问题分阶段考虑例3:the jump three : flying through the air, punching through the stack, and landing on the ground.第二、三段:具体分析1.在什么模型中/ 建立了什么模型a. 主流模型例1:We formulate a differential model to account for the rates of change of these uses, and how this change the overall consumption of water within the studied region.例2:We examined the mathematical effects of……. We developed a detailed …… (simulation methodology) to test our ideas and to quantify the differences between (among) different …… (strategies).例3:Based on (write your basis .such as the theory of supply and demand), we establish a model (such as differential equation system that includes demand, supply).例4:To (write the aims), we establish a criterion (write the criterion).b. 模型非主流例5:We build a model to determine how to lay out the pipe each time the equipment is moved. 例6:We determine …………例7:We build a model to determine……….例8:We formulate a model for………By analyzing …and examining…..2.分析模型(使用什么数据,怎么做,一般三句话)a. 写历史数据例1:Using historical data from the United States, we determine initial conditions for our model. b. 写计算机模拟例1:this model leads to a computer simulation of catch-can tests of the irrigation system and ……例2:Software packing reaches………by calculating and comparing………..c. 运用数据模拟例1:to ground this model in reality, we incorporate extensive demographic data and run…… 例2:We fit the modified model to data (such as 1970-2003.). We conclude that (write the last conclude).d. 讲详细分析例1:We physically characterize the syste m that…例2:We provide a strategy (write the logical strategy).例3:The …model is (efficient, intuitive, and flexible) and could be applied to…例4:To meet the needs of people today without, we establish a criterion of rational(合理的标准) oil allocation(分配).3.总结该模型的结果/得到什么结论a. 说明不是最优但能产生作用例:We show that this strategy is not optimal but can be improved by assigning differentnumbers……b. 说明如果用这个模型,结果如何例1:If Delta Airlines were to utilize the naïve strategy at Atlanta International Airport, the cost woul d be ……例2:We modify the model to reflect (some trend such as exponentially increasing……) and generalize the model to (other field).例3:Our results are summarized in the formula for the optimal number Bof tollbooths for c.通过其上情况的列举得到的结论例:For various situations, we propose an optimal solution.d. 得出了结论例1:we elicit that a conclusion.例2:We conclude with a series of recommendations for how best to…e.进一步说明其他因素对模型的影响例:In addition to the model, we also discuss policies for …..f.用真实数据检验模型例:To demon strate how our model works, we apply it to ………..最后一段:写总的结论a. 说明结论的可行性例:Our suggested solution, which is easy to implement, includes a detailed timetable and the arrangement of pipes.b.说明算法的广泛性例1:Our algorithm is broad enough to accommodate various airport concourses, flight schedules, and flight delays.例2:Our analysis began by determining what factor impact……, Our conclusions are presented……c.说明模型可用于其他领域例:Since our model is based on…… it can be applied to (other domain).其他(承上启下的连接词/常用词组)例:In addition to the model, we also discuss……引言部分(1)回顾研究背景,常用词汇有review, summarize, present, outline, describe等(2)说明写作目的,常用词汇有purpose, attempt, aim等,另外还可以用动词不定式充当目的状语来表达(3)介绍论文的重点内容或研究范围,常用词汇有study, present, include, focus, emphasize, emphasis, attention等方法部分(1)介绍研究或试验过程,常用词汇有test study, investigate, examine, experiment, discuss, consider, analyze, analysis等(2)说明研究或试验方法,常用词汇有measure, estimate, calculate等(3)介绍应用、用途,常用词汇有等结果部分(1)展示研究结果,常用词汇有show, result, present等(2)介绍结论,常用词汇有summary, introduce, conclude等讨论部分(1)陈述论文的论点和作者的观点,常用词汇有suggest, repot, present, expect, describe等(2)说明论证,常用词汇有等support, provide, indicate, identify, find, demonstrate, confirm, clarify(3)推荐和建议,常用词汇有suggest, suggestion, recommend, recommendation, propose, necessity, necessary, expect等。