数据结构说明书
- 格式:doc
- 大小:180.66 KB
- 文档页数:15

[键入公司名称]设计说明书航空订票系统软件***班***2018/1/9[在此处键入文档摘要。
摘要通常为文档内容的简短概括。
在此处键入文档摘要。
摘要通常为文档内容的简短概括。
]设计说明书设计说明书 (1)1.程序系统的结构 (2)2.程序1 (标识符)设计说明 (2)1)程序描述 (2)2)功能 (2)3)性能 (2)4)输入项 (2)5)输出项 (2)6)算法 (3)7)流程逻辑 (3)8)接口 (3)9)存储分配 (3)10)注释设计 (3)11)限制条件 (3)12)测试计划 (3)13)尚未解决的问题 (3)3.程序2 (标识符)设计说明 (4)1 .程序系统的结构用一系列图表列出本程序系统内的每个程序(包括每个模块和子程序)的名称、标识符和它们之间的层次结构关系。
实现的功能:2.程序1 (标识符)设计说明从本节开始,逐个地给出各个层次中的每个程序的设计考虑。
以下给出的提纲是针对一般情况的。
对于一个具体的模块,尤其是层次比较低的模块或子程序,其很多条目的内容往往与它所隶属的上一层模块的对应条目的内容相同,在这种情况下,只要简单地说明这一点即可。
1)程序描述给出对该程序的简要描述,主要说明安排设计本程序的目的意义,并且,还要说明本程序的特点(如是否有返回值?等)。
2)功能说明该程序应具有的功能,可采用输入一处理一输出的形式。
3)性能说明对该程序的全部性能要求,包括对精度、灵活性和时间特性的要求。
4)输入项给出对每一个输入项的特性,包括名称、标识、数据的类型和格式、数据值的有效范围、输入的方式。
数量和频度、输入媒体(例如键盘,文件等、输入数据的来源和安全保密条住笺笺件等等。
5)输出项给出对每一个输出项的特性,包括名称、标识、数据的类型和格式,数据值的有效范围,输出的形式、数量和频度,输出(例如显示器,文件等、对输出图形及符号的说明、安全保密条件等等。
6)算法详细说明本程序所选用的算法,具体的计算公式和计算步骤。
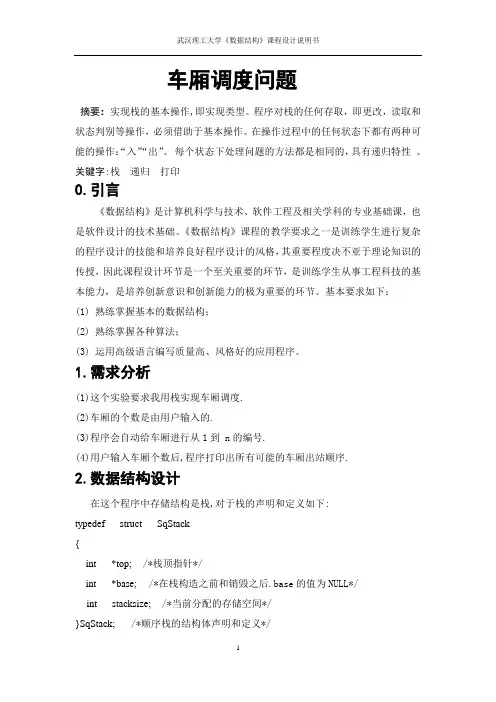
车厢调度问题摘要:实现栈的基本操作,即实现类型。
程序对栈的任何存取,即更改,读取和状态判别等操作,必须借助于基本操作。
在操作过程中的任何状态下都有两种可能的操作:“入”“出”。
每个状态下处理问题的方法都是相同的,具有递归特性。
关键字:栈递归打印0.引言《数据结构》是计算机科学与技术、软件工程及相关学科的专业基础课,也是软件设计的技术基础。
《数据结构》课程的教学要求之一是训练学生进行复杂的程序设计的技能和培养良好程序设计的风格,其重要程度决不亚于理论知识的传授,因此课程设计环节是一个至关重要的环节,是训练学生从事工程科技的基本能力,是培养创新意识和创新能力的极为重要的环节。
基本要求如下:(1) 熟练掌握基本的数据结构;(2) 熟练掌握各种算法;(3) 运用高级语言编写质量高、风格好的应用程序。
1.需求分析(1)这个实验要求我用栈实现车厢调度.(2)车厢的个数是由用户输入的.(3)程序会自动给车厢进行从1到 n的编号.(4)用户输入车厢个数后,程序打印出所有可能的车厢出站顺序.2.数据结构设计在这个程序中存储结构是栈,对于栈的声明和定义如下:typedef struct SqStack{int *top; /*栈顶指针*/int *base;/*在栈构造之前和销毁之后.base的值为NULL*/int stacksize; /*当前分配的存储空间*/}SqStack; /*顺序栈的结构体声明和定义*/3.算法设计3.1 对算法的简单描述这个实验中, 要求用到栈. 实现栈的基本操作,即实现类型。
程序对栈的任何存取(即更改,读取和状态判别等操作)必须借助于基本操作。
在操作过程中的任何状态下都有两种可能的操作:“入”“出”。
每个状态下处理问题的方法都是相同的,具有递归特性。
栈实现是方便的无论如何调度,我们的操作都是入栈和出栈,设定入栈为1,出栈为-1,对n列车厢有2n次这样的操作,例如n=4,则有操作1111-1-1-1-1、1-11-11-11-1等.所以还要构造一个操作命令队列trainlist[]。
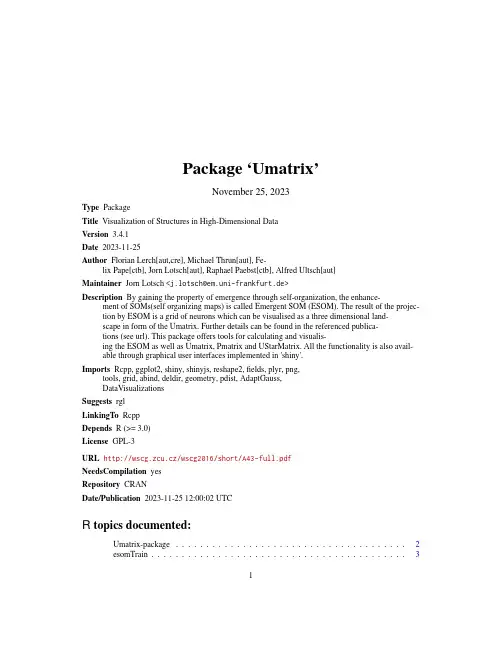
Package‘Umatrix’November25,2023Type PackageTitle Visualization of Structures in High-Dimensional DataVersion3.4.1Date2023-11-25Author Florian Lerch[aut,cre],Michael Thrun[aut],Fe-lix Pape[ctb],Jorn Lotsch[aut],Raphael Paebst[ctb],Alfred Ultsch[aut]Maintainer Jorn Lotsch<*************************.de>Description By gaining the property of emergence through self-organization,the enhance-ment of SOMs(self organizing maps)is called Emergent SOM(ESOM).The result of the projec-tion by ESOM is a grid of neurons which can be visualised as a three dimensional land-scape in form of the Umatrix.Further details can be found in the referenced publica-tions(see url).This package offers tools for calculating and visualis-ing the ESOM as well as Umatrix,Pmatrix and UStarMatrix.All the functionality is also avail-able through graphical user interfaces implemented in'shiny'.Imports Rcpp,ggplot2,shiny,shinyjs,reshape2,fields,plyr,png,tools,grid,abind,deldir,geometry,pdist,AdaptGauss,DataVisualizationsSuggests rglLinkingTo RcppDepends R(>=3.0)License GPL-3URL http://wscg.zcu.cz/wscg2016/short/A43-full.pdfNeedsCompilation yesRepository CRANDate/Publication2023-11-2512:00:02UTCR topics documented:Umatrix-package (2)esomTrain (3)12Umatrix-package Hepta (4)iClassification (5)iEsomTrain (6)iUmapIsland (7)iUstarmatrix (7)plotMatrix (8)pmatrixForEsom (10)showMatrix3D (11)umatrixForEsom (12)ustarmatrixCalc (12)Index14 Umatrix-package Umatrix-packageDescriptionThe ESOM(emergent self organizing map)is an improvement of the regular SOM(self organizing map)which allows for toroid grids of neurons and is intended to be used in combination with the Umatrix.The set of neurons is referred to as weights within this package,as they represent the values within the high dimensional space.The neuron with smallest distance to a datapoint is calleda Bestmatch and can be considered as projection of said datapoint.As the Umatrix is usually toroid,it is drawn four consecutive times to remove border effects.An island,or Imx,is afilter mask,which cuts out a subset of the Umatrix,which shows every point only a single time while avoiding border effects cutting through potential clusters.Finally the Pmatrix shows the density structures within the grid,by a set radius.It can be combined with the Umatrix resulting in the UStarMatrix,which is therefore a combination of density based structures as well as clearly divided ones. ReferencesUltsch,A.:Data mining and knowledge discovery with emergent self-organizing feature maps for multivariate time series,In Oja,E.&Kaski,S.(Eds.),Kohonen maps,(1ed.,pp.33-46),Elsevier, 1999.Ultsch,A.:Maps for the visualization of high-dimensional data spaces,Proc.Workshop on Self organizing Maps(WSOM),pp.225-230,Kyushu,Japan,2003.Ultsch,A.:U*C:Self-organized Clustering with Emergent Feature Maps,Lernen,Wissensent-deckung und Adaptivitaet(LWA),pp.240-244,Saarbruecken,Germany,2005.Loetsch,J.,Ultsch,A.:Exploiting the Structures of the U-Matrix,in Villmann,T.,Schleif,F.-M., Kaden,M.&Lange,M.(eds.),Proc.Advances in Self-Organizing Maps and Learning Vector Quantization,pp.249-257,Springer International Publishing,Mittweida,Germany,2014.Ultsch,A.,Behnisch,M.,Loetsch,J.:ESOM Visualizations for Quality Assessment in Clustering, In Merenyi,E.,Mendenhall,J.M.&O’Driscoll,P.(Eds.),Advances in Self-Organizing Maps and Learning Vector Quantization:Proceedings of the11th International Workshop WSOM2016,pp.39-48,Houston,Texas,USA,January6-8,2016,(10.1007/978-3-319-28518-4_3),Cham,Springer International Publishing,2016.esomTrain3 Thrun,M.C.,Lerch,F.,Loetsch,J.,Ultsch,A.:Visualization and3D Printing of Multivariate Data of Biomarkers,in Skala,V.(Ed.),International Conference in Central Europe on Computer Graphics,Visualization and Computer Vision,Plzen,2016.esomTrain Train an ESOM(emergent self organizing map)and project dataDescriptionThe ESOM(emergent self organizing map)algorithm as defined by[Ultsch1999].A set of weigths(neurons)on a two-dimensional grid get trained to adapt the given datastructure.The weights will be used to project data on a two-dimensional space,by seeking the BestMatches for every datapoint.ArgumentsData Data that will be used for training and projectionLines Height of gridColumns Width of gridEpochs Number of Epochs the ESOM will runToroid If TRUE,the grid will be toroidNeighbourhoodFunctionType of Neighbourhood;Possible values are:"cone","mexicanhat"and"gauss"StartLearningRateInitial value for LearningRateEndLearningRateFinal value for LearningRateStartRadius Start value for the Radius in which will be searched for neighboursEndRadius End value for the Radius in which will be searched for neighboursNeighbourhoodCoolingCooling method for radius;"linear"is the only available option at the moment LearningRateCoolingCooling method for LearningRate;"linear"is the only available option at themomentshinyProgress Generate progress output for shiny if Progress Object is givenShiftToHighestDensityIf True,the Umatrix will be shifted so that the point with highest density will beat the centerInitMethod name of the method that will be used to choose initializations Valid Inputs: "uni_min_max":uniform distribution with minimum and maximum from sam-pleData"norm_mean_2std":normal distribuation based on mean and standarddeviation of sampleDataKey Vector of numeric keys matching the datapoints.Will be added to Bestmatches UmatrixForEsom If TRUE,Umatrix based on resulting ESOM is calculated and returned4HeptaDetailsOn a toroid grid,opposing borders are connected.ValueList withBestMatches BestMatches of datapointsWeights Trained weightsLines Height of gridColumns Width of gridToroid TRUE if grid is a toroidReferencesKohonen,T.,Self-organized formation of topologically correct feature maps.Biological cybernet-ics,1982.43(1):p.59-69.Ultsch,A.,Data mining and knowledge discovery with emergent self-organizing feature maps for multivariate time series.Kohonen maps,1999.46:p.33-46.Examplesdata( Hepta )res=esomTrain(Hepta$Data,Key=1:nrow(Hepta$Data))Hepta Hepta from FCPS(Fundamental Clustering Problem Suite)DescriptionDataset with7easily seperable classes.Usagedata("Hepta")DetailsSize212,Dimensions3,stored in Hepta$DataClasses7,stored in Hepta$ClsReferencesUltsch,A.:U*C:Self-organized Clustering with Emergent Feature Maps,Lernen,Wissensent-deckung und Adaptivitaet(LW A),pp.240-244,Saarbruecken,Germany,2005.iClassification5 Examplesdata(Hepta)str(Hepta)iClassification GUI for manual classificationDescriptionThis tool is a’shiny’GUI that visualizes a given Umatrix and allows the user to select areas and mark them as clusters.ArgumentsUmatrix Matrix of Umatrix HeightsBestMatches Array with positions of BestmatchesCls Classification of the BestmatchesImx Matrix of an island that will be cut out of the UmatrixToroid Are BestMatches placed on a toroid grid?TRUE by defaultValueA vector containing the selected class ids.The order is corresponding to the given BestmatchesReferencesThrun,M.C.,Lerch,F.,Loetsch,J.,Ultsch,A.:Visualization and3D Printing of Multivariate Data of Biomarkers,in Skala,V.(Ed.),International Conference in Central Europe on Computer Graphics,Visualization and Computer Vision,Plzen,2016.Examples##Not run:data("Hepta")e=esomTrain(Hepta$Data,Key=1:nrow(Hepta$Data))cls=iClassification(e$Umatrix,e$BestMatches)##End(Not run)6iEsomTrain iEsomTrain iEsomTrainDescriptionTrains the ESOM and shows the Umatrix.ArgumentsData Matrix of Data that will be used to learn.One DataPoint per rowBestMatches Array with positions of BestmatchesCls Classification of the Bestmatches as a vectorKey Numeric vector of keys matching the BestmatchesToroid Are BestMatches placed on a toroid grid?TRUE by defaultValueList withUmatrix matrix with height values of the umatrixBestMatches matrix containing the bestmatchesLines number of lines of the chosen ESOMColumns number of columns of the chosen ESOMEpochs number of epochs of the chosen ESOMWeights List of weightsToroid True if a toroid grid was usedEsomDetails Further details describing the chosen ESOM parametersReferencesThrun,M.C.,Lerch,F.,Loetsch,J.,Ultsch,A.:Visualization and3D Printing of Multivariate Data of Biomarkers,in Skala,V.(Ed.),International Conference in Central Europe on Computer Graphics,Visualization and Computer Vision,Plzen,2016.iUmapIsland7 iUmapIsland iUmapIslandDescriptionThe toroid Umatrix is usually drawn4times,so that connected areas on borders can be seen asa whole.An island is a manual cutout of such a tiled visualization,that is selected such that allconnected areas stay intact.This’shiny’tool allows the user to do this manually.ArgumentsUmatrix Matrix of Umatrix HeightsBestMatches Array with positions of BestMatchesCls Classification of the BestMatchesValueBoolean Matrix that represents the island within the tiled UmatrixReferencesThrun,M.C.,Lerch,F.,Loetsch,J.,Ultsch,A.:Visualization and3D Printing of Multivariate Data of Biomarkers,in Skala,V.(Ed.),International Conference in Central Europe on Computer Graphics,Visualization and Computer Vision,Plzen,2016.Examples##Not run:data("Hepta")e=esomTrain(Hepta$Data,Key=1:nrow(Hepta$Data))Imx=iUmapIsland(e$Umatrix,e$BestMatches)plotMatrix(e$Umatrix,e$BestMatches,Imx=Imx$Imx)##End(Not run)iUstarmatrix iUstarmatrixDescriptionCalculates the Ustarmatrix by combining a Umatrix with a Pmatrix.ArgumentsWeights Weights that were trained by the ESOM algorithmLines Height of the used gridColumns Width of the used gridData Matrix of Data that was used to train the ESOM.One datapoint per rowImx Island mask that will be cut out from displayed UmatrixCls Classification of the BestmatchesToroid Are weights placed on a toroid grid?ValueUstarmatrix matrix with height values of the UstarmatrixReferencesThrun,M.C.,Lerch,F.,Loetsch,J.,Ultsch,A.:Visualization and3D Printing of Multivariate Data of Biomarkers,in Skala,V.(Ed.),International Conference in Central Europe on Computer Graphics,Visualization and Computer Vision,Plzen,2016.plotMatrix plotMatrixDescriptionDraws a plot based of given Umatrix or Pmatrix.ArgumentsMatrix Umatrix or Pmatrix to be plottedBestMatches Positions of BestmMtches to be plotted onto the UmatrixCls Class identifier for the BestMatchesClsColors Vector of colors that will be used to colorize the different classesColorStyle If"Umatrix"the colors of a Umatrix(Blue->Green->Brown->White)will be used;If"Pmatrix"the colors of a Pmatrix(White->Yellow->Red)will beusedToroid Should the Umatrix be drawn4times?BmSize Integer between0.1and5,magnification factor of the drawn BestMatch circles DrawLegend If TRUE,a color legend will be drawn next to the plotFixedRatio If TRUE,the plot will be drawn with afixed ratio of x and y axisCutoutPol Only draws the area within given polygonNrlevels Number of height levels that will be used within the UmatrixTransparentContoursUse half transparent contours.Looks better but is slowImx Mask to cut out an island.Every value should be either1(stays in)or0(gets cut out)Clean If TRUE axis,margins,...surrounding the Umatrix image will be removed RemoveOcean If TRUE,the surrounding blue area around an island will be reduced as much as possible(while still maintaining a rectangular form)TransparentOceanIf TRUE,the surrounding blue area around an island will be transparent Title A title that will be drawn above the plotBestMatchesLabelsVector of strings corresponding to the order of BestMatches which will be drawnon the plot as labelsBestMatchesShapeNumeric value of Shape that will be used.Responds to the usual shapes ofggplotMarkDuplicatedBestMatchesIf TRUE,BestMatches that are shown more than once within an island,will bemarkedYellowCircle If TRUE,a yellow circle is drawn around Bestmatches to distinct them better from backgroundDetailsThe heightScale(nrlevels)is set at the proportion of the1percent quantile against the99percent quantile of the matrix values.ValueA’ggplot’of a MatrixReferencesThrun,M.C.,Lerch,F.,Loetsch,J.,Ultsch,A.:Visualization and3D Printing of Multivariate Data of Biomarkers,in Skala,V.(Ed.),International Conference in Central Europe on Computer Graphics,Visualization and Computer Vision,Plzen,2016.Ultsch,A.:Maps for the visualization of high-dimensional data spaces,Proc.Workshop on Self organizing Maps(WSOM),pp.225-230,Kyushu,Japan,2003.Siemon,H.P.,Ultsch,A.:Kohonen Networks on Transputers:Implementation and Animation,in: Proceedings Intern.Neural Networks,Kluwer Academic Press,Paris,pp.643-646,1990.Examplesdata("Hepta")e=esomTrain(Hepta$Data,Key=1:nrow(Hepta$Data))plotMatrix(e$Umatrix,e$BestMatches)10pmatrixForEsom pmatrixForEsom pmatrixForEsomDescriptionGenerates a Pmatrix based on the weights of an ESOM.ArgumentsData A[n,k]matrix containing the dataWeights Weights stored as a list in a2D matrixLines Number of lines of the SOM that is described by weightsColumns Number of columns of the SOM that is described by weightsRadius The radius for measuring the density within the hyperspherePlotIt If set the Pmatrix will also be plottedToroid Are BestMatches placed on a toroid grid?TRUE by defaultValueUstarMatrixReferencesUltsch,A.:Maps for the visualization of high-dimensional data spaces,Proc.Workshop on Self organizing Maps(WSOM),pp.225-230,Kyushu,Japan,2003.Ultsch,A.,Loetsch,J.:Computed ABC Analysis for Rational Selection of Most Informative Vari-ables in Multivariate Data,PloS one,V ol.10(6),pp.e0129767.doi10.1371/journal.pone.0129767, 2015.Thrun,M.C.,Lerch,F.,Loetsch,J.,Ultsch,A.:Visualization and3D Printing of Multivariate Data of Biomarkers,in Skala,V.(Ed.),International Conference in Central Europe on Computer Graphics,Visualization and Computer Vision,Plzen,2016.Examplesdata("Hepta")e=esomTrain(Hepta$Data,Key=1:nrow(Hepta$Data))Pmatrix=pmatrixForEsom(Hepta$Data,e$Weights,e$Lines,e$Columns,e$Toroid)plotMatrix(Pmatrix,ColorStyle="Pmatrix")showMatrix3D11 showMatrix3D showMatrix3DDescriptionVisualizes the matrix(Umatrix/Pmatrix)in an interactive window in3D.ArgumentsMatrix Matrix to be plottedBestMatches Positions of BestMatches to be plotted onto the matrixCls Class identifier for the BestMatch at the given pointImx a mask(island)that will be used to cut out the UmatrixToroid Should the Matrix be drawn4times(in a toroid view)HeightScale Optional.Scaling Factor for Mountain HeightBmSize Size of drawn BestMatchesRemoveOcean Remove as much area sourrounding an island as possibleColorStyle Either"Umatrix"or"Pmatrix"respectevily for their colorsShowAxis Draw an axis arround the drawn matrixSmoothSlope Try to increase the island size,to get smooth slopes around the islandClsColors Vector of colors that will be used for classesFileName Name for a stlfile to write the Matrix toDetailsThe heightScale is set at the proportion of the1percent quantile against the99percent quantile of the Matrix values.ReferencesThrun,M.C.,Lerch,F.,Loetsch,J.,Ultsch,A.:Visualization and3D Printing of Multivariate Data of Biomarkers,in Skala,V.(Ed.),International Conference in Central Europe on Computer Graphics,Visualization and Computer Vision,Plzen,2016.Examples##Not run:data("Hepta")e=esomTrain(Hepta$Data,Key=1:nrow(Hepta$Data))showMatrix3D(e$Umatrix)##End(Not run)umatrixForEsom umatrixForEsomDescriptionCalculate the Umatrix for given ESOM projectionArgumentsWeights Weights from which the Umatrix will be calculatedLines Number of lines of the SOM that is described by weightsColumns Number of columns of the SOM that is described by weightsToroid Boolean describing if the neural grid should be borderlessValueUmatrixReferencesUltsch,A.and H.P.Siemon,Kohonen’s Self Organizing Feature Maps for Exploratory Data Anal-ysis.1990.Examplesdata("Hepta")e=esomTrain(Hepta$Data,Key=1:nrow(Hepta$Data))umatrix=umatrixForEsom(e$Weights,Lines=e$Lines,Columns=e$Columns,Toroid=e$Toroid)plotMatrix(umatrix,e$BestMatches)ustarmatrixCalc ustarmatrixCalcDescriptionThe UStarMatrix is a combination of the Umatrix(average distance to neighbours)and Pmatrix (density in a point).It can be used to improve the Umatrix,if the dataset contains density based structures.ArgumentsUmatrix A given UmatrixPmatrix A density matrixValueUStarMatrixReferencesUltsch,A.U*C:Self-organized Clustering with Emergent Feature Maps.in Lernen,Wissensent-deckung und Adaptivitaet(LW A).2005.Saarbruecken,Germany.Examplesdata("Hepta")e=esomTrain(Hepta$Data,Key=1:nrow(Hepta$Data))Pmatrix=pmatrixForEsom(Hepta$Data,e$Weights,e$Lines,e$Columns,e$Toroid)Ustarmatrix=ustarmatrixCalc(e$Umatrix,Pmatrix)plotMatrix(Ustarmatrix,e$BestMatches)Index∗ESOMesomTrain,3Umatrix-package,2∗High-Dimensional Data Umatrix-package,2∗High-dimensionalUmatrix-package,2∗HighdimensionalUmatrix-package,2∗P-MatrixpmatrixForEsom,10∗P-matrixpmatrixForEsom,10∗PmatrixpmatrixForEsom,10∗ProjectionUmatrix-package,2∗SOMesomTrain,3Umatrix-package,2∗U*-MatrixustarmatrixCalc,12∗U*-matrixustarmatrixCalc,12∗U*matrixustarmatrixCalc,12∗U-MatrixUmatrix-package,2umatrixForEsom,12∗U-matrixumatrixForEsom,12∗UmatrixUmatrix-package,2umatrixForEsom,12∗Ustar-MatrixustarmatrixCalc,12∗Ustar-matrixustarmatrixCalc,12∗UstarmatrixustarmatrixCalc,12∗VisualizationUmatrix-package,2∗datasets Hepta FCPSHepta,4∗esomesomTrain,3∗self organizing mapesomTrain,3∗somesomTrain,3esomTrain,3Hepta,4iClassification,5iEsomTrain,6iUmapIsland,7iUstarmatrix,7plotMatrix,8pmatrixForEsom,10showMatrix3D,11Umatrix-package,2umatrixForEsom,12ustarmatrixCalc,1214。

数据结构课程设计说明书年月日1设计目的(小标题黑体五号字)设计一个计算机管理系统完成图书管理基本业务(数据可以存储在一个数据文件中,数据结构、具体数据自定)。
2.设计内容和要求具体功能有:1)每种书的登记内容包括书号、书名、著作者、出版单位、现存量和库存量;2)对书号建立索引表(线性表)以提高查找效率;3)采编入库:新购一种书,确定书号后,登记到图书帐目表中,如果表中已有,则只将库存量增加;4)借阅:如果一种书的现存量大于0,则借出一本,登记借阅者的书证号和归还期限,改变现存量;5)归还:注销对借阅者的登记,改变该书的现存量.3.本设计所采用的数据结构所用数据结构:线性表、查找、排序链表:用一组地址任意的存储单元存放线性表中的数据元素.以元素(数据元素的映象) + 指针(指示后继元素存储位置)= 结点(表示数据元素或数据元素的映象)以“结点的序列”表示线性表称作线性链表(单链表)单链表是一种链式存取的结构,为找第i 个数据元素必须先找到第i—1 个数据元素。
因此,查找第i 个数据元素的基本操作为:移动指针,比较j 和i。
(1)malloc(size)在内存的动态存储区申请一个长度为size字节的连续空间.(2)calloc(n,size)在内存的动态存储区申请n个长度为size字节的连续空间,函数返回值为分配空间的首地址.若此函数未被成功执行,函数返回值为0。
(3)free(p)释放由指针p所指向的存储单元,而存储单元的大小是最近一次调用malloc()或calloc()函数时所申请的存储空间。
运用了单链表的插入、删除、排序、修改等一些操作!4.功能模块详细设计4。
1 详细设计思想(一)基本思想:(二)图书信息录入、图书信息的查询、图书信息的排序、图书信息的修改、图书信息的删除、图书的借阅、图书的归还、退出图书管理系统。
(三)程序中的主要函数有:void main()//主函数int CreateListR(LinkList *L)//尾插法建表void LocateElem(LinkList *L) //查询int Sort(LinkList *L) //递增有序排序(直接插入排序法)void Display(LinkList *L) //输出排序结果ModifyList(LinkList *L)//修改int ListDelete(LinkList *L) //删除void Borrow(LinkList *L)//借阅void Return(LinkList *L)//归还4.2 核心代码#include <stdio。

《数据结构》课程设计说明书题目哈夫曼编码与译码学号1267159206姓名张燕斌指导教师康懿日期2014.01。
02任务书目录第一章需求分析 (5)第二章总体设计 (6)第三章抽象数据类型定义 (7)3。
1 LinkList抽象数据类型的设计 (7)3.2 HuffmanTree抽象数据的设计 (7)第四章详细设计..。
...。
..。
....。
.....。
.。
.。
..。
.。
....。
.。
..。
..。
.。
.。
.。
.。
..。
....。
....。
.。
..。
...。
...。
7第五章测试 (10)第六章总结 (11)附录:程序代码 (12)第一章需求分析哈夫曼编码是一种编码方式,以哈夫曼树—即最优二叉树,带权路径长度最小的二叉树,经常应用于数据压缩。
哈弗曼编码使用一张特殊的编码表将源字符(例如某文件中的一个符号)进行编码。
这张编码表的特殊之处在于,它是根据每一个源字符出现的估算概率而建立起来的(出现概率高的字符使用较短的编码,反之出现概率低的则使用较长的编码,这便使编码之后的字符串的平均期望长度降低,从而达到无损压缩数据的目的)。
赫夫曼编码的应用很广泛,利用赫夫曼树求得的用于通信的二进制编码称为赫夫曼编码。
树中从根到每个叶子都有一条路径,对路径上的各分支约定:指向左子树的分支表示“0”码,指向右子树的分支表示“1”码,取每条路径上的“0”或“1”的序列作为和各个叶子对应的字符的编码,这就是赫夫曼编码。
哈弗曼译码输入字符串可以把它编译成二进制代码,输入二进制代码时可以编译成字符串。
第二章总体设计(1)输入一个字符串用结构体链表存储字符串中出现的不同字符及其出现的次数。
(2)定义赫夫曼数的结点结构体,把不同的字符及其在字符串中出现的次数作为叶子结点的元素及其权值,统计叶子结点的个数n,开辟可以存储2*n个结点的顺序表,来赫夫曼树的各个结点,然后按照一定的规则构造赫夫曼树。
(3)开辟一个可以存储叶子结点元素及指向存储其赫夫曼编码链表的指针的顺序表,然后从叶子结点开始向上访问,是左孩子的把“0”接进链表是右孩子的把“1”接进链表,直到根结点,然后把叶子结点的元素及存储其赫夫曼链表的头指针读入顺序表,直到把所有的叶子结点的元素及指向存储其赫夫曼编码链表的头指针读入顺序表,这样得到的赫夫曼编码是倒序的。


《数据结构》课程设计指导书沈阳理工大学.信息学院2013.11.1一.目的与意义软件设计能力对计算机专业的学生是很重要。
通过数据结构的学习,使学生对软件编程能力有一定的提高。
数据结构课程设计是锻炼学生在进一步掌握模块化、结构化程序设计的方法的同时,培养学生运用已学知识分析问题、解决问题及编写实用程序的能力,通过对线性化、层次化、网络化数据结构的了解进一步掌握自然数据的结构方式及组织方式,让学生深入体会存储在计算机中的数据及程序中如何运用数据实现编程。
主要目的如下:1.通过本课程设计使学生对面向对象的设计过程有初的认识,并对面向对象的高能语言的学习打下基础,2.通过不同类型的程序设计使学生进一步掌握数据的几种不同的组织和存储方式,为高级编程做准备,3.为专业课的深入学习和毕业设计打基础二.任务和要求分析每一组题目,按要求完成相应的题目:1.题目参照附录中《数据结构课程设计》题目选题。
2. 要求:1)对相应的题目进行算法设计2)编写源代码3)上机调试4)显示调试结果5)写出实验总结3.课程设计说明书设计完成后,将自己选定的题目按上述要求完成课程设计说明书。
课程设计说明书内容包含:题目、要求、初步设计(可以是流程图、功能模块图)、详细设计、程序代码、测试数据、运行结果、遇到的问题及总结几部分。
三.进度安排设计总学时为2周第一周:查阅资料、小组讨论、进行模块划分写出分析报告,画N-S结构化框图,编写程序清单,上机调试.第二周周四、五:验收(计算机机房),并将课程设计报告交上来.四.考核标准与成绩评定方式成绩评定有如下几项参考:1.初步设计内容的考核:是否有查阅资料能力?是否有设计思想?2.程序编码能力调试能力的考核:程序是否清晰、易读?在技算计上是否可独立完成程序的调试,是否熟练?3.说明书质量的考核:设计结构是否合理?叙述是否正确?方案是否可行?4.答辩:设计结果的调试能力,对自己设计是否熟练?5.出勤率极平时表现的考核:出勤超过2次不到者成绩为不及格。

摘要数据结构是研究与数据之间的关系,我们称这一关系为数据的逻辑结构,简称数据结构。
当数据的逻辑结构确定以后,数据在物理空间中的存储方式,称为数据的存储结构。
相同的逻辑结构可以具有不同的存储结构,因而有不同的算法。
本次课程设计,程序中的数据采用“树形结构”作为其数据结构。
具体采用的是“二叉排序树”,并且使用“一维数组”来作为其存储结构。
一维数组顺序表存储结构是用一组地址连续的存储单元依次自上而下、自左而右存储完全二叉树上的结点元素;本课程设计实现了二叉排序树的创建、中序遍历、计算二叉排序树的平均查找长度和删除二叉排序树中某个结点。
本课程主要介绍了本课题的开发背景,所要完成的功能和开发的过程。
重点说明了系统的设计思路、总体设计、各个功能模块的设计与实现方法。
关键词:二叉排序树的实现;C语言;数据结构;线性表;顺序表;中序遍历。
目录摘要 (I)1 课题背景的介绍 (3)1.1 课题背景 (3)1.2 目的 (3)2 需求分析 (3)课程设计题目、任务及要求 (3)课程设计思想 (4)3 系统总体设计 (5)3.1 系统模块划分 (5)3.2 二叉排序树的生成过程 (5)3.3 主要功能模块设计 (5)4 系统详细设计 (7)4.1 主函数菜单模块 (7)4.2 查找模块 (8)4.3 插入模块 (9)4.4 中序遍历模块 (10)删除模块 (11)5 系统连编与运行 (13)6 总结 (14)参考文献 (15)附录 (14)A)课题背景的介绍课题背景随着经济的迅速发展,各行各业纷纷应用电脑数据信息管理。
当然数据信息是一个很笼统的概念,随着现代信息的大量增加,其处理难度也越来越大,如何对各个数据信息进行更好的树立,这就是我们研究这个课题的目的。
在电脑迅速发展的今天,将电脑这一信息处理器应用于实际数据问题问题的信息计算已是势必所然,而且这也将数据信息处理带来前所未有的改变。
采用电脑对数据的信息处理是信息科学化和现代化的重要标志,它也给各行各业带来了明显的经济效益。
数据结构设计说明书范文一、引言本数据结构设计说明书旨在详细描述项目的数据结构设计和实现方案。
通过本说明书,项目团队成员可以更好地理解数据结构的设计思路和实现方法,确保项目的顺利进行。
二、项目背景项目名称:XXX项目项目目标:通过数据结构的设计和实现,解决XXX问题,提高XXX效率。
三、数据结构设计1.数据结构概述本项目的数据结构主要涉及以下几种类型:XXX类型、XXX类型、XXX类型等。
这些数据结构将用于存储和处理项目中的各种数据。
2.数据结构详细设计(1)XXX类型:该类型用于存储XXX信息,包括XXX字段和XXX字段。
其中,XXX字段用于存储XXX信息,XXX字段用于存储XXX信息。
(2)XXX类型:该类型用于存储XXX信息,包括XXX字段和XXX字段。
其中,XXX字段用于存储XXX信息,XXX字段用于存储XXX信息。
(3)XXX类型:该类型用于存储XXX信息,包括XXX字段和XXX字段。
其中,XXX字段用于存储XXX信息,XXX字段用于存储XXX信息。
3.数据结构之间的关系本项目中的数据结构之间存在多种关系,如父子关系、关联关系等。
这些关系将用于实现数据的层次化和关联化。
四、数据结构实现方案1.实现语言和工具本项目将采用XXX语言进行实现,使用XXX工具进行开发。
2.实现步骤和方法(1)编写数据结构代码:根据设计好的数据结构,编写相应的代码实现。
(2)测试数据结构:对编写好的代码进行测试,确保数据的正确性和稳定性。
(3)优化数据结构:根据测试结果,对数据进行优化,提高数据处理的效率。
五、数据结构使用指南1.使用方法说明在使用本项目的数据结构时,需要遵循以下步骤:首先,创建相应的数据结构实例;其次,根据需求对数据进行操作;最后,对数据进行销毁或释放。
2.使用注意事项在使用本项目的数据结构时,需要注意以下几点:首先,确保数据的正确性和完整性;其次,注意数据的操作顺序和安全性;最后,定期对数据进行备份和恢复。
Package‘tdigest’October14,2022Type PackageTitle Wicked Fast,Accurate Quantiles Using t-DigestsVersion0.4.1Date2022-10-03Description The t-Digest construction algorithm,byDunning et al.,(2019)<arXiv:1902.04023v1>,uses a variant of1-dimensional k-means clustering to produce a very compact data structure that allowsaccurate estimation of quantiles.This t-Digest data structure can be usedto estimate quantiles,compute other rank statistics or even to estimaterelated measures like trimmed means.The advantage of the t-Digest overprevious digests for this purpose is that the t-Digest handles data withfullfloating point resolution.The accuracy of quantile estimates producedby t-Digests can be orders of magnitude more accurate than those producedby previous digest algorithms.Methods are provided to create and updatet-Digests and retrieve quantiles from the accumulated distributions.URL https://git.sr.ht/~hrbrmstr/tdigestBugReports https://todo.sr.ht/~hrbrmstr/tdigestCopyrightfile inst/COPYRIGHTSEncoding UTF-8License MIT+file LICENSESuggests testthat,covr,spellingDepends R(>=3.5.0)Imports magrittr,statsRoxygenNote7.2.1Language en-USNeedsCompilation yesAuthor Bob Rudis[aut,cre](<https:///0000-0001-5670-2640>), Ted Dunning[aut](t-Digest algorithm;<https:///tdunning/t-digest/>),Andrew Werner[aut](Original C+code;<https:///ajwerner/tdigest>)12as.list.tdigestMaintainer Bob Rudis<**********>Repository CRANDate/Publication2022-10-0423:40:02UTCR topics documented:as.list.tdigest (2)td_add (3)td_create (3)td_merge (4)td_quantile_of (4)td_total_count (5)td_value_at (5)tquantile (6)Index8as.list.tdigest Serialize a tdigest object to an R list or unserialize a serialized tdigestlist back into a tdigest objectDescriptionThese functions make it possible to create&populate a tdigest,serialize it out,read it in at a later time and continue populating it enabling compact distribution accumulation&storage for large, "continuous"datasets.Usage##S3method for class tdigestas.list(x,...)as_tdigest(x)Argumentsx a tdigest object or a tdigest_list object...unusedExamplesset.seed(1492)x<-sample(0:100,1000000,replace=TRUE)td<-tdigest(x,1000)as_tdigest(as.list(td))td_add3 td_add Add a value to the t-Digest with the specified countDescriptionAdd a value to the t-Digest with the specified countUsagetd_add(td,val,count)Argumentstd t-Digest objectval valuecount countValuethe original,updated tdigest objectExamplestd<-td_create(10)td_add(td,0,1)td_create Allocate a new histogramDescriptionAllocate a new histogramUsagetd_create(compression=100)is_tdigest(td)Argumentscompression the input compression value;should be>=1.0;this will control how aggres-sively the t-Digest compresses data together.The original t-Digest paper sug-gests using a value of100for a good balance between precision and efficiency.It will land at very small(think like1e-6percentile points)errors at extremepoints in the distribution,and compression ratios of around500for large datasets(~1million datapoints).Defaults to100.td t-digest object4td_quantile_ofValuea tdigest objectReferencesComputing Extremely Accurate Quantiles Using t-DigestsExamplestd<-td_create(10)td_merge Merge one t-Digest into anotherDescriptionMerge one t-Digest into anotherUsagetd_merge(from,into)Argumentsfrom,into t-DigestsValueintoa tdigest objecttd_quantile_of Return the quantile of the valueDescriptionReturn the quantile of the valueUsagetd_quantile_of(td,val)Argumentstd t-Digest objectval valuetd_total_count5Valuethe computed quantile(double)td_total_count Total items contained in the t-DigestDescriptionTotal items contained in the t-DigestUsagetd_total_count(td)##S3method for class tdigestlength(x)Argumentstd t-Digest objectx a tdigest objectValuedouble containing the size of the t-DigestExamplestd<-td_create(10)td_add(td,0,1)td_total_count(td)length(td)td_value_at Return the value at the specified quantileDescriptionReturn the value at the specified quantileUsagetd_value_at(td,q)##S3method for class tdigestx[i,...]Argumentstd t-Digest objectq quantile(range0:1)x a tdigest objecti quantile(range0:1)...unusedValuethe computed quantile(double)Examplestd<-td_create(10)td_add(td,0,1)%>%td_add(10,1)td_value_at(td,0.1)td_value_at(td,0.5)td[0.1]td[0.5]tquantile Calculate sample quantiles from a t-DigestDescriptionCalculate sample quantiles from a t-DigestUsagetquantile(td,probs)##S3method for class tdigestquantile(x,probs=seq(0,1,0.25),...)Argumentstd t-Digest objectprobs numeric vector of probabilities with values in range0:1 x numeric vector whose sample quantiles are wanted...unusedValuea numeric vector containing the requested quantile valuesReferencesComputing Extremely Accurate Quantiles Using t-DigestsExamplesset.seed(1492)x<-sample(0:100,1000000,replace=TRUE)td<-tdigest(x,1000)tquantile(td,c(0,.01,0.1,0.2,0.3,0.4,0.5,0.6,0.7,0.8,0.9,0.99,1)) quantile(td)Index[.tdigest(td_value_at),5as.list.tdigest,2as_tdigest(as.list.tdigest),2is_tdigest(td_create),3length.tdigest(td_total_count),5 quantile.tdigest(tquantile),6td_add,3td_create,3td_merge,4td_quantile_of,4td_total_count,5td_value_at,5tquantile,68。
数据库的数据模型和结构说明书一、引言数据库的数据模型和结构说明书是为了对数据库的设计和结构进行详细的阐述和说明,以便其他开发人员能够理解和使用该数据库。
本文将详细介绍数据库的数据模型和结构,包括实体关系模型(ER模型)、关系数据库模型等。
二、实体关系模型(ER模型)实体关系模型是一种用于描述现实世界中事物、事物之间关系的概念模型。
在数据库设计中,我们可以通过实体关系模型来表示各个实体之间的联系,并确定实体间的属性和关系。
通过实体关系模型的描述,我们可以有效地组织和管理数据。
1. 实体(Entity)实体是指在现实世界中可以区别和独立存在的事物或对象,如学生、课程、教师等。
每个实体都有唯一的标识符(主键),并拥有自己的属性。
2. 属性(Attribute)属性是实体所拥有的特征或性质,在数据库中以字段的形式表示。
例如,学生实体可以有学号、姓名、性别等属性。
3. 关系(Relationship)关系是实体之间的联系和互动,可以是一对一、一对多或多对多的关系。
例如,学生和课程之间存在选课的关系,一个学生可以选择多门课程,而一门课程也可以有多名学生选择。
三、关系数据库模型关系数据库模型是一种基于关系代数的数据库模型,它是以关系表(二维表格)的形式来组织和存储数据。
在关系数据库模型中,数据以行和列的形式存储,并使用关系运算来操作和查询数据。
1. 表(Table)表是关系数据库模型中的基本组织单元,用于存储具有相同属性的数据。
每个表由一组字段(列)组成,每一行代表一条记录。
表的设计需要考虑字段的数据类型、长度、约束等。
2. 主键(Primary Key)主键是表中用于唯一标识每条记录的字段或字段组合。
它可以保证表中的每条记录都有唯一的标识符,用于实现数据的关联和查询。
3. 外键(Foreign Key)外键是一个表中的字段,它引用了另一个表中的主键。
通过外键的引用关系,我们可以建立表与表之间的联系,实现数据的关联和一致性。
说明: 全部用红字标识的表及字段-----未使用状态全部用蓝字标识的表及字段------新增且在用状态用蓝字标识的表字段------新增且在用状态黑字标识的表字段------在用状态目录手术部分1. 1. 手术管理 (9)1.1手术安排OPERATION_SCHEDULE (9)1.2安排手术名称SCHEDULED_OPERATION_NAME (10)1.3手术间OPERATING_ROOM (10)1.4手术信息OPERATION_MASTER (11)1.5术中换班护士登记OPERATION_NURSE_SHIFT (12)1.6手术名称OPERATION_NAME (12)1.7取消手术预约记录OPERATION_CANCELED (12)1.8取消手术名称OPERATION_NAME_CANCELED (13)1.9病人手术费用项目OPERATION_BILL_ITEMS (13)1.10手术室工作质量统计ST_OP_ROOM_WORK (14)1.11手术收费单模板OPER_BILL_TEMPLET (14)1.12麻醉收费单模板ANES_BILL_TEMPLET (14)1.13手术麻醉费用统计表ST_OPER_COSTS (14)1.14手术病人麻醉记录ANESTHESIA_PLAN (15)1.15手术病人麻醉总结ANESTHESIA_SUMMARY (16)1.16术后麻醉随访记录ANESTHESIA_INQUIRY (17)1.17器材准备清单OPERATION_EQIP_DETAIL (18)1.18麻醉事件ANESTHESIA_EVENT (18)1.19麻醉事件定义ANESTHESIA_EVENT_OPEN (19)1.20手术病人麻醉记录初始化模板ANESTHESIA_TEMPLET (19)1.21术后麻醉随访记录初始化模板INQUIRY_TEMPLET (20)1.22术后麻醉总结初始化模板SUMMARY_TEMPLET (21)1.23器材准备清单模板OPERATION_EQIP_TEMPLET (21)1.24医生初始化模板配置表TEMPLET_CONFIG (22)1.25术中生命体征结果PATIENT_MONITOR_DATA (22)1.26监控参数MONITOR_FUNCTION_CODE (22)1.27监控仪信息MONITOR_INFO (23)1.28手术间配置字典BED_MONITOR_DICT (23)1.29麻醉常用术语ANESTHESIA_COMM_DICT (23)1.30组合查询条件字典ANESTHESIA_QUERY_CON (23)1.31PATIENT_LAB_DATA (23)1.32药品请领单主记录DRUG_APPLICATION_LIST_MASTER (24)1.33药品请领单明细记录DRUG_APPLICATION_LIST_DETAIL (24)1.34手术岗位字典OPS_POST_DICT (24)1.35手术登记项目字典OPS_ ITEM_DICT (24)1.36术后登记—岗位交接班情况OPS_REGIST_POST (24)1.37术后登记—登记项目OPS_REGIST_ITEM (25)1.38工作人员计分表OPS_REGISTE_MARK (25)2.医疗保险 (25)2.1医疗保险帐户INSURANCE_ACCOUNTS (25)2.2帐户金续入记录ACCOUNT_DEPOSIT_REC (26)2.3医疗保险帐户门诊支付累计ACCOUNT_PAYMENT_FOR_OUTP (26)2.4医疗保险帐户住院支付累计ACCOUNT_PAYMENT_FOR_INP (27)2.5保险类别字典INSURANCE_TYPE_DICT (27)2.6门诊病人医疗保险支付方案选项SCHEMA_OPTION_FOR_OUTP (28)2.7住院病人医疗保险支付方案选项SCHEMA_OPTION_FOR_INP (28)2.8门诊病人医疗保险支付方案PAY_SCHEMA_FOR_OUTP (29)2.9住院病人医疗保险支付方案PAY_SCHEMA_FOR_INP (29)2.10医疗保险特殊医疗项目字典PAY_SPECIAL_ITEM_DICT (29)2.11医疗保险特殊医疗项目排斥字典PAY_SPECIAL_EXCEPT_DICT (30)2.12被保人类别字典INSURED_IDENTITY_DICT (30)2.13被保人所在单位字典INSURED_UNIT_DICT (30)2.14被保人单位类别字典INSURED_UNIT_CLASS_DICT (30)2.15医保帐户注销原因字典INSUR_CAN_CAUSE_DICT (31)2.16帐户状态字典ACCOUNT_STATUS_DICT (31)2.17帐户金续入摘要字典DEPOSIT_SUMMARY_DICT (31)2.18医疗费支付主记录MEDICAL_PAYMENT_MASTER (31)2.19医疗费支付明细记录MEDICAL_PAYMENT_DETAIL (32)2.20医疗保险支撑系统配置INSURANCE_SYSTEM_CONFIG (32)2.21医疗保险远程传送记录INSUR_SYNC_SETTING (32)2.22医疗费报销记录INSURANCE_REIMBURSE (32)2.23合同单位病人住院记录ST_IND_CONTRACT_PATIENT (33)2.24合同单位病人住院费用明细ST_IND_CONTRACT_INCOME (33)2.25合同单位病人门诊记录ST_OUTD_CONTRACT_PATIENT (33)2.26合同单位病人门诊费用明细ST_OUTD_CONTRACT_INCOME (34)2.27不计入帐户费用按病人身份及医保类别统计表ST_INSURANCE_INCOME_EXC (34)2.28医疗费用按病人身份统计表ST_INSURANCE_IDENTITY (34)2.29INSUR_SYNC_SETTING (34)3.经济统计 (35)3.1门诊收入构成统计ST_OUTD_INCOME_BY_CLASS (35)3.2住院收入构成统计ST_IND_INCOME_BY_CLASS (35)3.3门诊收入支付方式统计ST_OUTD_INCOME_BY_MONEY (35)3.4住院收入支付方式统计ST_IND_INCOME_BY_MONEY (35)3.5门诊收入开单科室统计ST_OUTD_INCOME_BY_OD (35)3.6住院收入开单科室统计ST_IND_INCOME_BY_OD (36)3.7门诊收入执行科室统计ST_OUTD_INCOME_BY_ED (36)3.8住院收入执行科室统计ST_IND_INCOME_BY_ED (36)3.9门诊收入按病人身份统计ST_OUTD_INCOME_BY_IDENT (36)3.10住院收入按病人身份统计ST_IND_INCOME_BY_IDENT (37)3.11门诊收入按病人费别统计ST_OUTD_INCOME_BY_CHGTYP (37)3.12住院收入按病人费别统计ST_IND_INCOME_BY_CHGTYP (37)3.13医疗收入统计各查询信息表LIST_ST_QUERY (37)3.14医疗收入统计各生成查询数据信息表LIST_ST_MAKE (38)3.15ST_DOCT(有数据,程序中没有调用) (38)3.16ST_EFFICIENCY_BY_DNI(没有) (38)3.17ST_EFFI_QA_BY_DEPT(没有) (38)3.18ST_INCOME(没有) (39)3.19ST_INCOME_RECKON_DICT(没有) (39)3.20ST_IND_INCOME_BY_CHGTYP_HAPPEN(没有) (40)3.21ST_IND_INCOME_BY_DEPTCLS(未用) (40)3.22住院收费合同单位汇总表ST_INP_CONTRACT_TOT_INCOM (40)3.23住院费用明细转储表ST_INPBILL_DETAIL_CONVEY (40)3.24ST_INP_ACCT_DAY_ED(未用没有数据) (41)3.25ST_INP_ACCT_DAY_OD(未用没有数据) (41)3.26住院收费合同单位收入明细表ST_INP_CONTRACT_TOT_INCOM_SUB (41)3.27ST_INP_DAY_CHARGE(未用) (41)3.28ST_INP_DAY_CHGTYP(未用) (41)3.29ST_INP_DAY_CLASS(未用) (42)3.30ST_INP_DAY_ED(没有) (42)3.31ST_INP_DAY_GD(未用) (42)3.32ST_INP_DAY_MONEY(没有) (42)3.33ST_INP_DAY_OD(没有) (42)3.34住院收入汇总分析数据表ST_INP_INCOM_REPORT (43)3.35住院收入汇总明细报表分析统计ST_INP_INCOM_REPORT_DETAIL (43)3.36ST_INP_REPORT_BASE_DATA(没有) (43)3.37住院收入统计明细报表ST_INP_TOTAL_REVE_REPORT (44)3.38医院全院住院收入统计表ST_INP_TOTAL_REVE_REPORT_SUB (44)3.39住院医保费用合计表ST_INSUR_FEE_OF_TOTAL (44)3.40ST_NUM(没有) (45)3.41按开单科室住院收入表ST_OD_ED_DEPT_UNIT (45)3.42开单与执行科室对照结算日报表ST_OD_ED_RECKDAY (45)3.43开单与执行科室对照结算月报表ST_OD_ED_RECKMONTH (45)3.44住院开单/执行科室应收实收费用统计ST_ORDER_DEPT_UNIT (46)3.45科室住院综合统计表ST_ORDER_OUTSETTLE(数据为空) (46)3.46ST_OUTD_CONTRACT_INCOME(未使用) (46)3.47ST_OUTD_CONTRACT_PATIENT(未使用)(门诊合同单位) (47)3.48按病人费别统计费用ST_OUTD_INCOME_BY_CHGTYP (47)3.49ST_OUTD_INCOME_BY_CLASS(未使用) (47)3.50ST_OUTD_INCOME_BY_DEPTCLS(没有) (47)3.51按执行科室计价/实际收入统计ST_OUTD_INCOME_BY_ED (47)3.52按人员身份计价/实际收入统计ST_OUTD_INCOME_BY_IDENT (48)3.53门诊人员身份计价/实际收入统计ST_OUTD_INCOME_BY_MONEY (48)3.54门诊按开单科室计价收入/实际收入统计表ST_OUTD_INCOME_BY_OD (48)3.55ST_OUTD_CONTRACT_INCOM_SUB(没有) (48)3.56ST_OUTP_DAY_CHGTYP(没有) (48)3.57ST_OUTP_DAY_CLASS(没有) (48)3.58ST_OUTP_DAY_ED(没有) (49)3.59ST_OUTP_DAY_MONEY(没有) (49)3.60ST_OUTP_DAY_OD(没有) (49)3.61ST_OUTP_INCOM_REPORT(没有) (49)3.62ST_OUTP_INCOM_REPORT_DETAIL(没有) (49)3.63ST_OUTP_TOTAL_REVE_REPORT(没有) (50)3.64ST_OUTP_TOTAL_REVE_REPORT_SUB(没有) (50)3.65ST_PREPAY_INP_AND_OUTP(没有) (50)3.66菜单信息表T_ECONRPT_MENU (50)3.67用户对应菜单表T_ECONRPT_PURVIEV (51)4.成本核算 (51)4.1科室成本明细DEPT_COST_DETAIL (51)4.2科室分解成本DEPT_CLASSFIED_COST (51)4.3成本项目字典COST_ITEM_DICT (51)4.4成本核算类别(科目)字典COST_SUBJECT_DICT (51)4.5成本分解计算方案字典COST_CALC_SCHM_DICT (52)4.6成本分解计算方案COST_CALC_SCHM (52)4.7科室附加收入DEPT_APPENDED_INCOME (52)4.8收入分配方案DISTRIBUTION_CALC_SCHM (52)4.9收入分配统计表ST_INCOME_DISTRIBUTION (52)4.10收入报表项目字典RECK_REPORT_ITEM_DICT (53)4.11收入报表项目定义RECK_REPORT_ITEM_DEF (53)4.12核算单位字典RECKON_UNIT_DICT (53)4.13核算单位与科室对照RECKON_UNIT_VS_DEPT (53)4.14医疗损益统计表PROFIT_AND_LOSE (53)5.设备管理 (54)5.1订购申请表EQ_ORDER_DEMAND (54)5.2设备合同明细表EQUIP_CONTRACT_DETAIL (54)5.3设备合同主表EQUIP_CONTRACT_MASTER (55)5.4设备折旧记录EQUIP_DEPR_REC (55)5.5付款记录EQUIP_DISBURSE_REC (55)5.6设备档案表EQUIP_DOCUMENT (56)5.7设备附件表EQUIP_DOCUMENT_SPAREPART (56)5.8设备顺序记录表EQUIP_ORDER_REC (57)5.9设备购买明细表EQUIP_PURCHASE_DETAIL (57)5.10设备购买主表EQUIP_PURCHASE_MASTER (57)5.11设备质量调整表EQUIP_QUALITY_GRAND_ADJUST (58)5.12设备维修记录EQUIP_REPAIR_REC (58)5.13设备入出转记录EQUIP_TRANSFERED_REC (58)5.14消耗品付款明细记录EXP_DISBURSE_REC_DETAIL (59)5.15消耗品档案EXP_DOCUMENT (59)5.16合同表EQ_CONTRACT (59)5.17合同细表EQ_CONTRACT_DETAIL (60)5.18合同附件表EQ_CONTRACT_ACCESSORIES (60)5.19库存附件表EQ_STOCK_ACCESSORIES (61)5.20配件分类ACCE_CLASS_DICT (61)5.21索赔情况表EQ_COMPENSATION (61)5.22日处理流水帐表EQ_DAYBOOD (61)5.23库存表EQ_STOCK (62)5.24仪器设备档案表EQ_EQUIPMENT_DOCUMENT (63)5.25维修结果登记表EQ_SERVICE_RESULT_REGISTER (64)5.26维修配件使用情况表EQ_SERVICE_FITTING_USE (65)5.27设备维修累计表EQ_SERVICE_ADDUP (65)5.28仪器设备使用情况表EQ_EQUIPMENT_APPLY (66)5.29仪器设备退役表EQ_RETIREMENT (66)5.30仪器设备折旧方法调整表EQ_DEPRECIATORY_METHOD_ADJUST (66)5.31仪器设备质量等级调整表EQ_QUALITY_GRAND_ADJUST (67)5.32库房月结表EQ_STORE_ACCOUNTS_MOUNTHLY (67)5.33基本情况表EQ_BASIC_STATE (68)5.34设备品名编码表EQ_NAME_CODING (68)5.35制造厂商表EQ_MANUFACTURE_FIRM (68)5.36代理商表EQ_AGENT (69)5.37设备类别字典EQUIP_TYPE_DICT (69)5.38维修单位情况表EQ_SERVICE_UNIT (69)5.39设备经费来源表EQ_FUND_SOURCE (69)5.40工作人员姓名表EQ_STAFF_DICT (70)5.41上报设备档案表EQ_SUPERIOR (70)5.42上报设备维修结果登记表EQ_SUPERIOR_SERVICE_REGISTER (71)5.43上报设备维修结果登记累积表EQ_SUPERIOR_SERVICE_ADDUP (71)5.44上报设备品名编码表EQ_SUPERIOR_NAME_CODING (72)5.45单位基本情况上报表EQ_SUPERIOR_BASIC_STATE (72)5.46制造厂商上报表EQ_SUPERIOR_MANUFACTURE_FIRM (72)5.47代理商表上报EQ_SUPERIOR_AGENT (73)5.48用户权限表EQ_USER_POPEDOM (73)5.49仪器设备使用情况上报表EQ_SUPERIOR_APPLY (73)5.50装备标准统计表EQ_EQUIP_STANDARD (74)5.51组合查询表EQ_ASSEMBLED (74)5.52EQ_AMOUCURR_SYS (74)5.53设备档案转储临时表EQ_EQUIPMENT_DOCUMENT_TEMP (74)5.54ABC界限确定EQ_TEMPORARY_FILE (74)6.消耗品管理 (75)6.1消耗品类别字典EXP_CLASS_DICT (75)6.2消耗品入库方式字典EXP_EXPORT_CLASS_DICT (75)6.3消耗品基本信息表EXP_INFO (75)6.4消耗品品名编码表EXP_NAME (75)6.5消耗品别名编码表EXP_ALIAS (76)6.6消耗品一级分类表EXP_CLASS_PRIM (76)6.7消耗品类别表EXP_CLASS (76)6.8生产厂家名称字典EXP_FACTORY (76)6.9消耗品销售单位字典EXP_SELL (76)6.10消耗品库房名称字典EXP_STOCK_NAME (77)6.11入库类别字典EXP_IN_KIND (77)6.12出库类别字典EXP_OUT_KIND (77)6.13消耗品属性字典EXP_ATTR (77)6.14消耗品入库台帐表EXP_INPUT_ACCOUNT (77)6.15入库流水帐表EXP_IN_BOOK (78)6.16消耗品出库台帐表EXP_OUTPUT_ACCOUNT (78)6.17出库流水帐表EXP_OUT_BOOK (79)6.18消耗品库存单元表EXP_STOCK (79)6.19消耗品包装物品字典EXP_PACK (80)6.20消耗手术物品准备表EXP_OPERATE_CONSUM (80)6.21消耗品科室及其分类字典EXP_DEPT_CLASS (80)6.22消耗品常用物品信息列表EXP_COMMON_LIST (81)6.23科室下月支领计划EXP_DRAW_PROXIMO (81)6.24消耗品采购计划表EXP_PLAN (81)6.25调价表EXP_MODI_PRIC (82)6.26库房月结表EXP_BALANCE (82)6.27材料与价表科目对照APPLIANCE_VS_PRICE_CLASS (82)6.28库房管理权限表EXP_USER (83)6.29消耗品出库明细表EXP_EXPORT_DETAIL (83)6.30消耗品出库主表EXP_EXPORT_MASTER (83)6.31消耗品类型字典EXP_FORM_DICT (84)6.32消耗品入库分类字典EXP_IMPORT_CLASS_DICT (84)6.33消耗品入库明细EXP_IMPORT_DETAIL (84)6.34消耗品入库主表EXP_IMPORT_MASTER (85)6.35消耗品盘点表EXP_INVENTORY_CHECK (85)6.36消耗品调价记录表EXP_PRICE_MODIFY (86)6.37消耗品调价盈亏记录EXP_PRICE_MODIFY_PROFIT (86)6.38科室请领消耗品记录EXP_PROVIDE_APPLICATION (86)6.39消耗品申请发放通知EXP_PROVIDE_NOTICE (87)6.40消耗品月结表EXP_STOCK_BALANCE (87)6.41消耗品库房科室EXP_STORAGE_DEPT (88)6.42病人消耗品使用记录EXP_PATS_USE_REC (88)6.43消耗品子库房字典EXP_SUB_STORAGE_DICT (89)6.44科室下月支领计划EXP_DRAW_PROXIMO (89)7.输血管理 (91)7.1初始化参数表COUNT_TABLE (91)7.2个体/特殊捐血者计数表COUNT_TABLE1 (91)7.3捐血者身份确认BLOOD_DONOR_ID (91)7.4特殊/个体血型捐血者档案BLOOD_ARCHIVE_ID (91)7.5内科查体/初检/复检化验审核表CHECK_RESULT (92)7.6查体/初检/复检化验项目CHECK_ITEM (92)7.7检验试剂记录表CHECK_REAGENT (92)7.8检查项目结果字典库CHECK_DIC_RESULT (92)7.9检查项目字典库CHECK_DIC (93)7.10血液在库登记本BLOOD_REC (93)7.11血液出库登记本BLOOD_EXPORT (94)7.12血液入库费用支付情况表BLOOD_FEE (94)7.13成份血液对照表BLOOD_FEE_PRICE (95)7.14用血预约申请单BLOOD_APPLY (95)7.15申请用血量表BLOOD_CAPACITY (96)7.16配血表BLOOD_MATCH (96)7.17发血单BLOOD_OUT_SHEET (96)7.18采血前分离血液成份表BLOOD_TYPE_ADD (97)7.19血液出库化价明细表BLOOD_PRICE (97)7.20血液成分字典BLOOD_COMPONENT (97)7.21献血单位计划表DONOR_UNIT (98)7.22献血单位预约表DONOR_UNIT_DETAIL (98)7.23病人用血反应表BLOOD_REACTION (98)7.24血液来源字典BLOOD_SOURCE_DIC (98)7.25血液质量控制字典BLOOD_QUALITY_DIC (98)7.26血液质控记录BLOOD_QUALITY (99)7.27血液治疗申请单BLOOD_TREAT (99)7.28治疗项目明细表BLOOD_TREAT_DETAIL (99)7.29血证信息BLOOD_PAPER (99)7.30互助金信息BLOOD_PAPER_FEE (100)7.31血液入库主表BLOOD_INP_MASTER (100)7.32血液入库明细表BLOOD_INP_DETAIL (100)7.33血液出库主表BLOOD_OUTP_MASTER (100)7.34血液出库明细表BLOOD_OUTP_DETAIL (101)7.35血液出库方式表BLOOD_OUTP_TYPE (101)7.36配血方法字典BLOOD_WAY_DICT (101)7.37成分血全血统计总量BLOOD_RATE (101)7.38验血表BLOOD_TEST (101)7.39验血划价表BLOOD_TEST_PRICE (102)8.健康体检 (102)8.1体检人员身份字典PE_MASTER_INDEX (102)8.2体检主记录字典PE_VISIT (102)8.3体检人员情况字典PE_INFORMATION (102)8.4体检医生字典PE_DOCTOR (103)8.5用户菜单字典PE_USER_MENU (103)8.6体检科室字典PE_DEPT_DICT (103)8.7体检项目字典PE_ITEM_DICT (103)8.8体检项目组合字典PE_ITEM_ASSEMBLED_DICT (104)8.9体检项目组合与体检项目对照字典PE_ASSEM_VS_ITEM_DICT (104)8.10单据字典PE_CHART_DICT (104)8.11体检套餐字典PE_ITEM_ASSEM_SET_DICT (104)8.12体检套餐项目字典PE_SET_VS_ITEM_DICT (104)8.13体检单位名称字典PE_HOSPITAL_DEPT_DICT (105)8.14体检人员结果中项目医生字典PE_ITEM_DOCTOR_DICT (105)8.15体检人员体检结果字典PE_RESULT_DICT (105)8.16体检疾病字典 PE_DISEASE _DICT (105)8.17体检人员单位字典PE_UNIT_DICT (105)8.18体检预约分组情况字典PE_GROUPING_DICT (106)8.19分组字典GROUPING_DETAIL_DICT (106)8.20个人体检项目字典PE_PERSONAL_ITEM_DICT (106)8.21体检费用字典PE_BILLING_ITEM_DICT (107)8.22体检小结报告书写模板字典PE_REPORT_TEMPLATE_DICT (107)8.23小结包含异常项目字典PE_TEMPLATE_ABNORMITY_DICT (107)8.24体检结果异常包含类别字典PE_ABNORMITY_ITEM_DICT (107)8.25体检结果异常条件判别字典PE_ABNORMITY_CONDITION_DICT (107)8.26体检项目结果关键字字典PE_ITEM_REPORT_WRITE_DICT (108)8.27个人体检项目建议字典PE_SUGGEST_DICT (108)8.28体检项目建议项目字典PE_SUGGEST_ITEM_DICT (108)8.29体检项目建议描述字典PE_SUGGEST_CONDITION_DICT (108)8.30单位体检主记录字典PE_UNIT_VISIT (109)8.31体检收款字典PE_RCPT_MASTER (109)8.32体检结账字典PE_ACCT_MASTER (109)8.33单位体检报告临时表PE_REPORT_TMP (110)9.营养膳食 (110)9.1医院食谱分类字典HOSPITAL_DIET_CLASS_DICT (110)9.2医院食谱定义HOSPITAL_DIET_INDEX (110)9.3医院食谱安排记录HOSPITAL_DIET_SCHEDULE (110)9.4医院每日食谱HOSPITAL_DIET_FOR_DAY (111)9.5病人定餐记录PATS_DIET_REC (111)9.6伙食费交款记录 (111)9.7伙食费收据结算说明DIET_RCPT_REC (112)10.感染控制 (112)10.1微生物分类字典GERM_CODE_DICT (112)10.2与感染监控相关的诊疗项目字典INFECT_VS_CLINIC (112)10.3组合查询条字典件INFECT_QUERY_DICT (112)10.4公共编码字典COMM_CODE_DICT (112)10.5细菌药敏字典GERMDRUGSENSIT_DICT (113)10.6感染病人报告INFECT_PAT_REPORT (113)10.7抗生素使用详细信息PATIENT_USE_ANTIBO (113)10.8病人微生物检验信息GERM_TEST (114)10.9微生物涂片检验结果GERM_TEST_RESULT (114)10.10微生物药敏检验结果DRUG_SENSIT_RESULT (114)10.11介入操作信息INTERPOSITION_RESULT (115)10.12其它治疗信息OTHER_TREAT_RESULT (115)10.13血尿便常规STOOL_URINE_RESULT (115)10.14感染工作月统计INFECT_STAT_WORK_SUM (116)10.15细菌室工作月统计GERM_WORK_SUM (116)10.16病案检索结果QUERY_PATIENT_TEMP (116)10.17感染检查主题MANAGER_TEST_MAIN (117)10.18感染检查标准MANAGER_TEST (117)10.19科室感染检查内容DEPT_INFECT_TEST_TOPIC (117)10.20科室感染检查结果DEPT_INFECT_TEST_REC (117)10.21病人抗生素使用信息ANTIBO_USE_INFO (117)10.22监测项目字典DISINFECT_ITEM_DICT (118)10.23监测结果DISINFECT_SUPERVISE_RESULT (118)10.24查询条件INFECT_QUERY_CON (118)10.25感染报告卡INFECT_REPORTCARD (118)10.26科室房间字典SUPERVISE_DEPT_ROOM_DICT (119)10.27环境检测项目类别字典SUPERVISE_ITEM_DICT (119)11.科研训练 (119)11.1工作人员基本信息表STAFF_APPEND_INFO (119)11.2单位科训信息表DEPT_TRAINING_INFO (120)11.3教学课件COURSE_WARE (120)11.4教学计划TEACH_PLAN (120)11.5教务通知TEACH_NOTICE (121)11.6教员授课安排COURSE_PLAN (121)11.7科研论文信息SCIENCE_PAPER (121)11.8毕业论文信息GRADUATE_PAPER (122)11.9科研成果信息SCIENCE_PRODUCTION (122)11.10科研课题SCIENCE_PROJECT (122)11.11继续教育CONTINUED_EDU (123)11.12受训情况EDUCATED_INFO (123)11.13考核成绩EXAM_SCORE (123)11.14学术论坛SCIENCE_FORUM (124)12.护理管理 (124)12.1护理科室基本情况NURSING_DEPT_DICT (124)12.2护理人员基本信息NURSE_PERSONNEL_INFO (124)12.3护理人员离位登记NURSE_LEAVE_LOG (125)12.4护理人员调动情况NURSE_TRANSFER (125)12.5护理人员排班表NURSE_SCHEDULE (126)12.6护理人员排班备注NURSE_SCHEDULE_REMARK (126)12.7护士长月工作计划主记录HEADNURSE_PLAN_MASTER (126)12.8护士长月工作计划明细记录HEADNURSE_PLAN_DETAIL (126)12.9护理教学查房标准项目WARD_INSPECTION_ITEM_DICT (126)12.10护理教学查房WARD_INSPECTION (127)12.11护理教学查房评价WARD_INSPECTION_APPRAISEMENT (127)12.12科室专题讲座NURSING_SPECIAL_COURSE (127)12.13科室业务考核记录NURSING_TEST (127)12.14护理质量指标字典NURSING_INDEX (128)12.15护理质量指标标准项目字典NURSING_INDEX_ITEMS (128)12.16护理质量指标体系字典NURSING_INDEX_SYSTEM (128)12.17护理质量体系指标护理质量指标对照字典INDEX_SYSTEM_VS_INDEX (128)12.18护理质量指标检查情况主记录NURSING_INDEX_CHECK_MASTER (129)12.19护理质量指标检查情况明细记录NURSING_INDEX_CHECK_DETAIL (129)12.20灭菌物品检查情况ANTISEPTIC_ITEM_CHECK_DETAIL (129)12.21住院病人评估单PAT_EVALUATION (130)12.22住院评估单评价PAT_EVALUATION_APPRAISEMENT (131)12.23PIO护理记录单主记录NURSING_PIO_MASTER (131)12.24PIO护理记录单明细记录NURSING_PIO_DETAIL (132)12.25护理诊断字典NURSING_PROBLEM_DICT (132)12.26护理因素字典NURSING_FACTOR_DICT (132)12.27护理措施字典NURSING_INTERVENTION_DICT (133)12.28护理因素组字典NURSING_FACTOR_GROUP_DICT (133)12.29护理因素组与因素对照FACTOR_GROUP_VS_FACTOR (133)12.30护理诊断与因素组对照PROBLEM_VS_FACTOR_GROUP (133)12.31护理因素组与措施对照FACTOR_GROUP_VS_INTERVENTION (133)12.32健康教育项目字典HEALTH_EDU_ITEM_DICT (133)12.33健康教育登记主记录HEALTH_EDU_MASTER (134)12.34健康教育登记明细记录HEALTH_EDU_DETAIL (134)12.35班次字典NURSING_SCHEDULE_DICT (134)12.36过敏源字典ALLERGEN_DICT (135)12.37护理会议记录DEPT_MEETING (135)12.38DEPT_RECORD (135)12.39护理消息接收科室MESSAGE_RECEIVE_DEPT (135)12.40护理护士排班表NURSE_SCHEDULE (135)12.41护士排班表备注信息NURSE_SCHEDULE_REMARK_DETAIL (136)12.42护士类别字典NURSE_TYPE_DICT (136)12.43消息通知NURSING_DEPT_MESSAGE (136)12.44NURSING_EVENTREPORT_DETAIL (136)12.45NURSING_EVENTREPORT_MAIN (136)12.46措施结果字典表NURSING_OUTCOME_DICT (137)12.47PIO护理计划明细NURSING_PIO_DETAIL_PLAN (137)12.48PIO护理计划主记录NURSING_PIO_MASTER_PLAN (138)12.49重症护理记录单NURSING_RECORD (138)12.50普通护理记录单NURSING_RECORD_NORMAL (138)13.APPLINFAC (139)13.1CLINIC_APPOINTS_TEMP (139)1. 1. 手术管理1.1手术安排 OPERATION_SCHEDULE确定。
数据结构(C语言版)课程设计报告表达式求值说明书XX大学数据结构课程设计说明书题目:表达式求值院系:计算机科学与工程学院专业班级:计算机班学号:学生姓名:指导教师:2021年X月X日XX大学课程设计(论文)任务书计算机科学与工程学院学号学生姓名专业(班级)设计题目表达式求值设计技术参数系统平台:Windows7/WindowsXP开发工具:VC++6.0设计要求(1)能够计算的运算符包括:加、减、乘、除、圆括号。
(2)能够计算的数要求在实数范围内。
(3)能执行多重括号嵌套运算。
(4)对于异常表达式给出错误提示。
工作量课程设计报告要求不少于3000字。
源程序要求不少于300行工作计划2021.11.21-12.01根据课程设计大纲的要求,查找相关资料,完成需求分析;2021.12.02-12.16进行系统的概要设计;2021.12.17-12.31进行系统的详细设计和源代码的书写;2021.01.01-01.17对系统进行调试分析,写出课程设计报告。
参考资料[1]何钦铭主编.C语言程序设计.北京:高等教育出版社,2021.[2]谭浩强编著.C程序设计(第四版).北京:清华大学出版社,2021.[3]严蔚敏,吴伟民编著.数据结构(C语言版)北京:清华大学出版社,2021.[4]严蔚敏,吴伟民编著.数据结构题集北京:清华大学出版社,2021.指导教师签字教研室主任签字2021年X月X日学生姓名:学号:专业班级:课程设计题目:表达式求值指导教师评语:成绩:指导教师:年月日XX大学课程设计(论文)成绩评定表目录1需求分析12概要设计12.1设计思路12.2存储结构设计12.3功能模块设计13详细设计14运行与测试15总结1参考文献2(要求:给出一级目录和二级目录,宋体,四号字,1.5倍行距,页码使用罗马数字,居中)(报告正文部分):(要求:正文部分一律用小四号字,宋体,行距20磅。
一级标题靠左,加粗。
二级大标题靠左,不加粗。
数据结构信息管理系统详细设计说明书数据结构信息管理系统详细设计说明书1、引言1.1 编写目的本文档旨在对数据结构信息管理系统进行详细的设计说明,包括系统的功能需求、数据结构设计、模块划分、接口设计等内容,以便开发人员能够根据本文档进行系统的具体实现。
1.2 读者对象本文档的主要读者对象为系统开发人员和项目管理人员,他们需要了解该系统的详细设计方案,以便进行系统的实现和管理。
2、系统概述2.1 项目背景数据结构信息管理系统是一个用于管理和查询各种数据结构的系统。
通过该系统,用户可以方便地创建、修改和查询各种数据结构,并进行相关操作。
2.2 功能需求2.2.1 数据结构管理系统提供对数据结构的管理功能,包括创建数据结构、修改数据结构、删除数据结构和查询数据结构等。
2.2.2 数据操作系统提供对数据的操作功能,包括插入数据、删除数据、更新数据和查询数据等。
2.2.3 数据可视化系统提供对数据结构的可视化功能,用户可以通过图形界面直观地查看数据结构的组织形式和数据变化过程。
3、数据结构设计3.1 数据结构定义系统将支持多种常见数据结构,包括栈、队列、链表、树等。
3.2 数据结构实现3.2.1 栈栈是一种先进后出的数据结构,系统将使用数组作为栈的实现方式。
3.2.2 队列队列是一种先进先出的数据结构,系统将使用链表作为队列的实现方式。
3.2.3 链表链表是一种由节点组成的数据结构,系统将使用指针作为链表的实现方式。
3.2.4 树树是一种由节点组成的层次结构,系统将使用递归方式实现树的操作。
4、模块划分4.1 用户管理模块该模块负责用户的注册、登录和权限管理等功能。
4.2 数据结构管理模块该模块负责数据结构的创建、修改、删除和查询等功能。
4.3 数据操作模块该模块负责对数据进行插入、删除、更新和查询等操作。
4.4 可视化模块该模块负责对数据结构进行可视化展示,用户可以通过图形界面直观地查看数据结构的组织和变化过程。
Package‘rcoder’October6,2023Type PackageTitle Lightweight Data Structure for Recoding Categorical Data withoutFactorsVersion0.3.0Description A data structure and toolkit for documenting and recodingcategorical data that can be shared in other statistical software.License MIT+file LICENSEEncoding UTF-8Depends R(>=3.5)Imports rlang,glue,dplyrSuggests testthat(>=2.1.0),tidyfast,magrittrRoxygenNote7.2.1URL https:///nyuglobalties/rcoderBugReports https:///nyuglobalties/rcoder/issuesNeedsCompilation noAuthor Patrick Anker[aut,cre](<https:///0000-0003-2302-0445>), Global TIES for Children[cph](https:///ihdsc/global-ties)Maintainer Patrick Anker<***************>Repository CRANDate/Publication2023-10-0608:30:05UTCR topics documented:assign_coding (2)as_coding_list (3)code (3)coding (4)coding_to_haven_labels (5)coding_to_odk (5)12assign_coding eval_coding (6)is_empty_coding (7)link_codings (7)make_recode_query (8)matches_coding (9)missing_codes (10)odk_to_coding (10)recode_vec (11)Index13 assign_coding Adds a coding as an attribute to a vectorDescriptionStores a coding at the"rcoder.coding"attribute of a vectorUsageassign_coding(vec,.coding,.bpr=TRUE)Argumentsvec A vector.coding A‘coding‘object.bpr Also overwrite the"bpr.coding"attribute with the character representation of ‘.coding‘.Used for interop with blueprintr variable decorations.ValueThe vector with its"rcoder.coding"attribute set to‘.coding‘See Also[recode_vec()]Examplescdng<-coding(code("Yes",3),code("Maybe",2),code("No",1))vec<-sample(1:3,50,replace=TRUE)assign_coding(vec,cdng)as_coding_list3 as_coding_list Evaluate a collection of codings from a character vectorDescriptionEvaluate a collection of codings from a character vectorUsageas_coding_list(x)Argumentsx A character vectorValueA list of codingsExampleschar_vec<-c("coding(code( Yes ,1),code( No ,0))","")as_coding_list(char_vec)code Encode a label to a value with other metadataDescriptionThe most fundamental components of a‘code‘object are the‘label‘and‘value‘elements.A‘code‘object is essentially a key-value tuple that has some extra metadata.Usagecode(label,value,description=label,links_from=label,missing=FALSE,...)4codingArgumentslabel A short label for a value in a vectorvalue The raw value found in the respective vectordescription A longer-form label for the value,if extra context for that label is neededlinks_from A reference to another‘code‘in another‘coding‘object for recoding purposes.missing Whether this‘code‘represents a missing response...Any extra metadataValueA‘code‘object that contains the key-value map of label to valueExamplescode("Yes",1)code("No",0)code("No response",-88,description="Participant ignored question when prompted",missing=TRUE)code("Missing",NA,links_from=c("Refused","Absent"))coding Catalog the categorical data representation in a vectorDescriptionA‘coding‘object holds a list of‘code‘s that map vector values to human readable labels.An abstraction of factors,this data structure is designed to be portable and not directly attached to the underlying data.Moreover,‘coding‘objects can be"linked"for recoding and data lineage purposes.An"empty coding"is used to represent data that has no categorical interpretation.Usagecoding(...,.label=NULL)empty_coding()Arguments...A collection of‘code‘objects.label A label for this coding,available for interoperabilityValueA‘coding‘object that contains each‘code‘inputcoding_to_haven_labels5Examplescoding(code("Yes",1),code("No",0),code("Not applicable",NA))empty_coding()coding_to_haven_labelsConvert coding to‘haven‘-compatible labelsDescriptionConverts a‘coding‘object into a named vector to be used in the‘labels‘parameter for‘haven::labelled()‘. Usagecoding_to_haven_labels(coding)Argumentscoding A coding objectValueA named vector representation of the codingExamplescdng<-coding(code("Yes",1),code("No",0))coding_to_haven_labels(cdng)coding_to_odk Convert a coding object to ODK XLSForm choicesDescriptionODK XLSForms link the categorical codings to a variable type name in the’survey’sheet.The codings are specified in the’choices’sheet which has a‘list_name‘column that holds the variable type names.Each row that has that name will be associated with that categorical type coding.This function converts‘coding‘objects into tables that can be inserted into that’choices’sheet.The categorical type is specified with the coding‘.label‘.Usagecoding_to_odk(coding)Argumentscoding A coding object6eval_coding ValueA data.frame or tibble that can be included in an XLSForm’choices’sheetSee Also[odk_to_coding()]Examplescdng<-coding(code("Yes",1),code("No",0),.label="yesno")coding_to_odk(cdng)eval_coding Evaluates a coding expression in a safe environmentDescriptionTo prevent requiring attaching the‘rcoder‘package,this function takes in an unevaluated expression –assumed to be a‘coding()‘call–and evaluates the expression with_only_‘coding‘and‘code‘provided to guard against rogue code.Usageeval_coding(expr)Argumentsexpr An expressionValueAn evaluated‘coding‘objectExampleseval_coding( coding(code("Yes",1),code("No",0)) )is_empty_coding7 is_empty_coding Is an object the empty coding?DescriptionIs an object the empty coding?Usageis_empty_coding(x)Argumentsx An objectValueTRUE/FALSE if the object is identical to‘empty_coding()‘Examplesis_empty_coding(empty_coding())is_empty_coding(coding())is_empty_coding(coding(code("Yes",1),code("No",0)))link_codings Link a coding from others for recodingDescriptionCoding objects can be linked together to create mappings from one or more codings to another.This creates a‘data.frame‘that outlines how the codings are linked,to be used in‘make_recode_query()‘.Usagelink_codings(to,...,.to_suffix="to",.drop_unused=FALSE)Argumentsto A coding to be linked to...Codings to be linked from.to_suffix A suffix signifying which columns in the output‘data.frame‘came from‘to‘.drop_unused Logicalflag to drop any codes in‘...‘that have no counterparts in‘to‘8make_recode_queryValueA‘linked_coding_df‘with all necessary information for a recoding queryExampleswave1<-coding(code("Yes",1),code("No",2),code("Refused",-88,missing=TRUE))wave2<-coding(code("Yes","y"),code("No","n"),code("Missing",".",missing=TRUE))link_codings(to=coding(code("Yes",1),code("No",0),code("Missing",NA,links_from=c("Refused","Missing"))),wave1,wave2)make_recode_query Make a recoding call from linked codingsDescriptionThis creates a function that accepts a vector and recodes it from the information provided in a ‘linked_coding_df‘.Usually this is intended for package authors who want to operate at the re-coding relational table level(e.g.mapping multiple codings to one).Most end users should use [recode_vec()]instead.Usagemake_recode_query(linked_codings,from=1,to_suffix="to",...)Argumentslinked_codings A‘linked_coding_df‘from A character or integer that selects the correct original coding.Defaults to1,the first linked coding.to_suffix The suffix used to signify which columns refer to values to which the vector will be recoded...Any other parameters passed onto the recoding function selectormatches_coding9ValueA function with single argument when applied to an input vector will recode the vector appropriatelyExamplescdng_old<-coding(code("Yes",1),code("No",2))cdng_new<-coding(code("Yes",1),code("No",0))recode_func<-make_recode_query(link_codings(cdng_new,cdng_old))vec<-sample(1:2,20,replace=TRUE)recode_func(vec)matches_coding Checks if vector’s content adheres to a codingDescriptionPerforms to check to see if the set of vector values are equal to or a subset of a coding’s values. Usagematches_coding(vec,coding,ignore_empty=TRUE)verify_matches_coding(vec,coding,ignore_empty=TRUE)Argumentsvec A vectorcoding A‘coding‘objectignore_empty Logicalflag to skip check if coding is emptyValueTRUE/FALSEFunctions•verify_matches_coding():Rather than returning TRUE/FALSE,this function halts execu-tion if‘matches_coding()‘returns FALSE.Examplesvec1<-sample(1:2,10,replace=TRUE)vec2<-sample(0:1,10,replace=TRUE)cdng<-coding(code("Yes",1),code("No",0))matches_coding(vec1,cdng)matches_coding(vec2,cdng)10odk_to_coding missing_codes Get missing codes from a codingDescriptionTakes a coding a returns a new coding with all codes that represent a missing value.Usagemissing_codes(coding)Argumentscoding a codingValueA coding that contains all missing codes.If no codes are found,returns‘empty_coding()‘Examplesmissing_codes(coding(code("Yes",1),code("No",0),code("Missing",NA)))missing_codes(coding(code("Yes",1),code("No",0)))odk_to_coding Convert ODK choices to a codingDescriptionODK XLSForms link the categorical codings to a variable type name in the’survey’sheet.The codings are specified in the’choices’sheet which has a‘list_name‘column that holds the variable type names.Each row that has that name will be associated with that categorical type coding.This function converts subsets of the choices sheet into individual’coding’objects.Usageodk_to_coding(choice_table)Argumentschoice_table A data.frame slice of the"choices"table from an XLSFormValueA‘coding‘object that corresponds to the choices’sliceSee Also[coding_to_odk()]Exampleschoice_excerpt<-data.frame(list_name=rep("yesno",2),name=c("Yes","No"),label=c(1,0))odk_to_coding(choice_excerpt)recode_vec Recode a vectorDescriptionA simple interface to recoding a vector based on the coding linking mechanism.If the vector hasthe"rcoder.coding"attribute,then the coding object stored in that attribute will be used by default. Usagerecode_vec(vec,to,from=NULL,.embed=TRUE,.bpr=TRUE)Argumentsvec A vectorto A coding object to which the vector will be recodedfrom A coding object that describes the current coding of the vector.Defaults to the "rcoder.coding"attribute value,if it exists,_or_the"bpr.coding"value(fromblueprintr).If neither are found,‘from‘stays‘NULL‘and the function errors..embed If‘TRUE‘,‘from‘will be stored in the"rcoder.coding"attribute.bpr If‘TRUE‘,adds the_character_representation of the coding to the"bpr.coding"ed for interop with blueprintr variable decorationsValueThe recoded vectorSee Also[assign_coding()]Examples#Using an explicit fromvec<-sample(1:3,50,replace=TRUE)cdng_old<-coding(code("Yes",3),code("Maybe",2),code("No",1)) cdng_new<-coding(code("Yes",2),code("Maybe",1),code("No",0)) recode_vec(vec,to=cdng_new,from=cdng_old)#Using an implicit from with assign_coding()vec<-sample(1:3,50,replace=TRUE)vec<-assign_coding(vec,cdng_old)recode_vec(vec,cdng_new)Indexas_coding_list,3assign_coding,2code,3coding,4coding_to_haven_labels,5coding_to_odk,5empty_coding(coding),4eval_coding,6is_empty_coding,7link_codings,7make_recode_query,8matches_coding,9missing_codes,10odk_to_coding,10recode_vec,11verify_matches_coding(matches_coding),913。
《数据结构》课程设计说明书二叉平衡树算法实现班级组别:二指导老师:完成时间:2019.6.19 组长:学号:05 组员1:学号:33 组员2:学号:组员3:学号:成绩:目录目录一、课题设计任务 (2)二、任务分析 (2)1. 数据逻辑结构(算法描述) (2)2. 关键算法思想 (3)三、概要设计(总体设计) (3)四、详细设计 (4)1. 数据存储结构 (4)2. 各模块流程图及算法 (5)3. 算法效率分析 (9)五、测试 (10)1. 删除 (10)2. 查找 (10)3. 遍历 (10)六、课程设计心得 (10)七、参考文献 (11)八、附录 (11)一、课题设计任务针对给定的序列建立存储结构,实现各种遍历;实现树的生成,实现数据的查找、插入、删除,输出各种遍历。
二、任务分析1.数据逻辑结构(算法描述)//中序--递归void InorderTra(PNode root) {if (root) {InorderTra(root->leftChild); //中序遍历左子树printf("%d\t", root->keyValue); //访问根节点InorderTra(root->rightChild); //中序遍历右子数}}//前序--递归void PreOrderTra(PNode root) {if (root != NULL) {printf("%d\t", root->keyValue); //访问根节点PreOrderTra(root->leftChild); //前序遍历左子树PreOrderTra(root->rightChild); //前序遍历右子数}}//后序--递归void PostOrderTra(PNode root) {if (root) {PostOrderTra(root->leftChild); //后序遍历左子树PostOrderTra(root->rightChild); //后序遍历右子树printf("%d\t", root->keyValue); //访问根节点}}//求树的最大深度int getDeep(PNode root) {if (!root) {return 0;}int leftDeep = getDeep(root->leftChild) + 1;int rightDeep = getDeep(root->rightChild) + 1;return leftDeep > rightDeep ? leftDeep : rightDeep;}//从根节点开始打印出所有层void printByLevel(PNode root, int deep) {for (int i = 0; i < deep; i++) {LevelOrderTra(root, i);}printf("\n");}2.关键算法思想树的生成过程保持左右平衡,插入删除过程中保证树的平衡。