2019年美赛D题特等奖论文
- 格式:pdf
- 大小:4.32 MB
- 文档页数:26
注:LEO 低地球轨道MEO中地球轨道GeO 同步卫星轨道risk-profit 风险利润率fixed-profit rate 固定利润率提出一个合理的商业计划,可以使我们抓住商业机会,我们建立四个模型来分析三个替代方案(水射流,激光,卫星)和组合,然后确定是否存在一个经济上有吸引力的机会,从而设计了四种模型分析空间碎片的风险、成本、利润和预测。
首先,我们建立了利润模型基于净现值(NPV)模型,并确定三个最佳组合的替代品与定性分析:1)考虑了三个备选方案的组合时,碎片的量是巨大的;2)考虑了水射流和激光的结合,认为碎片的大小不太大;3)把卫星和激光的结合当尺寸的这些碎片足够大。
其次,建立风险定性分析模型,对影响因素进行分析在每一种替代的风险,并得出一个结论,风险将逐渐下降直到达到一个稳定的数字。
在定量分析技术投入和对设备的影响投资中,我们建立了双重技术的学习曲线模型,找到成本的变化规律与时间的变化。
然后,我们开发的差分方程预测模型预测的量在未来的四年内每年发射的飞机。
结合结果我们从预测中,我们可以确定最佳的去除选择。
最后,分析了模型的灵敏度,讨论了模型的优势和我们的模型的弱点,目前的非技术性的信,指出了未来工作。
目录1,简介1.1问题的背景1.2可行方案1.3一般的假设1.4我们的思想的轮廓2,我们的模型2.1 时间---利润模型2.1.1 模型的符号2.1.2 模型建立2.1.3 结果与分析2.2 . 差分方程的预测模型2.2.1 模型建立2.2.2 结果分析2.3 双因子技术-学习曲线模型2.3.1 模型背景知识2.3.2 模型的符号2.3.3 模型建立2.3.4 结果分析2.4风险定性分析模型2.4.1 模型背景2.4.2 模型建立2.4.3 结果与分析3.在我们模型的灵敏度分析3.1 差分方程的预测模型。
3.1.1 稳定性分析3.1.2 敏感性分析3.2 双因子技术学习曲线模型3.2.1 稳定性分析3.2.2 敏感性分析4 优点和缺点查分方程预测模型优点缺点双因子技术学习曲线模型优点缺点时间---利润模型优点缺点5..结论6..未来的工作7.参考双赢模式:拯救地球,抓住机遇1..简介问题的背景空间曾经很干净整洁。

建模美赛获奖范文全文共四篇示例,供读者参考第一篇示例:近日,我校数学建模团队在全国大学生数学建模竞赛中荣获一等奖的喜讯传来,这是我校首次在该比赛中获得如此优异的成绩。
本文将从建模过程、团队合作、参赛经验等方面进行详细介绍,希望能为更多热爱数学建模的同学提供一些借鉴和参考。
让我们来了解一下比赛的背景和要求。
全国大学生数学建模竞赛是由中国工程院主办,旨在促进大学生对数学建模的兴趣和掌握数学建模的基本方法和技巧。
比赛通常会设置一些实际问题,参赛队伍需要在规定时间内通过建立数学模型、分析问题、提出解决方案等步骤来完成任务。
最终评选出的优胜队伍将获得一等奖、二等奖等不同级别的奖项。
在本次比赛中,我们团队选择了一道关于城市交通拥堵研究的题目,并从交通流理论、路网优化等角度进行建模和分析。
通过对城市交通流量、拥堵原因、路段限制等方面的研究,我们提出了一种基于智能交通系统的解决方案,有效缓解了城市交通拥堵问题。
在展示环节,我们通过图表、数据分析等方式清晰地呈现了我们的建模过程和成果,最终赢得了评委的认可。
在整个建模过程中,团队合作起着至关重要的作用。
每个成员都发挥了自己的专长和优势,在分析问题、建模求解、撰写报告等方面各司其职。
团队内部的沟通和协作非常顺畅,大家都能积极提出自己的想法和看法,达成共识后再进行实际操作。
通过团队合作,我们不仅完成了比赛的任务,也培养了团队精神和合作能力,这对我们日后的学习和工作都具有重要意义。
参加数学建模竞赛是一次非常宝贵的经历,不仅能提升自己的数学建模能力,也能锻炼自己的解决问题的能力和团队协作能力。
在比赛的过程中,我们学会了如何快速建立数学模型、如何分析和解决实际问题、如何展示自己的成果等,这些能力对我们未来的学习和工作都将大有裨益。
在未来,我们将继续努力,在数学建模领域不断学习和提升自己的能力,为更多的实际问题提供有效的数学解决方案。
我们也希望通过自己的经验和教训,为更多热爱数学建模的同学提供一些指导和帮助,共同进步,共同成长。
2019MCM/ICMSummary Sheet (Your team's summary should be included as the first page of your electronic submission.)Type a summary of your results on this page. Do not includethe name of your school, advisor , or team members on this page.Ecosystems provide many natural processes to maintain a healthy and sustainable environment after human life. However, over the past decades, rapid industrial development and other anthropogenic activities have been limiting or removing ecosystem services. It is necessary to access the impact of human activities on biodiversity and environmental degradation.The main purpose of this work is to understand the true economic costs of land use projects when ecosystem services are considered. To this end, we propose an ecological service assessment model to perform a cost benefit analysis of land use development projects of varying sites, from small-scale community projects to large national projects. We mainly focus on the treatment cost of environmental pollution in land use from three aspects: air pollution, solid waste and water pollution. We collect pollution data nationwide from 2010 to 2015 to estimate economic costs. We visually analyze the change in economic costs over time via some charts. We also analyze how the economic cost changes with time by using linear regression method. We divide the data into small community projects data (living pollution data) and large natural data (industrial pollution data). Our results indicate that the economic costs of restoring economical services for different scales of land use are different. For small-scale land, according to our analysis, the treatment cost of living pollution is about 30 million every year in China. With the rapid development of technology, the cost is lower than past years. For large-scale land, according to our analysis, the treatment cost of industrial pollution is about 8 million, which is lower than cost of living pollution. Meanwhile the cost is trending down due to technology development. The theory developed here provides a sound foundation for effective decision making policies on land use projects.Key words: economic cost , ecosystem service, ecological service assesment model, pollution.Team Control Number For office use onlyFor office use only T1 ________________F1 ________________ T2 ________________F2 ________________ T3 ________________Problem Chosen F3 ________________ T4 ________________F4 ________________EContent1. Introduction (3)2. Variable Description (3)2.1 Definitions (3)3. Model Definitions and Results (4)3.1 2010-2015 Air Pollution Virtual Governance Cost (4)3.2 2010-2015 Solid Waste Virtual Governance Cost (8)3.3 2010-2015 Water Pollution Virtual Governance Cost (11)3.4 Total Governance Data Analysis (14)3.5 Model Analysis Over Time (15)4. Conclusions (16)4.1 Strengths (17)4.2 Weakness (17)4.3 Model Improvement (17)5. References (18)1.IntroductionToday, with the rapid development of social industrialization and modernization, one thing we must admit is that in the process of industrialization in different regions, countries and even the whole world, we are trying to maximize the economic benefits of limited development space, but at the same time, the impact of decision-making on the biosphere is also ignored.It is well known that the biosphere provides many natural processes to maintain healthy and sustainable human living environments, which are called ecosystem services. It not only provides food, medicine and raw materials for industrial and agricultural production, but also maintains the life support system that human beings rely on for survival and development. At present, the internationally recognized ecosystem service function classification system is a classification method proposed by MA working group. MA's ecosystem service classification system divides the main service function types into four function groups: product, rule, culture and support. Thus, the ecosystem service function is the foundation of human civilization and sustainable development.But as we use and update our environment, we may limit or eliminate ecosystem services. Although these activities seem insignificant, they do affect the ecosystem to some extent.Therefore, we introduce the virtual cost management method, which aims to evaluate the cost of environmental degradation by calculating the cost of pollution control. This allows for a comprehensive assessment of projects under construction, thus ensuring the resilience and sustainability of ecosystem services while utilizing land resources.To ensure the integrity and the sustainable development of ecological system is the premise and foundation of development, If we simply pursue the speed of development and neglect the pressure that construction activities bring to the ecosystem, will inevitably produce the bad consequences, we must protect our earth, because it is not only our planet, but also the planet of our descendants.2.Variable Description2.1 DefinitionsTo measure the cost of environmental degradation, we introduced the following variables:Virtual governance costs: The environmental degradation value calculated by the pollution loss method is called the environmental degradation cost, which refers to the various damages caused by the pollutants discharged in the production and consumption process to the environmental function, human health and crop yield under the current governance level.Environmental loss method: In the SEEA framework, pollution loss method refers to the environmental value assessment method based on damage. This method uses certain technical means and pollution loss investigation to calculate all kinds of damages caused by environmental pollution.Biodiversity: Refers to the variety of life in an ecosystem; all of the living organisms within a given area.Biosphere: The part of the Earth that is occupied by living organisms and generally includes the interaction between these organisms and their physical environment.Ecosystem: A subset of the biosphere that primarily focuses on the interaction between living things and their physical environment.Ecosystem Services: The many benefits and assets that humans receive freely from our natural environment and a fully functioning ecosystem.Environmental Degradation: The deterioration or compromise of the natural environment through consumption of assets either by natural processes or human activities.Mitigate: To make less severe, painful, or impactful.Valuation: Refers to the estimating or determining the current worth of something.3.Model Definitions and Results3.1 2010-2015 Air Pollution Virtual Governance CostThe natural gas use proportion c1,c2 and c3 are collectively recorded as c, the gas use amount d1,d2 and d3are collectively recorded as d, and the natural gas operation cost f1,f2 and f3 are collectively recorded as f.In the modeling process, it is assumed that the garbage disposal cost, gas operation cost and central heating operation cost will not change in the next few years.Urbanization is often accompanied by land development and utilization. Urban construction is inseparable from industrial construction and improvement of human living environment. In this process, the continuous development and utilization of land, or the construction of large factories, or the increase of communities and parks, has a certain impact on the local ecology. Factory waste emissions and gas consumption to a certain extent polluted the air, causing irreversible damage to the ecological environment.The impact of land development and utilization on the atmosphere is manifold. In large national projects such as industrial projects, we focus on the costs of sulphur dioxide emissions and dust emissions. In small-scale community projects such as community life, we mainly study the governance cost from the perspective of gas use, and establish an ecological service evaluation model related to air pollution.When considering the function of ecological services, we first study the economic cost of land development and utilization from the perspective of large-scale land development and utilization. Large-scale land development generally includes the establishment and relocation of large companies, the laying of pipelines nationwide, and the establishment of large state-owned enterprises. The construction of large chemical plants in land development produces polluting gases during the development process or after the plant is put into use. Among them, sulfur dioxide and dust emissions accounted for a large proportion. Let's use these two types of pollution as an example to calculate the economic cost.Collecting China's SO2 and dust emissions from 2010 to 2015:The unit cost of SO2 and dustIt should be noted that in the process of treatment, the exhaust gas can not be completely treated. The virtual removal rate of SO2 was a2=90%, and the virtual removal rate of dust was b2=97%. The cost of waste gas treatment should be calculated by virtual management method. It is that the total amount of emissions× virtual removal rate× unit governance cost.SO2 governance cost=a×a2×a1Dust governance cost=b×b2×b1The calculations above can be used to estimate the cost of governance. Governance cost=SO2 governance cost+ dust governance cost.Secondly, when considering the function of ecological services, the cost of land development and utilization is studied from the perspective of small-scale land development and utilization. The development and utilization of small-scale land generally includes the construction of roads, sewers, houses and Bridges. Let's take the development of land for residential areas as an example. When people live in communities, using natural gas for heating and living also pollutes the air. We mainly consider the impact of artificial gas, natural gas and liquefied petroleum gas.Collecting data on gas use in urban areas of China from 2010 to 2015:Gas operating costs, urban population, urban gasification rate:The cost of domestic gas treatment is related to urban population, urban gas rate, gas consumption, various proportions of gas consumption, heating area and operating cost. We use hypothetical assumptions to define the cost of gas pollution control.Gas pollution control cost=∑(p −(1−q)×c ×d ×f )3n=1+(s 1-s 2)×eWhere n=1 is artificial gas, n=2 is natural gas, and n=3 is liquefied petroleum gas. The following estimates of governance costs can be obtained by calculation:3.2 2010-2015 Solid Waste Virtual Governance CostIn the calculation process, we assume that the unit governance cost is the same, including the cost of general solid waste management, the cost of hazardous waste management, the cost of household garbage removal, the cost of sanitary landfill, and the cost of harmless incineration.In the process of land development and utilization, both large-scale land use and small-scale land use will inevitably produce solid waste.In the process of construction and normal use, large factories mainly produce general solid waste and hazardous waste. There are two ways to treat solid waste: storage and disposal. When calculating the cost of industrial solid waste treatment, we can start with the cost of waste storage and management and the cost of waste disposal.Collecting data on China's industrial solid waste treatment from 2010 to 2015:HS means hazardous waste storage HD means hazardous waste disposal The unit cost of industrial solid waste:According to the above data, the virtual governance method is used to calculatethe cost of large-scale land development and utilization when the ecological service function is considered.Virtual governance cost of industrial solid waste=virtual waste management cost of storage waste+ virtual governance cost of disposal wasteVirtual governance cost of storage waste=e1+e2Virtual governance cost of disposal waste=f1+f2e1=a× (b1-a1)e2=c× (d1-c1)f1=b×b1f2=d×d1The virtual governance cost of industrial solid waste can be obtained by calculation:When small-scale land is used for community construction, a certain amount of household garbage will be produced. There are many ways to deal with household garbage. When calculating the treatment cost, we mainly follow three treatment methods: cleaning, sanitary landfill and innocuous incineration.Collecting the amount of domestic garbage generated by Chinese Residents from 2010 to 2015:Domestic garbage unit treatment cost:Virtual governance cost of domestic garbage=x1+y1+z1x1=m×(z-x)y1=n×(y+ z)z1=r× zThe processing cost of domestic garbage can be obtained by calculation:3.3 2010-2015 Water Pollution Virtual Governance CostThe next section considers the cost of water pollution control for land use projects. Based on the above two treatment costs, we still choose the virtual treatment cost method to calculate the annual water pollution treatment cost from 2010 to 2015. By looking up relevant materials, we know that water pollution involves a wide range of fields, including planting, livestock and poultry breeding, industry, urban life and rurallife. However, due to the lack of systematic treatment of sewage in agricultural production, we only consider the cost of virtual pollutants in industry and urban life. Here, we consider the water pollution of small community projects as urban life water pollution, while large national projects are considered as industrial sector water pollution.Pollutants in industrial wastewater include COD, ammonia nitrogen, petroleum and heavy metals. Here we consider the virtual governance cost of four pollutants, then the calculation formula of the virtual governance cost of industrial enterprises is:The virtual governance cost of the industrial sector=∑(pollutant emissions× virtual governance costs per unit of pollutants× virtual removal rate of pollutants), the total virtual governance cost is the sum of the virtual governance costs of various pollutants.Virtual domestic wastewater treatment costs include virtual management cost of COD and ammonia nitrogen virtual governance cost, namely virtual wastewater treatment cost = ∑ (pollutant discharge unit pollutant of virtual management cost virtual pollutants removal rate), namely industrial COD discharge quantity A1, industrial ammonia nitrogen emissions B1, C1 oil discharge, heavy metal emissions D1, cities COD discharge E1 and ammonia nitrogen emissions for F1.The cost of treatment of each pollutant is:It should be noted that the virtual removal rate of pollutants is not 100%, the removal rate of COD is 80%, the removal rate of ammonia nitrogen is 50%, the removal rate of petroleum is 80%, and the removal rate of heavy metals is 50%. The annual emissions of various pollutants are:Table 20 the annual emissions of industrial pollutantIndustrial COD annual emissions/10,000 tons Industrialammonia nitrogen annual emissions /10,000 tonsAnnual oil emissions/ 10,000 tons Annual heavy metal emissions / ton2015 293.50 21.70 1.50 313.70 2014 311.30 23.20 1.60 333.70 2013 319.50 24.60 1.70 366.30 Table 19 The cost of treatment of each pollutantUnit COD governance cost 800/ton Unit ammonia nitrogen treatment cost 100/tonUnit oil treatment cost 500/ton Unit heavy metal treatment cost 1000/ton Unit cost statistics (assuming the cost is the same)Then calculated by the above data:Industrial COD Treatment Cost=A1*80%*800Industrial Ammonia Nitrogen Treatment Cost=B1*50%*100Petroleum treatment cost=C1*80%*500Heavy metal treatment cost=D1*90%*1000Urban COD Treatment Cost=E1*80%*800Urban Ammonia Nitrogen Treatment Cost=F1*50%*100 Virtual cost of industrial water pollution=industrial COD treatment cost+ industrial ammonia nitrogen treatment cost+ petroleum treatment cost+ heavy metal treatment cost, namely:Virtual cost of industrial water pollution=industrial COD treatment cost+ industrial ammonia nitrogen treatment cost+ petroleum treatment cost+ heavy metal treatment cost, namely:Table 23 virtual cost of urban water pollution3.4 Total Governance Data AnalysisBased on the above three data, we put the three aspects of governance cost together to form the time governance cost chart, as shown in the figure below:Chart 1 Industrial integrated virtual governance costThe cost of industrial governance in 2011 was relatively larger than that in 2010. However, after 2011, the cost of industrial governance began to decline. Compared with the cost of industrial pollution governance, the cost of living management was much higher. The trend is to increase, then decrease, then increase and then decrease. Overall, the cost of living treatment fluctuates between about 245 billion yuan. According to the overall data trend, we find that both the cost of industrial governance and the cost of living governance are decreasing year by year. The main reason for the decrease is that the negative impacts of land use decrease year by year, which also reflects the global increasing attention to the impact of human activities on ecosystem services.3.5 Model Analysis Over TimeFrom the above data, we use the linear regression method to calculate the trend of the model with time. For the industrial governance cost, we set the year=x, the governance cost(10000yuan)=y, and then use the regression line equation to calculate The coefficients a~, b~:Calculate a~=8000000 b~=-214213The relationship between x and y can be obtained as follows: y=-214213x+8000000, that is, the governance cost decreases with time, so the following trend graph can be obtained:Chart 3 industrial governance costy = -214213x + 80000006,600,000.006,800,000.007,000,000.007,200,000.007,400,000.007,600,000.007,800,000.008,000,000.008,200,000.008,400,000.0020112012201320142015Industrial governance cost chartFor the cost of urban life governance, it can be seen from the above data that the governance cost changes periodically with time. It is preferable to consider the trend of moving average to predict the future cost of governance. Let be the forecast of governance cost for the next year. The number of periods in which n is moving average;is the pre-treatment cost, and represent the actual values of the first three periods of the previous two periods until the first n periods, then:In summary, the trend graph of life governance costs over time can be obtained:Chart 4 Life governance costAs can be seen from the above figure, the cost of urban living governance changes periodically with time, but it is still decreasing.4.ConclusionsBased on our analysis, we draw the following conclusions:In the process of social construction, we must recognize the construction of economic society, the development of land use cannot be separated from the existence of ecosystem services and environmental sustainable development, but should be developed in parallel. Thus in the process of land development and utilization, we should pay attention to protecting the ecological environment and correctly assess the economic cost of land development projects.In the analysis process, we found that the environmental degradation cost of large-scale industrial project construction is declining year by year, and the environmental degradation cost of small-scale project construction is not particularly large each year, we can reasonably extrapolate the results, the decline in environmental degradation costs for large industrial projects may be due to the increased efficiency of industrial waste treatment, as well as the application of clean energy, and more non-high environmentally hazardous industrial projects to replace high environmentally hazardous industrial projects. The changing trend ofenvironmental degradation costs for small-scale project construction also reminds us of the need to find new and more economical ways to deal with domestic pollution.Based on the virtual governance cost analysis, we put forward the policy of open land use in the future: Improving the ecological environment, Promoting sustainable development, Ensuring the normal operation of ecological environment services. In the future land development and construction projects, we should pay more attention to the assessment of ecological services, so that the development and utilization rate of land tends to be highly rationalized.4.1 Strengths●The model simulates the annual virtual governance cost and makes the resultaccurate and reliable.●In selecting the samples, we selected China's annual data on pollution control.China is a representative country. Therefore, the sample is representative and persuasive.●In the measurement model, linear regression and moving average are used tosimplify the model and ensure the rationality of data. As a result, the entire model is relatively easy to implement.●The model is used to simulate the data obtained, and the change trend isrepresented by graph at last, so that the result is more clear.4.2 Weakness●The linear equation is used to simplify the model and make the result moreintuitive, but due to the unpredictability and diversity of some factors, the regression analysis is limited in some cases.●Due to the limited space, we only considered the three main factors for calculatingthe low cost of environmental degradation,which means that there are still some factors that will affect the correctness of the model we built.●We only analyzed the data for six years, which means our results may still beinaccurate.●In addition, our model simulates the situation that unit governance cost remainsunchanged, without taking into account the fact that scientific progress reduces unit governance cost. In fact, this is unscientific.4.3 Model ImprovementIn the construction of the model, we assume that the unit governance cost remains unchanged, but with the progress of science and technology, the pollution governance technology will certainly increase and the governance cost will also decrease, so if this important factor is not evaluated, it is not scientific to make themodel in real life. In addition, our consideration of the model still requires a lot of data to simulate, and we do not use enough data in the validation process. We also need to further add factors that may affect model evaluation to the models we build to make them more practical.5. References[1]Ministry of Environmental Protection of the People's Republic of China. China Environmental Statistics Annual Report [R] China Environmental Press, 2011[2]Ministry of Environmental Protection of the People's Republic of China. China Environmental Statistics Annual Report[R] China Environmental Press, 2012[3]Ministry of Environmental Protection of the People's Republic of China. China Environmental Statistics Annual Report[R] China Environmental Press, 2013[4]Ministry of Environmental Protection of the People's Republic of China. China Environmental Statistics Annual Report[R] China Environmental Press, 2014[5]Ministry of Environmental Protection of the People's Republic of China. China Environmental Statistics Annual Report[R] China Environmental Press, 2015[6]Ministry of Environmental Protection of the People's Republic of China. China Environmental Statistics Annual Report[R] China Environmental Press, 2016[7]Fang Yu,《China Environmental Economic Accounting Technical Guide》,[M],2009[8]Wupeng Du, Qingxian Gao, Enchen zhang, Qilong Miao, Jianguo Wu, The Emission Status and Composition Analysis of Municipal Solid Waste in China,[J],Research of Environmental Sciences,2006,(19)[9]Feng Cai, Gangcai Chen, Feng Peng, Qingling Yang, Shibo Zhao, Sishu Xian, Fei Wu, Quantitative assessment of eco-environmental damage based on virtual diaposal cost approach,[J],Chinese Journal of Environmental Engineering,2015,(9)[10]National Bureau of Statistics: /[11]Ministry of Housing and Urban-Rural Development of the People’s Republic of China (MOHURD):/xytj/tjzljsxytjgb/jstjnj/index.html。
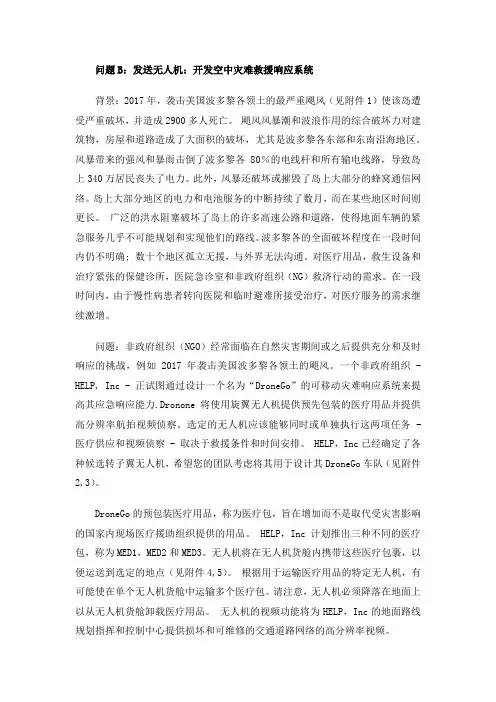
问题B:发送无人机:开发空中灾难救援响应系统背景:2017年,袭击美国波多黎各领土的最严重飓风(见附件1)使该岛遭受严重破坏,并造成2900多人死亡。
飓风风暴潮和波浪作用的综合破坏力对建筑物,房屋和道路造成了大面积的破坏,尤其是波多黎各东部和东南沿海地区。
风暴带来的强风和暴雨击倒了波多黎各80%的电线杆和所有输电线路,导致岛上340万居民丧失了电力。
此外,风暴还破坏或摧毁了岛上大部分的蜂窝通信网络。
岛上大部分地区的电力和电池服务的中断持续了数月,而在某些地区时间则更长。
广泛的洪水阻塞破坏了岛上的许多高速公路和道路,使得地面车辆的紧急服务几乎不可能规划和实现他们的路线。
波多黎各的全面破坏程度在一段时间内仍不明确; 数十个地区孤立无援,与外界无法沟通。
对医疗用品,救生设备和治疗紧张的保健诊所,医院急诊室和非政府组织(NG)救济行动的需求。
在一段时间内,由于慢性病患者转向医院和临时避难所接受治疗,对医疗服务的需求继续激增。
问题:非政府组织(NGO)经常面临在自然灾害期间或之后提供充分和及时响应的挑战,例如2017年袭击美国波多黎各领土的飓风。
一个非政府组织 - HELP, Inc - 正试图通过设计一个名为“DroneGo”的可移动灾难响应系统来提高其应急响应能力.Dronone将使用旋翼无人机提供预先包装的医疗用品并提供高分辨率航拍视频侦察。
选定的无人机应该能够同时或单独执行这两项任务 - 医疗供应和视频侦察 - 取决于救援条件和时间安排。
HELP,Inc已经确定了各种候选转子翼无人机,希望您的团队考虑将其用于设计其DroneGo车队(见附件2,3)。
DroneGo的预包装医疗用品,称为医疗包,旨在增加而不是取代受灾害影响的国家内现场医疗援助组织提供的用品。
HELP,Inc计划推出三种不同的医疗包,称为MED1,MED2和MED3。
无人机将在无人机货舱内携带这些医疗包裹,以便运送到选定的地点(见附件4,5)。
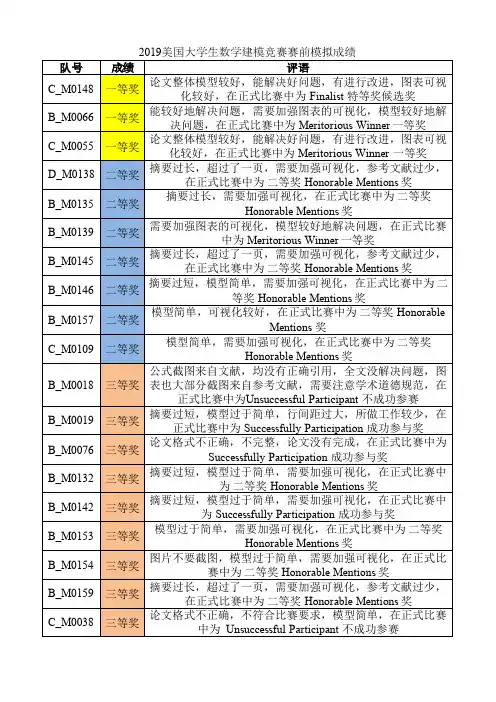
队号成绩评语C_M0148一等奖论文整体模型较好,能解决好问题,有进行改进,图表可视化较好,在正式比赛中为 Finalist 特等奖候选奖B_M0066一等奖能较好地解决问题,需要加强图表的可视化,模型较好地解决问题,在正式比赛中为 Meritorious Winner 一等奖C_M0055一等奖论文整体模型较好,能解决好问题,有进行改进,图表可视化较好,在正式比赛中为 Meritorious Winner 一等奖D_M0138二等奖摘要过长,超过了一页,需要加强可视化,参考文献过少,在正式比赛中为二等奖 Honorable Mentions 奖B_M0135二等奖摘要过长,需要加强可视化,在正式比赛中为二等奖Honorable Mentions 奖B_M0139二等奖需要加强图表的可视化,模型较好地解决问题,在正式比赛中为 Meritorious Winner 一等奖B_M0145二等奖摘要过长,超过了一页,需要加强可视化,参考文献过少,在正式比赛中为二等奖 Honorable Mentions 奖B_M0146二等奖摘要过短,模型简单,需要加强可视化,在正式比赛中为二等奖 Honorable Mentions 奖B_M0157二等奖模型简单,可视化较好,在正式比赛中为二等奖 HonorableMentions 奖C_M0109二等奖模型简单,需要加强可视化,在正式比赛中为二等奖Honorable Mentions 奖B_M0018三等奖公式截图来自文献,均没有正确引用,全文没解决问题,图表也大部分截图来自参考文献,需要注意学术道德规范,在正式比赛中为Unsuccessful Participant 不成功参赛B_M0019三等奖摘要过短,模型过于简单,行间距过大,所做工作较少,在正式比赛中为 Successfully Participation 成功参与奖B_M0076三等奖论文格式不正确,不完整,论文没有完成,在正式比赛中为Successfully Participation 成功参与奖B_M0132三等奖摘要过短,模型过于简单,需要加强可视化,在正式比赛中为二等奖 Honorable Mentions 奖B_M0142三等奖摘要过短,模型过于简单,需要加强可视化,在正式比赛中为 Successfully Participation 成功参与奖B_M0153三等奖模型过于简单,需要加强可视化,在正式比赛中为二等奖Honorable Mentions 奖B_M0154三等奖图片不要截图,模型过于简单,需要加强可视化,在正式比赛中为二等奖 Honorable Mentions 奖B_M0159三等奖摘要过长,超过了一页,需要加强可视化,参考文献过少,在正式比赛中为二等奖 Honorable Mentions 奖C_M0038三等奖论文格式不正确,不符合比赛要求,模型简单,在正式比赛中为 Unsuccessful Participant 不成功参赛2019美国大学生数学建模竞赛赛前模拟成绩C_M0137三等奖摘要过短,模型简单,需要加强可视化,在正式比赛中为二等奖 Honorable Mentions 奖C_M0152三等奖第一问不是画出所有的图,模型过于简单,需要加强可视化,在正式比赛中为 Successfully Participation 成功参与奖C_M0156三等奖模型过于简单,需要加强可视化,在正式比赛中为Successfully Participation 成功参与奖C_M0160三等奖模型简单,需要加强可视化,在正式比赛中为二等奖Honorable Mentions 奖D_M0067三等奖不要截图,太模糊,模型过于简单,需要加强可视化,在正式比赛中为 Successfully Participation 成功参与奖D_M0128三等奖公式不要截图,模型简单,考虑因素较少,需要加强可视化,在正式比赛中为二等奖 Honorable Mentions 奖D_M0134三等奖模型简单,需要加强可视化,在正式比赛中为二等奖Honorable Mentions 奖D_M0150三等奖公式截图来自文献,均没有正确引用,全文没解决问题,图表也大部分截图来自参考文献,需要注意学术道德规范,在正式比赛中为 Unsuccessful Participant 不成功参赛D_M0190三等奖论文排版非常糟糕,公式截图来自文献,均没有正确引用,全文没解决问题,图表也大部分截图来自参考文献,需要注意学术道德规范,在正式比赛中为 Unsuccessful Participant 不成功参赛E_M0155三等奖摘要不符合要求,模型简单,需要加强可视化,在正式比赛中为二等奖 Honorable Mentions 奖F_M0144三等奖摘要过短,模型简单,需要加强可视化,在正式比赛中为二等奖 Honorable Mentions 奖B_M0212不成功参赛论文抄袭,并且不是本赛题的内容,严重违规,在正式比赛中为 Unsuccessful Participant 不成功参赛。

2.优秀论文一具体要求:1月28日上午汇报1)论文主要内容、具体模型和求解算法(针对摘要和全文进行概括);In the part1, we will design a schedule with fixed trip dates and types and also routes. In the part2, we design a schedule with fixed trip dates and types but unrestrained routes.In the part3, we design a schedule with fixed trip dates but unrestrained types and routes.In part 1, passengers have to travel along the rigid route set by river agency, so the problem should be to come up with the schedule to arrange for the maximum number of trips without occurrence of two different trips occupying the same campsite on the same day.In part 2, passengers have the freedom to choose which campsites to stop at, therefore the mathematical description of their actions inevitably involve randomness and probability, and we actually use a probability model. The next campsite passengers choose at a current given campsite is subject to a certain distribution, and we describe events of two trips occupying the same campsite y probability. Note in probability model it is no longer appropriate to say that two trips do not meet at a campsite with certainty; instead, we regard events as impossible if their probabilities are below an adequately small number. Then we try to find the optimal schedule.In part 3, passengers have the freedom to choose both the type and route of the trip; therefore a probability model is also necessary. We continue to adopt the probability description as in part 2 and then try to find the optimal schedule.In part 1, we find the schedule of trips with fixed dates, types (propulsion and duration) and routes (which campsites the trip stops at), and to achieve this we use a rather novel method. The key idea is to divide campsites into different “orbits”that only allows some certain trip types to travel in, therefore the problem turns into several separate small problem to allocate fewer trip types, and the discussion of orbits allowing one, two, three trip types lead to general result which can deal with any value of Y. Particularly, we let Y=150, a rather realistic number of campsites, to demonstrate a concrete schedule and the carrying capacity of the river is 2340 trips.In part 2, we find the schedule of trips with fixed dates, types but unrestrained routes. To better describe the behavior of tourists, we need to use a stochastic model(随机模型). We assume a classical probability model and also use the upper limit value of small probability to define an event as not happening. Then we use Greedy algorithm to choose the trips added and recursive algorithm together with Jordan Formula to calculate the probability of two trips simultaneously occupying the same campsites. The carrying capacity of the river by this method is 500 trips. This method can easily find theoptimal schedule with X given trips, no matter these X trips are with fixed routes or not. In part 3, we find the optimal schedule of trips with fixed dates and unrestrained types and routes. This is based on the probability model developed in part 2 and we assign the choice of trip types of the tourists with a uniform distribution to describe their freedom to choose and obtain the results similar to part 2. The carrying capacity of the river by this method is 493 trips. Also this method can easily find the optimal schedule with X given trips, no matter these X trips are with fixed routes or not.2)论文结构概述(列出提纲,分析优缺点,自己安排的结构);1 Introduction2 Definitions3 Specific formulation of problem4 Assumptions5 Part 1 Best schedule of trips with fixed dates, types and also routes.5.1 Method5.1.1 Motivation and justification5.1.2 Key ideas5.2 Development of the model5.2.1Every campsite set for every single trip type5.2.2 Every campsite set for every multiple trip types5.2.3One campsite set for all trip types6 Part 2 Best schedule of trips with fixed dates and types, but unrestrained routes.6.1 Method6.1.1 Motivation and justification6.1.2 Key ideas6.2 Development of the model6.2.1 Calculation of p(T,x,t)6.2.2 Best schedule using Greedy algorithm6.2.3 Application to situation where X trips are given7 Part 3 Best schedule of trips with fixed dates, but unrestrained types and routes.7.1 Method7.1.1 Motivation and justification7.1.2 Key ideas7.2 Development of the model8 Testing of the model----Sensitivity analysis8.1Stability with varying trip types chosen in 68.2The sensitivity analysis of the assumption 4④8.3 The sensitivity analysis of the assumption 4⑥9 Evaluation of the model9.1 Strengths and weaknesses9.1.1 Strengths9.1.2 Weakness9.2 Further discussion10 Conclusions11 References12 Letter to the river managers3)论文中出现的好词好句(做好记录);用于问题的转化We regard the carrying capacity of the river as the maximum total number of trips available each year, hence turning the task of the river managers into looking for the best schedule itself.表明我们在文中所做的工作We have examined many policies for different river…..问题的分解We mainly divide the problem into three parts and come up with three different….对我们工作的要求:Given the above considerations, we want to find the optimal。
目录问题回顾 (3)问题分析: (4)模型假设: (6)符号定义 (7)4.1---------- (8)4.2 有热水输入的温度变化模型 (17)4.2.1模型假设与定义 (17)4.2.2 模型的建立The establishment of the model (18)4.2.3 模型求解 (19)4.3 有人存在的温度变化模型Temperature model of human presence (21)4.3.1 模型影响因素的讨论Discussion influencing factors of the model (21)4.3.2模型的建立 (25)4.3.3 Solving model (29)5.1 优化目标的确定 (29)5.2 约束条件的确定 (31)5.3模型的求解 (32)5.4 泡泡剂的影响 (35)5.5 灵敏度的分析 (35)8 non-technical explanation of the bathtub (37)Summary人们经常在充满热水的浴缸里得到清洁和放松。
本文针对只有一个简单的热水龙头的浴缸,建立一个多目标优化模型,通过调整水龙头流量大小和流入水的温度来使整个泡澡过程浴缸内水温维持基本恒定且不会浪费太多水。
首先分析浴缸中水温度变化的具体情况。
根据能量转移的特点将浴缸中的热量损失分为两类情况:沿浴缸四壁和底面向空气中丧失的热量根据傅里叶导热定律求出;沿水面丧失的热量根据水由液态变为气态的焓变求出。
因涉及的参数过多,将系数进行回归分析的得到一个一元二次函数。
结合两类热量建立了温度关于时间的微分方程。
加入阻滞因子考虑环境温湿度升高对水温的影响,最后得到水温度随时间的变化规律(见图**)。
优化模型考虑保持水龙头匀速流入热水的情况。
将过程分为浴缸未加满和浴缸加满而水从排水口溢出的两种情况,根据能量守恒定律优化上述微分方程,建立一个有热源的情况下水的温度随时间变化的分段模型,(见图**)接下来考虑人在浴缸中对水温的影响。


先来d题的。
当然我说这些就是先给大家开阔一下思路。
我先从整个题目的角度上给大家分析一下这个题目,先不扣小点。
人员组成复杂、应急人员迅速进入、快速离开博物馆、adoptable mode这些关键词说的是什么意思?你的模型应该是动态搜索最佳撤离路径的。
不是只有一个固定的路径。
为什么要有应急人员进入呢?需要疏散大家,也就是说靠内部游客的自发的疏散效率是非常低的,面对复杂的状况,一定需要安保人员的。
这就给了大家一个合适的机会,内部游客可以从两方面获取信息。
一个是既定的已经训练安排好的标识,按照路径疏散,另一个就是通过安保人员,获取动态的信息。
所以你的模型是需要能解决静态下疏散,以及动态下新方案的给出。
目前来说,会导致管理人员选择新方案的原因大家也可以想到,比如某个门口被堵住,或者出线坍塌等,这个在题目中说到了,找出限制出口移动的潜在问题是非常重要的一项工作。
其中adoptable mode在很多翻译中翻译的不是很好,应该翻译成能适应能修改的模型,大家看一下原英文题目就懂了。
题目里说任何一种威胁都有可能导致单一的疏散路径发生很重大的变化,所以你的模型是要建立在考虑到很多隐患,能自适应调整路线的模型。
思路:目标就是以最快的速度将人员疏散出。
通过最佳的路口进行疏散。
这是题目第一段给出来的,最快这个条件,就转化到把人分配到最佳出口上。
主要是以四个主要的入口,其他的出口点就需要再进行权衡,是否进行人员疏散口。
当发生非常规事件后,内部用于疏散的应急人员需要进入内部,进行疏散任务。
这一批人员是可以通过其他出口点进入的。
可以安排一个时间阈值,当这个阈值时间下不能撤离全部人,可以使用这些小门。
研究这种人群疏散的文献特别多,大家耐心看几篇。
建立的模型,很大程度上要使用的一个方法是元胞自动机,当时上的时候也给大家提到过人群疏散的问题。
可以将元胞自动机(画图,把博物馆内的布局用格点表示出来,会非常的好看)视为一种演示的方法,但是你的模型需要从安排人员开始。

编者按:国际数学建模竞赛可以说是数学建模竞赛级别最高的赛事,每年有来自全球各著名高校2千多个参赛队参加但获得率只有不到1%的特等奖更是含金量极高的奖励。
特等奖获得者不但向世界展示了大学生自身高超的科研素质,同时也为其所在的学校在世界大学生中闻名。
从下面的文章中,我们可以看到本届竞赛特等奖获得者吉昱茜、卢磊和孟凡东的成长经历,希望他们的经历能为在校北京交通大学学子的成长提供帮助。
我们的数学建模经历2010国际数学建模竞赛特等奖获得者北京交通大学吉昱茜卢磊孟凡东国际大学生数学建模竞赛是世界范围内检验大学生科研素质的竞技平台,每年有世界范围内约2千多个参赛队参赛,特别是由于有世界很多著名学校挑选出来的建模尖子参加,使这个竞赛的挑战性极大。
由于该竞赛的特等奖比例不到全体竞赛队的1%,获得这个奖一直是我们梦寐以求的愿望。
在2010年4月7日,这是我们终生难忘的日子,因为在这一天,我们被告知获得本年度国际大学生数学建模竞赛特等奖,而且我们的论文将发表在国际著名杂志上!得到此消息,我们激动无比,幸福至极!时间有若苍狗流云,白驹过隙。
数学建模竞赛的时间虽然仅有三四天,但是要获得好成绩,在参加比赛的准备时间是一个很漫长而且重要的时段,我们在大学的学习可以说是伴随者数学建模一起成长的。
自2007年我们进入北京交通大学以来,就知到交大的数学建模竞赛活动开展的很好,而且每年在国内外的竞赛中交大的成绩都在前列。
从学校的数学建模网上,我们对数学建模有了初步的了解。
为了也能尽快进入参加数学建模竞赛的行列,我们从大一下学期开始就选修学了学校数学建模I和数学建模II课程。
这些课程的内容不需要太深的数学知识,我们大学一年级就能学懂。
在学习的过程中我们对数学建模产生了很大兴趣,并愿意阅读更多更深的数学建模书籍,同时我们有了参加数学建模竞赛的冲动。
学校每年有4个不同层次的数学建模竞赛,这些竞赛给我们提供了很好的锻炼自己的机会。
出于兴趣和爱好,我们已陆续的参加了2008年的校内建模、2009年全国大学生高教社杯数学建模竞赛、2009年全国电子电工杯数学建模竞赛和2010年国际数学建模竞赛。

IMMC 2019中华赛D题(冬季赛)(简体繁體English)空气污染源的定位和治理随着人类工业和社会活动的日益增加,细颗粒物PM2.5等空气污染物造成了大气灰霾,因而空气污染治理形势变得日益严峻。
为了有效监管大气污染物的排放,某城市请您的团队协助环保部门定位空气污染源的排放地点,并就空气污染治理政策提出建议。
为了定位方便,我们可以将某城市的布局用一个101 101的矩阵进行网格化表示(每个网格单位长度为1千米)。
你团队从环保部门得知一共有3个相互独立的污染源排放大气污染物,并且可以假设污染物在大气中扩散的时候温度和湿度等天气因素都保持不变。
问题1:在无风的条件下,在污染源排放100小时环保部门所检测到的大气污染物分布情况如图D.1所示。
与城市布局网格对应的具体污染物数值由所附Excel文件D01.xlsx给出(数值表示多少个浓度单位)。
请建立相应的数学模型对3个空气污染源进行定位。
图D.1问题2:大气污染物在排放过程中通常也会受到风力影响。
在问题1的基础上,假定风力因素不影响污染源排放而只对污染物的扩散产生漂移作用,假设v为风速,t v为风速影响的时间(单位:小时),θ为风向的角度(例如图D.2所示的风向角一般表示为西偏南θ角度)。
图D.2请在问题1的建模基础上写出在风力影响下的大气污染物扩散方程,并计算3个污染源共排放150小时,并且受到风速为0.2千米/小时的西南风(风向:西偏南30度)持续40小时的影响下的污染物数值表(请在Excel表格D02.xlsx填写对应的数值,结果保留小数点后两位)。
问题3:为了改善人居环境,城市环保部门利用有限财力,制定本地区空气首要污染物的减排治污可行性规划。
环保部门计划通过5年治理减少大气污染物共245个浓度单位,每年投入的经费由综合治理费用和专项治理费用两部分组成。
据估算,每减少一个大气污染物单位,当年需投入一个综合治理费用单位(每单位以百万元计),专项治理费用是当年减少的大气污染物浓度平方的0.005倍(单位:百万元)。
分析溃坝:针对南卡罗来纳州大坝坍塌建立模型 摘要萨鲁达大坝建立在卡罗莱纳州的墨累湖与萨鲁达河之间,如果发生地震大坝就会坍塌。
本文通过建立模型来分析以下四种大坝决口时水的流量以及洪水泛滥时水的流量:● 大坝的绝大部分被瞬间侵蚀看成是大坝瞬间彻底坍塌;● 大坝的绝大部分被缓慢侵蚀看成是大坝延期彻底坍塌;● 管涌就是先形成一个小孔,最终形成一个裂口;● 溢出就是大坝被侵蚀后,形成一个梯形的裂口。
本文建立了两个模型来描述下游洪水的泛滥情况。
两个模型都采用离散网格的方法,将一个地区看成是一个网格,每个网格都包含洪水的深度和体积。
复力模型运用了网格的速度、重力以及邻近网格的压力来模拟水流。
下坡模型假定水流速度与邻近网格间水位高度的成正比例。
下坡模型是高效率的、直观的、灵活的,可以适用于已知海拔的任何地区。
它的两个参数稳定并限制了水流,但该模型的预测很少依赖于它们的静态值。
对于萨鲁达溃坝,洪水总面积为25.106km ;它还没有到达国会大厦。
罗威克里克的洪水向上游延伸了km 4.4,覆盖面积达24.26.1km -变量及假设表1说明了用来描述和模拟模型的变量,表2列出了模拟程序中的参数。
表 1模型中的变量.变量 定义溃坝时的水流量速率1TF Q 瞬间彻底坍塌2TF Q 延期彻底坍塌PIPE Q 管涌OT Q 溢出peak Q 最大流速溃坝时水流出到停止所用时间1TF t 瞬间彻底坍塌2TF t 延期彻底坍塌PIPE t 管涌OT t 溢出V ∆ 溃坝后从墨累湖里流出的水的总体积Lm Vol 墨累湖的原来体积LM Area 墨累湖的原来面积breach d 从裂口到坝顶距离breach t 从裂口开始到溃坝形成的时间 近似圆锥的墨累湖的侧面一般假设● 正常水位是在溃坝前的湖水位置。
● 河道中的水流不随季节变化而变动。
● 墨累湖里的水的容积可以看作为一个正圆锥(图1 )。
表2 模拟程序中的参数 参数 所取值 意义BREACH_TYPE 变量 瞬间彻底坍塌,延期彻底坍,管涌,溢出模型中的一种 T ∆ 0.10 时间不长的长度(s)MIN_DEPTH 0001.0 网格空时的水的深度(m) FINAT T 100000 大坝彻底决口所用时间 b T 3600 溃坝达最大值的时间(s) peak Q 25000 溃坝的最大流速(m 3/s) breach d 30 蓄水池的最初深度(m) LM Volume 910714.2⨯ 墨累湖的总体积(m 3) LM Area 610202⨯ 墨累湖的总面积(m 2)k 504.0 扩散因素 (控制两网格间交换的水的数量) MAX_LOSS_FRAC 25.0 单位网格中水的最大流失量图 1. 水库近似一个正圆锥.大坝假设● 萨鲁达大坝在以下四种方式之一坍塌:-瞬间彻底坍塌,-延期彻底坍塌,-管涌,-溢出。
SummaryChina is the biggest developing country. Whether water is sufficient or not will have a direct impact on the economic development of our country. China's water resources are unevenly distributed. Water resource will critically restrict the sustainable development of China if it can not be properly solved.First, we consider a greater number of Chinese cities so that China is divided into 6 areas. The first model is to predict through division and classification. We predict the total amount of available water resources and actual water usage for each area. And we conclude that risk of water shortage will exist in North China, Northwest China, East China, Northeast China, whereas Southwest China, South China region will be abundant in water resources in 2025.Secondly, we take four measures to solve water scarcity: cross-regional water transfer, desalination, storage, and recycling. The second model mainly uses the multi-objective planning strategy. For inter-regional water strategy, we have made reference to the the strategy of South-to-North Water Transfer[5]and other related strategies, and estimate that the lowest cost of laying the pipeline is about 33.14 billion yuan. The program can transport about 69.723 billion cubic meters water to the North China from the Southwest China region per year. South China to East China water transfer is about 31 billion cubic meters. In addition, we can also build desalination mechanism program in East China and Northeast China, and the program cost about 700 million and can provide 10 billion cubic meters a year.Finally, we enumerate the east China as an example to show model to improve. Other area also can use the same method for water resources management, and deployment. So all regions in the whole China can realize the water resources allocation.In a word, the strong theoretical basis and suitable assumption make our model estimable for further study of China's water resources. Combining this model with more information from the China Statistical Yearbook will maximize the accuracy of our model.。
黑龙江科学HEILONGJIANG SCIENCE第12卷第3期2021年2月Vol. 12Feb. 2021高等数学应用之空气质量的校准——2019高教社杯全国大学生数学建模竞赛D 题分析李晓敏(山东协和学院,济南250109)摘要:为更好地监测空气质量数据,监测大气中的污染物浓度并及时做出应对措施,对国控点和自建点的数据进行分析,并利用国控点数据,建立模型对自建点数据进行校准。
国控点布控较少,数据发布时间滞后且花费较大,无法给出实时的监测和预报。
某公 司研发了一款监测仪(自建点),花费较小,同时可以监测多种气象数据,但监测数据与国控点存在差异性,结果表明国控点数据较 为准确。
关键词:高等数学;空气质量校准;数学建模中图分类号:0225文献标志码:A文章编号:1674 -8646(2021)03 -0082 -02Application of Advanced Mathematics in Air Quality Calibration------Analysis of D Text in 2019 Higher Education Press National UndergraduatesMathematical Modeling ContestLi Xiaomin(Shandong Xiehe University, Jinan 250109, China)Abstract : In order to better monitor the air quality data and the pollutant concentration in the air, and to propose countermeasures , the research analyzes the data of the national control and self-building sites , uses national control sites data, and establishes modeling to calibrate self-building sites. The control of national control points is less, the lag of data issue time is relatively serious , the expenditure is heavy , and timely monitoring and forecasting cannot be achieved ・ A company researches a kind of monitor ( self-building s 让es ) with little cost. Multiple meteorological data can be monitored ・ There is difference in monitoring data and national control sites. The results show that data of national controlsites is accurate ・Key words : Advanced mathematics ; Air quality calibration ; Mathematical modeling我国为应对大气污染问题设立了空气质量监测 点,但是由于监测点数量较少,数据更新发布时间存在延迟且花费较大,存在无法实时监测和预报不足的问题。
2024年美赛d题思路全文共四篇示例,供读者参考第一篇示例:2024年美赛(MCM/ICM)是一个世界级的数学建模竞赛,每年都吸引着数以万计的学生参与。
每年的比赛都设立了不同的题目,具有挑战性和创新性,让参赛者在数学建模领域有所突破。
2024年的美赛D题也是一个备受关注的题目,让我们一起来看一看这个题目的思路。
2024年美赛D题的思路可能涉及到复杂的系统分析和优化问题。
这可能涉及到城市交通系统、能源消耗、环境保护等方面的议题。
一种可能的D题思路是:城市交通系统的优化和设计。
这个题目可以涉及到城市交通的流量分析、交通拥堵的原因和影响、以及如何优化城市交通系统。
参赛者可以通过数据分析和模拟来研究城市交通系统的流量分布。
他们可以利用历史数据和实时数据来分析不同时间段和不同区域的交通流量,从而找出交通拥堵的瓶颈所在。
然后,他们可以利用数学建模的方法来模拟不同的交通流量分布情况,以预测未来的交通状况。
参赛者可以研究交通拥堵的原因和影响。
他们可以分析不同因素对交通流量的影响,比如道路条件、交通信号、公共交通等。
通过数学建模,他们可以找出造成交通拥堵的主要原因,并提出相应的解决方案。
参赛者可以提出如何优化城市交通系统的方案。
他们可以设计不同的交通方案,比如增加公共交通、改善道路条件、优化交通信号等。
通过数学优化方法,他们可以找到最优的交通方案,从而提高城市交通系统的效率和舒适度。
2024年美赛D题的思路可能涉及到城市交通系统的复杂性和多样性,需要参赛者具有较强的数学建模和分析能力。
参赛者可以通过多种途径来解决这个问题,比如数据分析、模拟、数学建模、优化方法等。
希望参赛者能够在比赛中发挥出色,为解决实际问题做出贡献。
【本文共517字】【未完待续……】第二篇示例:2024年美赛d题思路2024年的美国数学建模竞赛(MCM/ICM)是一场历史悠久、备受瞩目的数学建模比赛。
每年都有大量的学生和导师参与争夺最高荣誉。
在2024年的比赛中,d题通常是一个具有挑战性和创新性的问题,需要参赛者发挥出色的数学建模能力和团队合作精神。
Random Walks and Rehab: Analyzing the Spread of theOpioid CrisisEllen ConsidineSuyog SotiEmily WebbUniversity of Colorado BoulderBoulder,ColoradoUSAellen.considine@Advisor:Anne DoughertySummaryWe classify69types of opioid substances into four categories based on synthesis and availability.Plotting use rates of each category over time re-veals that use of mild painkillers and natural alkaloids has stayed relatively constant over time,semi-synthetic drugs have declined slightly,and syn-thetic drugs such as fentanyl and heroin have increased dramatically.These findings align with reports from the CDC.We select54of149socioeconomic variables based on their variance inflation factor score(a common measure of multicollinearity)as well as on their relevance based on the public health literature.To model the spread of the opioid crisis across Kentucky,Ohio,Penn-sylvania,West Virginia,and Virginia,we develop two completely different models and then compare them.Ourfirst model is founded on common modeling approaches in epidemi-ology:SIR/SIS models and stochastic simulation.We design an algorithm that simulates a random walk between six discrete classes,each of which represents a different stage of the opioid crisis,using thresholds for opioid abuse prevalence and rate of change.We penalize transitions between cer-tain classes differentially based on realistic expectations.Optimization of parameters and coefficients for the model is guided by an error function in-spired by the global spatial autocorrelation statistic Moran’s I.Testing our model via both error calculation and visual mapping illustrates high accu-racy over many hundreds of trials.However,this model does not provide much insight into the influence of socioeconomic factors on opioid abuse The UMAP Journal40(4)(2018)353–380.c Copyright2019by COMAP,Inc.All rights reserved. Permission to make digital or hard copies of part or all of this work for personal or classroom use is granted without fee provided that copies are not made or distributed for profit or commercial advantage and that copies bear this notice.Abstracting with credit is permitted,but copyrights for components of this work owned by others than COMAP must be honored.To copy otherwise, to republish,to post on servers,or to redistribute to lists requires prior permission from COMAP.rates,because incorporating those factors does not significantly change the model results.Our second model makes up for this deficiency.Running spatial regres-sion models on socioeconomic predictors(including total drug use rate),we explore the spatial patterning of the opioid crisis as the result of a spillover ef-fect and of spatially-correlated risk factors,using spatial lag,spatial error,and spatial Durbin models.While all models confirm significant spatial signals, the spatial Durbin model performs the best.We also calculate the direct,in-direct,and total impacts of each predictor variable on opioid abuse rate.Far and away,the most important variable in all models is the total drug use rate in each county.The average result(across all seven years)is that a unit increase in total illicit drug use rate would raise the opioid abuse rate by52%.This is quite realistic,given a CDC statistic that in2014,61%of drug overdose deaths involved some type of opioid.By contrast,an ordinary linear regres-sion reports only a37%increase in opioid abuse rate per unit increase in total drug use rate.Statistical measures such as the Akaike Information Criterion and Likelihood Ratio Test verify the superiority of our spatial models.To predict possible origins of the opioid epidemic in each of thefive states,we run a Monte Carlo simulation of our random walk model from 2000to2010.We map these counties and discuss their arrangement in the context of our otherfindings.The random walkfinds that the opioid crisis most likely started in Montgomery,Kentucky,which conclusion aligns with research that opioid abuse is more prevalent in rural communities than in urban ones.To forecast spread of the opioid crisis from2017–2020,we use both the random walk and spatial regression models.The two models display sur-prisingly minimal deviance from each other,especially in2019and2020.The random walk predicts that the number of counties above the illicit opioid use threshold will go down within the next seven years,which aligns with the idea that the opioid epidemic follows the spillover effect seen in infectious epidemiology.Due to our assumption that the socioeconomic indicators change linearly, the second model’s error significantly increases after about4–5years.The random walk,on the other hand,operates on a healthy tension between wanting to cluster together and randomly assigning classes.Near the ini-tial date,it clusters more;but the randomness starts to compound rather quickly.For this reason,the random walk has lowest errors near the4–7year mark.This means that the best strategy to predict the future would be the spatial regression1–3years out,and the random walk for the4–7year range.Predicting anything beyond this point will have high error. Introduction and Problem StatementThe deadly consequences of abusing prescription narcotic pain-relief medications,heroin,and synthetic opioids are affecting people in all50 states and across all socioeconomic classes.The opioid epidemic claims the lives of115people in the United States every day[Health Resources&Services Administration2019].Through healthcare costs,rehabilitation treatment,lost productivity,and criminal justice involvement,the opioid crisis is costing the U.S.federal government an estimated$78.5billion each year[National Institute on Drug Abuse2019].Our team is presented with the following modeling tasks:•characterize the spread of the opioid epidemic throughout Kentucky, Ohio,Pennsylvania,Virginia,and West Virginia and analyze resulting patterns;•incorporate socioeconomic factors in our model and analyze the associ-ations,if any,between them and opioid abuse rates;and•use results from these models to recommend public policy strategies to combat the opioid epidemic.To perform these analyses,we are limited to data for2010–2016from the American Community Survey(ACS),which provides socioeconomic indicators,and from the National Forensic Laboratory Information System (NFLIS)on illicit drug use.All data are provided at the county level.To characterize the spread of the opioid crisis throughout thesefive states,we develop two models:•Thefirst simulates a random walk through stable,endemic,and epi-demic stages.•The second is a standard collection of spatial regression models.After describing these two modeling approaches and their results,we re-port forecasts from both models on the future spread of the opioid epi-demic,and compare the results.This dual-pronged approach provides di-verse insights into the nature of the opioid crisis,and helps us to identify strategies for government intervention.Etiology of the Opioid CrisisA Brief Timeline of the EpidemicOpioids emerged into the non-cancer pain market following studies in the1990s indicating that pain was inadequately treated.Pharmaceutical companies and medical societies were reassured(by somewhat erroneous studies)that opioids were not addictive[Rummans et al.2018].Thus,the first wave of opioid prescriptions began.The second wave occurred around2010as the addiction began to ernment organizations placed limits on opioid prescriptions.Many of those already addicted turned to heroin instead,which was often im-pure or mixed with other drugs,leading to increased deaths[National In-stitute on Drug Abuse2018].The third wave came in2013with the rise of synthetic opioids,such as fentanyl.Risk FactorsCurrently,age appears to have the largest impact on susceptibility to addiction.The younger a person,the more vulnerable to addiction:74% of individuals admitted to treatment programs between18and30years of age had started abusing drugs before the age of17.However,the ma-jority of people admitted for heroin and prescription painkiller addictions started using drugs after the age of25[Substance Abuse and Mental Health Services Administration2014].Common Epidemiological ModelsSeveral types of models and overarching principles in public health re-search guide our approach to the given tasks.Compartmental ModelsA compartmental model is commonly used to simplify mathematical mod-eling of infectious diseases.Populations are divided into compartments with assumptions about the nature of each compartment and the time rate of transfer between them.In the SIR model,the population is partitioned into three groups:susceptible(S),infected(I),and removed(R).S’s are in-dividuals who have not been infected,but who are susceptible to infection; I’s are those who are infected and are capable of transmitting the disease; R’s are people who can no longer contract the disease because they have recovered with immunity,been quarantined,or died.Stochastic SimulationA.A.Brownlea incorporated a time element into modeling the spread of infectious hepatitis in Wollongong,Australia.He simulated random diffusion advancing as a ring from the origin of infection[Emch et al.2017].Our ModelWe combine the approaches of dynamic compartmental and stochastic simulation to model the spread of the opioid crisis.Our needs diverge from the Greenwood model in that both our popu-lation size and the probability of“becoming infected”are dynamic,espe-cially once we include socioeconomic factors as predictors—these predic-tors change over time.Thus,the foundation of ourfirst model is a time-inhomogeneous random walk,where each county acts as an“agent.”Foundations of the ModelsTerminology•Prevalence is the fraction of people in a population who are sick with a disease at a particular point in time.•An epidemic burdens a disproportionately large number of individuals within a population,region,or community at the same time.•A disease that is constantly present in a given area is called endemic.•A disease that occurs with intense transmission,exhibiting a high and continued incidence,is called hyperendemic.•A phenomenon exhibits spatial autocorrelation if the presence of some factor in a sampling unit makes that factor’s presence in neighboring sampling units more or less likely[Klinkenberg2019].Assumptions1.All counties for which we have no data have either a low abuse rate or no opioid abuse;all counties with illicit opioid cases are reported in our data set.2.Three months is the minimum period of time in which a county can transition between distinct stages in the opioid epidemic.cation level is a proxy for income and healthcare status,ancestry and language together indicate race,and veteran status can stand in for disability.4.Linear extrapolation of socioeconomic indicators is acceptable within five years beyond the time span for which we have data(2010–2016).Overarching ConceptsA peril in using aggregated data to characterize social or ecological phe-nomena is the temptation of the ecological fallacy:asserting that associations identified at one scale of analysis are valid at either larger or smaller scales [Emch et al.2017].We incorporate some logic about individuals’opioid abuse into our model for county opioid rates,but do not claim that pat-terns at the county level represent the experiences of individuals.A major question is whether a spatial autocorrelation of a health out-come is due to spillover(diffusion)or is simply explained by regions near each other having similar social,economic,and environmental characteris-tics that result in similar health outcomes.We explore spillover,spatially-correlated risk factors,and a combination of the two.Exploring the Drug Report DataTracking all69drugs tagged in the National Forensic Laboratory Infor-mation System(NFLIS)data would be burdensome and probably not pro-duce useful results.So,to diagnose meaningful trends in the NFLIS data, we divide opioids into four categories based on chemical synthesis and availability:•Methadone,buprenorphine,etc.:mild painkillers sometimes used to treat opioid addiction,easily available in clinics and are not as intensely regulated as other opioids.•Hydrocodone,oxycodone,etc.:semi-synthetic opioids,among the most addictive and deadly drugs,contributing to the most overdose deaths from prescription opioids in2017[Centers for Disease Control and Pre-vention2019].Their semi-synthetic nature makes them more difficult to produce outside of a laboratory;they are likely abused as prescriptions or through overlooked distribution leaks.•Fentanyl,heroin,U-48800,etc.:the largest category and the one with the highest increases in abuse and overdose deaths in recent years.It includes mainly synthetic opioids.Heroin is included in this category despite its semi-synthetic nature because it is illegal,and thus like other synthetic drugs,it can’t be made entirely without the assistance of a professional laboratory.•Morphine,codeine,etc.:natural alkaloids of the opium poppy.They are less potent than their semi-synthetic and synthetic cousins;codeine can be found in varieties of Tylenol painkillers.Figure1shows that the prevalence of the opioids in each category(with the exception of synthetics)remained relatively constant over the six years for which we have data.Synthetic opioids became increasingly prevalent following2011,in accord with reports from the Centers for Disease Control [Katz and Sanger-Katz2018].Building a Model,Part I:Characteristics of the EpidemicThe discrete nature of both annual and county-aggregated data leads us to consider discrete time and discrete space(DTDS)Markov models.A stochastic process has the Markov property if the conditional probabilities of future states in the process depend only on the current state,not on past states.Our intuition is that,like an individual recovering from addiction, a county may regress if it does not make consistent efforts to address drug abuse.Thus,the current situation of a county directly influences its future situation.Figure1.Drug trends for each category,2010–2016.Discrete Classes for Prevalence and Rate of ChangeInstead of working with the exact prevalence of opioid abuse in each county,we classify each county into“low”or“high”and“increasing”or “decreasing”opioid abuse prevalence.We choose the median as the cutoff between“low”and“high”preva-lence.We classify all values greater than one standard deviation above the mean to be“increasing,”and all values lower than one-half standard devi-ation below the mean to be“decreasing.”Our reasoning for the difference is that the data are from years when the opioid crisis was in full swing,so “normal”in the data set is not the normal in general;and it is harder for a county to rehabilitate than to develop an opioid abuse problem,so smaller changes in the negative direction represent larger changes in the county. Values between these two cutoffs are regarded as“stable.”Counties for which we have no data we classify as“low stable.”Categories for Our DataIn Figure2a,the vertical line(red)represents the median for our data. In Figure2b,the left(orange)and right(red)vertical lines represent the decreasing and increasing cutoffs.The horizontal axes have a scale of10 3. We have six categories:low and stable(LS),high and stable(HS),low and increasing(LI),high and increasing(HI),low and decreasing(LD),andhigh and decreasing(HD).Figure2a.Prevalence.Figure2b.Rates of change.Figure2.Cutoffs for prevalence and for decreasing/increasing opioid abuse.The proportions of counties in each category stayed constant between 2010and2016,but the spatial distribution of the categories did not.In fact,the pattern reminded us of the description of Brownlea’s hepatitis model as a ring-shaped clinical front expanding radially from an origin [Emch et al.2017],in this case apparently southwestern West Virginia.The maps in Figure3depict the prevalence of opioid abuse in each county in 2010and in2016.Note the“ring-like”expansion of the darker-red sections (which indicate regions of high and stable opioid abuse).The numbers in the legend correspond to the six classes as follows:1–Low Stable,2–High Stable,3–Low Decreasing,4–High Decreasing,5–Low Increasing,6–High Increasing.Figure3.Spread of the opioid epidemic from2010(left)to2016(right).How the Model WorksThe state(category)of a county at the next time step in our model is influenced by its current state,the states of its neighboring counties,a noise parameter,and random selection from a probability vector.Our Python code performs the following tasks:1.Initialize the county probability vector,a1⇥6vector containing the probabilities that the county will be in the predetermined classes in thenext timestep.It is initialized by adding noise uniformly to each class such that the probability of a country transitioning from one class to any other is greater than zero.The level of noise added is optimized to minimize error(discussed below).2.Each neighboring county adds a tally to the entry of the county’s proba-bility vector corresponding to the neighboring county’s class.This tally incorporates inverse distance weighting.In other words,a county di-rectly adjacent adds a tally of1,a county with one county in between it and the origin county adds a tally of1/4,etc.3.Divide each entry in the probability vector by the relevant transition score in the penalty matrix below,which reflects our expectations about how difficult it should be to transition between classes.If our algorithm classifies a county as high stable,but the data say that it should be high increasing,we want the error to reflect the fact that our model was close and not so wrong as to have classified that county as having low preva-lence.This need explains the penalty matrix.26 6666 664LS HS LI HI LD HD LS|142321 HS|413232LI|231222 HI|322142 LD|232412 HD|3222213777777754.Scale the probability vector by a coefficient vector that was previously optimized to account for the overall importance of each class,in the same manner as the noise was optimized.5.Normalize the probability vector so that it becomes a discrete probabil-ity distribution.6.Thefinal probability vector defines the distribution from which we sam-ple to determine the county’s class for the next time period.7.Repeat the steps above for some number of timesteps and then for some number of trials so that each trial walks through the specified number of timesteps.After running the Monte Carlo simulation detailing possible outcomes, we pick the most likely class of the county at the time that we are most interested in analyzing.Evaluation of the ModelError analysis is tricky for this model because a good result does not necessarily mean a perfect match to the data.The model results cluster a lot more than the real data do,as seen in Figure4.Figure4.Model clustering in2016.Instead of trying to characterize clustering at each location,we devise an error function based on overall spatial autocorrelation.We look to Moran’s I statistic[Emch et al.2017](a standard measure of spatial autocorrelation) for inspiration and present the following formula.For each class,for all counties in that class,our spatial autocorrelation measure is the mean pro-portion of neighbors with the same class.Then we take the sum over the classes of the difference between the simulated and real spatial autocorre-lation measures.A class=1number of counties of that class⇥counties of that classX✓#neighbors with same class#neighbors◆,Err total=classesX A predicted A real .Using this error function to optimize levels of noise and other param-eters in our model eradicates the clustering,leaving us with results akin to the those depicted in Figure5.Note:each time we run the model,we get slightly different results due to the random nature of added noise.Model TestingThe histograms of the six categories stay more or less constant over time, depending on the levels of noise added to the initial probability distribu-tion.Models with more noise tend to diverge atfirst,but by2016the noise compounds so much that simulations with noise have distributions thatFigure5.Best prediction from the model in2016.match the data more closely than simulations without noise.Wefind that the optimal level of noise is0.3(Figure6).Figure6.Category prevalences for data vs.simulations in2016.Because the random walk is on its own after being initialized by the2010 data,there is no obvious reference point to deduce an optimal timestep size.Optimization of coefficients wouldfit the model to the data regard-less of step size,so we choose a step size of three months(four steps per year)for ease of comparison to the annual data,and with the thought that three months is about the minimum time in which a county could switch category.Thefinal optimization determines the coefficients on each cate-gory.Building a Model,Part II:Socioeconomic FactorsLiteratureThe opioid epidemic is notable for its range across socioeconomic classes. The three main risk factors appear to be race[Berezow2018;Substance Abuse and Mental Health Services Administration2018;Barbieri2018], education[Substance Abuse and Mental Health Services Administration 2018;Scommegna2018],and veteran status[Recovery First2019].Other risk factors include gender(women,despite recent increases,are less likely to abuse opioids than men)[National Institute on Drug Abuse 2018],age(younger people are more at risk)[National Institute on Drug Abuse2018],and population size(opioid abuse is more prevalent in rural communities than in urban settings)[Keyes et al.2014].Disability could be a possible risk factor because of the higher rates of opioid prescriptions associated with chronic pain,but few data on this topic are available.American Community Survey IndicatorsThe subset of the American Community Survey(ACS)data from2010 to2016provided for this problem includes variables about household size and family structure,age and gender distribution,educational enrollment and attainment,veteran status,disability status,residential mobility,place of birth,language spoken at home,and ancestry.It does not include cer-tain statistics that our research indicates would be useful,such as income, unemployment rate,healthcare coverage,and race.For the sake of consistency across years,we remove variables for which one or more of the years have missing data.This process removes fer-tility statistics,disability status,citizenship status,world region of birth for foreign born,and several miscellaneous household/family structure variables—in total,27of the149socioeconomic factors.Because of the discrepancies between the data that we have and the data that we would want,we assume that•education level is a proxy for income and healthcare status,•ancestry and language indicate race,and•veteran status stands in for disability.Because there was so much information in the survey data regarding household size and family structure,we focus subsequent research on any ties between household/family structure and opioid addiction.While the epidemic affects families of all kinds,we notice an increase in grandpar-ents raising their grandchildren in areas where the opioid epidemic hashit hardest[BAART Programs2018].This occurs as parents are separated from their children,both voluntarily and not(e.g.,death),due to addiction.Model Optimization with Socioeconomic StatusTo incorporate socioeconomic factors into our random walk model,we first run a random forest algorithm in sklearn[Pedregosa et al.2011]that classifies each county into one of our six categories based on23socioeco-nomic ing the feature importance attribute in sklearn,we find that the10most important socioeconomic factors are total illicit drug use rate,total population,people born in the U.S.,American ancestry,Irish ancestry,only English spoken at home,people with some college but no degree,high school graduation rate,Polish ancestry,and people with a graduate or professional degree.Unfortunately,these feature rankings are based on absolute magnitude,so they do not provide insight into the di-rection of influence on opioid abuse rates.Our adapted model uses probabilities generated by this random forest classifier to initialize the probability vector for our random walk.The al-gorithm then proceeds as before.After making this adaptation,we use our error function to compare the performance of the new model to the old.Once we optimize the coeffi-cients,both models become more accurate,and their performances become comparable.Error and Sensitivity AnalysisThe random walk model takes on high error immediately after the start of the simulation.With noise,the error peaks around2013and then begins a steep descent;without noise,the error continues on an upward path. Our model supports a healthy tension between the clustering noted ear-lier and the randomness added later with the inclusion of noise.However, this balance takes about24timesteps(6“years”)to reach,which is why the error is higher toward the beginning of the simulation than at the end.Possible Origin LocationsTo avoid adding bias to our model through reliance on extrapolated socioeconomic factors,we do origin identification analysis with the old model,which did not rely on socioeconomic factors.We run a Monte Carlo simulation tofind the possible origin locations,starting the epidemic in each county in2000,during the height of thefirst wave of the opioid crisis. The simulation then propagates forward in time until2010,at which time we compare the results to the given data.The simulations with the low-est amount of dissimilarity to the2010data indicate the counties in whichthe epidemic likely began.Figure7highlights the counties in which the epidemic could have started(purple)and the countiesfirst to contract the epidemic in their respective states(blue:topmost shaded county in each of Pennsylvania,West Virginia,and Virginia,and lowest shaded county in Ohio;and gold:leftmost of three adjacent shaded counties in Kentucky). The most likely origin of the crisis according to the random walk model is Montgomery,Kentucky(in gold).Figure7.Possible origin locations of the epidemic.The epidemic origin according to this result model is not far from south-western West Virginia,which we hypothesized earlier as the origin.Second Approach:Spatial RegressionWe explore the application of spatial regression models to the NFLIS and ACS data[Spielman2015;Ver Hoef et al.2017].Taking into account spatial relationships is important because spatial correlation dramatically reduces the information contained in a sample of independent data,often by a factor of2[Waller and Gotway2004].Within spatial regression,there are three common types of models:•Spatial Autoregressive models(SARs),also known as spatial lag mod-els,quantify the spatial dependence of the dependent variable y amongneighboring regions,the diffusion or“spillover”effect of y[Sparks2015]:y=⇢W y+X +u,where W represents the spatial weights(adjacency or distance between regions),⇢is the spatial autoregressive coefficient,and the error u is assumed to be classical(independent of y)[Viton2010].•Spatial Error Models(SEMs)quantify spatial dependence of the resid-uals.Instead of a spillover effect,they conceptualize spatial error as spatial correlation in one or more unidentified predictor variables:y=X +u,u= W u+⌫,where,in addition to the variables defined above, is the spatial autore-gressive coefficient,and⌫⇠N(0, 2)[Viton2010].•Spatial Durbin Models(SDMs)are a combination of spatial lag and spatial error models[Anselin2003].By lagging the predictor variables in the model using W,we can get a collection of spatial predictor variables in addition to the regular predictors:y=⇢W y+X +W X✓+✏,where in addition to the variables defined above,✓is a vector of the re-gression coefficients for the lagged predictor variables and✏is the error [Sparks2015].It is also possible to include the lagged predictors in a spatial error model,resulting in a Durbin Error Model(DEM),but that model appears to be less common and we do not explore.The question of model specification depends on whether we think that opioid abuse results from diffusion or is simply influenced by spatially-varying risk factors.Fortunately,we can rely on statistical tests as well as the combination of our research and intuition to select a model.Model FittingTo perform statistical regression,we use the R package spdep.To quan-tify the spatial weights(W in the model),we use a shapefile of all U.S. counties[United States Census Bureau2017],subset it to include only the five states of interest,and convert it to a spatial weights object,illustrated in Figure8.We identify and remove highly-correlated variables,using the method of variance inflation factors(VIF).The formula for VIF is as follows:V IF k=11 R2k,。