
Confidence-Interval-Estimation
- 格式:ppt
- 大小:315.00 KB
- 文档页数:16
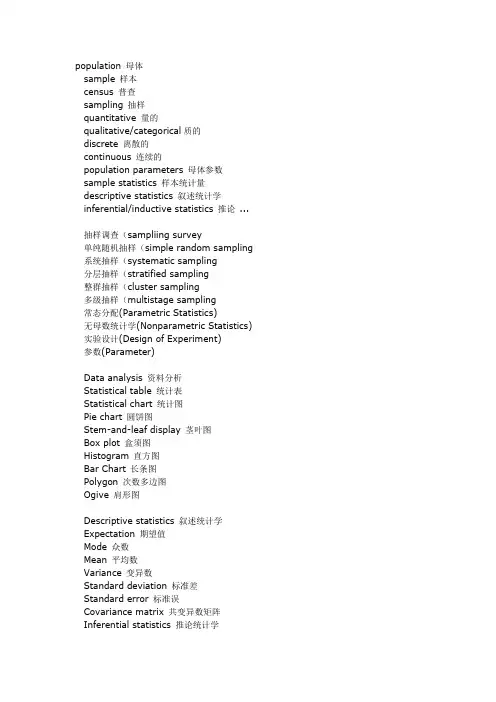
population 母体
sample 样本
census 普查
sampling 抽样
quantitative 量的
qualitative/categorical质的
discrete 离散的
continuous 连续的
population parameters 母体参数
sample statistics 样本统计量
descriptive statistics 叙述统计学
inferential/inductive statistics 推论 ...
抽样调查(sampliing survey
单纯随机抽样(simple random sampling
系统抽样(systematic sampling
分层抽样(stratified sampling
整群抽样(cluster sampling
多级抽样(multistage sampling
常态分配(Parametric Statistics)
无母数统计学(Nonparametric Statistics)
实验设计(Design of Experiment)
参数(Parameter)
Data analysis 资料分析
Statistical table 统计表
Statistical chart 统计图
Pie chart 圆饼图
Stem-and-leaf display 茎叶图
Box plot 盒须图
Histogram 直方图
Bar Chart 长条图
Polygon 次数多边图
Ogive 肩形图
Descriptive statistics 叙述统计学
Expectation 期望值
Mode 众数
Mean 平均数
Variance 变异数
Standard deviation 标准差

统计学中的参数估计方法
统计学中的参数估计方法是研究样本统计量与总体参数之间关系的重要工具。通过参数估计方法,可以根据样本数据推断总体参数的取值范围,并对统计推断的可靠性进行评估。本文将介绍几种常用的参数估计方法及其应用。
一、点估计方法
点估计方法是指通过样本数据来估计总体参数的具体取值。最常用的点估计方法是最大似然估计和矩估计。
1. 最大似然估计(Maximum Likelihood Estimation)
最大似然估计是指在给定样本的条件下,寻找最大化样本观察值发生的可能性的参数值。它假设样本是独立同分布的,并假设总体参数的取值满足某种分布。最大似然估计可以通过求解似然函数的最大值来得到参数的估计值。
2. 矩估计(Method of Moments)
矩估计是指利用样本矩与总体矩的对应关系来估计总体参数。矩估计方法假设总体参数可以通过样本矩的函数来表示,并通过求解总体矩与样本矩的关系式来得到参数的估计值。
二、区间估计方法
区间估计是指根据样本数据来估计总体参数的取值范围。常见的区间估计方法有置信区间估计和预测区间估计。 1. 置信区间估计(Confidence Interval Estimation)
置信区间估计是指通过样本数据估计总体参数,并给出一个区间,该区间包含总体参数的真值的概率为预先设定的置信水平。置信区间估计通常使用标准正态分布、t分布、卡方分布等作为抽样分布进行计算。
2. 预测区间估计(Prediction Interval Estimation)
预测区间估计是指根据样本数据估计出的总体参数,并给出一个区间,该区间包含未来单个观测值的概率为预先设定的置信水平。预测区间估计在预测和判断未来观测值时具有重要的应用价值。
三、贝叶斯估计方法
贝叶斯估计方法是一种基于贝叶斯定理的统计推断方法。贝叶斯估计将先验知识与样本数据相结合,通过计算后验概率分布来估计总体参数的取值。
《概率论与数理统计》基本名词中英文对照表
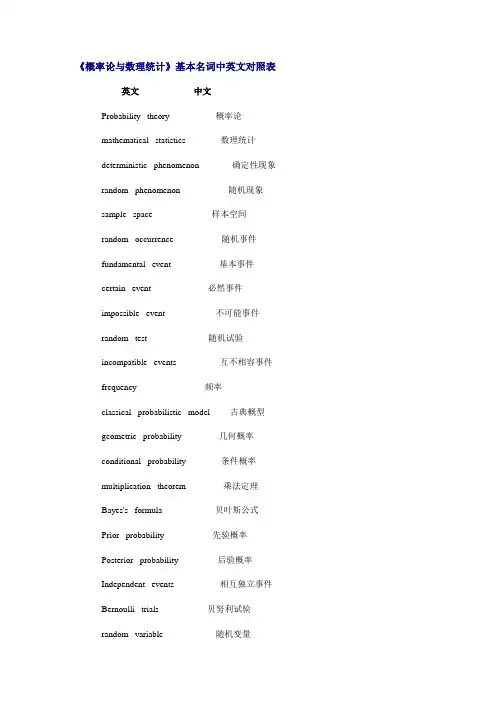
英文 中文
Probability theory 概率论
mathematical statistics 数理统计
deterministic phenomenon 确定性现象
random phenomenon 随机现象
sample space 样本空间
random occurrence 随机事件
fundamental event 基本事件
certain event 必然事件
impossible event 不可能事件
random test 随机试验
incompatible events 互不相容事件
frequency 频率
classical probabilistic model 古典概型
geometric probability 几何概率
conditional probability 条件概率
multiplication theorem 乘法定理
Bayes's formula 贝叶斯公式
Prior probability 先验概率

1 PharmaSUG 2014 - Paper IB05
Attain 100% Confidence in Your 95% Confidence Interval
Indu Nair, United BioSource Corporation, Blue Bell, Pennsylvania
Binal Patel, United BioSource Corporation, Blue Bell, Pennsylvania
ABSTRACT
A very common mistake in the calculation of a confidence interval occurs when there are no qualifying subjects in a
by group for a category being tested. It is very tempting to assume that the confidence interval will be missing when
the count is zero, which is incorrect. This tends to get overlooked since the usual methods of calculating confidence
intervals, such as using a simple PROC FREQ in SAS®, will not take care of the situation without manipulating the
code further. This paper will present the different methods in PROC FREQ that allow you to calculate the confidence
intervals and discuss which methods are more appropriate to use. This paper will also explain how to use a formula