Rock burst prediction based on genetic algorithms and extreme learning machine
- 格式:pdf
- 大小:542.48 KB
- 文档页数:9
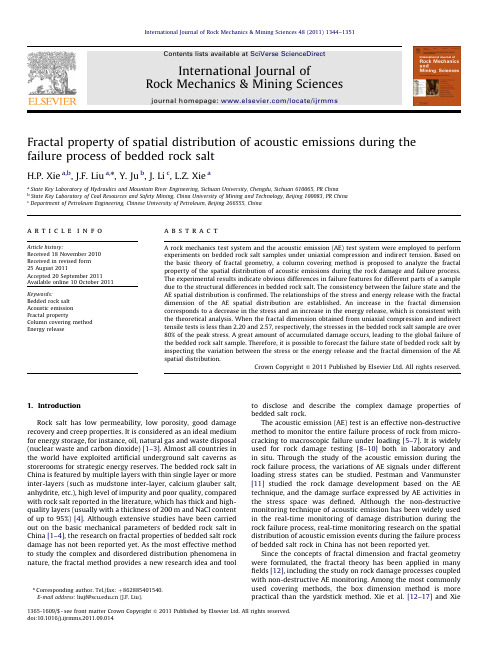
Fractal property of spatial distribution of acoustic emissions during thefailure process of bedded rock saltH.P.Xie a,b,J.F.Liu a,n,Y.Ju b,J.Li c,L.Z.Xie aa State Key Laboratory of Hydraulics and Mountain River Engineering,Sichuan University,Chengdu,Sichuan610065,PR Chinab State Key Laboratory of Coal Resources and Safety Mining,China University of Mining and Technology,Beijing100083,PR Chinac Department of Petroleum Engineering,Chinese University of Petroleum,Beijing266555,Chinaa r t i c l e i n f oArticle history:Received18November2010Received in revised form25August2011Accepted20September2011Available online10October2011Keywords:Bedded rock saltAcoustic emissionFractal propertyColumn covering methodEnergy releasea b s t r a c tA rock mechanics test system and the acoustic emission(AE)test system were employed to performexperiments on bedded rock salt samples under uniaxial compression and indirect tension.Based onthe basic theory of fractal geometry,a column covering method is proposed to analyze the fractalproperty of the spatial distribution of acoustic emissions during the rock damage and failure process.The experimental results indicate obvious differences in failure features for different parts of a sampledue to the structural differences in bedded rock salt.The consistency between the failure state and theAE spatial distribution is confirmed.The relationships of the stress and energy release with the fractaldimension of the AE spatial distribution are established.An increase in the fractal dimensioncorresponds to a decrease in the stress and an increase in the energy release,which is consistent withthe theoretical analysis.When the fractal dimension obtained from uniaxial compression and indirecttensile tests is less than2.20and2.57,respectively,the stresses in the bedded rock salt sample are over80%of the peak stress.A great amount of accumulated damage occurs,leading to the global failure ofthe bedded rock salt sample.Therefore,it is possible to forecast the failure state of bedded rock salt byinspecting the variation between the stress or the energy release and the fractal dimension of the AEspatial distribution.Crown Copyright&2011Published by Elsevier Ltd.All rights reserved.1.IntroductionRock salt has low permeability,low porosity,good damagerecovery and creep properties.It is considered as an ideal mediumfor energy storage,for instance,oil,natural gas and waste disposal(nuclear waste and carbon dioxide)[1–3].Almost all countries inthe world have exploited artificial underground salt caverns asstorerooms for strategic energy reserves.The bedded rock salt inChina is featured by multiple layers with thin single layer or moreinter-layers(such as mudstone inter-layer,calcium glauber salt,anhydrite,etc.),high level of impurity and poor quality,comparedwith rock salt reported in the literature,which has thick and high-quality layers(usually with a thickness of200m and NaCl contentof up to95%)[4].Although extensive studies have been carriedout on the basic mechanical parameters of bedded rock salt inChina[1–4],the research on fractal properties of bedded salt rockdamage has not been reported yet.As the most effective methodto study the complex and disordered distribution phenomena innature,the fractal method provides a new research idea and toolto disclose and describe the complex damage properties ofbedded salt rock.The acoustic emission(AE)test is an effective non-destructivemethod to monitor the entire failure process of rock from micro-cracking to macroscopic failure under loading[5–7].It is widelyused for rock damage testing[8–10]both in laboratory andin situ.Through the study of the acoustic emission during therock failure process,the variations of AE signals under differentloading stress states can be studied.Pestman and Vanmunster[11]studied the rock damage development based on the AEtechnique,and the damage surface expressed by AE activities inthe stress space was defined.Although the non-destructivemonitoring technique of acoustic emission has been widely usedin the real-time monitoring of damage distribution during therock failure process,real-time monitoring research on the spatialdistribution of acoustic emission events during the failure processof bedded salt rock in China has not been reported yet.Since the concepts of fractal dimension and fractal geometrywere formulated,the fractal theory has been applied in manyfields[12],including the study on rock damage processes coupledwith non-destructive AE monitoring.Among the most commonlyused covering methods,the box dimension method is morepractical than the yardstick method.Xie et al.[12–17]and XieContents lists available at SciVerse ScienceDirectjournal homepage:/locate/ijrmmsInternational Journal ofRock Mechanics&Mining Sciences1365-1609/$-see front matter Crown Copyright&2011Published by Elsevier Ltd.All rights reserved.doi:10.1016/j.ijrmms.2011.09.014n Corresponding author.Tel./fax:þ862885401540.E-mail address:liujf@(J.F.Liu).International Journal of Rock Mechanics&Mining Sciences48(2011)1344–1351and Zhou[18]presented the projective covering method via the study on the fractal properties of rough rock surfaces,which has made the fractal study more convenient and visible.At present, fractal studies using the covering method mostly focus on the rock rough surface and the rock mass fracture network[19–20]. Xie[21–22]and Xie and Pariseau[23]confirmed that the spatial distribution of mining-induced micro-seismic events is fractal using the fractal number–radius relationship and explained the the fractal and physical mechanisms of rock burst occurrence using the damage mechanics and the fractal geometry.Yuan and Li[24]investigated the damage distribution of granite,marble and sandstone by the cubic stacking covering method,and concluded that the fractal dimension decreases with increasing loading stress.Based on the basic theory of fractal geometry and experiment results,a fractal method,which can better describe the irregular and disordered properties of the spatial distribution of rock damage,is proposed in this paper.The non-destructive monitor-ing equipments were used for real-time monitoring of the spatial distribution of acoustic emissions during the failure process of bedded rock salt,and the effects of the presence of interlayers onthe monitoring of results is discussed,as well as the relationship between the failure characteristics of bedded salt rock and the spatial distribution of acoustic emissions.With the newly pro-posed fractal method,the relationship of the stress and the energy with the fractal dimension of spatial distribution of acoustic emissions during the failure process of bedded rock salt is obtained.The variation of fractal dimensions during the failure process is revealed along with the critical fractal dimension for prediction of the macroscopic failure of bedded rock salt.2.Experimental description2.1.Experiment setupUniaxial compression tests and indirect tensile tests were conducted on bedded rock salt specimens,using a rock mechanics test system(Model:MTS815Flex Test GT).For the uniaxial compression test,the capacity of the axial load transducer is 1000kN,and the ranges for axial extensometer and circle extens-ometer are74mm andÀ2.5toþ12.5mm,respectively.For the indirect tensile test,the capacity of the axial load transducer is 25kN,and the value of the linear variable differential transformer (LVDT)deformation may vary by about72.5mm.A three-dimensional real-time monitoring and display system (Model:PCI-2),manufactured by American Physical Acoustics Corporation was used to monitor the AE signals.The AE sensors are Mic30sensors with a central frequency of200kHz and a frequency range from20kHz to1MHz.The preamplifier gain is 40dB,and the threshold value is35dB.The system can capture and display the acoustic emissions during the whole rock damage and failure process.The AE monitoring results recorded the entire process from the appearance of micro-cracks to the macro failure of the specimen.2.2.Sampling and testing methodsThe test sample was taken from the gas storage caverns excavated in bedded rock salt in Jintan city of Jiangsu Province, east China.The sampling location was about1000$1200m below the ground surface.The main surrounding rock mass had a salt content up to84.76–93.76%.Specimens were prepared on a dry lathe,following the Standard for Test Method of Engineering Rock Mass(GB/T50266-99)[25].Four cylindrical specimens with a diameter of75mm were prepared for uniaxial compression tests.The specimen length was approximately twice the dia-meter.Nine disk specimens with a diameter of75mm were prepared for Brazilian splitting test with a thickness to diameter ratio of about0.5.The loading for the uniaxial compression test was controlled by the axial displacement rate,which was0.05mm/min before the peak load and then gradually increased to0.08,0.1,0.15and 0.2mm/min until the specimen fails.For the indirect tensile test, the loading was controlled by the axial LVDT displacement rate, which was0.05mm/min.As shown in Fig.1a,for the uniaxial compression tests,8Mic30 AE sensors were installed symmetrically in the radial direction along the cylinder surface and the distance from the sensor to the nearest end surface is about8mm.As shown in Fig.1b,for the indirect tensile testing,6Mic30AE sensors were placed on both sides of the possible tensile failure surface and the distance between the sensor and the circle edge is about2mm.The shadow area in Fig.1b is the location of possible failure plane under the indirect tensile test.2.3.Experiment resultsFigs.2a and3a show the stress–strain curves of the bedded rock salt specimens under uniaxial compression and indirect tensile tests,respectively.The numbers1–12in thefigures indicate different loading stages corresponding to Figs.2b–m or 3b–m.Figs.2b–j and3b–g show the spatial distribution of AE events in the specimen under a certain percentage of the peak stress,namely,20%,30%,40%,50%,60%,70%,80%,90%and100%, and20%,40%,60%,80%and100%,respectively.90%P,80%P,60%P, 40%P and20%P in Figs.2k–l and3h–l correspond to the ratio of the post-peak stress to the peak stress in the post peak failure process.Figs.2m and3m show the spatial distribution of AE events when the test was completed.Fig.4shows the failure patterns of the specimens under uniaxial compression and indir-ect tensile test.Fig.2b–m shows that,during the uniaxial compression test, the AE events occur near the specimen ends at the initial stage. With the increase of loading,micro-cracks start to appear inside the specimen.The cracks expand gradually to the center of the specimen and coalesce.It is also shown that the end effect was prominent in the uniaxial compression test.Fig.4a shows the failure pattern of a specimen under the uniaxial compression test. Influenced by the end effect,the rock salt above the black line, which has higher purity,exhibits a crushed pattern with a typical inverted cone shape.However,tensile failure occurs in the lower2143562mm2mm8mmyout of acoustic emission sensors.(a)Uniaxial compression test and (b)indirect tensile test.H.P.Xie et al./International Journal of Rock Mechanics&Mining Sciences48(2011)1344–13511345portion with low impurity.Correspondingly,more AE events take place in the upper part than in the lower part,as shown in Fig.2d–m.The AE distribution is relatively extensive in the upper portion,and the AE events concentrate along the tensile failure region in the lower portion.The rock salt failure pattern and the AE monitoring indicate that the structural differences in the bedded rock salt lead to the differences in different failure patterns and the spatial distributions of AE events for different parts in the same specimen.The AE properties of each stage under the indirect tensile test in Fig.3b–m reveal that the AE events first appear near the compressive stress zone and then gradually expand to the tensile stress plane with an increase in loading,finally leads to the formation of a failure surface along the tensile stress plane,which corresponds to the failure pattern shown in Fig.4b.Fig.2b–m and 3b–m show that the rock salt maintains a certain bearing capacity after the peak stress during the compres-sion and tensile tests,and more AE events take place in thepost-peak stage.This phenomenon is consistent with previous study results for Tula rock salt [6].3.Fractal dimension of AE spatial distribution 3.1.Calculation of fractal dimensionDuring the rock failure process,the spatial distribution of a set of points can illustrate the locations of acoustic emission events,and each point corresponds to a fracture surface or volume in the physical space.The previous studies [21–23]have shown that if the distribution center is assumed to be the base point that makes a circle or a sphere with a radius r ,then the number M (r )of AE points included in the circle or the sphere can be calculated.For different circles or spheres with different radii r i ,a set of corresponding data M (ri )can be calculated.If the distribution is a linear (one-dimensional)distribution,then M (r )p r ;if it is a0510*******0.20.40.60.81 1.2 1.4 1.6 1.82axial strain (%)1 (M P a )123456789101112Fig.2.Spatial distribution of AE events at different loading stages for uniaxial compression tests.(a)Stress-strain curves and corresponding loading stages for uniaxial compression tests,(b)20%,(c)30%,(d)40%,(e)50%,(f)60%(g)70%,(h)80%,(i)90%,(j)100%,(k)90%P,(l)80%P and (m)test completed.H.P.Xie et al./International Journal of Rock Mechanics &Mining Sciences 48(2011)1344–13511346surface (two-dimensional)distribution,then M (r )p r 2;and if it is a volume (three-dimensional)distribution,then M (r )p r 3.Based on the basic theory of fractals,the number–radius relationship for an AE distribution can be expressed by the following equation:M r ðÞ¼Cr D fð1Þwhere D f is the fractal dimension for the spatial distribution of AE events calculated by the circle covering method and the sphere covering method,and D f A [0,2]and D f A [0,3]for the above two covering methods,respectively;C is a constant.Taking logarithm on both sides of the equation,we have log M ðr Þ¼log C þD f log rð2ÞTherefore,Eq.(2)can be used to calculate the fractal dimen-sion D f for the AE distribution,corresponding to different stress levels during the rock failure process.3.2.Circle,sphere and cube covering methodsFor the fractal study of AE spatial distribution,the most commonly used methods are the circle covering method,the sphere covering method,the cube stacking covering method [24](see Fig.5).Obviously,the circle covering method can cover all the AE points projected on a plane,but it cannot reflect the three-dimensional properties of AE spatial distributions.The sphere covering method uses a certain point as the base (for example,the shape center)and the sphere diameter is gradually increased or decreased to cover the spatially-distribu-ted damage points.Although the sphere covering method can partially reflect the three-dimensional distribution properties of rock damage,it reflects only parts of the AE events and also fails to reflect the damage evolution properties within the sample.Furthermore,the cube stacking covering method or the sphere stacking covering method not only has thesame0.20.40.60.811.21.40.20.40.60.811.2LVDT / mm1 / M P a123567810111249Fig.3.Spatial distribution of AE events at different loading stages for indirect tensile tests.(a)Stress-strain curves and corresponding loading stages for indirect tensile tests,(b)20%,(c)40%,(d)60%,(e)80%,(f)90%,(g)100%,(h)90%P,(i)80%P,(j)60%P,(k)40%P,(l)20%P and (m)text completed.H.P.Xie et al./International Journal of Rock Mechanics &Mining Sciences 48(2011)1344–13511347defects,but also has the problem of complicated calculation and analysis process.In one word,the circle covering,sphere covering and cube covering fractal methods cannot correctly reflect the AE entity itself.In addition,they cannot fully reflect the spatial distribution properties of the damage in an object.The above mentioned fractal methods are incomplete covering measurements,leading to an error in the relationships between fractal measurements and scales.Therefore,based on the self-similar and self-affine properties of fractal geometry,in this paper,a column covering fractal method,which can give similar geometrical properties to those of the specimen under test,is proposed (see Fig.6).3.3.Column covering fractal methodThe column covering fractal method uses the center of the specimen as the base and the size of the covering column is then gradually increased or decreased to cover the specimen.Then,the fractal dimension of the spatial distribution of AE events iscalculated (see Fig.6).The column covering fractal method can not only contain all the AE points,but also fully reflect the spatial distribution of AE events recorded within a sample.Based on the fractal theory,if the AE points agree with the volume (three-dimensional)distribution,then for the sphere covering method M (r )p r 3,and the column covering method can be expressed as M (r )p r 2H ,where H is the height of the covering column,which is proportional to the height to diameter ratio of the sample when r changes,i.e.,H ¼C 1r (C 1is the height to diameter ratio).Thus,M (r )p r 2H can be expressed as M ðr Þp r 2H p C 1r 3p r 3ð3ÞTherefore,the fractal expression of the column covering method for the spatial distribution of AE can still be expressed by Eq.(1),and the corresponding fractal dimension can be calculated by Eq.(2).The analysis shows that the column covering method still agrees with the basic definition of fractals.According to the group theory,the fractal geometry mainly describes the invariance of continuous transformation groups and the symmetry of scale.Suppose that S i ði ¼1,2,ÁÁÁ,m Þis a non-overlapping subset of set S and that S i can be transformed by the transformation group G i [22]S i ¼G i Sð4Þwhere the transformation group G i is an n -dimensional constant matrix with the properties of translation,rotation,elongation,shear and similar transformation.If G i is only a similar transfor-mation group,thenG i ¼K 10ÁÁÁÁÁÁ00K 2ÁÁÁÁÁÁ0^ÁÁÁK 2ÁÁÁ0^ÁÁÁÁÁÁÁÁÁK n266664377775n Ânð5Þwhere K i ði ¼1,2,ÁÁÁ,n Þis constant.When K i ¼K j ¼r a 0,ði ,j ¼1,2,ÁÁÁ,n Þ,S is termed as the consistent self-similar set or the strict self-similar set.Eq.(6)is the expression for the non-overlapping subset S i S i ¼G i S þbð6ÞIf set S is composed of the non-overlapping subset S i obtained through Eq.(6)by the diagonal-affine transformation groups G i ,where G i is an m th order diagonal-affine transformation groupG i ¼a 110ÁÁÁÁÁÁ00a 22ÁÁÁÁÁÁ0^&^^ÁÁÁa kk ÁÁÁ0^&^^ÁÁÁÁÁÁÁÁÁa mm2666666666437777777775,Fig. 4.Failure patterns of rock salt specimens.(a)Photographs of specimens before and after uniaxial compression tests nd (b)Photographs of specimens before and after indirect tensiletests.Fig.5.The circle,sphere and cube covering fractal methods.(a)Circle covering method,(b)sphere covering method and (c)cube stacking covering method.Fig.6.The column covering fractal method.H.P.Xie et al./International Journal of Rock Mechanics &Mining Sciences 48(2011)1344–13511348where a kkðk¼1,2,ÁÁÁ,mÞis constant,and a ii a a jj.Hence,set S is a diagonal-affine set or affine set.According to the self-similarity and self-affine fractal geometry theory,if the height to diameter ratio of the covering column is equal to that of the specimen,the covering column has self-similar properties with respect to the specimen.If not,the covering column has self-affine properties with respect to the specimen.3.4.Relationship between fractal dimension and energyThe previous studies[21–23]have shown that rock bursts in mathematical terms are only a geometric process of fractal gathering.Long before rock burst events,micro-seismic events are almost evenly distributed in the high-stressfield,correspond-ing to a high fractal dimension.Close to the occurrence of rock burst,micro-seismic events quickly accumulate,corresponding to a lower fractal dimension.The rock damage processes shown in Figs.2and3demonstrate similar characteristics.The previous studies[21–23]indicated that a smaller fractal dimension,which corresponds to the occurrence of a main fracture,is linked to a higher amount of energy dissipation.The three-dimensional AE monitoring during the rock failure process in the laboratory was used to transform the micro-fracture distribution of rock to the spatial distribution of AE events.The monitoring signals include all of the microscopic fracturing information for which the AE amplitude A is not less than the value of A0,which is the threshold value.The energy of an AE transient signal can be obtained by the amplitude envelope after demodulation(Fig.7),and a greater amplitude A is linked to a longer duration and a larger amount of energy release E t.When the time is constant,the energy release E t is proportional to A2, i.e.,E t p A2.Therefore,the number of AE events reflects the degree of damage inside a specimen.A greater number of acoustic emission events is related to a higher degree of micro-fracturing within a specimen and a larger amount of energy release.The rock failure process under loading is an energy dissipation and release process.The energy per unit area or per unit volume of rock under different loading stages can be calculated by integration of the stress–strain curves;the energy for a certain area or volume of rock can be calculated by the energy ratio per unit area or volume by multiplying the corresponding area or volume.Therefore,the experimental stress–strain curves can be used to calculate the absorbed energy for each damage stage with the following expression:W¼Zs d eð7Þwhere W is the energy per unit volume;s is the stress,and e is thestrain.For the rock failure process,the number of AE events isproportional to the square of the loading stress,and it increasesproportionally with the work done by the external load.Theanalysis above and Eq.(7)giveW p s2,and W p E tð8ÞThus,the relationship between the energy release and thefractal dimension of the spatial distribution of AE can beexpressed indirectly by the work of external load on rock or therock bearing stress.4.Relationship between fractal dimension and mechanicalbehaviorsAccording to the experimental stress–strain curves and thespatial distribution of AE events during the failure process ofbedded rock salt,the corresponding stress and the total volu-metric strain energy W for the damage process were calculated at10%,20%,30%,40%,50%,60%,70%,80%,90%and100%of the peakstress,and the fractal dimension D f was calculated by the columncovering fractal method proposed in this paper.The curves of thestress and the energy W with the fractal dimension D f obtainedfor the uniaxial compression tests and the indirect tensile testsare shown in Figs.8and9,respectively.The relationships of the stress and energy with the fractaldimension in Figs.8and9show that,at initial loading stages,thefractal dimension is about3.With the increase of loading stress,the fractal dimension decreases,and the minimum value isobserved at the peak stress.Figs.2b–m and3b–m show that thedamage inside the rock is less at the initial stage and is almostuniformly distributed in the high-stress zone.With the increase ofdamage in rock salt specimen and gradual accumulation ofdamage along the failure plane,the fractal dimension decreasesgradually.When the stress reaches the peak stress,intensivedamage occurs within the specimen,corresponding to a smallerfractal dimension.The relationships of the fractal dimension with the energy inFigs.8b and9b show that the energy dissipation at the initialloading stage is low,corresponding to a larger fractal dimension,and the fractal dimension distribution is intensive.When theloading stress is close to the peak stress,the damage inside thespecimen occurs and accumulates intensively.The amount ofenergy dissipation is large,corresponding to the smaller fractaldimension,and the distribution of fractal dimension is sparse.Thecurve-fitting results in Figs.8and9show that the relation amplitudeAE durationrise timeenergyAE thresholdAFig.7.Curves of AE energy with amplitude.H.P.Xie et al./International Journal of Rock Mechanics&Mining Sciences48(2011)1344–13511349between the fractal dimension and the energy can be expressed by the uniform exponential function [21–23],i.e.,the work done by the external load on rock increases exponentially with decreasing fractal dimension during rock failure.The relation-ships of the energy and the fractal dimension for uniaxial compression testing and indirect tensile testing are given by Eqs.(9)and (10),respectively,and the expressions of the stress and the fractal dimension are given by Eqs.(11)and (12),respectively.D f ¼3:7609W À0:0583ð9ÞD f ¼3:7536W À0:0542ð10ÞD f ¼3:1643e À0:01699s 1ð11ÞD f ¼3:0593e À0:1137s tð12ÞUsing the relationship between the energy and the fractal dimension in Eqs.(9)and (10),the fractal dimension correspond-ing to each stage can be calculated for the failure process of bedded rock salt under uniaxial compression testing and indirect tensile testing.When the stress in the bedded rock salt for uniaxial compression test and indirect tensile test is over 80%of the peak stress,or even close to the peak stress,a coalescent failure plane is induced,leading to the global failure of the beddedrock salt.At the failure stage of specimens under uniaxial compression tests and indirect tension tests,the calculated fractal dimension values are in the ranges of 2.1–2.20and 2.43–2.57,respectively.Therefore,2.2and 2.57can be taken as the critical damage threshold to identify compression failure or tensile fail-ure,respectively.5.ConclusionsThe column covering fractal method is proposed in this paper.The experimental tests and the analysis on the failure process and the monitoring of spatial distribution of AE events in bedded rock salt specimens under uniaxial compression and indirect tension tests show that the different failure mode occurs in different parts within the same sample due to the structural differences in bedded rock salt.This study confirms that the failure state of bedded rock salt is consistent with the spatial distribution of AE events.The relationships between the energy release and fractal dimension are derived from the three-dimensional column cover-ing method.When the fractal dimensions are less than 2.20and 2.57for uniaxial compression and indirect tension,respectively,a large amount of accumulative damage occurs inside the bedded rock salt.When the loading stress is over 80%of the peak stress or close to the peak stress,a coalescent failure plane occurs,which leads to the global failure of bedded rock salt.Therefore,2.2and 2.57can be used as the critical thresholds for compression failure and tension failure of bedded rock salt,respectively.It is possible0.511.522.533.51 (MPa)F r a c t a l D i m e n s i o n (D f )W (×10-3 J)F r a c t a l D i m e n s i o n (D f )15000Fig.8.Relationships of fractal dimension with stress and energy for uniaxial compression tests.(a)Relationship between fractal dimension and stress and (b)relationship between fractal dimension and energy.11.522.533.54 t (MPa)F r a c t a l D i m e n s i o n (D f )11.522.533.54W (×10-3 J)F r a c t a l D i m e n s i o n (D f )Fig.9.Relationships of fractal dimension with stress and energy for indirect tensile tests.(a)Relationship between fractal dimension and stress and (b)relationship between fractal dimension and energy.H.P.Xie et al./International Journal of Rock Mechanics &Mining Sciences 48(2011)1344–13511350。

地下工程岩爆及其风险评估综述整理:snowsw(原创)上传:yeguiren 来源:水利工程网 2005-04-19 00:001.岩爆的数学描述在分析岩爆发生机制时,人们注意到,地下洞室岩爆是岩体由于几何及力的边界条件发生变化导致岩石材料力学性质发生改变,从而导致岩体突然失稳。
这种失稳是一种突变现象,它具有多个平衡位置、突跳、滞后、发散和不可达等特点。
应用现代数学中的突变理论可以对此过程进行较好的描述,例如初等突变理论中的尖点突变模型[10,11]。
尖点突变模型的标准势函数为[12]:(1)式中,为势函数,为状态变量,为控制变量。
令,可以确定其平衡位置,如下式。
(2)方程实根的数目由判别式决定。
根据突变理论,为稳定的平衡,为不稳定平衡,为两者间的转折点。
同时,在状态-控制变量空间中,曲面M: 称为平衡曲面,参数空间曲面B: 称为分叉集,如图1所示。
在平衡曲面的上、中、下三叶分别代表可能的三个平衡位置,其中上下叶为稳定平衡,中叶为不稳定平衡。
图1 尖点突变模型[12]用尖点突变模型可以对岩爆现象进行解释。
设为表征洞室稳定状态的变量,为影响洞室稳定性的变量,在图1中可以观察到不同的路径上洞室的稳定状态发生的变化。
路径始终处于上叶,在该路径上洞室一直处于稳定的平衡状态。
虽然该路径上洞室也有可能进入破坏状态,但这种破坏是一个连续的过程,如围岩较软,其单轴抗压强度较低,高地应力区的应力值超过了岩石的长期强度,洞室出现加速蠕变直至破坏的一种流变过程,而不是突然失稳。
路径开始处于稳定平衡的上叶,当到达上叶与中叶的皱折时,系统由稳定向非稳定过渡。
此时若围岩受到轻微的扰动,如爆破振动导致控制变量发生微小变化,路径继续往前时,洞室的状态不可能进入中叶,因为中叶是不稳定的亦即不可能达到的状态,洞室控制变量经过调整,其状态直接跳跃到下叶,发生岩爆,洞室失稳。
该路径下洞室的状态的不连续变化称之为突变。
由于岩爆与围岩的储存和释放的能量有关,因此一般从能量角度对洞室和围岩组成的系统进行定量分析。

2023/039(08):2330 2346ActaPetrologicaSinica 岩石学报doi:10.18654/1000 0569/2023.08.06曹根深,张宇,陈华勇.2023.造山型金矿床黄铁矿微量元素对成矿机制的指示.岩石学报,39(08):2330-2346,doi:10.18654/1000-0569/2023.08.06造山型金矿床黄铁矿微量元素对成矿机制的指示曹根深1,2,3 张宇3 陈华勇1,2,4CAOGenShen1,2,3,ZHANGYu3 andCHENHuaYong1,2,41 中国科学院广州地球化学研究所,中国科学院矿物学与成矿学重点实验室,广州 5106402 中国科学院大学地球与行星科学学院,北京 1000493 中南大学地球科学与信息物理学院,有色金属成矿预测与地质环境监测教育部重点实验室,长沙 4100834 广东省矿物物理与材料研究开发重点实验室,广州 5106401 KeyLaboratoryofMineralogyandMetallogeny,GuangzhouInstituteofGeochemistry,ChineseAcademyofSciences,Guangzhou510640,China2 CollegeofEarthandPlanetaryScience,UniversityofChineseAcademyofScience,Beijing100049,China3 MOEKeyLaboratoryofMetallogenicPredictionofNonferrousMetalsandGeologicalEnvironmentMonitoring,SchoolofGeoscienceandInfo physics,CentralSouthUniversity,Changsha410083,China4 GuangdongProvincialKeyLaboratoryofMineralPhysicsandMaterials,Guangzhou510640,China2022 09 11收稿,2023 05 05改回CaoGS,ZhangYandChenHY 2023 Traceelementsinpyritefromorogenicgolddeposits:Implicationsformetallogenicmechanism.ActaPetrologicaSinica,39(8):2330-2346,doi:10.18654/1000 0569/2023.08.06Abstract Pyrite,oneofthemostimportantsulfides,iswidelyspreadinvarioustypesofgolddeposits,anditstraceelementgeochemistryisextensivelyusefulforrevealingthephysicochemicalconditionsofore formingfluid,andthusconstrainingtheore formingprocessanddecipheringtheoregenesisofthegolddeposits,especiallytheorogenicones(themainproviderofglobalgoldresources) However,thisapplicationisonlylimitedtotheindividualdeposit,asaresult,traceelementdataofpyritefromorogenicgolddepositsarestilllackofacomprehensivestatisticalmeaning Thisstudycollectedthetraceelementdataofpyritesfrom67worldwideorogenicgolddepositspublished(4092datasets)torevealtheirphysicochemicalconditionsoftheore formingfluidsandmetallogeneticmechanismsbasedonstatisticalanalysis TheCo/Niratio(0 2~1 5)ofpyriteinorogenicgolddepositsimpliesthattheirfluidsareprimarilyfromthemetamorphicsources,whileminoritysampleshavelowerCu/ZrratiosandhigherNiandCrcontents,whichalsoprovidessupportforthesourceofmantle derivedfluids Calculatedbyseleniumconcentration,themainore formingtemperaturepeakisclosetoorevenhigherthan350℃inorogenicgolddeposits,whichisslightlydifferentfromthepreviousresearch,i e ,theaccuracyoftheSethermometermaybequestionablewhentheSecontentislower TheTecontent(0 320×10-6~7 07×10-6)andCu/Auratio(1 3~60 2)ofthepyritefromorogenicgolddepositsdemonstrateapossiblereducingenvironmentduringtheirmineralization Inaddition,theAs/SbandAg/Coratiosindicatethatfluidboilingmaybetheimportantcontrollerforgoldprecipitationoftheorogenicgolddeposits,whiletheSe/TeandSe/Geratiosimplicatethatmeteoricwatermixingalsoplaysanimportantroleinitsgoldprecipitation Furthermore,thehighporosityandweakcorrelationbetweenlow melting pointchalcophileelementsandgoldinpyritefromorogenicgolddepositshaveproventhatdissolution reprecipitationreactionsweresignificantfortheremobilizationandupgradingofinvisiblegold Theresultsofpyritetraceelementanalysisindicatethatthemineralizationmechanismoforogenicgolddepositsiscomplex,andthefluidsourcesarediverse ThisdiscoveryisindicativeforthemineralexplorationoftheorogenicgolddepositsKeywords Orogenicgolddeposit;Pyrite;Traceelement;Precipitationmechanism;Bigdatastatistics;Geochemicaldatabase本文受国家重点研发计划项目(2022YFC2903601)、湖南省科技创新计划项目(2021RC4055)和广东省科技计划项目(2020B1212060055)联合资助第一作者简介:曹根深,男,2000年生,博士生,矿物学、岩石学、矿床学专业,E mail:caogenshen22@mails ucas ac cn通讯作者:张宇,男,1985年生,副教授、博士生导师,主要从事热液矿床成因机制及蚀变矿物勘查应用的综合研究,E mail:zyu2005@csu edu cn,zyu2009@qq comCopyright©博看网. All Rights Reserved.摘 要 黄铁矿作为重要的金属硫化物,在各类金矿床中广泛产出,其微量元素特征被广泛应用于成矿流体物理化学性质的反演、成矿过程和矿床成因的限定。

精 密 成 形 工 程第16卷 第3期 44JOURNAL OF NETSHAPE FORMING ENGINEERING 2024年3月收稿日期:2024-01-15 Received :2024-01-15基金项目:国家重点研发计划(2022YFB3706903);国家自然科学基金(52090043)Fund :National Key R&D Program of China (2022YFB3706903); The National Natural Science Foundation of China (52090043) 引文格式:孔德瑜, 晏洋, 张浩, 等. 基于GA-BP 神经网络晶粒尺寸预测模型的轮端轮毂锻造工艺优化[J]. 精密成形工程, 2024, 16(3): 44-51.KONG Deyu, YAN Yang, ZHANG Hao, et al. Optimization of Wheel End Hub Forging Process Based on GA-BP Neural Network Grain Size Prediction Model[J]. Journal of Netshape Forming Engineering, 2024, 16(3): 44-51. *通信作者(Corresponding author )基于GA-BP 神经网络晶粒尺寸预测模型的轮端轮毂锻造工艺优化孔德瑜1,晏洋2,张浩1,邓磊1*,王新云1,龚攀1,张茂1(1.华中科技大学 材料成形与模具技术全国重点实验室,武汉 430074;2.湖北三环锻造有限公司,湖北 襄阳 441700)摘要:目的 针对6082铝合金轮端轮毂在热处理过程中出现的粗晶问题,利用基于遗传算法优化的BP 神经网络晶粒尺寸预测模型模拟优化锻造工艺方案,避免产生粗晶。
方法 以遗传算法替代梯度下降法优化神经网络各节点的权值和阈值,建立高精度的GA-BP 神经网络晶粒尺寸预测模型,再以轮端轮毂为对象,设计锻造工艺方案并利用Deform 进行微观组织仿真,研究压下速率、坯料初始温度对晶粒尺寸的影响,获得最优方案。

深部开采高地应力区钻孔卸压数值模拟及应用田莉梅;张英;张景华【摘要】In order to prevent the rock burst disaster caused by the high in-situ stress during the deep mining in Sans-handao Gold Mine,the destressing boreholes scheme is designed to decrease the influence of horizontal stress on surrounding rock. The numerical model of boreholes destressing in high in-situ stress zone is established based on FLAC3D software,to ana-lyze the variation characteristics of stress and elastic strain energy of the surrounding rock of the stope during the process of de-stressing. The results show that the vertical and horizontal maximum stress of the surrounding rock of the roadway are trans-ferred effectively after boreholes destressing,so,the stress of the roof and two sides of the roadway are lowered significantly,the whole deformation of surrounding rock is less,which indicated that the boreholes destressing is good to ease the rock burst dis-aster. The monitoring results of the surrounding rock stress monitoring system in the field show that with the development of de-stressing boreholes,the surrounding rock stress is lowered significantly,which further indicated that the destressing effects of the boreholes destressing scheme is good,and the stability of surrounding rock is improved effectively.%为防治三山岛金矿深部开采高应力作用下诱发的岩爆灾害,设计卸压钻孔方案减小水平地应力对围岩的影响.运用FLAC3D建立深部高应力巷道钻孔卸压的数值模型,分析了巷道钻孔卸压过程中采场周围岩体的应力和弹性应变能的变化.结果显示:钻孔卸压后,巷道水平和垂直方向最大应力有效转移,使巷道顶板和两帮应力均有显著下降,巷道围岩整体变形量减小,对缓解岩爆等地压灾害具有明显效果.现场布设的围岩应力监测系统显示,随着卸压钻孔的推进,围岩应力明显减小,证实钻孔卸压方案达到了卸压效果,提高了围岩稳定性.【期刊名称】《金属矿山》【年(卷),期】2017(000)004【总页数】5页(P31-35)【关键词】深部开采;数值模拟;钻孔卸压;应力转移【作者】田莉梅;张英;张景华【作者单位】廊坊师范学院建筑工程学院,河北廊坊065000;北京科技大学土木与资源工程学院,北京100083;中国石油天然气管道工程有限公司,河北廊坊065000【正文语种】中文【中图分类】TD322随着经济的快速发展,全球对矿产资源的需求也在增长。

文章编号:1009-4539(2020)11-0014-05•科技研究・基于岩体结构的岩爆预测方法研究闫苏涛王青蕊(中铁十七局集团有限公司山西太原030006)摘要:岩爆是在高地应力条件下隧道开挖过程中围岩卸荷而发生脆性破坏并产生爆裂、弹射、坍塌等现象的地质灾害。
现阶段隧道工程中岩爆预测方法很多,但基本都是基于强度应力比法,即用地应力和岩石单轴抗压强度两个基本参数来预测岩爆,没有考虑岩体的结构特点和施工扰动,预测结果与实际情况相差较大,不能指导现场。
本文以拉林铁路岗木拉山隧道为依托,统计了现场岩爆发生特征,总结了岩爆发生规律,在此基础上采用Hoek-Brown 理论对岩石强度进行了折减,充分考虑了结构面的彩响,并根据已发生岩爆段落绘制了岩爆预测模型,通过对比分析,考虑结构面的岩爆预测结果和实际岩爆发生强度较吻合,可为类似工程提供参考。
关键词:隧道岩爆岩体结构预测方法中图分类号:TU45;U456文献标识码:A DOI:10.3969/j.issn.1009-4539.2020.11.004Study on Rock Burst Prediction Method Based on Rock Mass StructureYAN Sutao,WANG Qingrui(China Railway17lh Bureau Group Co.Ltd.,Taiyuan Shanxi030006,China)Abstract:Rock burst is a geological disaster that causes brittle failure due to unloading of surrounding rocks during tunnel excavation under high ground stress conditions,resulting in bursts,ejections,and collapses.There are many methods to predict rock burst in tunnel engineering at present,but it is basically based on the strength-to-stress ratio method,that is,ground stress and rock uniaxial compressive strength are two basic parameters to predict rock burst.The structural characteristics of rock mass and construction disturbance are not considered,the predicted result is quite different from the actual situation,unable to guide the construction site.This paper is based on Gangmulashan Tunnel of Lalin Railway.The occurrence characteristics of rock burst are counted and the occurrence law of rock burst is summarized.On this basis,the strength of the rock is reduced by the Hoek-Brown theory,the influence of structural plane is fully considered,the prediction model of rock burst is drawn according to the rock burst section.Through comparative analysis,the predicted results are in good agreement with the actual rock burst intensity when considering the structural plane.It can provide reference for similar projects.Key words:tunnel;rock burst;rock mass structure;prediction method1刖旨现阶段岩爆预测方法有很多,Russenes采用隧道围岩最大切向应力和岩石单轴抗压强度之比来预测岩爆⑴;Turchaninov采用隧道围岩最大切向应力和隧道围岩轴向应力之和与岩石单轴抗压强度收稿日期:2020-08-07基金项目:中国铁建股份有限公司科技研发计划项目(17-C13)作者简介:闫苏涛(1985-),男,河北邢台人,工程师,主要从事隧道及岩土方向研究;E-mail:446318393@ 之比来预测岩爆凶;侯发亮提出了岩爆发生的临界深度,即岩爆临界埋深预测法⑶;陶振宇总结了前人研究成果,并结合实际工程案例,采用隧道区域原岩最大主应力和岩石单轴抗压强度之比来预测岩爆⑷;关于能量判据法相关研究也很多,但还没有统一的认识[5-6I o现阶段岩爆预测问题很多,和施工现场偏离较远,不能指导施工,分析原因主要是对现场不够重视,岩爆机理研究过于理论化,和现场实际发生有差异。
大庆石油地质与开发Petroleum Geology & Oilfield Development in Daqing2023 年 8 月第 42 卷第 4 期Aug. ,2023Vol. 42 No. 4DOI :10.19597/J.ISSN.1000-3754.202208009碳酸盐岩储层裂缝智能预测技术及其应用杨丽娜1 许胜利1 魏莉1 史长林1 张雨1 杨勇2(1.中海油能源发展股份有限公司工程技术分公司,天津300452;2.中海石油(中国)有限公司深圳分公司,广东 深圳518000)摘要: 对不同地震属性裂缝预测体的信息融合是目前碳酸盐岩储层裂缝预测的重难点之一。
针对现有信息融合技术中存在的权重系数随机性强、效率低、耗时长、裂缝预测精度不理想等问题,利用机器学习多属性融合方法,基于神经网络系统的单井裂缝解释和多种地震方法的多尺度裂缝预测,得到机器学习融合的训练样本数据集,通过数据编码及结构化处理、标签数据提取及样本集划分和机器学习算法优选等,建立裂缝预测数据驱动模型,对碳酸盐岩储层裂缝智能预测技术进行研究。
通过上述方法,得到一个多信息融合的智能裂缝预测强度体,该体能够反映不同尺度裂缝在三维空间的发育强度,反映裂缝各向异性。
将技术方法应用至南海流花11‑1油田表明,基于机器学习的多属性裂缝融合方法不仅提高工作效率,且有效提高裂缝预测精度,很好地反映裂缝的各向异性,与生产动态特征符合率达90%。
研究结果为基于机器学习的高效、高精度多属性裂缝融合预测提供了技术支撑。
关键词:碳酸盐岩储层;机器学习;多属性融合;裂缝智能预测;单井裂缝解释中图分类号:P618 文献标识码:A 文章编号:1000-3754(2023)04-0131-08Intelligent prediction technique and its application for carbonatereservoir fracturesYANG Lina 1,XU Shengli 1,WEI Li 1,SHI Changlin 1,ZHANG Yu 1,YANG Yong 2(1.Drilling & Production Company of CNOOC Energy Technology & Services Ltd ,Tianjin 300452,China ;2.Shenzhen Branch of CNOOC (China )Ltd ,Shenzhen 518000,China )Abstract :Information fusion of fracture prediction bodies with different seismic attributes is one of the major diffi‑culties in current carbonate rock reservoir fracture prediction. In view of the problems existing in present informa‑tion fusion techniques , such as strong randomness of weight coefficient , low efficiency , long time consumption , and not satisfactory accuracy of fracture prediction , by using machine learning multi -attributes fusion method , training samples data set of machine learning fusion is obtained based on single -well fracture interpretation of neu‑ral network system and multi -scales fracture prediction with multiple seismic methods. Through data coding and structural processing , label data extraction , sample set division and machine learning algorithm optimization , datadriven model for fracture prediction is established to study intelligent prediction technique for carbonate rock reser‑voir fractures.Through the above method, a multi information fusion intelligent fracture prediction strength volume is收稿日期:2022-08-03 改回日期:2023-04-18基金项目:中国海洋石油集团有限公司科技攻关项目“双重介质碳酸盐岩油藏调驱/堵控水技术研究与应用”(CNOOC -KJ135KJXM NFGJ2019-05);中国海洋石油集团有限公司科技攻关项目“基于深度机器学习的油气储层预测技术”(CNOOC -KJ 135KJXM NFGJ2019-06)。
岩爆的预测及治理方法概述摘要:岩爆是一种世界性的地质灾害,极大地威胁着施工人员和设备的安全。
本文对岩爆的成因条件进行了简单的说明,并对岩爆烈度进行了分级。
结合某地铁地下工程实例,提出岩爆预测及治理的方法。
为以后工程中预测和治理岩爆提供理论依据。
关键词:岩爆;成因;预测;防治Abstract:The rock burst is a sort of worldwide geological disasters that greatly threatens the safety of construction personnel and equipment. The paper describesthe cause of the rock burst conditions simply and classifies the intensity of rock burst.Based on one metro underground engineering,it describes the concept and methods for the prediction rock burst. Some methods of counter measures also are provided. Besides,this paper provides a theoretical basis for rock burst in the future engineering prediction and counter measure.Key Words:rock burst;cause;prediction;counter measure岩爆作为一种特殊现象产生于地下工程中的。
在地下工程开挖过程中,围岩有时突然释放能量,造成岩石脆性破坏或将尺寸大小不等的岩石喷射出来[1]。
地下工程开挖中的岩爆会造成了不同程度的危害,包括对施工进度的影响,对支护、设备的损坏和对人身安全的威胁等。
基于岩石应力应变过程曲线的岩爆能量指数法邓林;武君;吕燕【摘要】针对岩爆的发生伴随着能量转移的特点,分析岩石在变形和破坏过程中能量变化后,提出基于岩石单轴压缩应力应变全过程曲线的岩爆能量指数法进行岩爆预测.采用泥巴山隧道流纹岩进行试验,将这种新的预测方法与现有的岩爆能量法预测指标进行对比分析,结合泥巴山隧道开挖过程中岩爆发生的实录资料分析,得出该方法可以较好地预测岩爆,并给出了这种新指标的初步建议.%Aiming at the characteristics of energy transfer when rock burst, the paper not only analyzes the energy change in deformation process and damaging process but also the energy index method for rock burst prediction based on uniaxial compression stress-strain process curve. Through the experiment with the rhyolite of Niba Mountain Tunnel, the rock burst prediction indexes of the new prediction method and the existing energy method are compared and analyzed. Combined with the analysis on rock burst record during the excavation in Niba Mountain Tunnel, the conclusion is drawn that this method can well predict the rock burst. Then the preliminary proposals of the new index are given in the paper.【期刊名称】《铁道标准设计》【年(卷),期】2012(000)007【总页数】4页(P108-111)【关键词】应力应变;岩爆;能量法;能量指数法【作者】邓林;武君;吕燕【作者单位】四川建筑职业技术学院,四川德阳618000;中铁工程设计咨询集团有限公司,北京 100055;四川建筑职业技术学院,四川德阳618000【正文语种】中文【中图分类】TD313岩爆的机理可以概括为处在一定应力环境中的硬脆性岩石,在外力扰动下使得围岩中积聚的应变能大于克服岩体破坏吸收的能量后使岩石突然以张拉或剪切破坏或张剪复合破坏的形式脱离母岩的一种动力破坏[1-3]。