2015美赛建模培训(一)
- 格式:pptx
- 大小:281.30 KB
- 文档页数:51
2015数学建模美赛试题编辑整理:尊敬的读者朋友们:这里是精品文档编辑中心,本文档内容是由我和我的同事精心编辑整理后发布的,发布之前我们对文中内容进行仔细校对,但是难免会有疏漏的地方,但是任然希望(2015数学建模美赛试题)的内容能够给您的工作和学习带来便利。
同时也真诚的希望收到您的建议和反馈,这将是我们进步的源泉,前进的动力。
本文可编辑可修改,如果觉得对您有帮助请收藏以便随时查阅,最后祝您生活愉快业绩进步,以下为2015数学建模美赛试题的全部内容。
地球资源的消耗速度快,越来越多的人关注人类社会的未来.自1960年以来,已经有许多专家研究可持续发展.然而大多数人的研究对象是整个世界,一个国家或一个地区。
几乎没有人选择48个最不发达国家(LDC)在联合国为研究对象列表。
然而,LDC国家集团共享许多相同的点。
他们的发展道路也有法律的内涵。
本文选择这些国家为研究对象针对发现常规的可持续发展道路。
本文组织如下.第二部分介绍研究的背景和本研究的意义。
第三节描述了我们对可持续发展的理解细节和显示我们的评估系统的建立过程和原理,那么我们估计每一个国家的LDC和获得可持续发展的能力和等级。
第四节提供了一个最糟糕的国家毛里塔尼亚计划指数在第三节。
第五节演示了在第四节的合理性和可用性计划。
最后在第六节总结本文的主要结论和讨论的力量和潜在的弱点。
地球上的资源是有限的。
三大能源石油、天然气和煤炭可再生。
如何避免人类的发展了资源枯竭和实现可持续发展目标是现在的一个热门话题.在过去的两个世纪,发达国家已经路上,先污染,再控制和达到高水平的可持续发展。
发展中国家希望发展和丰富。
然而,因为他们的技术力量和低水平的经济基础薄弱,浪费和低效率的发展在这些国家是正常的.所以本文主要关注如何帮助发展中国家特别是48在联合国最不发达国家实现可持续发展是列表可持续发展的理解是解决问题的关键.可持续发展的定义经历了一个长期发展的过程.在这里,布伦特兰可持续发展委员会的简短定义的"能力发展可持续- — - — - -以确保它既满足现代人的需求又不损害未来的能力代来满足自己的需求"[1]无疑是最被广泛接受的一个在各种内吗定义.这个定义方面发挥了重要作用在很多国家的政策制定的过程.然而,为了证明一个国家的现状是否可持续不可持续的,更具体的定义是必要的更具体的概念,我们认为,如果一个国家的发展是可持续的,它应该有一个基本的目前的发展水平,一个平衡的国家结构和一个光明的未来。


PROBLEM A: Eradicating(根除)EbolaThe world medical association has announced that their new medication could stop Ebola and cure patients whose disease is not advanced(晚期的). Build a realistic, sensible, and useful model that considers not only the spread of the disease, the quantity of the medicine needed, possible feasible (可行的)delivery systems, locations of delivery, speed of manufacturing of the vaccine or drug, but also any other critical factors your team considers necessary as part of the model to optimize the eradication of Ebola, or at least its current strain(压力). In addition to your modeling approach for the contest, prepare a 1-2 page non-technical letter for the world medical association to use in their announcement.PROBLEM B: Searching for a lost planeRecall the lost Malaysian flight MH370. Build a generic(一般的)mathematical model that could assist "searchers" in planning a useful search for a lost plane feared to(恐怕) have crashed in open water such as the Atlantic, Pacific, Indian, Southern, or Arctic Ocean while flying from Point A to Point B. Assume that there are no signals from the downed (坠落的) plane. Your model should recognize that there are many different types of planes for which we might be searching and that there are many different types of search planes, often using different electronics or sensors. Additionally, prepare a 1-2 page non-technical paper for the airlines to use in their press conferences concerning their plan for future searches.。
比赛时间:美国东部时间:2015年2月5日(星期四)下午8点-2月9日下午8点(共4天)北京时间:2015年2月6日(星期五)上午9点-2月10日上午9点农历:十二月十八~十二月廿二重要说明:●COMAP是所有的规则和政策的最后仲裁者,对不遵循竞赛规则和程序的任何队伍,拥有唯一的自由裁量权,取消参赛资格或拒绝登记。
●评委、竞赛组织者、以及UMAP杂志的编辑拥有最终裁定权。
●如果参赛队伍违反竞赛规则,其指导老师一年内将不能指导其他团队,其所在参赛单位将被处以一年的察看处理。
●如果同一机构第二次被抓到违反规则的队伍,该学校将至少不被允许参加下一年度的赛事。
●以下所有时间都是美国东部时间EST(北京时间比美国东部时间早13个小时)●递交参赛论文后,意味参赛者同意以下条款:⏹论文提交后,出版权归COMAP, Inc所有;⏹COMAP可以使用,编辑,引用和出版论文,用于宣传或任何其他目的,包括在线展示,出版电子版,在UMAP杂志刊登或其他方式,并且没有任何形式的补偿;⏹COMAP可以在没有进一步的通知,许可,或补偿的情形下,使用这次比赛相关材料,团队成员、指导老师的名字,以及和他们的背景资料。
●递交参赛论文后,意味参赛者作出以下承诺:⏹论文中出现的所有的图像,数据,照片,图表,图画,如果未注明,都是由参赛者创建;如果引用其它资源,都在参考文献中列出,并在引用的具体位置标注来源。
⏹不论是直接,还是转述方式的文字引用,都在参考文献中列出,并在引用的具体位置标注来源;直接的文字引用使用引号标注。
比赛之前注册报名1.报名截至时间:2015年2月5日下午2:00 EST。
截止日期后,注册系统将自动关闭,不再接受任何新的注册,没有例外。
2.每支参赛队伍都必须有一位来自参赛机构(institute)的教师担任导师(faculty advisor),不允许学生担任导师。
由指导老师负责为其指导队伍注册报名,每位指导老师可注册的队伍数目没有限制。

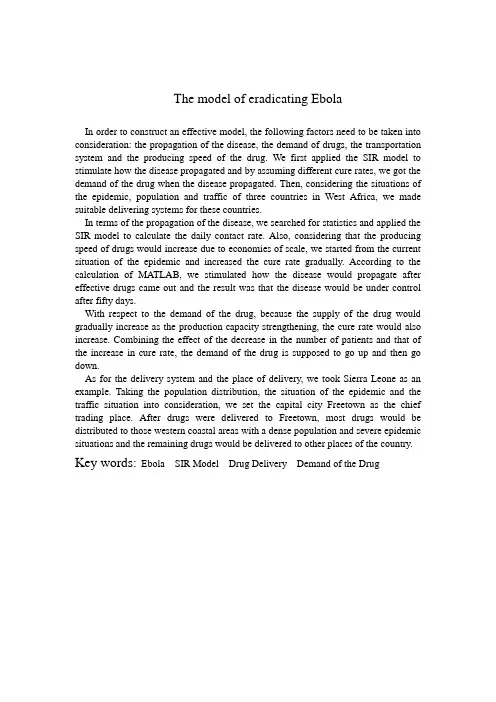
The model of eradicating EbolaIn order to construct an effective model, the following factors need to be taken into consideration: the propagation of the disease, the demand of drugs, the transportation system and the producing speed of the drug. We first applied the SIR model to stimulate how the disease propagated and by assuming different cure rates, we got the demand of the drug when the disease propagated. Then, considering the situations of the epidemic, population and traffic of three countries in West Africa, we made suitable delivering systems for these countries.In terms of the propagation of the disease, we searched for statistics and applied the SIR model to calculate the daily contact rate. Also, considering that the producing speed of drugs would increase due to economies of scale, we started from the current situation of the epidemic and increased the cure rate gradually. According to the calculation of MATLAB, we stimulated how the disease would propagate after effective drugs came out and the result was that the disease would be under control after fifty days.With respect to the demand of the drug, because the supply of the drug would gradually increase as the production capacity strengthening, the cure rate would also increase. Combining the effect of the decrease in the number of patients and that of the increase in cure rate, the demand of the drug is supposed to go up and then go down.As for the delivery system and the place of delivery, we took Sierra Leone as an example. Taking the population distribution, the situation of the epidemic and the traffic situation into consideration, we set the capital city Freetown as the chief trading place. After drugs were delivered to Freetown, most drugs would be distributed to those western coastal areas with a dense population and severe epidemic situations and the remaining drugs would be delivered to other places of the country. Key words:Ebola SIR Model Drug Delivery Demand of the DrugNon-technical LetterAccording to the statistics of WHO, the cumulative cases has been reaching 22460 in the three countries in west Africa (Guinea, Liberia, Sierra Leone) until February 1, 2015. And the death toll has been reaching 8968 people. The morbidity increases nearly a week. Although only a few countries and regions suffer the disease, the world medical association has developed a new medication could stop Ebola and cure patients whose disease is not advanced to response the serious disease.From March 21, 2014, Guinea, Liberia, Sierra Leone suffered from the disease one by one. Under the effective prevention interventions, the daily contact number of infected people has decreased. However the number of infected people is increasing.To optimize the eradication of Ebola, or at least its current strain, we estimate that the recovery rate every day will reach 0.2 from 0.05 considering the speed of manufacturing of the vaccine and the treatment level. The total quantity of the medicine needed is close to 35000. Under this speed of medicine supply and treatment, the disease will be controlled in 50 days.Focus on Sierra Leone for example, since the western area based on the capital Freetown is overcrowded and the disease of the western area is serious, the medicine provided by world medical association will be delivered in Freetown. Then the medicine will be allotted again based on population density and the condition of disease.In fact, the most effective way to prevent the further spread of Ebola is effective isolation of the infected people, reducing the probability that susceptible populations contact with patients. The transmission speed, the range, the strength of Ebola depend on quantities of the infected persons and susceptible persons, and effective contact between the two parts which could be affected by exposure level, pathogenic species, the quantity of excreted pathogens, resistance of the susceptible.Ebola virus is the most serious outbreak of the last 40 years, is a common challenge all the world as well. Currently, the fight situation against the epidemic is still very grim. As we all know, economic level and medical standard of the West African region is behindhand, the current state has overstepped their capabilities to fight with Ebola alone. We appeal to all countries for assisting the countries that are under the attack of Ebola, help them strengthen health systems and auxiliary infrastructure further.Contents:1. Introduction (1)1.1. Background (1)2. Model 1—Ebola Virus Propagation Model (1)2.1 Model Assumptions (1)2.2 Model Constitution (1)2.3 Numeric Calculation (2)2.4 Analysis of Phase Trajectory Figure (4)2.5 Conclusion (5)3. Model 2—Medicine Supply Model (6)3.1 The demand of medicine (6)3.2 Medicine Delivery System (7)3.2.1Drug distribution proportion (7)3.2.2Methods of the Medicine Delivery (7)4. Sensitivity Analysis and Improvements (8)4.1 Sensitivity Analysis (8)4.2 Improvements (8)5. Model Evaluation (9)5.1 strengths (9)5.2 weaknesses (9)6. Reference (9)1. Introduction1.1BackgroundWest Africa is hit by the most unprecedented outbreak of Ebola virus caused by the most lethal strain from Ebola virus family. The World Health Organization (WHO) declared it as an International Medical Emergency. As of 31st August 2014, the numbers of Ebola cases are 3685 with 1841 deaths reported from Liberia, Guinea, Senegal, Sierra Leona and Nigeria. WHO director general said that the actual numbers of cases are more than the reported cases.Guinea, Sierra Leone and Liberia are the poorest countries of the world with scruffy healthcare system. Even their hospitals lack the basic public health facilities and they are facing the terrible Ebola epidemic.2. Model 1—Ebola Virus Propagation ModelEbola virus is mainly spread through blood and excreta of patients, and we build our model according to its propagation mechanism. Once cured, Ebola virus patient has a strong immunity, so, the people who have recovered are neither healthy (susceptible) nor patient (infective), they have dropped out infected system. In this case, situation is much complicated, so the following will be a detailed analysis of the modeling progress.2.1 Model Assumptions:● The total number of population N is constant. We don ’t consider the born anddeath of people, and no migration of population, so people can be divided into three parts: the healthy, the infected and the removed recovered from Ebola disease. At time t , the proportion of three parts in the total population N were referred as s(t), i(t) and r(t).● The average number of a patient contacts per day is a constant effective λ, λ iscalled daily contact rate. When patients have effective contact with the healthy, it makes the healthy people infect and become patients.● The proportion of cured patients everyday in total number of patients is a constanteffective μ, μ is called daily cured rate. Patients cured and recovered from the disease will not infect Ebola again.● The contact number in the infectious period σ=λ/μ.2.2 Model ConstitutionAccording to assumption one, it is apparent that:s(t)+i(t)+r(t)=1 (1)According to assumption two and three, a patient can make λs(t) healthy people into patients per day, because the number of patients is Ni(t), so the number of infected healthy people is λN s(t)i(t), and λNsi is the increasing rate of patients, hence we have:Ni Nsi dtdi N μλ-= (2) As to the recovered and immune people, we haveNi dtdr Nμ= (3) We assume that at the beginning, proportion of the healthy and patients are s 0(s 0>0) and i 0(i 0>0) (we might as well define r 0=0), and according to equations (1), (2) and (3), we get the equation of SIR model: ()()⎪⎪⎩⎪⎪⎨⎧=-==-=000,0s s si dtds i i i si dt di λμλ, (4) The analytical solution of equation (4) can ’t be obtained, so we first make numerical calculation.2.3 Numeric CalculationIn order to work out the analytical solution of equation (4), we have to figure out precise value of each parameter. Firstly, we need to figure out the value of daily contact rate λ. We find some necessary data in WHO official website, which include the population of Ebola severest three countries: Guinea, Sierra Leone and Liberia is 21.6 million and the number of infected people every once in a while. So we can get the proportion of the healthy and the infected, the number of new infected per day and the daily contact rate in the table below:Table 1timeintervalproportion of health/% proportion of infection/% new infection per day Contact number/λ 00.9999963 0.0000037 0.0 — 130.99999338 0.00000662 4.8 0.0339 190.9999888 0.0000112 5.2 0.0215 620.99997227 0.00002773 5.8 0.0096 320.99993875 0.00006125 22.6 0.0171 110.99992079 0.00007921 35.3 0.0206 90.99990153 0.00009847 46.2 0.0217 70.99981741 0.00018259 127.4 0.0323 100.99972949 0.00027027 147.7 0.0253 90.99966866 0.00033134 146.0 0.0204 120.99954116 0.00045884 127.9 0.0129 90.99937315 0.00062685 436.6 0.0323 120.9993487 0.0006513 44.0 0.0031 70.99926384 0.00073616 150.9 0.0095 50.99920782 0.00079218 188.4 0.0110 60.99917093 0.00082907 132.8 0.0074 70.99904111 0.00095889 78.4 0.0038 70.99899588 0.00100412 61.1 0.0028 70.99897884 0.00102116 52.6 0.0024 7 0.99896019 0.00103981 57.6 0.0026According to the actual data, we can getλat different time periods. As it clearly shown in the table, when the Ebola just out-broke, we figure out thatλ=0.0339, and it obtained its maximum value. With time pasted, the value of λis becoming smaller and smaller, which indicates the patient contacted less people every day and less people were infected. This might because governments took some effective action to control and prevent the spread of the disease, the patients were separated from the healthy people. To simplify our model, we don’t take separation of patients into our consideration, and we ignore the condition that patients died of the virus. So, we determineλ=0.0339, because at the beginning of the virus out-broke, no external constrains obstruct the spread of the disease, it is an ideal environment for the virus, we takingλ=0.0339 will make our model more accurate.Then we have to determine values of other parameters. Ebola is a very dangerous virus and it has caused devastating destruction. So we assume that at the beginning, Ebola disease can’t be cured, no effective measures can be taken to control the virus. In this conditionμ=0, Ebola virus will spread at a high speed.Figure 2Combined with the actual situation, we assume that at different time, the value of λis changing. We make every five days as an interval, and redefine the value of λevery five days. In the first five days, the disease was just out-broken, people had less conscience of the seriousness, and they lacked necessary action to protect themselves. What’s more, at the beginning, no effective drugs to treat patient, and the supply of medicine was not sufficient, so we define the daily cured rate μ=0.05. The next five days, people gradually realized that in their country has broken out a dangerous disease, they improved the awareness to protect themselves, and avoided contacting with the patient, so at this timeμ=0.1. In the third five days, government put a lot of effort to control and prevent the disease, patients were separated from the public, a lot of effort was put to research the virus and produce effective drugs, soμ=0.15. In the twentieth day and after, the whole world paid much attention to this disease and gave a lot of assistance to Africa countries, the disease was under control, the supply ofmedicine was sufficient, so more patients were cured, so we define the value of daily cured rate is constantμ=0.2.We can get i0and s0 from Table 1: i0=0.00104, s0=0.99896. Then we use MATLAB to draw curves of i(t) and s(t).Table 3t 0 1 2 3 4 5 6i(t) 0.0010398 0.0010232 0.0010068 0.0009907 0.0009748 0.0009592 0.0008978 s(t) 0.9989602 0.9989253 0.9988909 0.9988571 0.9988238 0.9987911 0.9987596 t 7 8 9 10 11 12 13i(t) 0.0008403 0.0007866 0.0007362 0.0006891 0.0006135 0.0005463 0.0004864 s(t) 0.9987302 0.9987027 0.9986769 0.9986528 0.9986308 0.9986112 0.9985937 t 14 15 16 17 18 19 20i(t) 0.0004330 0.0003855 0.0003265 0.0002765 0.0002342 0.0001984 0.0001680 s(t) 0.9985782 0.9985643 0.9985523 0.9985421 0.9985335 0.9985262 0.9985200Figure 4s(t) i(t)From Figure 4 we can see that values of s(t) and i(t) change a little, s(t) changes from 0.99896 to 0.99849, and finally tends to a constant value. This means at last nobody was infected Ebola any more. This is conformed to real situation. After finding several people were died of Ebola virus, western Africa countries and WHO had paid highly attention to this problem. They took effective and instant action to control the spread of the disease. They separated the patient from the public and used the most advanced methods to treat the patient. In addition to this, these countries conducted a large investigation among suspicious people, making sure that the disease wouldn’t be infected in a large scale. Under these powerful action, Ebola virus didn’t spread, the number of infected people was increasing slowly, so the change of daily infected rateλis very small, Analogously, the change of i(t) is small because of the same reason. Finally, the value of i(t) equals to zero, which indicates that Ebola virus was wiped out. But this is the result of our model, it is an ideal situation, and now this situation has not happened.2.4 Analysis of Phase Trajectory FigureIn order to analyze the general variation of s(t) and i(t), we need to draw i~s relationship figure. This i~s figure is called phase trajectory figure.Based on the numeric calculation and observation of the figure, we can use phase trajectory line to analyze the character of s(t) and i(t).The s~i plane is called phase plane, the domain of definition of phase trajectory line in the phase plane (s, i) ∈D is:(){}1,0,0,≤+≥≥=i s i s i s DWe erasure dt in the equation (4), and noticing that σ=λ/μ, we can get00,11i i sds di s s =-==σ (5) We can easily figure out that the answer of equation (5) is:()000ln 1s s s i s i σ+-+= (6) In the domain of definition D, the line that equation (6) displays is phase trajectory line, we can get the changes of s(t), i(t) and r(t).● At any case, the patient will disappear at last, that is i ∞=0● The final proportion of the uninfected healthy people is s ∞, we define i=0 in theequation (6), so s ∞is the answer of equation0ln 100=+-+∞∞s s s i s σ ● If s 0<1/σ, i(t) is monotone decrease and finally drops to 0, s(t) is monotonedecrease to its minimum s ∞ .2.5 ConclusionAccording to our analysis and calculation, the number of patients is constantly decrease, and in the fiftieth day after the virus broke out, we figure out that the patients will drop to 24 people, compared with the beginning of the disease, the number of patients is more than 20000, so we can draw the conclusion that we havealready successfully controlled the disease, the virus didn’t spread in a large range. If we continue conducting some effective action, such as separating the patient, propagating the information about avoid the virus, Ebola disease will be completely wiped out in the next few weeks.3. Model 2—Medicine Supply Model3.1 The demand of medicineThe world medicine association has announced that their new medication could stop Ebola and cure patients whose disease is not advanced. That is to say, as long as the supply of medicine is sufficient, all the patients could be cured. Next step our goal is to figure out the demand of medicine every day.To solve this question, we assume that one unit medicine could cure one patient, and according to model one, we have calculated the number of patients and daily cured rate, so the quantity of daily demand medicine can be calculated. We define that daily needed quantity of medicine is Q.Q=N*s(t)*μThe result is shown in the Table 5 below.Figure 5The changes of medicine demand are shown in the figure 5.We can see that in the first four days, demands of medicine slightly declined. Because at the beginning, the effective medicine has been developed, and the daily cured rate was relatively low, the virus wasn’t wide spread, the number of infected people was small, so the demand wasn’t very high. However, in the next few days, the demand was abruptly increased, almost doubled the demand in the fourth day. With more people were infected the Ebola virus, they needed more medicine to treat their diseases. Another reason is that the daily cured rate increased, which means more medicine was used to mitigate patients’ symptom and pains. The next six days, the demand of medicine was showing a wavy change, because of the intervention of governments. They put more effort to control the virus in case it was spread in a large range, and more medicine was manufactured, hospitals tried their best to treat the Ebola patient. After the fifteenth day, the demand of medicine was constantly dropping, and finally dropped to nearzero, which indicates the virus was under control, more and more people were cured, and very few people were infected Ebola virus, and at last Ebola virus was wiped out, medicine was scarcely needed.3.2 Medicine Delivery System3.2.1Drug distribution proportionGood delivery system is based on the distribution of population, the condition of disease, the condition of traffic. There we take Sierra Leone for example. We find the data about the population of every province and the number of infected people. According to the initial data, we calculate the rate of infections, rate of population density. Combined with this two rates, we get the final drug distribution proportion. This table is the result about drug distribution proportion.Table 6district rate of infections rate of population density rate of medicine Northern Province 37.57% 13.27% 25.42% Eastern Province 16.30% 20.91% 18.61% Southern Province 6.89% 14.82% 10.85% Western Area 39.24% 51.01% 45.12% Rate of infections means the rate of infected people in every district to the total infected people in the country. Rate of population density means the population density in every district compared to the sum of population density. Rate of medicine equals to the average of rate of infections and rate of population density. That is the proportion of drug distribution.As we can see from the table, the western area where the capital is needs 45.12% of the drug. However, western area covers the area of less than 10% compare to the total land area. And the condition of disease is as follow:Figure 73.2.2Methods of the Medicine DeliveryBecause the railway and road system of Sierra Leone are defective and out-dated, the medicine was firstly delivered to the capital city Freetown, then by the air transportation delivering to other airports. Afterwards, the medicine was delivered tothe medical center in the Ebola serious area. The situation of airports in Sierra Leone is shown in the table below:4. Sensitivity Analysis and Improvements4.1 Sensitivity AnalysisModel one we use SIR model to simulate the development of Ebola virus, and through two variables λ(daily infected rate) and μ(daily cured rate) to describe the situation of the disease. We can figure out the number of healthy people and infected people every day, there are many factors affecting the changes of healthy and infected number. For the convenience of calculation, we ignore the death of patients, and assume the total population is constant, and the daily cured rate is defined by ourselves, and the disparity between real value and the calculated one may be obvious. What’s more, we assume the medicine is very effective, all of the patients take the medicine will be cured, and we don’t consider the time of treatment, these problems could make our model have some drawbacks and less accuracy.4.2 ImprovementsFor model one, according to analysis before, two measures can be taken to restrain the spread of the disease, one is improving health and medical level, in the other words is dropping the daily contact rate λand improving daily cured rate μ; the other method is herd immunity, that is improving the original rate of the removed r0. We can see that in the SIR model, σ=λ/μis a very important parameter. In reality, the value of λand μis difficult to estimate, but when an infectious disease is over,we can get the value of s 0 and s ∞, and we neglect the parameter i 0because of its small value, so we can have the result of σ:∞∞--=s s s s 00ln ln σ (7)We can use the change of σ to analyze the development of the disease instead of λ and μ.5. Model Evaluation5.1 Strengths● Model is simple and easy to understand, and we innovatively define the suspicious degree, making us to carry out a quantitative analysis of suspects.●Processes the data and make a variety of charts, simple and intuitive shortcuts●Model established in this paper and the actual closely, give full consideration to the different stages of the reality of the situation, so that the model is more realistic 5.2 Weaknesses● In order to make the calculation is simple in the model, so that the results obtained are more ideal, ignoring the minor factors.●For some data, we carried out a number of necessary treatment, which will bring some errors.6. Reference:[1]. Xuan Zhou, Junquan Song, Xuejun Wu. Introduction and Improvement of Mathematical Contest in Modeling [M]. Zhejiang:ZHEJIANG UNIVERSITY PRESS.2012.Page 201 to 205.[2]. Qiyuan Jiang, Jinxing Xie, Jun Ye. Mathematical Model [M].Beijing:HIGHER EDUCATION PRESS.2011.Page 136 to 145.[3]. Ebola Situation Report[DB/OL],http://apps.who.int/ebola/ [4]. Sierra Leone —Provinces anddistricts[EB/OL]./wp/s/Sierra Leone.htm[5].HongqingZhou,ZhuanXu. A Mathematical Model of Ebola Virus Infection Numbers [A].[6].Themap of Sierra Leone[Z/OL]./maps/HTML/49248.htmlAppendix: BasicMatlabprogram:>>function y=ill(t,x)a=0.0339;b=0.2;y=[a*x(1)*x(2)-b*x(1),-a*x(1)*x(2)]'; ts=0:100x0=[0.00103981,0.99896019];[t,x]=ode45('ill',ts,x0); [t,x]plot(t,x(:,1)),grid on;plot(t,x(:,2)),grid on;plot(x(:,1),(:,2)),grid on;Data recording:。
美国大学生数学建模竞赛赛前培训心得体会数学建模(Mathematical Modeding)是对现实世界的一个特定对象,为了一个特定目的,根据特有的内在规律,作出一些必要的简化假设,运用适当的数学工具,得到一个数学结构的过程[1].美国大学生数学建模竞赛(MCM/ICM),是一项国际级的竞赛项目,为现今各类数学建模竞赛之鼻祖。
MCM/ICM 是Mathematical Contest in Modeling 和InterdisciplinaryContest in Modeling 的缩写,即数学建模竞赛和交叉学科建模竞赛[2].MCM始于1985年,ICM始于2000年,由美国自然基金协会和美国数学应用协会共同主办,美国运筹学学会、工业与应用数学学会、数学学会等多家机构协办,比赛每年举办一次。
MCM/ICM着重强调研究问题、解决方案的原创性团队合作、交流以及结果的合理性。
竞赛形式为三名学生组成一队在四天内任选一题,完成该实际问题的数学建模的全过程,并就问题的重述、简化和假设及其合理性的论述、数学模型的建立和求解(及软件)、检验和改进、模型的优缺点及其可能的应用范围的自我评述等内容写出英文论文。
沈阳工业大学从2007年开始参加美国大学生数学建模竞赛,截至到2015年共参加了9届。
2015年共有16组美赛队伍,是我校参加美赛队伍最多一届。
前八届竞赛中,共获得一等奖 6 次,二等奖12 次,三等奖22 次。
2015 年获得一等奖2 组,二等奖3 组,三等奖6 组。
总结我校9 年来参加美国大学生数学建模竞赛的经验,笔者从美国大学生数学建模竞赛的赛前培训工作出发,总结几点心得体会,供同行们参考与讨论。
1 选拔优秀学生组队培训是美国大学生数学建模竞赛赛前培训的前提数学建模竞赛的主角是参赛队员,选拔参赛队员的成功与否直接影响到参赛成绩。
我们首先在参加全国大学生数学建模竞赛并获奖的同学中进行动员报名,经过一个阶段的培训后选拔出参加寒假集训队员,暑期集训结束后通过模拟最终确定参赛队员。
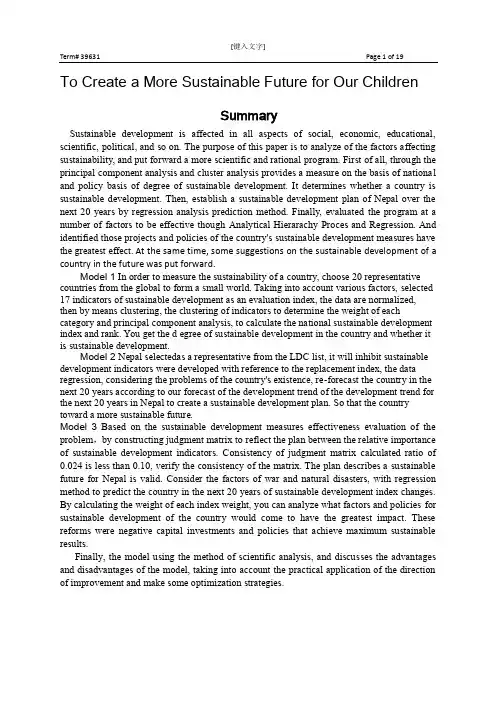
2015 Contest ProblemsMCM PROBLEMSPROBLEM A: Eradicating EbolaThe world medical association has announced that their new medication could stop Ebola and cure patients whose disease is not advanced. Build a realistic, sensible, and useful model that considers not only the spread of the disease, the quantity of the medicine needed, possible feasible delivery systems, locations of delivery, speed of manufacturing of the vaccine or drug, but also any other critical factors your team considers necessary as part of the model to optimize the eradication of Ebola, or at least its current strain. In addition to your modeling approach for the contest, prepare a 1-2 page non-technical letter for the world medical association to use in their announcement.PROBLEM B: Searching for a lost planeRecall the lost Malaysian flight MH370. Build a generic mathematical model that could assist "searchers" in planning a useful search for a lost plane feared to have crashed in open water such as the Atlantic, Pacific, Indian, Southern, or Arctic Ocean while flying from Point A to Point B. Assume that there are no signals from the downed plane. Your model should recognize that there are many different types of planes for which we might be searching and that there are many different types of search planes, often using different electronics or sensors. Additionally, prepare a 1-2 page non-technical paper for the airlines to use in their press conferences concerning their plan for future searches.ICM PROBLEMSPROBLEM C: Managing Human Capital in OrganizationsClick the title below to download a PDF of the 2015 ICM Problem C.Your ICM submission should consist of a 1 page Summary Sheet and your solution cannot exceed 20 pages for a maximum of 21 pages.Managing Human Capital in OrganizationsPROBLEM D: Is it sustainable?Click the title below to download a PDF of the 2015 ICM Problem D.Your ICM submission should consist of a 1 page Summary Sheet and your solution cannot exceed 20 pages for a maximum of 21 pages.Is it sustainable?。
2015年美国大学生数学建模竞赛校内培训时间安排
培训及模拟赛地点:HE103(数理学院机房)
注:(1) 2015年美国大学生数学建模竞赛(MCM)将于北京时间2015年2月6日到2015年2月10日举行;
(2)美赛模拟赛定于1月29日上午9点至2月1日上午9点;请各位认真对待模拟赛,特别是中间的过程;
(3)寒假住宿问题尽量和学校协商,若协调不好,须自行解决,故竞赛期间各位同学要考虑到这个问题,注意安全;
(4)学校共有18个公费名额,其余的自费,自费每人350元(630元报名费平摊到每人210元,加上4天的餐饮)。
自费名额的产生按照培训质量和模拟赛质量由教师组确定。
没有参加14年全国赛的同学和缺勤培训次数大于等于2次者原则上必须自费。
(5)一旦组队确认参赛,请各位同学必须遵守游戏规则,无故的中途离开带来的后果须自行承担。
数理学院建模竞赛工作小组
2014.11.12。