《统计学基础(英文版·第7版)》教学课件les7e_ppt_04_02 (1)
- 格式:pptx
- 大小:3.22 MB
- 文档页数:36


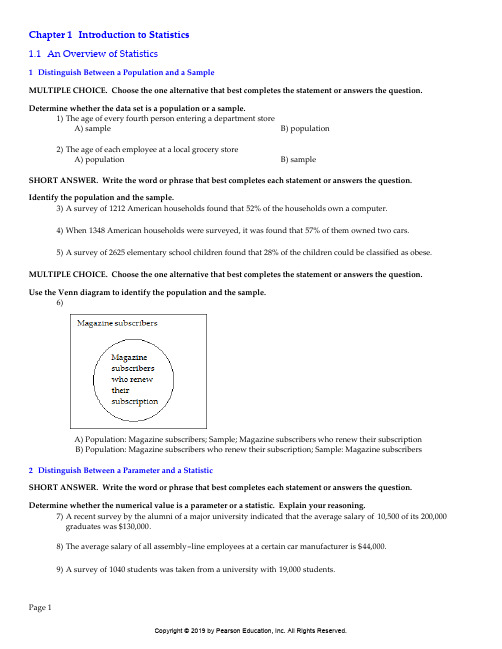
Chapter 1Introduction to Statistics1.1An Overview of Statistics1Distinguish Between a Population and a SampleMULTIPLE CHOICE. Choose the one alternative that best completes the statement or answers the question. Determine whether the data set is a population or a sample.1)The age of every fourth person entering a department storeA)sample B)population2)The age of each employee at a local grocery storeA)population B)sampleSHORT ANSWER. Write the word or phrase that best completes each statement or answers the question.Identify the population and the sample.3)A survey of 1212 American households found that 52% of the households own a computer.4)When 1348 American households were surveyed, it was found that 57% of them owned two cars.5)A survey of 2625 elementary school children found that 28% of the children could be classified as obese. MULTIPLE CHOICE. Choose the one alternative that best completes the statement or answers the question.Use the Venn diagram to identify the population and the sample.6)A)Population: Magazine subscribers; Sample; Magazine subscribers who renew their subscriptionB)Population: Magazine subscribers who renew their subscription; Sample: Magazine subscribers2Distinguish Between a Parameter and a StatisticSHORT ANSWER. Write the word or phrase that best completes each statement or answers the question. Determine whether the numerical value is a parameter or a statistic. Explain your reasoning.7)A recent survey by the alumni of a major university indicated that the average salary of 10,500 of its 200,000graduates was $130,000.8)The average salary of all assembly-line employees at a certain car manufacturer is $44,000.9)A survey of 1040 students was taken from a university with 19,000students.3Distinguish Between Descriptive Statistics and Inferential StatisticsMULTIPLE CHOICE. Choose the one alternative that best completes the statement or answers the question. Identify whether the statement describes inferential statistics or descriptive statistics.10)The average age of the students in a statistics class is 20years.A)descriptive statistics B)inferential statistics11)The chances of winning the California Lottery are one chance in twenty-two million.A)inferential statistics B)descriptive statistics12)There is a relationship between smoking cigarettes and getting emphysema.A)inferential statistics B)descriptive statistics13)From past figures, it is predicted that 31% of the registered voters in California will vote in the June primary.A)inferential statistics B)descriptive statistics14)Based on previous clients, a marriage counselor concludes that the majority of marriages that begin withcohabitation before marriage will result in divorce.A)inferential statistics B)descriptive statistics4ConceptsSHORT ANSWER. Write the word or phrase that best completes each statement or answers the question.Provide an appropriate response.15)Explain the difference between a sample and a population.16)If you had to do a statistical study, would you use a sample or a population? Why?1.2Data Classification1Distinguish Between Qualitative and Quantitative DataMULTIPLE CHOICE. Choose the one alternative that best completes the statement or answers the question. Determine whether the data are qualitative or quantitative.1)the colors of automobiles on a used car lotA)qualitative B)quantitative2) the number of complaint letters received by the United States Postal Service in a given dayA)quantitative B)qualitative3)the number of seats in a movie theaterA)quantitative B)qualitative4)the numbers on the shirts of a girlʹs soccer teamA)qualitative B)quantitative2Classify Data with Respect to the Four Levels of MeasurementMULTIPLE CHOICE. Choose the one alternative that best completes the statement or answers the question. Identify the data setʹs level of measurement.5)hair color of women on a high school tennis teamA)nominal B)ordinal C)interval D)ratio6)numbers on the shirts of a girlʹs soccer teamA)nominal B)ordinal C)interval D)ratio7)ages of students in a statistic classA)ratio B)ordinal C)interval D)nominal8)temperatures of 26 selected refrigeratorsA)interval B)ordinal C)nominal D)ratio9)number of milligrams of tar in 30 cigarettesA)ratio B)ordinal C)interval D)nominal10)number of pages in your statistics bookA)ratio B)ordinal C)interval D)nominal11)marriage status (married, single, or divorced) of the faculty at the University of ColoradoA)nominal B)ordinal C)interval D)ratio12)list of 1240 social security numbersA)nominal B)ordinal C)interval D)ratio13)the ratings of a movie ranging from ʺpoorʺ to ʺgoodʺ to ʺexcellentʺA)ordinal B)nominal C)interval D)ratio14)the final grades (A, B, C, D, and F) for students in a statistics classA)ordinal B)nominal C)interval D)ratio15)the annual salaries for all teachers in CaliforniaA)ratio B)ordinal C)interval D)nominal16)list of zip codes for ChicagoA)nominal B)ordinal C)interval D)ratio17)the nationalities listed in a recent survey (for example, Asian, European, or Hispanic).A)nominal B)ordinal C)interval D)ratio18)the amounts of fat (in grams) in 37 cookiesA)ratio B)ordinal C)interval D)nominal19)the years the summer Olympics were held in the United StatesA)interval B)ordinal C)nominal D)ratio20)numbers of touchdowns scored by a major university in five randomly selected games53134A)ratio B)ordinal C)interval D)nominal21)the average daily temperatures (in degrees Fahrenheit) on five randomly selected days2123213027A)interval B)nominal C)ordinal D)ratio22)manuscripts rated ʺacceptableʺ or ʺunacceptableʺA)ordinal B)nominal C)ratio D)interval23)the lengths (in minutes) of the top ten movies with respect to ticket sales in 2007A)ratio B)nominal C)ordinal D)interval24)the data listed on the horizontal axis in the graphA)nominal B)interval C)ordinal D)ratio25)the data listed on the horizontal axis in the graphA)ratio B)nominal C)ordinal D)interval3ConceptsSHORT ANSWER. Write the word or phrase that best completes each statement or answers the question.Provide an appropriate response.26)Explain the differences between the interval and ratio levels of measurement.27)Explain why data expressed with the Celsius temperature scale is at the interval level of measurement ratherthan the ratio level.1.3Data Collection and Experimental Design1Decide Whether Study is Observational Study or ExperimentMULTIPLE CHOICE. Choose the one alternative that best completes the statement or answers the question.Determine whether the study is an observational study or an experiment.1)A medical researcher obtains a sample of adults suffering from diabetes. She randomly assigns 89people to atreatment group and 89 to a placebo group. The treatment group receives a medication over a period of threemonths and the placebo group receives a placebo over the same time frame. At the end of three months thepatientsʹ symptoms are evaluated.A)experiment B)observational study2)A poll is conducted in which professional musicians are asked their ages.A)observational study B)experiment3)A pollster obtains a sample of students and asks them how they will vote on an upcoming referendum.A)observational study B)experiment4)The personnel director at a large company would like to determine whether the company cafeteria is widelyused by employees. She calls each employee and asks them whether they usually bring their own lunch, eat at the company cafeteria, or go out for lunch.A)observational study B)experiment5)A scientist was studying the effects of a new fertilizer on crop yield. She randomly assigned half of the plots ona farm to group one and the remaining plots to group two. On the plots in group one, the new fertilizer wasused for a year. On the plots in group two, the old fertilizer was used. At the end of the year the average cropyield for the plots in group one was compared with the average crop yield for the plots in group two.A)experiment B)observational study6)A researcher obtained a random sample of 100 smokers and a random sample of 100 nonsmokers. Afterinterviewing all 200 participants in the study, the researcher compared the rate of depression among thesmokers with the rate of depression among nonsmokers.A)observational study B)experimentSHORT ANSWER. Write the word or phrase that best completes each statement or answers the question.Identify the experimental units and treatments used in the experiment.7)A medical researcher center wants to test the effectiveness of a new diabetes medication. The companyidentifies 98 adults suffering from a similar form of diabetes. The subjects are randomly assigned to twogroups. One group is given a medication and the other is given a placebo that looks exactly like the medication.After three months, the subjectsʹ symptoms are studied and compared.2Identify a Biased SampleSHORT ANSWER. Write the word or phrase that best completes each statement or answers the question.Provide an appropriate response.8)Explain what bias there is in a study done entirely online.9)A report sponsored by the California Citrus Commission stated that cholesterol levels can be lowered bydrinking at least one glass of a citrus product each day. Determine if the report is biased.10)A local newspaper ran a survey by asking, ʺDo you support the deployment of a weapon that could killmillions of innocent people?ʺ Determine whether the survey question is biased.3Identify Sampling TechniquesMULTIPLE CHOICE. Choose the one alternative that best completes the statement or answers the question.Identify the sampling technique used.11)Thirty-five sophomores, 30 juniors and 33seniors are randomly selected from 281 sophomores, 242juniors and529 seniors at a certain high school.A)stratified B)random C)cluster D)convenience E)systematic12)Every fifth person boarding a plane is searched thoroughly.A)systematic B)random C)cluster D)convenience E)stratified13)At a local community college, five statistics classes are randomly selected out of 20 and all of the students fromeach class are interviewed.A)cluster B)random C)convenience D)systematic E)stratified14)A researcher randomly selects and interviews fifty male and fifty female teachers.A)stratified B)random C)cluster D)convenience E)systematic15)A researcher for an airline interviews all of the passengers on five randomly selected flights.A)cluster B)random C)convenience D)systematic E)stratified16)A community college student interviews everyone in a particular statistics class to determine the percentage ofstudents that own a car.A)convenience B)random C)cluster D)systematic E)stratified17)Based on 12,500 responses from 36,500questionnaires sent to its alumni, a major university estimated that theannual salary of its alumni was $116,000 per year.A)random B)stratified C)cluster D)convenience E)systematic18)In a recent television survey, participants were asked to answer ʺyesʺ or ʺnoʺ to the question ʺAre you in favorof the death penalty?ʺ Six thousand five hundred responded ʺyesʺ while 4700 responded ʺnoʺ. There was afifty-cent charge for the call.A)convenience B)random C)cluster D)stratified E)systematic19)A lobbyist for a major airspace firm assigns a number to each legislator and then uses a computer to randomlygenerate ten numbers. The lobbyist contacts the legislators corresponding to these numbers.A)random B)convenience C)cluster D)stratified E)systematic20)To ensure customer satisfaction, every 20th phone call received by customer service will be monitored.A)systematic B)random C)cluster D)stratified E)convenience21)A market researcher randomly selects 400 drivers under 45years of age and 100 drivers over 45years of age.A)stratified B)random C)cluster D)convenience E)systematic22)To avoid working late, the quality control manager inspects the last 60 items produced that day.A)convenience B)random C)cluster D)stratified E)systematic23)The names of 70 contestants are written on 70 cards. The cards are placed in a bag, and three names are pickedfrom the bag.A)random B)stratified C)cluster D)convenience E)systematic24)A researcher randomly selected 70 of the nationʹs middle schools and interviewed all of the teachers at eachschool.A)cluster B)random C)stratified D)convenience E)systematicSHORT ANSWER. Write the word or phrase that best completes each statement or answers the question.Provide an appropriate response.25)After a hurricane, a disaster area is divided into 200 equal grids. Thirty of the grids are selected and everyoccupied household in the grid is interviewed to help focus relief efforts. Select the numbers of the first fivegrids that belong to the cluster sample.163487693890169513925588771015092097915726)There are 750 incoming freshmen attending a university this fall. A researcher wishes to send questionnaires toa sample of 30 of them to complete regarding their drinking habits. Select the numbers of the first fivefreshmen who belong to the simple random sample.163487693890169513925588771015092097915727)A college employs 85 faculty members. Without replacement, select the numbers of the five members who willserve on the tenure committee next year.163487693890169513925588771015092097915728)Of the 5000 outpatients released from a local hospital in the past year, one hundred were contacted and askedtheir opinion on the care they received. Select the first five patients who belong to the simple random sample.1634876938901695139255887710150920979157MULTIPLE CHOICE. Choose the one alternative that best completes the statement or answers the question. Determine whether you would take a census or use a sampling. If you would use a sampling, decide what sampling technique you would use.29)The average age of the 80 residents of an assisted living center.A)census B)random sampling C)stratified sampling D)cluster sampling 4ConceptsSHORT ANSWER. Write the word or phrase that best completes each statement or answers the question.Provide an appropriate response.30)Explain the differences between cluster sampling and stratified sampling.31)Explain the difference between a census and a sampling and describe the advantages and disadvantages ofeach.Chapter 1Introduction to StatisticsAnswer Key1.1An Overview of Statistics1Distinguish Between a Population and a Sample1)A2)A3)population: collection of all American households; sample: collection of 1212American households surveyed4)population: collection of all American households; sample: collection of 1348American households surveyed5)population: elementary school children; sample: collection of 2625 elementary school children surveyed.6)A2Distinguish Between a Parameter and a Statistic7)It describes a statistic because the number $130,000is based on a subset of the population.8)It describes a parameter because the $44,000is based on all the workers at the car manufacturer.9)It describes a statistic because the number 1040is based on a subset of the population.3Distinguish Between Descriptive Statistics and Inferential Statistics10)A11)A12)A13)A14)A4Concepts15)A population is the collection of all outcomes, responses, measurements, or counts that are of interest.. A sample is asubset of a population.16)A sample would be used. It is usually impractical to obtain all the population data.1.2Data Classification1Distinguish Between Qualitative and Quantitative Data1)A2)A3)A4)A2Classify Data with Respect to the Four Levels of Measurement5)A6)A7)A8)A9)A10)A11)A12)A13)A14)A15)A16)A17)A18)A19)A20)A21)A22)A23)A24)A25)A3Concepts26)Data at the ratio level are similar to data at the interval level, but with the added property that a zero entry is aninherent zero (implies ʺnoneʺ). Also, for data at the ratio level a ratio of two data values can be formed so that one data value can be expressed as a multiple of another.27)Such data is at the interval level rather than the ratio level because the temperature of 0°C does not represent acondition where no heat is present, so it is not an inherent zero as required by the ratio level. Also, ratios of twotemperatures cannot be formed so that one data value is expressed as a multiple of the other. The temperature 2°C is not twice as warm as 1°C.1.3Data Collection and Experimental Design1Decide Whether Study is Observational Study or Experiment1)A2)A3)A4)A5)A6)A7)The experimental units are the 98 adults in the study. The treatment is the new diabetes medication.2Identify a Biased Sample8)The study may be biased because it is limited to people with computers.9)A report sponsored by the citrus industry is much more likely to reach conclusions favorable to the industry.10)The wording of the question is biased, as it tends to encourage negative responses.3Identify Sampling Techniques11)A12)A13)A14)A15)A16)A17)A18)A19)A20)A21)A22)A23)A24)A25)163, 169, 15, 92, 9726)163, 487, 693, 169, 51327)16, 34, 69, 38, 1328)1634, 3890, 1695, 1392, 150929)A4Concepts30)In stratified sampling, members of the population are divided into two or more subsets, or strata, that share a similarcharacteristic. A sample is then randomly selected from each of the strata. A stratified sample has members from each segment of the population. In cluster sampling, the population is divided into naturally occurring subgroups, each having similar characteristics. All of the members in one or more (but not all) of the clusters are then selected. In a cluster sample, care must be taken to ensure that all clusters have similar characteristics.31)A census is a count or measure of an entire population, while a sampling is a count or measure of part of a population.A census provides complete information but is often expensive, difficult, and time consuming to perform especially ifthe population is large. A sampling is less expensive and time consuming, however appropriate sampling techniques must be used to ensure that unbiased data are collected and that the sample is representative of the population. Even with the best sampling methods, sampling error can occur.。