财务决策Financial for Decision-makingCHAPTER 3
- 格式:doc
- 大小:316.00 KB
- 文档页数:5
Financial Accounting for Decision Makers 英文Sixth EditionFinancial Accountingfor Decision MakersPeter AtrillEddie McLaneyFinancial Accountingfor Decision MakersVisit the Financial Accounting for Decision Makers sixth edition Companion Website at comukatrillmclaneyto nd valuable student learning material including● Self assessment questions to test your learning● A study guide to aid self-learning● Revision questions and exercises to help you check your understanding● Extensive links to valuable resources on the web● Comments on case studies to aid interpretative andanalytical skillsWe work with leading authors to develop the strongest educational materials in accounting bringing cutting-edge thinking and best learning practice to a global marketUnder a range of well-known imprints includingFinancial Times Prentice Hall we craft high-quality print and electronic publications which help readers to understand and apply their content whether studying or at workTo find out more about the complete range of ourpublishing please visit us on the World Wide Web atcomuk6thEditionFinancial Accountingfor Decision MakersPeter AtrillandEddie McLaneyPearson Education LimitedEdinburgh GateHarlowEssex CM20 2JEEnglandand Associated Companies throughout the worldVisit us on the World Wide Web atcomukSecond edition published 1999 by Prentice Hall EuropeThird edition published 2002 by Pearson Education LimitedFourth edition 2005Fifth edition 2008Sixth edition 2011Prentice Hall Europe 1996 1999Pearson Education Limited 2002 2011The rights of Peter Atrill and Eddie McLaney to be identified as authors of this work havebeen asserted by them in accordance with the Copyright Designs and Patents Act 1988All rights reserved No part of this publication may be reproduced stored in a retrievalsystem or transmitted in any form or by any means electronic mechanical photocopyingrecording or otherwise without either the prior written permission of the publisher ora licence permitting restricted copying in the United Kingdom issued by theCopyright Licensing Agency Ltd Saffron House 6–10 Kirby Street London EC1N 8TSAll trademarks used herein are the property of their respective owners The use of anytrademark in this text does not vest in the author or publisher any trademark ownership rightsin such trademarks nor does the use of such trademarks imply any affiliation with orendorsement of this book by such ownersPearson Education is not responsible for the content of third party internet sitesISBN 978-0-273-74039-1British Library Cataloguing-in-Publication DataA catalogue record for this book is available from the British LibraryLibrary of Congress Cataloging-in-Publication DataAtrill PeterFinancial accounting for decision makers Peter Atrill and EddieMcLaney 6th edp cmISBN 978-0-273-74039-1 pbk1 Accounting2 Decision making I McLaney E J IITitleHF5636A884 201065815dc22201001825510 9 8 7 6 5 4 3 2 114 13 12 11 10Typeset in 95125pt Stone Serif by 35Printed and bound by Rotolito Lombarda ItalyBrief contentsGuided tour of the book xivGuided tour of the Companion Website xviPreface xviiiHow to use this book xxAcknowledgements xxii1 Introduction to accounting。
ACCA笔记| SBL笔记11 | Financial Decision MakingA考挪到七月中旬,突然又多了一个多月复习时间...谁能想到经历了寒假充值的我们A考备考时间也被充值了今日笔记是关于 Financial Decision Making 的内容~1. Financial objectives of stakeholders- Financial strategy often focuses on shareholders wealth. But there are financial expectations from other stakeholders which must also be considered.- When setting strategy for the organisation, the financial expectations of other stakeholders need also be considered.2. Funding strategy- Funding for Non-for-profit organisations Most non-for-profit organisations need their core costs to be covered.- Funding SBUs and strategic choices using BCG matrix- Alternative sources of financeequity, debt, others (eg. government grants)3. Financial analysis and decision-making techniques- Break even analysis 1) To ascertain how much each $ sold actually contributes towards the fixed costs.C/S ratio = Contribution per unit / selling price per units= total contribution / total sales revenue2) To make zero profit, sales volume should be atBreakeven = FC/(sales price – unit variable cost)= FC/ CPU3) The margin of safety indicates by how much sales can decrease before a loss occurs Margin of safety= budgeted sales –BEP A large margin of safety indicates a low risk of making loss, whereas a small margin of safety might indicate a fairly high risk of loss.- Marginal analysisMarginal analysis refers to situations where we use contribution to make decisions.The key is that only cost which vary with the decision should be included in the analysis of decision.Relevant costs are future cash flows arising as a direct consequence of the decision under consideration.Marginal analysis can be used in key areas of decision making such as:1) Make or buy decisions2) Shut-down decisions3) Further processing decisions- Long-term decision making1) Accounting rate of return (ARR) Average profits / initial investment2) Payback period Determine how quickly the original cash injection is recovered3) Net present value (NPV) Use a cost of capital and discount factors to discount future cash flows to give the present value4) Internal rate of return (IRR) Determine the cost of capital that provides a zero NPV4. Cost and management accounting- Standard costing assumes that business operate in a stable environment where, for example, a standard amount of materials will be used in the production of each product and that a standard price can be attached to the price of those- Forecast 1) Linear regression Linear regression measures the relationship between two variablesThe strength of the relationship is measured by correlation coefficient - 'r', which can range from +1 (perfect positive linear correlation) through 0 (no correlation) to -1 (perfect negative linear correlation).2) Time series analysis Time series analysis aims to separate seasonal and cyclical fluctuations from long-term underlying trends.- Budget 1) Benefits of budgets Promotes forward thinking Helps to co-ordinate the various aspects of the organisation Motivates performance Provides a basis for a system of control Provides a system of authorisation2) Limitations of budgets Employees may be demotivated if they believe the budget to be unattainable. Slack may be built in by managers to make the budget more achievable.Focuses on the short-term results rather than the underlyingUnrealistic budgets may cause managers to make decisions that are detrimental to the company.3) Alternative budgeting models Top-down (Imposed budgeting) VS Bottom-up (Participative budgeting)Fixed budget VS Flexible budget Periodic budgets VS Rolling (Continuous) Budgets Incremental VS Zero based budgets。

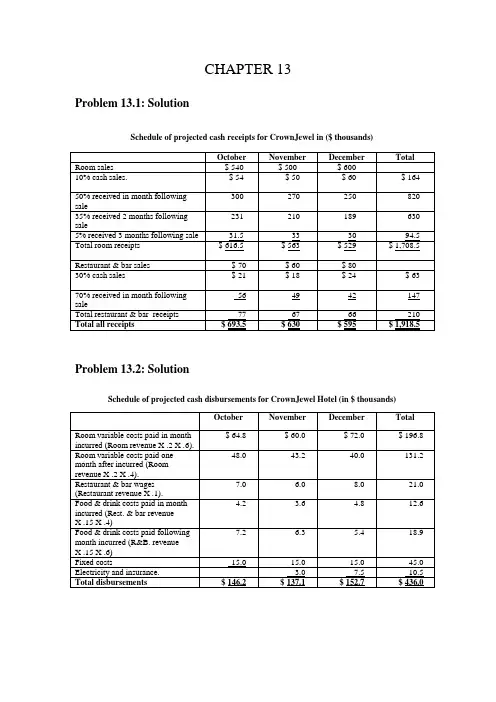
CHAPTER 13Problem 13.1: SolutionSchedule of projected cash receipts for CrownJewel in ($ thousands)October November December Total Room sales $ 540 $ 500 $ 60010% cash sales. $ 54 $ 50 $ 60 $ 164 50% received in month following300 270 250 820 sale231 210 189 630 35% received 2 months followingsale5% received 3 months following sale 31.5 33 30 94.5 Total room receipts $ 616.5 $ 563 $ 529 $ 1,708.5 Restaurant & bar sales $ 70 $ 60 $ 8030% cash sales $ 21 $ 18 $ 24 $ 6356 49 42 147 70% received in month followingsaleTotal restaurant & bar receipts 77 67 66 210 Total all receipts $ 693.5 $ 630 $ 595 $ 1,918.5Problem 13.2: SolutionSchedule of projected cash disbursements for CrownJewel Hotel (in $ thousands)October November December Total$ 64.8 $ 60.0 $ 72.0 $ 196.8 Room variable costs paid in monthincurred (Room revenue X .2 X .6).48.0 43.2 40.0 131.2 Room variable costs paid onemonth after incurred (Roomrevenue X .2 X .4).7.0 6.0 8.0 21.0 Restaurant & bar wages(Restaurant revenue X .1).Food & drink costs paid in month4.2 3.6 4.8 12.6 incurred (Rest. & bar revenueX .15 X .4)7.2 6.3 5.4 18.9 Food & drink costs paid followingmonth incurred (R&B. revenueX .15 X .6)Fixed costs 15.0 15.0 15.0 45.0 Electricity and insurance. 3.0 7.5 10.5 Total disbursements $ 146.2 $ 137.1 $ 152.7 $ 436.0Problem 13.3: SolutionCash budget for CrownJewelOctober November December Total Total cash receipts a$ 693.5 $ 630.0 $ 595.0 $ 1,918.5 Less Total cash disbursements b146.2 137.1 152.7 436.0Net cash flow 547.3 492.9 442.3 1,482.5 Add Opening cash balance 12.0 559.3 1,052.2 12.0 Ending cash $ 559.3 $ 1,052.2 $ 1,494.5 $ 1,494.5 a: From solution to Problem 13.1.b: From solution to Problem 13.2.Problem 13.5: Solutiona) Credit sales per annum = 40% of $6,000,000 = $2,400,000Accounts receivable turnover =Credit sales ÷ Accounts receivable balance$2,400,000 ÷ $263,014 = 9.125Average number of days to collect accounts receivable =Days in the year ÷ Accounts receivable turnover365 ÷ 9.125 = 40 daysThe hotel is extending 30 day credit terms, yet the analysis of the year end account balance indicates that the average period that credit customers are taking to settle their accounts is 40 days. The extent to which this represents a matter for significant concern should be considered in the context of the additional days credit that have been taken by the average customer in the past. A more detailed review of the accounts receivable balance may reveal that several large and loyal customers are taking more than 40 days to settle their accounts. Before management decides to more aggressively pursue the collection of these overdue accounts, it should appraise whether goodwill with the customers may be damaged.b) This significantly alters the interpretation that should be attached to the accounts receivable turnover calculated in part (a). As November and December represent relatively busy months, it is to be expected that an above average accounts receivable balance will result at the end of December. It is to be expected that a relatively low “accounts receivable turnover” figure (and, as a consequence, a relatively high “number of days to collect accounts receivable” figure) will be calculated, if it is based on the accounts receivable balance pertaining at the end of a busy period.In this situation, the low accounts receivable turnover figure can not be interpreted as signifying poor accounts receivable management. In order to gain a fairer reflection of the average accounts receivable turnover over the course of the year, we would need to take an average of the accounts receivable balance across the entire year (i.e., sum the 12 balances at the end of each month and divide by 12). The year end information provided is not sufficient to enable the interested manager to compute a true average accounts receivable turnover that is reflective of the performance across the whole year. The onus is therefore on the interested manager to ask the accounting department to provide the additional information required.c)CreatureComforts Aging of Accounts Receivable Schedule as at 31st DecemberCurrent 0-30 31-60 61-90 91-120 121-150DaysoverdueMonth Dec. Nov. Oct. Sep. Aug. July Total $210,000 $26,300 $7,890 $2,782 $13,448 $2,594 $263,014 Accountsreceivable80% 10% 3% 1% 5% 1% 100% % of total(rounded)The aging of accounts receivable schedule reveals a fairly typical time distribution of the accounts receivable balance, as most of the year end accounts receivable balance pertains to credit sales made in the current month (i.e., accounts receivable that are not yet overdue). The schedule also reveals, however, that there appears to be a problem with those accounts that are overdue by between 91 and 120 days. These accounts constitute 5% of the total amounts owing at the end of the year. 120 days represents a long time for accounts to be overdue. It may well be the case that a single large account comprises most of the amount falling into the 91 to 120 days overdue category. If this is the case, further analysis should be made of the cause for the late payment and steps implemented to collect the outstanding amounts as soon as possible.Problem 13.6: SolutionPer annum usage of detergent = 25 X 12 = 300 boxes.EOQ = √ (2 X U X O ÷ C)= √ (2 X 300 X 20 ÷ 2)= √ 6,000= 77.46 (as 0.46 of a box cannot be ordered, TartanDays should place ordersin lot sizes of 77 or 78).Problem 13.9: SolutionIn this situation it appears that Feast’N’Run is not considering between paying on the 10th and 40th days of the credit period, but between the 10th and 50th days of the credit period. Accordingly, the basic formula has been adapted in the following way:% discount offered X Days in a year100 - % discount offered Difference between 10th and 50th daysi.e., (1 ÷ 99) X (365 ÷ 40) = 0.92 (or 9.2%).As Feast’N’Run would have to borrow at 9.5% interest in order to take a trade discount that provides an effective rate of return of 9.2%, it is not in Feast’N’Run’s interest to take the trade discount offered.。
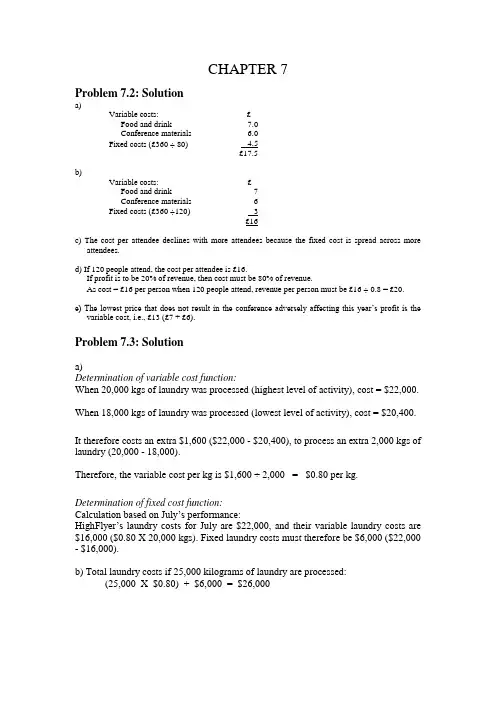
CHAPTER 7Problem 7.2: Solutiona)Variable costs: £Food and drink 7.0Conference materials 6.0Fixed costs (£360 ÷ 80) 4.5£17.5b)Variable costs: £Food and drink 7Conference materials 6Fixed costs (£360 ÷120) 3£16c) The cost per attendee declines with more attendees because the fixed cost is spread across moreattendees.d) If 120 people attend, the cost per attendee is £16.If profit is to be 20% of revenue, then cost must be 80% of revenue.As cost = £16 per person when 120 people attend, revenue per person must be £16 ÷ 0.8 = £20.e) The lowest price that does not result in the conference adversely affecting this year’s profit is thevariable cost, i.e., £13 (£7 + £6).Problem 7.3: Solutiona)Determination of variable cost function:When 20,000 kgs of laundry was processed (highest level of activity), cost = $22,000. When 18,000 kgs of laundry was processed (lowest level of activity), cost = $20,400. It therefore costs an extra $1,600 ($22,000 - $20,400), to process an extra 2,000 kgs of laundry (20,000 - 18,000).Therefore, the variable cost per kg is $1,600 ÷ 2,000 = $0.80 per kg. Determination of fixed cost function:Calculation based on July’s performance:HighFlyer’s laundry costs for J uly are $22,000, and their variable laundry costs are $16,000 ($0.80 X 20,000 kgs). Fixed laundry costs must therefore be $6,000 ($22,000 - $16,000).b) Total laundry costs if 25,000 kilograms of laundry are processed:(25,000 X $0.80) + $6,000 = $26,000Problem 7.4: SolutionComputational schedule of indirect expense allocationsAmount allocated toRooms Amount allocated toRestaurantsAmount allocated toBarsBuilding rent expense 350 ÷ 500 X $90,000 =$63,000100 ÷ 500 X $90,000 =$18,00050 ÷ 500 X $90,000 =$9,000Advertising expense $1.15m ÷ $1.5m X$20,000 = $15,333$250,000 ÷ $1.5m X$20,000 = $3,333$100,000 ÷ $1.5m X$20,000 = $1,333Depreciation expense $900,000 ÷ $1.2m X$45,000 = $33,750$200,000 ÷ $1.2m X$45,000 = $7,500$100,000 ÷ $1.2m X$45,000 = $3,750Personnel department expense $250,000 ÷ $500,000 X$100,000 = $50,000$210,000 ÷ $500,000 X$100,000 = $42,000$40,000 ÷ $500,000 X$100,000 = $8,000Problem 7.5: SolutionImpact on hotel’s profitabilityresulting from shop closureLost gross profit $115,000Expenses saved126,000 - 12,000 - 4,500 $109,500Net decline in hotel profit $ 5,500Santa Fe’s shop should not be closed as this would result in a decline of $5,500 in the hotel’s total profit.Alternative way of looking at this problemImpact of closing1) Negative implication: Gross profit lost = $115,0002) Positive implications: Reduced electricity expenses $3,000Other reduced expenses$126,000 - $7,500 - $12,000 = $106,500 Negative implication of $115,000 outweighs positive implications of $109,500 ($3,000 + $106,500) by $5,500.Problem 7.9: Solutiona)Impact on profit if one day university conference is hosted:$ $Increased revenueDelegate fees (400 X $26) 10,400Venue hire 3,000Incremental revenue 13,400Variable costsFood (400 X $15) 6,000Drink (400 X $12) 4,800Casual staff wages (400 X $6) 2,40013,200Increase to profit $ 200Hosting the university conference is justifiable on financial grounds, as it will increase profit by $200.b)Impact on profit if magician conference is hosted:$ $Increased revenueFee per delegate (200 X 3 X $12) 7,200Room sales contribution (200 X 3 X 30) 18,000Incremental revenue 25,200Variable costsFood (200 X 3 X $15) 9,000Drink (200 X 3 X $12) 7,200Casual staff wages (200 X 3 X $6) 3,60019,800Increase to profit $ 5,400Hosting the magician conference can be justified on financial grounds, as it will increase profit by $5,400.。

财务决策(financialdecision)对财务方案、财务政策进行选择和决定的过程。
财务决策的目的在于确定最为令人满意的财务方案。
只有确定了效果好并切实可行的方案,财务活动才能取得好的效益,完成企业价值化的财务管理目标(参见“财务管理目标”)。
因此财务决策是整个财务管理的核心。
财务决策需要有财务决策的基础与前提,财务决策则是对财务预测结果的分析与选择。
财务决策是一种多标准的综合决策。
决定方案取舍的、既有货币化、可计量的经济标准,又有非货币化、不可计量的非经济标准,因此决策方案往往是多种因素综合平衡的结果。
分类财务决策按照能否程序化,可以分为程序化财务决策和非程序化财务决策。
前者指对不断重复出现的例行财务活动所作的决策,后者指对不重复出现、具有独特性的非例行财务活动所作的决策。
按照决策所涉及的时间长短,可分为长期财务决策和短期财务决策。
前者指所涉及时间超过一年的财务决策,后者指所涉及时间不超过一年的财务决策。
财务决策又可以按照决策所处的条件,分为确定型财务决策、风险型财务决策和非确定型财务决策,前者指对未来情况完全掌握、每种方案只有一种结果的事件的决策;次者指对未来情况不完全掌握、每种方案会出现几种结果,但可按概率确定的条件的决策;后者指对未来情况完全不掌握,每种方案会出现几种结果,且其结果不能确定的事件的决策。
按照决策所涉及的内容,财务决策还可以分为投资决策、筹资决策和分配决策。
前者指资金对外投出和内部配置使用的决策,次者指有关资金筹措的决策,后者指有关利润分配的决策。
步骤进行财务决策需经如下步骤:(1)确定决策目标。
指确定决策所要解决的问题和达到的目的。
(2)进行财务预测。
即通过财务预测,取得财务决策所需的业经科学处理的预测结果。
(3)方案评价与选优。
指依据预测结果建立若干备选方案,并运用决策方法和根据决策标准对各方案进行分析论证,作出综合评价,选取其中最为满意的方案。
(4)决策过程的结束,还需进行具体的计划安排,组织实施,并对计划执行过程进行控制和搜集执行结果的信息反馈,以便判断决策的正误,及时修正方案,确保决策目标的实现。

【最新】ACCA笔记SBL笔记11 Financial Decision Making今日笔记是关于 Financial Decision Making 的内容~1. Financial objectives of stakeholders- Financial strategy often focuses on shareholders wealth. But there are financial expectations from other stakeholders which must also be considered.- When setting strategy for the organisation, the financial expectations of other stakeholders need also be considered.2. Funding strategy- Funding for Non-for-profit organisationsMost non-for-profit organisations need their core costs to be covered.- Funding SBUs and strategic choicesusing BCG matrix- Alternative sources of financeequity, debt, others (eg. government grants)3. Financial analysis and decision-making techniques- Break even analysis1) To ascertain how much each $ sold actually contributes towards the fixed costs.C/S ratio= Contribution per unit / selling price per units= total contribution / total sales revenue2) To make zero profit, sales volume should be at Breakeven = FC/(sales price – unit variable cost)= FC/ CPU3) The margin of safety indicates by how much sales can decrease before a loss occursMargin of safety = budgeted sales – BEPA large margin of safety indicates a low risk of making loss, whereas a small margin of safety might indicate a fairly high risk of loss.- Marginal analysisMarginal analysis refers to situations where we use contribution to make decisions.The key is that only cost which vary with the decision should be included in the analysis of decision.Relevant costs are future cash flows arising as a direct consequence of the decision under consideration.Marginal analysis can be used in key areas of decision making such as:1) Make or buy decisions2) Shut-down decisions3) Further processing decisions- Long-term decision making1) Accounting rate of return (ARR)Average profits / initial investment2) Payback periodDetermine how quickly the original cash injection is recovered3) Net present value (NPV)Use a cost of capital and discount factors to discount future cash flows to give the present value4) Internal rate of return (IRR)Determine the cost of capital that provides a zero NPV4. Cost and management accounting- Standard costing assumes that business operate ina stable environment where, for example, a standardamount of materials will be used in the production of each product and that a standard price can be attached to the price of those materials.- Forecast1)Linear regressionLinear regression measures the relationship between two variablesThe strength of the relationship is measured by correlation coefficient - 'r', which can range from +1 (perfect positive linear correlation) through 0 (no correlation) to -1 (perfect negative linear correlation).2) Time series analysisTime series analysis aims to separate seasonal and cyclical fluctuations from long-term underlying trends.- Budget1) Benefits of budgetsPromotes forward thinkingHelps to co-ordinate the various aspects of the organisationMotivates performanceProvides a basis for a system of controlProvides a system of authorisation2) Limitations of budgetsEmployees may be demotivated if they believe the budget to be unattainable.Slack may be built in by managers to make the budget more achievable.Focuses on the short-term results rather than the underlying causes.Unrealistic budgets may cause managers to make decisions that are detrimental to the c ompany.3) Alternative budgeting modelsTop-down (Imposed budgeting) VS Bottom-up (Participative budgeting)Fixed budget VS Flexible budgetPeriodic budgets VS Rolling (Continuous) BudgetsIncremental VS Zero based budgets。
ACCA笔记| SBL笔记11 | Financial Decision Making今日笔记是关于 Financial Decision Making 的内容~1. Financial objectives of stakeholders- Financial strategy often focuses on shareholders wealth. But there are financial expectations from other stakeholders which must also be considered.- When setting strategy for the organisation, the financial expectations of other stakeholders need also be considered.2. Funding strategy- Funding for Non-for-profit organisations Most non-for-profit organisations need their core costs to be covered.- Funding SBUs and strategic choices using BCG matrix- Alternative sources of financeequity, debt, others (eg. government grants)3. Financial analysis and decision-making techniques- Break even analysis 1) To ascertain how much each $ sold actually contributes towards the fixed costs.C/S ratio = Contribution per unit / selling price per units= total contribution / total sales revenue2) To make zero profit, sales volume should be atBreakeven = FC/(sales price – unit variable cost)= FC/ CPU3) The margin of safety indicates by how much sales can decrease before a loss occurs Margin of safety= budgeted sales –BEP A large margin of safety indicates a low risk of making loss, whereas a small margin of safety might indicate a fairly high risk of loss.- Marginal analysisMarginal analysis refers to situations where we use contribution to make decisions.The key is that only cost which vary with the decision should be included in the analysis of decision.Relevant costs are future cash flows arising as a direct consequence of the decision under consideration.Marginal analysis can be used in key areas of decision making such as:1) Make or buy decisions2) Shut-down decisions3) Further processing decisions- Long-term decision making1) Accounting rate of return (ARR) Average profits / initial investment2) Payback period Determine how quickly the original cash injection is recovered3) Net present value (NPV) Use a cost of capital and discount factors to discount future cash flows to give the present value4) Internal rate of return (IRR) Determine the cost of capital that provides a zero NPV4. Cost and management accounting- Standard costing assumes that business operate in a stable environment where, for example, a standard amount of materials will be used in the production of each product and that a standard price can be attached to the price of those materials.- Forecast 1) Linear regression Linear regression measures the relationship between two variablesThe strength of the relationship is measured by correlation coefficient - 'r', which can range from +1 (perfect positive linear correlation) through 0 (no correlation) to -1 (perfect negative linear correlation).2) Time series analysis Time series analysis aims to separate seasonal and cyclical fluctuations from long-term underlying trends.- Budget 1) Benefits of budgets Promotes forward thinking Helps to co-ordinate the various aspects of the organisation Motivates performance Provides a basis for a system of control Provides a system of authorisation2) Limitations of budgets Employees may be demotivated if they believe the budget to be unattainable. Slack may be built in by managers to make the budget more achievable.Focuses on the short-term results rather than the underlying causes.Unrealistic budgets may cause managers to make decisions that are detrimental to the company.3) Alternative budgeting models Top-down (Imposed budgeting) VS Bottom-up (Participativebudgeting)Fixed budget VS Flexible budget Periodic budgets VS Rolling (Continuous) Budgets Incremental VS Zero based budgets。
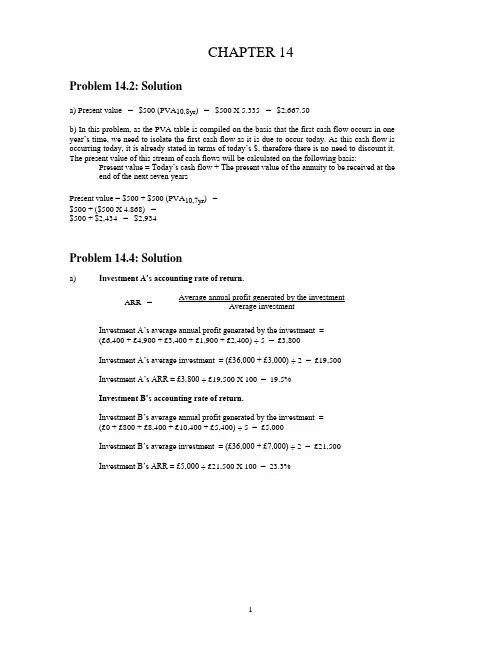
CHAPTER 14Problem 14.2: Solutiona) Present value = $500 (PVA10,8yr) = $500 X 5.335 = $2,667.50b) In this problem, as the PVA table is compiled on the basis that the first cash flow occurs in one year’s time, we need to isolate the first cash flow as it is due to occur today. As this cash flow is occurring today, it is already stated in terms of today’s $, therefore there is no need to discount it. The present value of this stream of cash flows will be calculated on the following basis: P resent value = Today’s cash flow + The present value of the annuity to be received at the end of the next seven yearsPresent value = $500 + $500 (PVA10,7yr) =$500 + ($500 X 4.868) =$500 + $2,434 = $2,934Problem 14.4: Solutiona) Inve stment A’s accounting rate of return.Average annual profit generated by the investmentARR =Average investmentInvestment A’s average annual profit generated by the investment =(£6,400 + £4,900 + £3,400 + £1,900 + £2,400) ÷ 5 = £3,800Investment A’s average investment = (£36,000 + £3,000) ÷ 2 = £19,500Investment A’s ARR = £3,800 ÷ £19,500 X 100 = 19.5%Investment B’s accounting rate of return.Investment B’s average annual profit generated by the investment =(£0 + £800 + £8,400 + £10,400 + £5,400) ÷ 5 = £5,000Investment B’s average investment = (£36,000 + £7,000) ÷ 2 = £21,500Investment B’s ARR = £5,000 ÷ £21,500 X 100 = 23.3%b) Note that the payback method is based on cash flows and not profit.I nvestment A’s payback.£36,000 is initially invested.After 1 year, £14,000 has been recouped.After 2 years, £26,000 has been recouped (£14,000 + £12,000).After 3 years, £36,000 has been recouped (£14,000 + £12,000 + £10,000).The payback is therefore 3 years.Investment B’s payback.£36,000 is initially invested.After 1 year, £5,000 has been recouped.After 2 years, £12,000 has been recouped (£5,000 + £7,000).After 3 years, £27,000 has been recouped (£5,000 + £7,000 + £15,000), at this time there is still £9,000 of the £36,000 initial investment to be recouped.As £18,000 is recouped in year 4, we will assume that the final £9,000 needed was recouped half way through the project’s fourth year.The payback is therefore 3.5 years.c) Calculation of investment A’s and investment B’s NPVIn the following table “year 0” refers to cash flows occurring todayInvestment A Investment BYear PV Discountfactor @ 12% Net cash flows(£)Present valueof cash flows(£)Net cashflows (£)Present value ofcash flows (£)0 1 - 36,000 - 36,000- 36,000 - 36,0001 0.893 14,000 12,502 5,000 4,4652 0.797 12,000 9,564 7,000 5,5793 0.712 10,000 7,120 15,000 10,6804 0.636 8,000 5,088 18,000 11,4485 0.567 11,000* 6,237 20,000* 11,340 Net present value £4,511 £7,512 Conclusion: Investment B is preferable as it has the higher NPV.d) The following table summarises the findings made when analysing the two investments using ARR, payback and net present value. As commentaries on investment appraisal techniques concur that NPV should be preferred to ARR and payback, investment B should be selected as the preferred investment. It provides the higher NPV.Investment A Investment B Preferredinvestment Accounting rate of return 19.5% 23.3% BPayback 3 year 3.5 years ANet present value £4,511 £7,512 BProblem 14.6: Solutiona) If 12% results in a positive discount rate, the IRR will be above 12%. If a higher discount rate is tried as part of the trial and error approach of seeking the IRR, the lower discounting factors associated with a higher discount rate (if you’re not sure of this, check the PV and PVA tables and see) will cause the present valu es of the project’s future cash inflows to have a lower present value. This, in turn, will reduce the NPV.b) In a single project, accept / reject, situation the NPV and the IRR will not conflict, i.e., a positive NPV signifies that the IRR will be greater than the required rate of return. When ranking investment projects, such as in the choice of the Italian restaurant or the British pub, the highest NPV project will not necessarily be the highest IRR project. In this situation, the Italian restaurant should be selected as it has the higher NPV. Commentaries on investment appraisal techniques concur that NPV should be preferred over the IRR, ARR and payback investment appraisal techniques when ranking more than one investment proposal.Problem 14.8: Solutiona)Net initial investmentPayback =Annual cash savingNote that investment in assets comprises the investment in any fixed asset associated with capital expenditure and also any necessary investment in working capital (current assets - current liabilities). In this case, the investment proposed will result in a decreased investment in stock held (i.e., a portion of funds locked up in assets will be liquidated).Investment:Computer hardware $40,000Reduction in stock held (10,000)Net investment $30,000Net annual cash saving:Wages saved $15,000License fee (5,000)Net annual saving $10,000$30,000Payback = = 3 years$10,000b) NPV:In order to calculate the extra taxation cash outflow, we need to determine annual depreciation (depreciation is a tax deductible expense). In the calculations below, it is assumed that the license fee is paid at the end of each year of the project’s 5 year life.NPV: $ PV PV of annual tax flow: 800 (PVA 10,5yr) = 800 X 3.791 = (3,033)PV of annual license fee: 5,000 (PVA 10,5yr) = 5,000 X 3.791 = (18,955)PV of wage savings: 15,000 (PVA 10,5yr) = 15,000 X 3.791 = 56,865PV of net initial investment (40,000 - 10,000) (30,000)Net Present Value $ 4,877 Conclusion: The investment is financially justified as the NPV is positive.Problem 14.10: Solution (The Stellar Views’ Chapel Case Study)a) In the following calculations, the contribution levels referred to in the case are assumed torepresent a reasonable indication of cash flows.$ Cash flows generated by local market ceremoniesAnnual cash flow received from ceremonies 115 X ($550 - $100) 51,750Annual cash flow received from receptions 115 X 0.2 X $5,000 115,000Annual cash flow received from accommodation 115 X 15 X $100 172,500Cash flows generated by Japanese market ceremoniesAnnual cash flow received from ceremonies 80 X ($550 - $100) 36,000Annual cash flow received from receptions 80 X 0.9 X $2,000 144,000Annual cash flow received from accommodation 80 X 0.9 X $1,000 72,000Less: Annual fixed costs 10,000Total annual cash flows generated by chapel weddings $581,250 Present value of Chapel investment =-Initial Investment + Present value of future cash inflows.-$1,000,000 + $581,250 (PVA 14,5yr) =-$1,000,000 + $581,250 (3.433) =-$1,000,000 + $1,995,431.2 = $995,431.2As the NPV is positive, the chapel project should be supported.b) The chapel investment is risky in the sense that it is taking the hotel outside its core areas of expertise, i.e., conventional activities associated with hotel management. The hotel has no previous experience in wedding ceremony marketing and management. As the activity is completely new, the estimated demand figures provided by the consulting company are bound to have involved a high degree of subjectivity (i.e., a degree of “guesstimation”). The case provides no information on whether in-house staff will maintain the facility or whether maintenance of the chapel will be outsourced. Again, the hotel’s lack of experience with respe ct to this activity raises the risk profile of the investment.In light of the relatively high risk associated with the investment, it would be appropriate for Stellar Views to use a discount rate higher than its cost of capital to calculate the NPV.c) Stellar Views should seek quotations from building companies that specialise in the particular type of building work required in a chapel (e.g., polished timbered seating, etc.). For a large building contract such as this, most hotels require at least three tenders from prospective builders. The issue of gaining tenders was actually noted to be a problem in the hotel that provided the basic information for the case. The Financial Controller indicated that the hotel had sought quotes on so many jobs that had not been pursued that building companies were becoming reluctant to take the time necessary to prepare a well-considered quote.。

如何做出正确的财务决策和投资决策经济水平和环境的飞速发展,造成了财务决策和投资决策的迫切需求。
掌握正确的财务决策和投资决策是重要的财务管理的关键。
本文将探讨制定正确的财务决策和投资决策,为你未来的财务规划提供切实可行的支持。
一、强调个人理财的重要性个人理财同样重要。
理财不仅仅是为了明确收入、支出和储蓄,更是为了优化金融资源。
合理的储蓄和有效的投资是每个人创造可持续性和长期财务安全的必要条件。
在财务决策中,我们要考虑风险、时间、回报率、支出以及未来的收益。
为了让个人理财计划成功,首先要建立预算和储蓄的计划。
一个合理的预算计划可以帮助你全面审视你的收入、支出和储蓄。
通过建立储蓄目标,你将更好地掌握你的资产。
二、正确理解目标和投资投资的目标有深刻的影响。
投资可能是短期或长期。
因此,投资决策应根据个人的目标,对投资周期进行清晰的分析。
在投资前,第一步是理解你的投资目标。
你所追求的收益与风险水平的选择,会在很大程度上影响你的投资规划。
其次,选择合适的投资工具。
包括现金、股票、债券和基金等。
这样,你就可以根据资金流动的需求选择适当的投资类型。
三、重视金融市场风险每项投资都存在风险。
金融市场不稳定的时期,需要谨慎处理风险。
四个字的风马牛不相及,证券市场价格也是如此。
不能凭空猜测和追逐高回报,应该通过调查和分析信息,包括公司、行业、市场和政策等方面的信息,确认你的决策。
此外,我们可以通过多元化来规避金融风险。
多元化投资可以帮助你在某些投资的发展周期较低时,仍然收获丰硕的回报。
由于投资组合中不同资产的相关性不同,因此调整投资组合可以降低总的金融风险。
四、根据不同的需要制定计划制定计划是财务决策中非常重要的一个方面。
财务计划应是具体、实用和可行的,基于自己的实际需求制定。
计划应该包括一个清晰的预算,并确定每月储蓄的目标和未来目标。
对于理财的投资和保险,应该实用而不是追求短期回报最大化。
同时,根据不同的需要制定计划也涵盖了为未来的年龄做准备的计划。
财务处理流程三个字Financial processing can be a complex and time-consuming task for any organization. 财务处理流程对于任何机构来说都是一个复杂而耗时的任务。
From budgeting to financial reporting, every step in the process requires careful attention to detail and adherence to established procedures. 从预算到财务报告,流程中的每个步骤都需要认真关注细节并遵守既定程序。
However, with the right systems and strategies in place, organizations can streamline their financial processing and ensure accuracy and efficiency. 然而,通过制定正确的系统和策略,组织可以简化他们的财务处理流程,确保准确性和效率。
One key aspect of financial processing is budgeting, which involves setting financial goals and allocating resources accordingly. 财务处理的一个关键方面是预算,它涉及设定财务目标并相应分配资源。
Effective budgeting requires careful planning and forecasting to ensure that funds are used wisely and in line with organizational objectives. 有效的预算需要仔细的规划和预测,以确保资金被明智地使用,并符合组织目标。
财务决策方法财务决策方法财务决策方法【1】摘要:财务决策主要是指企业的财务管理工作人员在实现财务总目标的前提和基础之上,从若干项备选的财务活动方案当中通过系统科学的分析选取出最优方案。
在实际的工作过程当中发现,进行科学决策的方法有许多,本文中笔者结合在实践工作过程当中的经验总结,对财务决策方法进行肤浅分析。
关键词:财务;决策财务决策主要是指企业的财务管理工作人员在实现财务总目标的前提和基础之上,从若干项备选的财务活动方案当中通过系统科学的分析选取出最优方案。
决策的具体过程主要有以下三个方面。
第一,根据财务预测的相关信息经过分析之后发现问题并向上级提出;第二,比较各项备选方案的优劣势;第三,结合企业的实际情况以及项目特点选择评选标准;第四,根据拟定的评选择优标准确定最佳方案。
在实际的工作过程当中,进行科学决策的方法有许多,下面就对企业财务决策方法进行分类分析。
一、财务控制方法1、防护性控制法。
通常人们形象地将防护性控制称为排除干扰法,这也是最彻底的一种财务控制方法,其前提是我们在进行财务活动之前所指定的一系列标准和相关的制度,这样做的目的是为了能够有效地保障现金的安全性和完整性,尽可能消除其中的差异性,确保现金在正常的适用范围之内,保障企业的日常生产经营活动。
与此同时,内部的牵制制度也要预先制定好,这样做有利于我们加强对被控制对象的管理监督和控制,还要结合企业的实际情况对企业的各项开支标准做出规定,只有这样才能最大限度节约非必要的支出费用。
2、前馈性控制法。
前馈控制也称补偿干扰控制,也就是说在实际的运行系统进行的过程当中,通过合理的监督和控制,在借助于科学的预测方法的前提和基础上,对可能会出现的偏差情况采取一系列的控制策略,最大限度地消除差异性,进而使企业的财务行为在可控制的范围内。
尤其要确保企业的短期偿还能力在可控制的范围内,要持续关注和监督企业的流动资产和流动负债的比例和具体情况,并对这些比例的发展趋势进行细致严密的分析,最终做出科学的预测。
一、一般的决策的过程决策是一个不断发现问题、解决问题的过程,美国著名的经济与管理学家、决策理论学派的西蒙把决策过程分为情报活动、设计活动、抉择活动和实施活动4个阶段(一)情报活动情报活动主要解决“做什么”的问题,决策者在决策过程中首先要分辨在什么情况下需要做出什么决策,这要求决策者必须善于发现问题、抓住机遇、避免和克服危机(二)设计活动设计活动是寻求多种途径解决问题的过程,是行动方案的探求过程。
设计活动强调多方面,因此在设计过程中,决策者及其咨询人员必须多思路、多角度地挖掘、构想,并形成多种方案。
(三)抉择活动抉择活动是预估、评价和选择方案的过程,在预估和评价各种方案后果的基础上选择出一个行动方案。
方案后果的多样性、评价准则的多样性以及抉择者个人主观因素等,决定了抉择是十分困难的。
(四)实施活动实施活动是执行、跟踪和学习的过程。
决策方案一旦确定,并不是下达一些指令、指示就完成了决策,还必须制定详细的执行预算和资源决算,使组织成员深刻理解决策方案并努力实施,加强实施过程的监督和检查,发现偏差以便及时纠正。
事实上,决策的各阶段并不是按顺序一次完成的,经常需要返回到以前的阶段。
例如,涉及或抉择时,如果发现情报不充分,还要再收集情报;抉择时发现原来设计的方案不够好,需要修改设计;实施时发现原来设计的方案达不到预期效果,需要对方案进行调整等。
宗旨,决策的过程,就是几个阶段反复进行,不断调整、完善的过程,从而像预期目标不断迈进。
二、财务决策需经如下步骤:(1)确定决策目标。
指确定决策所要解决的问题和达到的目的。
财务决策目标是财务决策分析的出发点和归结点。
确定决策目标就是弄清这项财务决策究竟是要解决什么问题。
即为什么要进行这项决策。
比如生产力如何提高,生产设备如何充分利用,生产的工艺技术如何革新,怎样确定最佳售价,如何确定最佳销售组合,为了促销如何做广告等等。
财务决策目标应该具体、明确,并力求目标的数量化。
收集信息:是针对决策目标,广泛收集尽可能多的,对决策目标有影响的各种可计量因素和不可计量因素的有关资料,特别是有关与其输入和预期成本的数据,并进行必要的加工正i作为决策依据。