标准差和标准误的选择 (SD) 和 (SEM)
- 格式:doc
- 大小:27.50 KB
- 文档页数:1
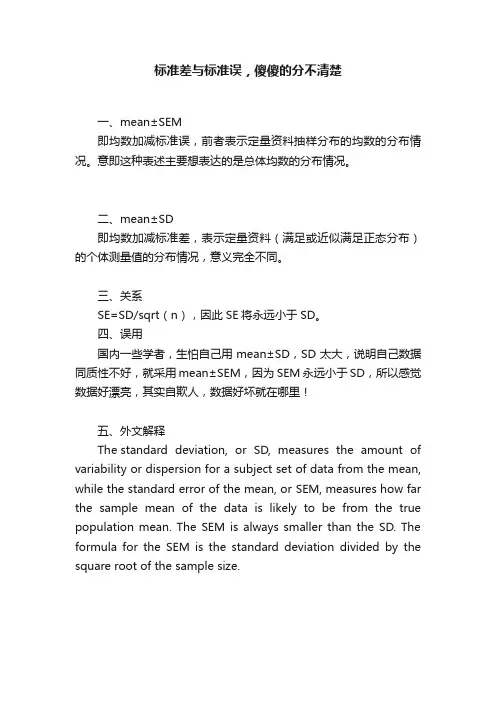
标准差与标准误,傻傻的分不清楚
一、mean±SEM
即均数加减标准误,前者表示定量资料抽样分布的均数的分布情况。
意即这种表述主要想表达的是总体均数的分布情况。
二、mean±SD
即均数加减标准差,表示定量资料(满足或近似满足正态分布)的个体测量值的分布情况,意义完全不同。
三、关系
SE=SD/sqrt(n),因此SE将永远小于SD。
四、误用
国内一些学者,生怕自己用mean±SD,SD太大,说明自己数据同质性不好,就采用mean±SEM,因为SEM永远小于SD,所以感觉数据好漂亮,其实自欺人,数据好坏就在哪里!
五、外文解释
The standard deviation, or SD, measures the amount of variability or dispersion for a subject set of data from the mean, while the standard error of the mean, or SEM, measures how far the sample mean of the data is likely to be from the true population mean. The SEM is always smaller than the SD. The formula for the SEM is the standard deviation divided by the square root of the sample size.。
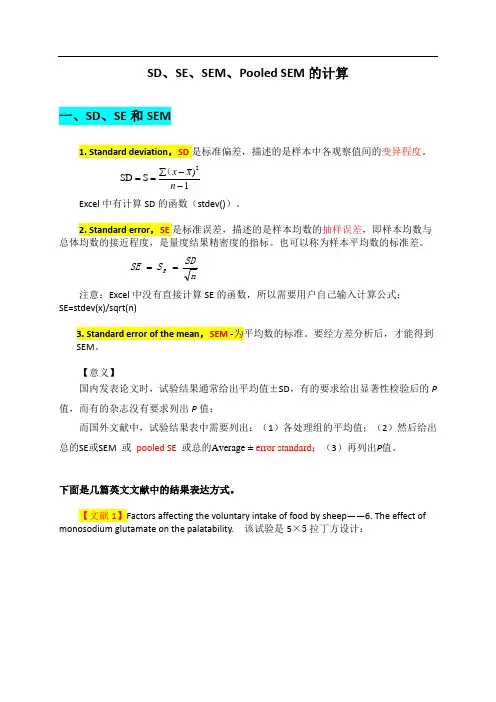
SD 、SE 、SEM 、Pooled SEM 的计算一、SD 、SE 和SEM1. Standard deviation ,SD 是标准偏差,描述的是样本中各观察值间的变异程度。
1)S SD 2--∑==n x x (Excel 中有计算SD 的函数(stdev())。
2. Standard error ,SE 是标准误差,描述的是样本均数的抽样误差,即样本均数与总体均数的接近程度,是量度结果精密度的指标。
也可以称为样本平均数的标准差。
nSD S SE x == 注意:Excel 中没有直接计算SE 的函数,所以需要用户自己输入计算公式:SE=stdev(x)/sqrt(n)3. Standard error of the mean ,SEM -为平均数的标准。
要经方差分析后,才能得到SEM 。
【意义】国内发表论文时,试验结果通常给出平均值±SD ,有的要求给出显著性检验后的P 值,而有的杂志没有要求列出P 值;而国外文献中,试验结果表中需要列出:(1)各处理组的平均值;(2)然后给出总的SE 或SEM 或 pooled SE 或总的Average ± error standard ;(3)再列出P 值。
下面是几篇英文文献中的结果表达方式。
【文献1】Factors affecting the voluntary intake of food by sheep ——6. The effect of monosodium glutamate on the palatability. 该试验是5×5拉丁方设计:表中解释:SE=SQRT (误差均方/n )= SQRT (MSe/n )文献1表2中的SE 即是SEM ,就是方差分析表中的误差均方除以n 再开方,即SEM=,也即x s 即在进行邓肯氏多重比较时的检验样本平均数的标准误(n=5)此处。
SEM 的计算(1)SPSS 分析系统的输出结果中,SEM 为“估计边际均值”表中“标准 误差”项【例1】 四种饲料对仔猪增重的影响group gain (kg ) 2 33 39 41 33 34 35 3 23 25 23 29 28 20 42824252220231)当重复数相等(均衡数据)时,获得SEM 的操作是:选择“GLM ”,在“选项”,在“估计边际均值”框,将“group ”变量选入右侧“显著均值”框中。

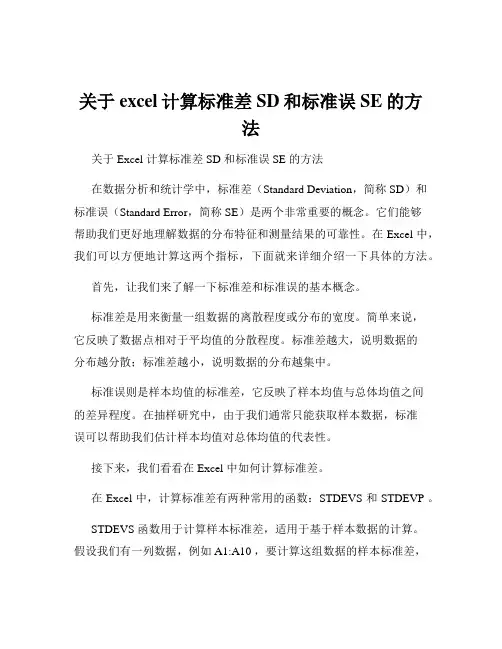
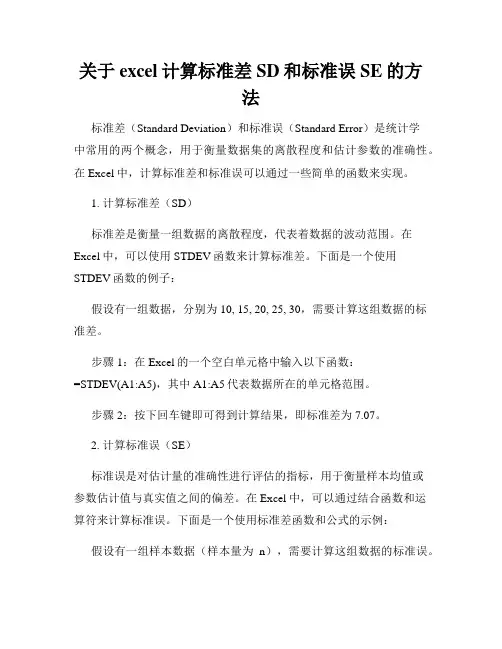
关于excel计算标准差SD和标准误SE的方法关于 Excel 计算标准差 SD 和标准误 SE 的方法在数据分析和处理中,标准差(SD)和标准误(SE)是两个非常重要的统计指标。
它们能够帮助我们更好地理解数据的分布特征和测量结果的可靠性。
而在 Excel 中,我们可以方便地计算这两个指标,下面就来详细介绍一下具体的方法。
首先,我们来了解一下标准差(SD)。
标准差是用来衡量一组数据的离散程度或者说分布的宽度。
简单来说,就是数据相对于平均值的分散程度。
如果标准差较小,说明数据比较集中在平均值附近;反之,如果标准差较大,则表示数据较为分散。
在 Excel 中,计算标准差可以使用内置的函数“STDEVS”(用于样本数据)和“STDEVP”(用于总体数据)。
假设我们有一组数据,例如:10,12,15,18,20。
我们将这些数据输入到 Excel 的一列中,比如 A1 到 A5 单元格。
然后,在另一个单元格中输入“=STDEV S(A1:A5)”,这将计算出这组样本数据的标准差。
如果要计算总体数据的标准差,则输入“=STDEVP(A1:A5)”。
接下来,我们再看看标准误(SE)。
标准误是样本统计量(如样本均值)的标准差。
它反映了样本统计量的抽样误差。
标准误越小,说明样本统计量对总体参数的估计越准确。
在 Excel 中,计算标准误需要先计算标准差,然后除以样本量的平方根。
还是以上面的那组数据为例,我们已经算出了样本的标准差。
假设样本量为 5,那么标准误的计算公式就是“=标准差/SQRT(5)”。
在实际操作中,我们可以先将计算标准差的公式写好,比如在 B1单元格中输入“=STDEVS(A1:A5)”,然后在另一个单元格(比如 C1)中输入“=B1/SQRT(COUNT(A1:A5))”,这样就得到了标准误。
为了更好地理解标准差和标准误的应用,我们来看一个例子。
假设我们进行了一项实验,测量了 10 只小白鼠的体重,得到的数据如下:25g,28g,30g,26g,29g,31g,27g,24g,32g,28g。
关于excel计算标准差SD和标准误SE的方法关于 Excel 计算标准差 SD 和标准误 SE 的方法在数据分析和统计学中,标准差(Standard Deviation,简称 SD)和标准误(Standard Error,简称 SE)是两个非常重要的概念。
它们能够帮助我们更好地理解数据的分布特征和测量结果的可靠性。
在 Excel 中,我们可以方便地计算这两个指标,下面就来详细介绍一下具体的方法。
首先,让我们来了解一下标准差和标准误的基本概念。
标准差是用来衡量一组数据的离散程度或分布的宽度。
简单来说,它反映了数据点相对于平均值的分散程度。
标准差越大,说明数据的分布越分散;标准差越小,说明数据的分布越集中。
标准误则是样本均值的标准差,它反映了样本均值与总体均值之间的差异程度。
在抽样研究中,由于我们通常只能获取样本数据,标准误可以帮助我们估计样本均值对总体均值的代表性。
接下来,我们看看在 Excel 中如何计算标准差。
在 Excel 中,计算标准差有两种常用的函数:STDEVS 和 STDEVP 。
STDEVS 函数用于计算样本标准差,适用于基于样本数据的计算。
假设我们有一列数据,例如 A1:A10 ,要计算这组数据的样本标准差,可以在一个空白单元格中输入“=STDEVS(A1:A10)”,然后按下回车键,Excel 就会给出相应的样本标准差。
STDEVP 函数用于计算总体标准差,适用于总体数据已知的情况。
如果我们确定所处理的数据是总体数据,而不是样本数据,可以使用“=STDEVP(A1:A10)”来计算总体标准差。
需要注意的是,在实际应用中,要根据数据的性质选择合适的函数。
如果不确定是样本还是总体,一般默认是样本,使用 STDEVS 函数。
然后,我们再看看如何计算标准误。
标准误的计算需要用到标准差和样本大小。
在 Excel 中,我们可以先计算出样本标准差,然后使用以下公式计算标准误:标准误=样本标准差/ SQRT(样本数量) 。
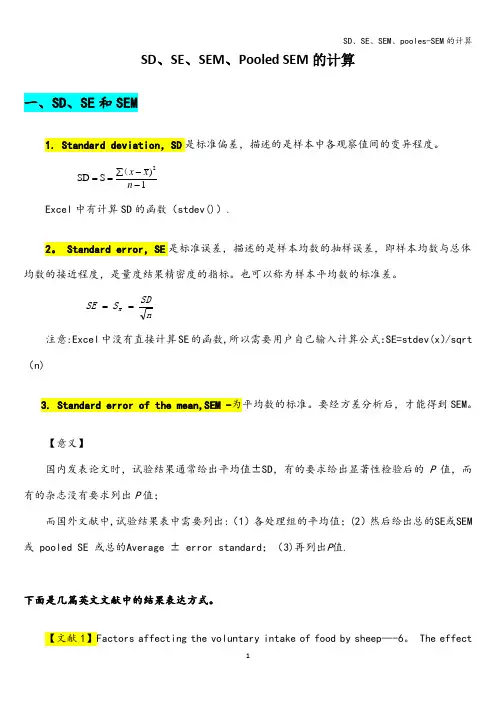
SD 、SE 、SEM 、Pooled SEM 的计算一、SD 、SE 和SEM1. Standard deviation ,SD 是标准偏差,描述的是样本中各观察值间的变异程度。
1)S SD 2--∑==n x x (Excel 中有计算SD 的函数(stdev()).2。
Standard error ,SE 是标准误差,描述的是样本均数的抽样误差,即样本均数与总体均数的接近程度,是量度结果精密度的指标。
也可以称为样本平均数的标准差。
nSD S SE x == 注意:Excel 中没有直接计算SE 的函数,所以需要用户自己输入计算公式:SE=stdev(x )/sqrt (n)3. Standard error of the mean,SEM -为平均数的标准。
要经方差分析后,才能得到SEM 。
【意义】国内发表论文时,试验结果通常给出平均值±SD ,有的要求给出显著性检验后的P 值,而有的杂志没有要求列出P 值;而国外文献中,试验结果表中需要列出:(1)各处理组的平均值;(2)然后给出总的SE 或SEM 或 pooled SE 或总的Average ± error standard ;(3)再列出P 值.下面是几篇英文文献中的结果表达方式。
【文献1】Factors affecting the voluntary intake of food by sheep —-6。
The effectof monosodium glutamate on the palatability. 该试验是5×5拉丁方设计:表中解释:SE=SQRT(误差均方/n )= SQRT (MSe/n )文献1表2中的SE 即是SEM ,就是方差分析表中的误差均方除以n 再开方,即也即x s (n=5)此处.SEM 的计算(1)SPSS 分析系统的输出结果中,SEM 为“估计边际均值”表中“标准 误差"项1)当重复数相等(均衡数据)时,获得SEM 的操作是:选择“GLM ”,在“选项",在“估计边际均值”框,将“group ”变量选入右侧“显著均值"框中。
关于excel计算标准差SD和标准误SE的方法标准差(Standard Deviation)和标准误(Standard Error)是统计学中常用的两个概念,用于衡量数据集的离散程度和估计参数的准确性。
在Excel中,计算标准差和标准误可以通过一些简单的函数来实现。
1. 计算标准差(SD)标准差是衡量一组数据的离散程度,代表着数据的波动范围。
在Excel中,可以使用STDEV函数来计算标准差。
下面是一个使用STDEV函数的例子:假设有一组数据,分别为10, 15, 20, 25, 30,需要计算这组数据的标准差。
步骤1:在Excel的一个空白单元格中输入以下函数:=STDEV(A1:A5),其中A1:A5代表数据所在的单元格范围。
步骤2:按下回车键即可得到计算结果,即标准差为7.07。
2. 计算标准误(SE)标准误是对估计量的准确性进行评估的指标,用于衡量样本均值或参数估计值与真实值之间的偏差。
在Excel中,可以通过结合函数和运算符来计算标准误。
下面是一个使用标准差函数和公式的示例:假设有一组样本数据(样本量为n),需要计算这组数据的标准误。
步骤1:首先计算标准差,使用STDEV函数,例如:=STDEV(A1:A5)。
步骤2:然后计算样本量的平方根,使用SQRT函数,例如:=SQRT(COUNT(A1:A5))。
步骤3:最后将标准差除以样本量的平方根,使用除号/运算符计算,例如:=C1/B1。
步骤4:按下回车键即可得到计算结果,即标准误为3.16。
以上就是使用Excel计算标准差(SD)和标准误(SE)的方法。
注意,在计算标准差和标准误时,使用的数据范围必须是数字型数据,并且考虑样本量的大小对结果的影响。
若要更深入了解Excel的统计函数和运算符的使用方法,可以参考Excel的官方文档或其他可靠的学习资源。
通过这些简单的计算方法,可以方便地在Excel中获取数据集的离散程度和参数估计值的准确性,为后续的数据分析和决策提供可靠的依据。

标准差和标准误如何选择标准差和标准误是统计学中常用的两个概念,它们在数据分析和推断中起着重要的作用。
在实际应用中,选择合适的标准差和标准误对于数据分析的准确性至关重要。
那么,究竟在不同情况下应该如何选择标准差和标准误呢?接下来将从不同角度进行分析和探讨。
首先,标准差和标准误的定义和计算方法需要明确。
标准差是衡量一组数据的离散程度的指标,它表示数据的离散程度,标准差越大,数据的离散程度越高。
标准误则是对样本均值估计总体均值的精度的度量,它表示样本均值与总体均值之间的差异程度,标准误越小,样本均值对总体均值的估计越准确。
在选择标准差和标准误时,需要考虑以下几个方面:1. 样本容量大小。
样本容量的大小对于选择标准差和标准误有着重要的影响。
当样本容量较大时,通常会选择标准误作为估计总体均值的精度度量,因为大样本容量可以更准确地估计总体均值,此时标准差的影响相对较小。
而在样本容量较小时,通常会选择标准差来描述数据的离散程度,因为小样本容量下标准误的估计可能不够准确。
2. 数据分布的形状。
数据的分布形状也是选择标准差和标准误的重要考虑因素。
当数据呈现正态分布时,通常会选择标准差作为数据的离散程度的度量,因为正态分布下标准差能够有效地描述数据的离散程度。
而在非正态分布的情况下,选择标准误更为合适,因为标准误能够更准确地估计总体均值的精度。
3. 研究目的和问题。
研究的具体目的和问题也会影响选择标准差和标准误的决策。
如果研究的主要目的是描述数据的离散程度,那么选择标准差更为合适;如果研究的主要目的是估计总体均值的精度,那么选择标准误更为合适。
总的来说,选择标准差和标准误需要根据具体的研究问题和数据特点来进行综合考虑。
在实际应用中,可以根据样本容量大小、数据分布形状以及研究目的和问题来灵活选择标准差和标准误,以提高数据分析的准确性和可靠性。
综上所述,标准差和标准误在数据分析中有着不可替代的作用,选择合适的标准差和标准误对于数据分析的准确性至关重要。
标准差和标准误标准差和标准误是统计学中常用的两个概念,它们在数据分析和推断中起着重要的作用。
本文将对标准差和标准误进行详细的介绍和比较,帮助读者更好地理解它们的含义和用途。
标准差是衡量一组数据离散程度的指标,它表示数据点与均值之间的平均距离。
标准差越大,数据的离散程度就越大;标准差越小,数据的离散程度就越小。
标准差的计算公式为,σ=√(Σ(xi-μ)²/n),其中σ表示标准差,Σ表示求和,xi表示第i个数据点,μ表示数据的均值,n表示数据的个数。
标准误是样本均值与总体均值之间的差异的标准差。
在统计推断中,我们通常使用样本数据来估计总体参数,而标准误则是衡量这种估计的精确程度的指标。
标准误的计算公式为,SE=σ/√n,其中SE表示标准误,σ表示总体标准差,n表示样本容量。
标准差和标准误之间有着密切的关系,它们都是衡量数据变异程度的指标,但所针对的对象和用途有所不同。
标准差主要用于描述一组数据的离散程度,而标准误则用于估计样本均值与总体均值之间的差异的精确程度。
在实际应用中,我们常常使用标准误来进行参数估计和假设检验,以判断样本均值与总体均值之间的差异是否显著。
在进行数据分析和推断时,正确理解和使用标准差和标准误是非常重要的。
它们可以帮助我们更准确地描述数据的特征、进行参数估计和假设检验,从而得出科学可靠的结论。
因此,熟练掌握标准差和标准误的计算方法和应用技巧,对于提高数据分析的准确性和可靠性具有重要意义。
总之,标准差和标准误是统计学中两个重要的概念,它们在数据分析和推断中具有不可替代的作用。
通过本文的介绍和比较,相信读者对标准差和标准误的含义和用途有了更清晰的认识,能够更好地应用它们进行数据分析和推断,取得更加可靠的研究结论。
标准差和标准误的选择 (SD) 和 (SEM)Which error bar should you choose?It is easy to be confused about the difference between the standard deviation (SD) and standard error of the mean (SEM).The SD quantifies scatter - how much the values vary from one another.The SEM quantifies how accurately you know the true mean of the population. The SEM gets smaller as your samples get larger. This makes sense, because the mean of a large sample is likely to be closer to the true population mean than is the mean of a small sample.The SD does not change predictably as you acquire more data. The SD quantifies the scatter of the data, and increasing the size of the sample does not increase the scatter. The SD might go up or it might go down. You can't predict. On average, the SD will stay the same as sample size gets larger.If the scatter is caused by biological variability, your probably will want to show the variation. In this case, graph the SD rather than the SEM. You could also instruct Prism to graph the range, with error bars extending from the smallest to largest value. Also consider graphing every value, rather than using error bars.If you are using an in vitro system with no biological variability, the scatter can only result from experimental imprecision. In this case, you may not want to show the scatter, but instead show how well you have assessed the mean. Graph the mean and SEM or the mean with 95% confidence intervals.Ideally, the choice of which error bar to show depends on the source of the variability and the point of the experiment. In fact, many scientists always show the mean and SEM, to make the error bars as small as possible.。
标准差SD计算标准误se标准差(SD)是用来衡量数据集合中各个数据偏离其平均值的程度的一种统计量。
而标准误(SE)则是用来衡量样本平均值与总体平均值之间的差异的统计量。
在统计学中,我们经常需要计算标准差和标准误来评估数据的稳定性和可靠性。
本文将介绍如何计算标准差和标准误,并且说明它们在数据分析中的重要性。
首先,让我们来看看如何计算标准差。
标准差的计算公式如下:\[ SD = \sqrt{\frac{1}{N} \sum_{i=1}^{N} (x_i \bar{x})^2} \]其中,\( N \) 代表数据集合中的数据个数,\( x_i \) 代表第 \( i \) 个数据,\( \bar{x} \) 代表数据的平均值。
标准差的计算步骤如下:1. 计算数据的平均值 \( \bar{x} \);2. 计算每个数据与平均值的差值,并对差值进行平方;3. 对所有差值的平方求和;4. 将总和除以数据个数 \( N \);5. 对结果取平方根,即得到标准差。
标准差的计算结果越大,代表数据的离散程度越大,反之则越小。
标准差可以帮助我们了解数据的分布情况,以及数据点与平均值之间的偏离程度。
在实际应用中,标准差常常被用来衡量一组数据的稳定性和可靠性,以及不同数据集合之间的差异性。
接下来,让我们来看看如何计算标准误。
标准误是标准差在样本平均值上的应用,用来衡量样本平均值与总体平均值之间的差异。
标准误的计算公式如下:\[ SE = \frac{SD}{\sqrt{N}} \]其中,\( SD \) 代表标准差,\( N \) 代表样本数据的个数。
计算标准误的步骤如下:1. 首先计算标准差 \( SD \);2. 然后将标准差 \( SD \) 除以样本数据的个数 \( N \) 的平方根,即可得到标准误 \( SE \)。
标准误的计算结果越小,代表样本平均值与总体平均值之间的差异越小,反之则越大。
标准误可以帮助我们判断样本平均值的稳定性和可靠性,以及样本数据与总体数据之间的偏差程度。
均值标准误代替标准差首先,让我们来了解一下均值标准误和标准差的概念。
均值标准误(standard error of the mean,SEM)是指在重复抽样的情况下,样本均值的标准差。
它的计算公式为标准差除以样本容量的平方根。
而标准差(standard deviation)则是一组数据的离散程度的度量,它衡量的是每个数据点与均值之间的差异。
通常情况下,我们使用标准差来描述一组数据的离散程度,但在样本均值的估计中,使用均值标准误会更为合适。
在实际应用中,均值标准误更适合用于描述样本均值的估计精度。
当我们进行统计推断时,通常是基于样本数据对总体参数进行估计。
而样本均值的估计精度则可以通过均值标准误来反映。
当样本容量较大时,均值标准误会相对较小,这意味着样本均值的估计更为准确。
相比之下,标准差则更多地用于描述数据的分布情况,而不是样本均值的估计精度。
此外,均值标准误在统计推断中的应用也更为广泛。
在进行假设检验、置信区间估计、回归分析等统计方法中,均值标准误通常被用来计算 t 值、构建置信区间等。
尤其是在比较不同组别的样本均值时,使用均值标准误能够更准确地判断两个样本均值之间的差异是否显著。
此外,均值标准误相对于标准差还具有一定的优势。
当样本容量增大时,均值标准误会随之减小,但标准差却不会有这样的变化。
这意味着在大样本情况下,均值标准误更能够准确地反映样本均值与总体均值之间的差异,从而提高了统计推断的精度。
总的来说,均值标准误是一种更为适合描述样本均值估计精度的统计量,它在统计推断中的应用更为广泛,并且具有随着样本容量增大而减小的特点。
因此,在一些需要对样本均值进行估计和比较的情况下,我们更应该使用均值标准误来代替标准差。
当然,在实际应用中,我们需要根据具体情况来选择合适的统计量,以更准确地反映数据的特征和估计参数的精度。
总之,均值标准误代替标准差在统计学中具有重要的意义和应用价值。
通过本文的讨论,相信读者对均值标准误的概念、优势和适用范围有了更深入的理解,能够在实际应用中更加灵活地选择合适的统计量,提高统计推断的准确性和可靠性。
均值的标准误标准误(Standard Error of the Mean,SEM)是统计学中常用的一个概念,它是指样本均值与总体均值之间的差异的一个估计值。
在进行统计推断时,我们经常需要估计样本均值与总体均值之间的差异,而标准误就是用来描述这种差异的一个重要指标。
标准误的计算方法是将样本标准差除以样本容量的平方根。
标准误的计算公式为SEM = SD / √n,其中SD表示样本标准差,n表示样本容量。
标准误的大小与样本容量有关,样本容量越大,标准误越小,反之亦然。
标准误的大小还与总体标准差有关,总体标准差越大,标准误也会越大。
标准误在统计推断中扮演着重要的角色。
在进行参数估计、假设检验、置信区间估计等统计推断过程中,我们经常需要使用标准误来进行推断。
例如,在进行样本均值的置信区间估计时,我们会使用样本均值加减标准误的若干倍来构建置信区间。
在进行假设检验时,我们也会使用标准误来计算检验统计量,进而进行假设的推断。
标准误的大小直接影响着统计推断的结果。
当标准误较大时,样本均值与总体均值之间的差异就会较大,这时我们对样本均值的估计就会不太准确,统计推断的结果也会不够精确。
因此,在进行统计推断时,我们需要对标准误的大小有所了解,以便更准确地进行推断。
除了计算标准误,我们还可以通过绘制误差棒图(error bar)来直观地展示样本均值与总体均值之间的差异。
误差棒图通常包括了置信区间、标准误等信息,能够直观地展示出样本均值的可信程度。
通过观察误差棒图,我们可以更直观地了解样本均值的可信程度,从而更准确地进行统计推断。
在实际研究中,我们经常会遇到样本均值与总体均值之间的差异。
通过计算标准误,我们可以对这种差异进行估计,从而进行更准确的统计推断。
标准误是统计学中一个重要的概念,它在参数估计、假设检验、置信区间估计等统计推断过程中扮演着重要的角色。
通过对标准误的了解,我们可以更准确地进行统计推断,从而得出更可靠的研究结论。
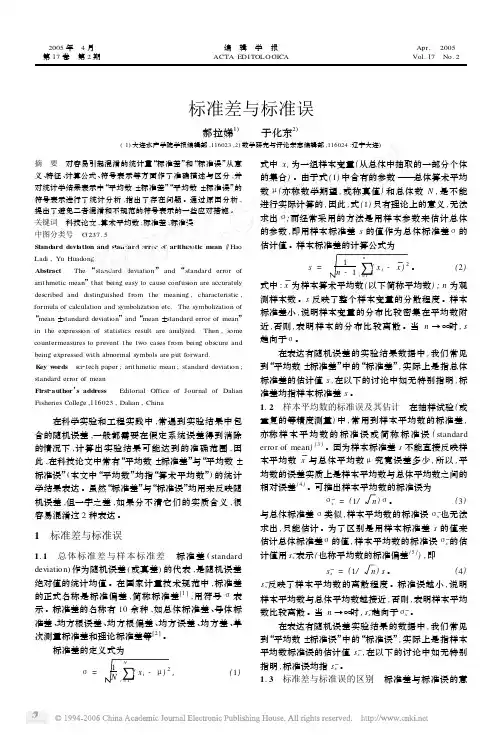
标准差和标准误:两个经常把人弄晕的概念
胡志德
【期刊名称】《临床与病理杂志》
【年(卷),期】2015(035)012
【摘要】在医学统计学中,有两个基本的概念:标准差(standard deviation,SD)和标准误(standard error of the mean,SEM)。
据笔者观察,很多医学研究者,特别是很多刚走上医学科研道路的研究生,常常分不清楚标准差和标准误的区别,以至于经常出现一些令人啼笑皆非的事情。
【总页数】3页(P2063-2065)
【作者】胡志德
【作者单位】济南军区总医院实验诊断科,济南250031
【正文语种】中文
【中图分类】R195.1
【相关文献】
1.《田间试验与统计》教学中标准差和标准误的区别与使用 [J], 穆俊祥;刘栓成;曹兴明;郭美兰;郭宏杰;韩海霞;姚林柏
2.标准差和标准误:两个经常把人弄晕的概念 [J], 胡志德
3.教导处经常要对学生的考试成绩进行统计分析,计算全级和各班的平均分、及格率、最高分、标准差等,求最高分、最低分和平均分相对容易,可如果我想求考了最高分的学生的名字以及班级考试成绩的标准差,怎样来做呢? [J], 余瑞旗
4.科技论文中平均差、标准差、标准误和误差线的正确使用 [J], 王海科
5.专业术语:“标准差”和“标准误” [J],
因版权原因,仅展示原文概要,查看原文内容请购买。
SD与SEM区别SD:标准差(Standard Deviation),中⽂环境中⼜常称均⽅差,但不同于均⽅误差(mean squarederror,均⽅误差是各数据偏离真实值的距离平⽅的平均数,也即误差平⽅和的平均数,计算公式形式上接近⽅差,它的开⽅叫均⽅根误差,均⽅根误差才和标准差形式上接近),标准差是离均差平⽅和平均后的⽅根,⽤σ表⽰。
标准差是⽅差的算术平⽅根。
标准差能反映⼀个数据集的离散程度。
平均数相同的,标准差未必相同。
标准差(Standard Deviation),在概率统计中最常使⽤作为统计分布程度(statisticaldispersion)上的测量。
标准差定义是总体各单位标准值与其平均数离差平⽅的算术平均数的平⽅根。
它反映组内个体间的离散程度。
假设有⼀组数值X1,X2,X3,......XN(皆为实数),其平均值(算术平均值)为µ, 标准差也被称为标准偏差,或者实验标准差,公式为 SEM(标准误) 英⽂:Standard Error of Mean 标准误,即样本均数的标准差,是描述均数抽样分布的离散程度及衡量均数抽样误差⼤⼩的尺度,反映的是样本均数之间的变异。
标准误不是标准差,是多个样本平均数的标准差。
标准误⽤来衡量抽样误差。
标准误越⼩,表明样本统计量与总体参数的值越接近,样本对总体越有代表性,⽤样本统计量推断总体参数的可靠度越⼤。
因此,标准误是统计推断可靠性的指标。
标准差与标准误都是数理统计学的内容,两者不但在字⾯上⽐较相近,⽽且两者都是表⽰距离某⼀个标准值或中间值的离散程度,即都表⽰变异程度,但是两者是有着较⼤的区别的。
⾸先要从统计抽样的⽅⾯说起。
现实⽣活或者调查研究中,我们常常⽆法对某类欲进⾏调查的⽬标群体的所有成员都加以施测,⽽只能够在所有成员(即样本)中抽取⼀些成员出来进⾏调查,然后利⽤统计原理和⽅法对所得数据进⾏分析,分析出来的数据结果就是样本的结果,然后⽤样本结果推断总体的情况。
关于excel计算标准差SD和标准误SE的方法
【意义】现在国际杂志很多要求需要提供SE值和SD。
【概念】标准差的名称有10 余种,如总体标准差、母体标准差、均方根误差、均方根偏差、均方误差、均方差、单次测量标准差和理论标准差等。
标准差的定义式为:用样本标准差s 的值作为总体标准差的估计值。
因为样本标准差s 不能直接反映样本平均数?x 与总体平均数u究竟误差多少, 所以, 平均数的误差实质上是样本平均数与总体平均数之间的相对误。
标准差是表示个体间变异大小的指标,反映了整个样本对样本平均数的离散程度,是数据精密度的衡量指标;而标准误反映样本平均数对总体平均数的变异程度,从而反映抽样误差的大小 ,是量度结果精密度的指标。
【计算方法】
Excel中只有计算stand deviation的公式(=stdev()),没有计算stand error的函数。
但是stand error=stand deviation/sqrt(样本数),因此
我们可以使用一个改良的函数来计算标准误:
其在excel中的表达式为:
= STDEV(range of values)/SQRT(number)其中:range of values区域的值是要计算标准误的这些数据; number号码是数据的个数。
均值标准误差均值标准误差(standard error of the mean,SEM)是一种用于衡量样本均值估计精度的统计量。
在统计学中,我们经常需要对总体的均值进行估计,而样本均值则是最常用的估计量之一。
然而,由于样本的随机性,样本均值会存在一定的误差,而均值标准误差就是用来衡量这种误差的指标。
均值标准误差的计算方法如下:SEM = SD / √n。
其中,SEM代表均值标准误差,SD代表样本标准差,n代表样本容量。
从这个公式中可以看出,均值标准误差与样本标准差成正比,与样本容量的平方根成反比。
也就是说,样本的变异程度越大,均值标准误差就会越大;而样本容量越大,均值标准误差就会越小。
均值标准误差在实际应用中具有重要的意义。
首先,它可以用来衡量样本均值估计的精度。
当我们进行样本均值的比较时,如果它们的均值标准误差较大,就意味着它们的均值估计不够精确,需要谨慎对待。
其次,均值标准误差也可以用来计算置信区间。
一般来说,均值加减一个均值标准误差的范围内,就有95%的把握包含了总体均值,这对于统计推断具有重要的意义。
在实际研究中,我们经常会遇到均值标准误差的应用。
比如,某个药物的临床试验结果显示,治疗组和对照组的均值差异为5,而均值标准误差为2。
那么,我们就可以认为这种差异是显著的,因为5相对于2来说是一个较大的差异,远超过了均值标准误差的范围。
除了均值标准误差,我们还需要关注均值标准误差的估计方法。
一般来说,当总体标准差未知时,我们会使用样本标准差来代替总体标准差,从而估计均值标准误差。
此时,我们需要注意样本标准差的计算方法,以及在样本容量较小时,对均值标准误差的修正。
总之,均值标准误差是衡量样本均值估计精度的重要指标,它在统计学和实际应用中具有广泛的意义。
我们需要了解其计算方法和应用场景,从而在实际研究中正确地理解和使用均值标准误差,提高统计推断的准确性和可靠性。
标准差和标准误的选择 (SD) 和 (SEM)
Which error bar should you choose?
It is easy to be confused about the difference between the standard deviation (SD) and standard error of the mean (SEM).
The SD quantifies scatter - how much the values vary from one another.
The SEM quantifies how accurately you know the true mean of the population. The SEM gets smaller as your samples get larger. This makes sense, because the mean of a large sample is likely to be closer to the true population mean than is the mean of a small sample.
The SD does not change predictably as you acquire more data. The SD quantifies the scatter of the data, and increasing the size of the sample does not increase the scatter. The SD might go up or it might go down. You can't predict. On average, the SD will stay the same as sample size gets larger.
If the scatter is caused by biological variability, your probably will want to show the variation. In this case, graph the SD rather than the SEM. You could also instruct Prism to graph the range, with error bars extending from the smallest to largest value. Also consider graphing every value, rather than using error bars.
If you are using an in vitro system with no biological variability, the scatter can only result from experimental imprecision. In this case, you may not want to show the scatter, but instead show how well you have assessed the mean. Graph the mean and SEM or the mean with 95% confidence intervals.
Ideally, the choice of which error bar to show depends on the source of the variability and the point of the experiment. In fact, many scientists always show the mean and SEM, to make the error bars as small as possible.。