曼昆-宏观经济经济学第九版-英文原版答案7
- 格式:docx
- 大小:362.48 KB
- 文档页数:7

✍ how to define and measure consumer surplus.✍ the link between sellers’ costs of producing a good and the supply curve.✍ how to define and measure producer surplus.✍ that the equilibrium of supply and demand maximizes total surplus in a market. CONTEXT AND PURPOSE:Chapter 7 is the first chapter in a three-chapter sequence on welfare economics and market efficiency. Chapter 7 employs the supply and demand model to develop consumer surplus and producer surplus as a measure of welfare and market efficiency. These concepts are then utilized in Chapters 8 and 9 to determine the winners and losers from taxation and restrictions on international trade.The purpose of Chapter 7 is to develop welfare economics—the study of how the allocation of resources affects economic well-being. Chapters 4 through 6 employed supply and demand in a positive framework, which focused on the question, “What is the equilibrium price and quantity in a market?” This chapter now addresses the normative question, “Is the equilibrium price and quantity in a market the best possible solution to the resource allocation problem, or is it simply the price and quantity that balance supply and demand?” Students will discover that under most circumstances the equilibrium price and quantity is also the one that maximizes welfare.KEY POINTS:? Consumer surplus equals buyers’ willingness to pay for a good minus the amount they actually pay for it, and it measures the benefit buyers get from participating in a market.Consumer surplus can be computed by finding the area below the demand curve and above the price.? Producer surplus equals the amount sellers receive for their goods minus their costs of production, and it measures the benefit sellers get from participating in a market. Producer surplus can be computed by finding the area below the price and above the supply curve.? An allocation of resources that maximizes the sum of consumer and producer surplus is said to be efficient. Policymakers are often concerned with the efficiency, as well as the equality, of economic outcomes.? The equilibrium of supply and demand maximizes the sum of consumer and producer surplus.That is, the invisible hand of the marketplace leads buyers and sellers to allocate resources efficiently.? Markets do not allocate resources efficiently in the presence of market failures such as market power or externalities.CHAPTER OUTLINE:I. Definition of welfare economics: the study of how the allocation of resources affects economic well-being.A. Willingness to Pay1. Definition of willingness to pay: the maximum amount that a buyer will pay for a good.2. Example: You are auctioning a mint-condition recording of Elvis Presley’s first album. Four buyers show up. Their willingness to pay is as follows:for John. Because John is willing to pay more than he has to for the album,he derives some benefit from participating in the market.3. Definition of consumer surplus: the amount a buyer is willing to pay for a good minus the amount the buyer actually pays for it.4. Note that if you had more than one copy of the album, the price in the auction would end up being lower (a little over $70 in the case of two albums) and both John and Paul would gain consumer surplus.B. Using the Demand Curve to Measure Consumer Surplus1. We can use the information on willingness to pay to derive a demand curve for the rare2. . Because the demand curve shows the buyers’ willingness to pay, we can use the demand curve to measure consumer surplus.C. How a Lower Price Raises Consumer Surplusare paying less for the product than before (area A on the graph).b. Because the price is now lower, some new buyers will enter the market and receive consumer surplus on these additional units of output purchased (area B on the graph).D. What Does Consumer Surplus Measure?1. Remember that consumer surplus is the difference between the amount that buyers are willing to pay for a good and the price that they actually pay.2. Thus, it measures the benefit that consumers receive from the good as the buyers themselves perceive it.III. Producer SurplusA. Cost and the Willingness to Sell1. Definition of cost: the value of everything a seller must give up to produce a good .2. Example: You want to hire someone to paint your house. You accept bids for the work from four sellers. Each painter is willing to work if the price you will pay exceeds her opportunity cost. (Note that this opportunity cost thus represents willingness to sell.) The costs are: ALTERNATIVE CLASSROOM EXAMPLE:Review the material on price ceilings from Chapter 6. Redraw the market for two-bedroom apartments in your town. Draw in a price ceiling below the equilibriumprice.Then go through:✍ consumer surplus before the price ceiling is put into place.✍ consumer surplus after the price ceiling is put into place.You will need to take some time to explain the relationship between the producers’ willingness to sell and the cost of producing the good. The relationship between cost and the supply curve is not as apparent as the relationship between the demand curve and willingness to pay. It is important to stress that consumer surplus is measured in monetary terms. Consumer surplus gives us a way to place a monetary cost on inefficient market outcomes (due to government involvement or market failure).except for Grandma. Because Grandma receives more than she would require to paint the house, she derives some benefit from producing in the market.4.Definition of producer surplus: the amount a seller is paid for a good minus the seller’s cost of providing it.5. Note that if you had more than one house to paint, the price in the auction would end up being higher (a little under $800 in the case of two houses) and both Grandma and Georgia would gain producer surplus.B. Using the Supply Curve to Measure Producer Surplus1. We can use the information on cost (willingness to sell) to derive a supply curve for2. marginal seller . Because the supply curve shows the sellers’ cost (willingness to sell), we can use the supply curve to measure producer surplus.are receiving more for the product than before (area C on the graph).b. Because the price is now higher, some new sellers will enter the market and receive producer surplus on these additional units of output sold (area D on the graph).D. Producer surplus is used to measure the economic well-being of producers, much like consumer surplus is used to measure the economic well-being of consumers.ALTERNATIVE CLASSROOM EXAMPLE:Review the material on price floors from Chapter 6. Redraw the market for anagricultural product such as corn. Draw in a price support above the equilibriumprice.Then go through:✍ producer surplus before the price support is put in place.✍ producer surplus after the price support is put in place.Make sure that you discuss the cost of the price support to taxpayers.IV.Market EfficiencyA. The Benevolent Social Planner1. The economic well-being of everyone in society can be measured by total surplus, which is the sum of consumer surplus and producer surplus:Total Surplus = Consumer Surplus + Producer SurplusTotal Surplus = (Value to Buyers – Amount Paid by Buyers) +(Amount Received by Sellers – Cost to Sellers)Because the Amount Paid by Buyers = Amount Received bySellers:2. Definition of efficiency: the property of a resource allocation of maximizing the total surplus received by all members of society .3. Definition of equality: the property of distributing economic prosperity uniformly the members of society .a. Buyers who value the product more than the equilibrium price will purchase the product; those who do not, will not purchase the product. In other words, the free market allocates the supply of a good to the buyers who value it most highly, as measured by their willingness to pay.b. Sellers whose costs are lower than the equilibrium price will produce the product; those whose costs are higher, will not produce the product. In other words, the free market allocates the demand for goods to the sellers who can produce it at the lowest cost.to the marginal buyer is greater than the cost to the marginal seller so total surplus would rise if output increases.b. At any quantity of output greater than the equilibrium quantity, the value of the product to the marginal buyer is less than the cost to the marginal seller so total surplus would rise if output decreases.3. Note that this is one of the reasons that economists believe Principle #6: Markets are usually a good way to organize economic activity.It would be a good idea to remind students that there are circumstances whenthe market process does not lead to the most efficient outcome. Examplesinclude situations such as when a firm (or buyer) has market power over priceor when there are externalities present. These situations will be discussed inlater chapters.Pretty Woman, Chapter 6. Vivien (Julia Roberts) and Edward (Richard Gere)negotiate a price. Afterward, Vivien reveals she would have accepted a lowerprice, while Edward admits he would have paid more. If you have done a goodjob of introducing consumer and producer surplus, you will see the light bulbsgo off above your students’ heads as they watch this clip.C. In the News: Ticket Scalping1. Ticket scalping is an example of how markets work to achieve an efficient outcome.2. This article from The Boston Globe describes economist Chip Case’s experience with ticket scalping.D. Case Study: Should There Be a Market in Organs?1. As a matter of public policy, people are not allowed to sell their organs.a. In essence, this means that there is a price ceiling on organs of $0.b. This has led to a shortage of organs.2. The creation of a market for organs would lead to a more efficient allocation of resources, but critics worry about the equity of a market system for organs.V. Market Efficiency and Market FailureA. To conclude that markets are efficient, we made several assumptions about how markets worked.1. Perfectly competitive markets.2. No externalities.B. When these assumptions do not hold, the market equilibrium may not be efficient.C. When markets fail, public policy can potentially remedy the situation. SOLUTIONS TO TEXT PROBLEMS:Quick Quizzes1. Figure 1 shows the demand curve for turkey. The price of turkey is P1 and the consumer surplus that results from that price is denoted CS. Consumer surplus is the amount a buyer is willing to pay for a good minus the amount the buyer actually pays for it. It measures the benefit to buyers of participating in a market.Figure 1 Figure 22. Figure 2 shows the supply curve for turkey. The price of turkey is P1 and the producer surplus that results from that price is denoted PS. Producer surplus is the amount sellers are paid for a good minus the sellers’ cost of providing it (measured by the supply curve). It measures the benefit to sellers of participating in a market.Figure 33. Figure 3 shows the supply and demand for turkey. The price of turkey is P1, consumer surplus is CS, and producer surplus is PS. Producing more turkeys than the equilibrium quantity would lower total surplus because the value to the marginal buyer would be lower than the cost to the marginal seller on those additional units.Questions for Review1. The price a buyer is willing to pay, consumer surplus, and the demand curve are all closely related. The height of the demand curve represents the willingness to pay of the buyers. Consumer surplus is the area below the demand curve and above the price, which equals the price that each buyer is willing to pay minus the price actually paid.2. Sellers' costs, producer surplus, and the supply curve are all closely related. The height of the supply curve represents the costs of the sellers. Producer surplus is the area below the price and above the supply curve, which equals the price received minus each seller's costs of producing the good.Figure 43. Figure 4 shows producer and consumer surplus in a supply-and-demand diagram.4. An allocation of resources is efficient if it maximizes total surplus, the sum of consumer surplus and producer surplus. But efficiency may not be the only goal of economic policymakers; they may also be concerned about equity the fairness of the distribution of well-being.5. The invisible hand of the marketplace guides the self-interest of buyers and sellers into promoting general economic well-being. Despite decentralized decision making and self-interested decision makers, free markets often lead to an efficient outcome.6. Two types of market failure are market power and externalities. Market power may cause market outcomes to be inefficient because firms may cause price and quantity to differ from the levels they would be under perfect competition, which keeps total surplus from being maximized. Externalities are side effects that are not taken into account by buyers and sellers. As a result, the free market does not maximize total surplus.Problems and Applications1. a. Consumer surplus is equal to willingness to pay minus the price paid. Therefore, Melissa’s willingness to pay must be $200 ($120 + $80).b. Her consumer surplus at a price of $90 would be $200 ? $90 = $110.c. If the price of an iPod was $250, Melissa would not have purchased one because the price is greater than her willingness to pay. Therefore, she would receive no consumer surplus.2. If an early freeze in California sours the lemon crop, the supply curve for lemons shifts to the left, as shown in Figure 5. The result is a rise in the price of lemons and a decline in consumer surplus from A + B + C to just A. So consumer surplus declines by the amount B + C.Figure 5 Figure 6In the market for lemonade, the higher cost of lemons reduces the supply of lemonade, as shown in Figure 6. The result is a rise in the price of lemonade and a decline in consumer surplus from D + E + F to just D, a loss of E + F. Note that an event that affects consumer surplus in one market often has effects on consumer surplus in other markets.3. A rise in the demand for French bread leads to an increase in producer surplus in the market for French bread, as shown in Figure 7. The shift of the demand curve leads to an increased price, which increases producer surplus from area A to area A + B + C.Figure 7The increased quantity of French bread being sold increases the demand for flour, as shown in Figure 8. As a result, the price of flour rises, increasing producer surplus from area Dto D + E + F. Note that an event that affects producer surplus in one market leads to effects on producer surplus in related markets.Figure 84. a.Figure 9b. When the price of a bottle of water is $4, Bert buys two bottles of water. His consumer surplus is shown as area A in the figure. He values his first bottle of water at $7, but pays only $4 for it, so has consumer surplus of $3. He values his second bottle of water at $5, but pays only $4for it, so has consumer surplus of $1. Thus Bert’s total consumer surplus is $3 + $1 = $4, which is the area of A in the figure.c. When the price of a bottle of water falls from $4 to $2, Bert buys three bottles of water, an increase of one. His consumer surplus consists of both areas A and B in the figure, an increase in the amount of area B. He gets consumer surplus of $5 from the first bottle ($7 value minus $2 price), $3 from the second bottle ($5 value minus $2 price), and $1 from the third bottle ($3 value minus $2 price), for a total consumer surplus of $9. Thus consumer surplus rises by $5 (which is the size of area B) when the price of a bottle of water falls from $4 to $2.5. a.Figure 10b. When the price of a bottle of water is $4, Ernie sells two bottles of water. His producer surplus is shown as area A in the figure. He receives $4 for his first bottle of water, but it costs only $1 to produce, so Ernie has producer surplus of $3. He also receives $4 for his second bottle of water, which costs $3 to produce, so he has producer surplus of $1. Thus Ernie’s total producer surplus is $3 + $1 = $4, which is the area of A in the figure.c. When the price of a bottle of water rises from $4 to $6, Ernie sells three bottles of water, an increase of one. His producer surplus consists of both areas A and B in the figure, an increase by the amount of area B. He gets producer surplus of $5 from the first bottle ($6 price minus $1 cost), $3 from the second bottle ($6 price minus $3 cost), and $1 from the third bottle ($6 price minus $5 price), for a total producer surplus of $9. Thus producer surplus rises by $5 (which is the size of area B) when the price of a bottle of water rises from $4 to $6.6. a. From Ernie’s supply schedule and Bert’s demand schedule, the quantityequilibrium quantity of two.b. At a price of $4, consumer surplus is $4 and producer surplus is $4, as shown in Problems 3 and 4 above. Total surplus is $4 + $4 = $8.c. If Ernie produced one less bottle, his producer surplus would decline to $3, as shown in Problem 4 above. If Bert consumed one less bottle, his consumer surplus would decline to $3, as shown in Problem 3 above. So total surplus would decline to $3 + $3 = $6.d. If Ernie produced one additional bottle of water, his cost would be $5, but the price is only $4, so his producer surplus would decline by $1. If Bert consumed one additional bottle of water, his value would be $3, but the price is $4, so his consumer surplus would decline by $1. So total surplus declines by $1 + $1 = $2.7. a. The effect of falling production costs in the market for stereos results in a shift to the right in the supply curve, as shown in Figure 11. As a result, the equilibrium price of stereos declines and the equilibrium quantity increases.Figure 11b. The decline in the price of stereos increases consumer surplus from area A to A + B + C + D, an increase in the amount B + C + D. Prior to the shift in supply, producer surplus was areas B + E (the area above the supply curve and below the price). After the shift in supply, producer surplus is areas E + F + G. So producer surplus changes by the amount F + G – B, which may be positive or negative. The increase in quantity increases producer surplus, while the decline in the price reduces producer surplus. Because consumer surplus rises by B + C + D and producer surplus rises by F + G – B, total surplus rises by C + D + F + G.c. If the supply of stereos is very elastic, then the shift of the supply curve benefits consumers most. To take the most dramatic case, suppose the supply curve were horizontal, as shown in Figure 12. Then there is no producer surplus at all. Consumers capture all the benefits of falling production costs, with consumer surplus rising from area A to area A + B.Figure 128. Figure 13 shows supply and demand curves for haircuts. Supply equals demand at a quantity of three haircuts and a price between $4 and $5. Firms A, C, and D should cut the hair of Ellen, Jerry, and Phil. Oprah’s willingness to pay is too low and firm B’s costs are too high, so they do not participate. The maximum total surplus is the area between the demand and supply curves, which totals $11 ($8 value minus $2 cost for the first haircut, plus $7 value minus $3 cost for the second, plus $5 value minus $4 cost for the third).Figure 139. a. The effect of falling production costs in the market for computers results in a shift to the right in the supply curve, as shown in Figure 14. As a result, the equilibrium price of computers declines and the equilibrium quantity increases. The decline in the price of computers increases consumer surplus from area A to A + B + C + D, an increase in the amount B + C + D.Figure 14 Figure 15Prior to the shift in supply, producer surplus was areas B + E (the area above thesupply curve and below the price). After the shift in supply, producer surplus isareas E + F + G. So producer surplus changes by the amount F + G – B, whichmay be positive or negative. The increase in quantity increases producer surplus,while the decline in the price reduces producer surplus. Because consumer surplusrises by B + C + D and producer surplus rises by F + G – B, total surplus rises byC +D + F + G.b. Because typewriters are substitutes for computers, the decline in the price of computers means that people substitute computers for typewriters, shifting the demand for typewriters to the left, as shown in Figure 15. The result is a decline in both the equilibrium price and equilibrium quantity of typewriters. Consumer surplus in the typewriter market changes from area A + B to A + C, a net change of C – B. Producer surplus changes from area C + D + E to area E, a net loss of C + D. Typewriter producers are sad about technological advances in computers because their producer surplus declines.c. Because software and computers are complements, the decline in the price and increase in the quantity of computers means that the demand for software increases, shifting the demand for software to the right, as shown in Figure 16. The result is an increase in both the price and quantity of software. Consumer surplus in the software market changes from B + C to A + B, anet change of A – C. Producer surplus changes from E to C + D + E, an increase of C + D, so software producers should be happy about the technological progress in computers.Figure 16d. Yes, this analysis helps explain why Bill Gates is one the world’s richest people, because his company produces a lot of software that is a complement with computers and there has been tremendous technological advance in computers.10. a. With Provider A, the cost of an extra minute is $0. With Provider B, the cost of anextra minute is $1.b. With Provider A, my friend will purchase 150 minutes [= 150 – (50)(0)]. WithProvider B, my friend would purchase 100 minutes [= 150 – (50)(1)].c. With Provider A, he would pay $120. The cost would be $100 with Provider B.Figure 17d. Figure 17 shows the friend’s demand. With Provider A, he buys 150 minutes andhis consumer surplus is equal to (1/2)(3)(150) – 120 = 105. With Provider B, hisconsumer surplus is equal to (1/2)(2)(100) = 100.e. I would recommend Provider A because he receives greater consumer surplus.11. a. Figure 18 illustrates the demand for medical care. If each procedure has a price of $100, quantity demanded will be Q1 procedures.Figure 18b. If consumers pay only $20 per procedure, the quantity demanded will be Q2 procedures. Because the cost to society is $100, the number of procedures performed is too large to maximize total surplus. The quantity that maximizes total surplus is Q1 procedures, which is less than Q2.c. The use of medical care is excessive in the sense that consumers get procedures whose value is less than the cost of producing them. As a result, the economy’s total surplus is reduced.d. To prevent this excessive use, the consumer must bear the marginal cost of the procedure. But this would require eliminating insurance. Another possibility would be that the insurance company, which pays most of the marginal cost of the procedure ($80, in this case) could decide whether the procedure should be performed. But the insurance company does not get the benefits of the procedure, so its decisions may not reflect the value to the consumer.。
CHAPTER 7ECONOMIC GROWTH AND INTERNATIONAL TRADEOUTLINE7.1 Introduction7.2 Growth of Factors of Production7.2a Labor Growth and Capital Accumulation Over Time7.2b The Rybczynski Theorem7.3 Technical Progress7.3a Neutral, Labor-Saving, and Capital-Saving Technical Progress7.3b Technical Progress and the Nation's Production FrontierCase Study 7-1: Changes in Relative Resource Endowments of Various Countries and RegionsCase Study 7-2: Change in Capital-Labor Rations in Selected Countries7.4 Growth and Trade: The Small Country Case7.4a The Effects of Growth on Trade7.4b Illustration of Factor Growth, Trade, and Welfare7.4c Technical Progress, Trade, and WelfareCase Study 7-3: Growth of Output per Worker from Capital Deepening, Technological Change, and Improvements in Efficiency7.5 Growth and Trade: The Large-Country Case7.5a Growth and the Nation's Terms of Trade and Welfare7.5b Immiserizing Growth7.5c Illustration of Beneficial Growth and TradeCase Study 7-4: Growth, Trade, and the Giants of the Future7.6 Growth, Change in Tastes, and Trade in Both Nations7.6a Growth and Trade in Both Nations7.6b Change in Tastes and Trade in Both NationsCase Study 7-5: Change in the Revealed Comparative Advantage of Various Countries or RegionsCase Study 7-6: Growth, Trade, and Welfare in the Leading Industrial NationsAppendix: A7.1 Formal Proof of Rybczynski TheoremA7.2 Growth with Factor ImmobilityA7.3 Graphical Analysis of Hicksian Technical ProgressKey TermsComparative statics Antitrade production and consumptionDynamic analysis Neutral production and consumption Balanced growth Normal goodsRybczynski theorem Inferior goodsLabor-saving technical progress Terms-of-trade effectCapital-saving technical progress Wealth effectProtrade production and consumption Immiserizing growthLecture Guide1.This is not a core chapter and it is one of the most challenging chapters ininternational tradetheory. It is included for more advanced students and for completeness.2.If I were to cover this chapter, I would present two sections in each of threelectures.Time permitting, I would, otherwise cover Sections 1 and 2, paying special attention to theRybczynski theorem.Answer to Problems1. a) See Figure 1.b) See Figure 2c) See Figure 3.2. See Figure 4.3. a) See Figure 5.b) See Figure 6.c) See Figure 7.4. Compare Figure 5 to Figure 1.Compare Figure 6 to Figure 3. Note that the two production frontiers have the same verticalor Y intercept in Figure 6 but a different vertical or Y intercept in Figure 3.Compare Figure 7 to Figure 2. Note that the two production frontiers have the samehorizontal or X intercept in Figure 7 but a different horizontal or X intercept in Figure 2.5. See Figure 8 on page 66.6. See Figure 9.7. See Figure 10.8. See Figure 11.9. See Figure 12.10. See Figure 13 on page 67.11. See Figure 14.12. See Figure 15.13.The United States has become the most competitive economy in the worldsince the early1990’s while the data in Table 7.3 refers to the 1965-1990 period.14.The data in Table 7.4 seem to indicate that China had a comparativeadvantage in capital-intensive commodities and a comparative disadvantage in unskilled-labor intensive commodities in 1973. This was very likely due to the many trade restrictions and subsidies, which distorted the comparative advantage of China. Its truecomparative advantage became evident by 1993 after China had started to liberalize its economy.App. 1a. See Figure 16.1b. For production and consumption to actually occur at the new equilibrium point after the doubling of K in Nation 2, we must assume either than commodity X is inferior or that Nation 2 is too small to affect the relative commodity prices at which it trades.1c. Px/Py must rise (i.e., Py/Px must fall) as a result of growth only.Px/Py will fall even more with trade.1. If the supply of capital increases in Nation 1 in the production of commodity Yonly, the VMPLy curve shifts up, and w rises in both industries. Some labor shiftsto the production of Y, the output of Y rises and the output of X falls, r falls, andPx/Py is likely to rise.2. Capital investments tend to increase real wages because they raise the K/L ratio and the productivity of labor. Technical progress tends to increase K/L and real wages if it is L-saving and to reduce K/L and real wages if it is K-saving.Multiple-Choice Questions1. Dynamic factors in trade theory refer to changes in:a. factor endowmentsb. technologyc. tastes*d. all of the above2. Doubling the amount of L and K under constant returns to scale:a. doubles the output of the L-intensive commodityb. doubles the output of the K-intensive commodityc. leaves the shape of the production frontier unchanged*d. all of the above.3. Doubling only the amount of L available under constant returns to scale:a. less than doubles the output of the L-intensive commodity*b. more than doubles the output of the L-intensive commodityc. doubles the output of the K-intensive commodityd. leaves the output of the K-intensive commodity unchanged4. The Rybczynski theorem postulates that doubling L at constant relative commodity prices:a. doubles the output of the L-intensive commodity*b. reduces the output of the K-intensive commodityc. increases the output of both commoditiesd. any of the above5. Doubling L is likely to:a. increases the relative price of the L-intensive commodityb. reduces the relative price of the K-intensive commodity*c. reduces the relative price of the L-intensive commodityd. any of the above6.Technical progress that increases the productivity of L proportionatelymore than theproductivity of K is called:*a. capital savingb. labor savingc. neutrald. any of the above7. A 50 percent productivity increase in the production of commodity Y:a. increases the output of commodity Y by 50 percentb. does not affect the output of Xc. shifts the production frontier in the Y direction only*d. any of the above8. Doubling L with trade in a small L-abundant nation:*a. reduces the nation's social welfareb. reduces the nation's terms of tradec. reduces the volume of traded. all of the above9. Doubling L with trade in a large L-abundant nation:a. reduces the nation's social welfareb. reduces the nation's terms of tradec. reduces the volume of trade*d. all of the above10.If, at unchanged terms of trade, a nation wants to trade more aftergrowth, then thenation's terms of trade can be expected to:*a. deteriorateb. improvec. remain unchangedd. any of the above11. A proportionately greater increase in the nation's supply of labor than ofcapital is likelyto result in a deterioration in the nation's terms of trade if the nation exports:a. the K-intensive commodity*b. the L-intensive commodityc. either commodityd. both commodities12. Technical progress in the nation's export commodity:*a. may reduce the nation's welfareb. will reduce the nation's welfarec. will increase the nation's welfared. leaves the nation's welfare unchanged13. Doubling K with trade in a large L-abundant nation:a. increases the nation's welfareb. improves the nation's terms of tradec. reduces the volume of trade*d. all of the above14. An increase in tastes for the import commodity in both nations:a. reduces the volume of trade*b. increases the volume of tradec. leaves the volume of trade unchangedd. any of the above15. An increase in tastes of the import commodity of Nation A and export in B:*a. will reduce the terms of trade of Nation Ab. will increase the terms of trade of Nation Ac. will reduce the terms of trade of Nation Bd. any of the aboveADDITIONAL ESSAYS AND PROBLEMS FOR PART ONE1.Assume that both the United States and Germany produce beef andcomputer chips with the following costs:United States Germany(dollars) (marks)Unit cost of beef (B) 2 8Unit cost of computer chips (C) 1 2a) What is the opportunity cost of beef (B) and computer chips (C) in each country?b)In which commodity does the United States have a comparativecost advantage?What about Germany?c)What is the range for mutually beneficial trade between the UnitedStates and Germany for each computer chip traded?d)How much would the United States and Germany gain if 1 unit ofbeef is exchanged for 3 chips?Ans. a) In the United States:the opportunity cost of one unit of beef is 2 chips;the opportunity cost of one chip is 1/2 unit of beef.In Germany:the opportunity cost of one unit of beef is 4 chips;the opportunity cost of one chip is 1/4 unit of beef.b) The United States has a comparative cost advantage in beef with respect to Germany, while Germany has a comparative cost advantage in computer chips.c)The range for mutually beneficial trade between the United Statesand Germany for each unit of beef that the United States exports is2C < 1B < 4Cd) Both the United States and Germany would gain 1 chip for each unit of beef traded.2.Given: (1) two nations (1 and 2) which have the same technology butdifferent factor endowments and tastes, (2) two commodities (X and Y) produced under increasing costs conditions, and (3) no transportation costs, tariffs, or other obstructions to trade. Prove geometrically that mutually advantageous trade between the two nations is possible.Note: Your answer should show the autarky (no-trade) and free-trade points of production and consumption for each nation, the gains from trade of each nation, and express the equilibrium condition that should prevail when trade stops expanding.)Ans.: See Figure 1 on page 74.Nations 1 and 2 have different production possibilities curves and different community indifference maps. With these, they will usually endup with different relative commodity prices in autarky, thus making mutually beneficial trade possible.In the figure, Nation 1 produces and consumes at point A and Px/Py=P A in autarky,while Nation 2 produces and consumes at point A' and Px/Py=P A'. Since P A < P A',Nation 1 has a comparative advantage in X and Nation 2 in Y. Specialization inproduction proceeds until point B in Nation 1 and point B' in Nation 2, at which P B=P B' and the quantity supplied for export of each commodity exactly equals the quantity demanded for import. Thus, Nation 1 starts at point A in production and consumption in autarky, moves to point B in production, and by exchanging BC of X for CE of Y reaches point E in consumption. E > A since it involves more of both X and Y and lies on a higher community indifference curve. Nation 2 starts at A' in production and consumption in autarky, moves to point B' in production, and by exchanging B'C' of Y for C'E' of X reaches point E'in consumption (which exceeds A').At Px/Py=P B=P B', Nation 1 wants to export BC of X for CE of Y, while Nation 2 wants to export B'C' (=CE) of Y for C'E' (=BC) of X. Thus, P B=P B' is the equilibrium relative commodity price because it clears both (the X and Y) markets.3.Draw a figure showing: (1) in Panel A a nation's demand and supplycurve for A traded commodity and the nation's excess supply of the commodity, (2) in Panel C the trade partner's demand and supply curve for the same traded commodity and its excess demand for the commodity, and (3) in Panel B the supply and demand for the quantity traded of the commodity, its equilibrium price, and why aprice above or below the equilibrium price will not persist. At any other price, QD QS, and P will change to P2.Ans. See Figure 2 on page 74.The equilibrium relative commodity price for commodity X (the tradedcommodityexported by Nation 1 and imported by Nation 2) is P2 and theequilibrium quantityof commodity X traded is Q2.4.a) Identify the conditions that may give rise to trade between twonations.b) What are some of the assumptions on which the Heckscher-Ohlin theory is based?c) What does this theory say about the pattern of trade and effect of trade on factor prices?Ans. a) Trade can be based on a difference in factor endowments, technology, or tastes between two nations. A difference either in factor endowments or technology results in a different production possibilities frontier for each nation, which, unless neutralized by a difference in tastes, leads to a difference in relative commodity price and mutually beneficial trade. If two nations face increasing costs and have identical production possibilities frontiers but different tastes, there will also be a difference in relative commodity prices and the basis for mutually beneficial trade between the two nations. The difference in relative commodity prices is then translated into a difference in absolute commodity prices between the two nations, which is the immediate cause of trade.b) The Heckscher-Ohlin theory (sometimes referred to as the modern theory – asopposed to the classical theory - of international trade) assumes that nations have the same tastes, use the same technology, face constant returns to scale (i.e., a given percentage increase in all inputs increases output by the same percentage) but differ widely in factor endowments. It also says that in the face of identical tastes or demand conditions, this difference in factor endowments will result in a difference in relative factor prices between nations, which in turn leads to a difference in relative commodity prices and trade. Thus, in the Heckscher-Ohlin theory, the international difference in supply conditions alone determines the pattern of trade. To be noted is that the two nations need not be identical in other respects in order for international trade to be based primarily on the difference in their factor endowments.c) The Heckscher-Ohlin theorem postulates that each nation will export the commodity intensive in its relatively abundant and cheap factor and import the commodity intensive in its relatively scarce and expensive factor. As an important corollary, it adds that under highly restrictive assumptions, trade will completely eliminate the pretrade relative and absolute differences in the price of homogeneous factors among nations. Under less restrictive and more usual conditions, however, trade will reduce, but not eliminate, the pretrade differences in relative and absolute f actor prices among nations. In any event, the Heckscher-Ohlin theory does say something very useful on how trade affects factor prices and the distribution of income in each nation. Classical economists were practically silent on this point.5. consumers demand more of commodity X (the L-intensive commodity)and less of commodity Y (the K- intensive commodity). Suppose that Nation 1 is India, commodity X is textiles, and commodity Y is food. Starting from the no-trade equilibrium position and using the Heckscher-Ohlin model, trace the effect of this change in tastes on India's(a) relative commodity prices and demand for food and textiles,(b) production of both commodities and factor prices, and(c) comparative advantage and volume of trade.(d) Do you expect international trade to lead to the completeequalization of relative commodity and factor prices between India and the United States? Why?Ans. a. The change in tastes can be visualized by a shift toward the textile axis in India's indifference map in such a way that an indifference curve is tangent to the steeper segment ofIndia's production frontier (because of increasing opportunity costs) after the increase in demand for textiles. This will causethe pretrade relative commodity price of textiles to rise in India.b. The increase in the relative price of textiles will lead domestic producers in India to shift labor and capital from the production of food to the production of textiles. Since textiles are L-intensive in relation to food, the demand for labor and therefore the wage rate will rise in India. At thesame time, as the demand for food falls, the demand for and thus the price of capital will fall. With labor becoming relative more expensive, producers in India will substitute capital for labor in the production of both textiles and food.Even with the rise in relative wages and in the relative price of textiles, India still remains the L-abundant and low-wage nation with respect to a nation such as the United States. However, the pretrade difference in the relative price of textiles between India and the United States is nowsomewhat smaller than before the change in tastes in India. As a result the volume of trade required to equalize relative commodity prices and hence factor prices is smaller than before. That is, India need now export a smaller quantity of textiles and import less food than before for the relative price of textiles in India and the United States to be equalized.Similarly, the gap between real wages and between India and the United States is now smaller and can be more quickly and easily closed (i.e., with a smaller volume of trade).c. Since many of the assumptions required for the completeequalization of relative commodity and factor pricesdo not hold in the real world, great differences can be expected and do in fact remain between real wages inIndia and the United States. Nevertheless, trade would tend to reduce these differences, and the H-O model does identify the forces that must be considered to analyze the effect of trade on the differences in the relative and absolutecommodity and factor prices between India and the United States.5.(a) Explain why the Heckscher-Ohlin trade model needs to beextended.(b) Indicate in what important ways the Heckscher-Ohlin trade modelcan be extended.(c) Explain what is meant by differentiated products and intra-industry trade.Ans. (a) The Heckscher-Ohlin trade model needs to be extended because, while generally correct, it fails to explain a significant portion of international trade, particularly the trade in manufactured products among industrial nations.(b)The international trade left unexplained by the basic Heckscher-Ohlin trade mode can be explained by(1) economies of scale,(2) intra-industry trade, and(3) trade based on imitation gaps and product differentiation.(c)Differentiated products refer to similar, but not identical, products(such as cars,typewriters, cigarettes, soaps, and so on) produced by the same industry or broadproduct group. Intra-industry trade refers to the international trade in differentiatedproducts.。
A n s w e r s t o T e x t b o o k Q u e s t i o n s a n d P r o b l e m s CHAPTER 7?Unemployment and the Labor MarketQuestions for Review1. The rates of job separation and job finding determine the natural rate of unemployment. The rate of jobseparation is the fraction of people who lose their job each month. The higher the rate of job separation, the higher the natural rate of unemployment. The rate of job finding is the fraction of unemployed people who find a job each month. The higher the rate of job finding, the lower the natural rate ofunemployment.2. Frictional unemployment is the unemployment caused by the time it takes to match workers and jobs.Finding an appropriate job takes time because the flow of information about job candidates and job vacancies is not instantaneous. Because different jobs require different skills and pay different wages, unemployed workers may not accept the first job offer they receive.In contrast, structural unemployment is the unemployment resulting from wage rigidity and job rationing. These workers are unemployed not because they are actively searching for a job that best suits their skills (as in the case of frictional unemployment), but because at the prevailing real wage the quantity of labor supplied exceeds the quantity of labor demanded. If the wage does not adjust to clear the labor market, then these workers must wait for jobs to become available. Structural unemployment thus arises because firms fail to reduce wages despite an excess supply of labor.3. The real wage may remain above the level that equilibrates labor supply and labor demand because ofminimum wage laws, the monopoly power of unions, and efficiency wages.Minimum-wage laws cause wage rigidity when they prevent wages from falling to equilibrium levels. Although most workers are paid a wage above the minimum level, for some workers, especially the unskilled and inexperienced, the minimum wage raises their wage above the equilibrium level. It therefore reduces the quantity of their labor that firms demand, and creates an excess supply ofworkers, which increases unemployment.The monopoly power of unions causes wage rigidity because the wages of unionized workers are determined not by the equilibrium of supply and demand but by collective bargaining between union leaders and firm management. The wage agreement often raises the wage above the equilibrium level and allows the firm to decide how many workers to employ. These high wages cause firms to hire fewer workers than at the market-clearing wage, so structural unemployment increases.Efficiency-wage theories suggest that high wages make workers more productive. The influence of wages on worker efficiency may explain why firms do not cut wages despite an excess supply of labor. Even though a wage reduction decreases th e firm’s wage bill, it may also lower workerproductivity and therefore the firm’s profits.4. Depending on how one looks at the data, most unemployment can appear to be either short term orlong term. Most spells of unemployment are short; that is, most of those who became unemployed find jobs quickly. On the other hand, most weeks of unemployment are attributable to the small number of long-term unemployed. By definition, the long-term unemployed do not find jobs quickly, so they appear on unemployment rolls for many weeks or months.5. Europeans work fewer hours than Americans. One explanation is that the higher income tax rates inEurope reduce the incentive to work. A second explanation is a larger underground economy in Europe as a result of more people attempting to evade the high tax rates. A third explanation is the greater importance of unions in Europe and their ability to bargain for reduced work hours. A final explanation is based on preferences, whereby Europeans value leisure more than Americans do, and therefore elect to work fewer hours.Problems and Applications1. a. In the example that follows, we assume that during the school year you look for a part-time job,and that, on average, it takes 2 weeks to find one. We also assume that the typical job lasts 1semester, or 12 weeks.b. If it takes 2 weeks to find a job, then the rate of job finding in weeks isf = (1 job/2 weeks) = 0.5 jobs/week.If the job lasts for 12 weeks, then the rate of job separation in weeks iss = (1 job/12 weeks) = 0.083 jobs/week.c. From the text, we know that the formula for the natural rate of unemployment is(U/L) = [s/(s + f )],where U is the number of people unemployed, and L is the number of people in the labor force.Plugging in the values for f and s that were calculated in part (b), we find(U/L) = [0.083/(0.083 + 0.5)] = 0.14.Thus, if on average it takes 2 weeks to find a job that lasts 12 weeks, the natural rate ofunemployment for this population of college students seeking part-time employment is 14 percent.2. Call the number of residents of the dorm who are involved I, the number who are uninvolved U, and thetotal number of students T = I + U. In steady state the total number of involved students is constant.For this to happen we need the number of newly uninvolved students, (0.10)I, to be equal to thenumber of students who just became involved, (0.05)U. Following a few substitutions:(0.05)U = (0.10)I= (0.10)(T – U),soWe find that two-thirds of the students are uninvolved.3. To show that the unemployment rate evolves over time to the steady-state rate, let’s begin by defininghow the number of people unemployed changes over time. The change in the number of unemployed equals the number of people losing jobs (sE) minus the number finding jobs (fU). In equation form, we can express this as:U t + 1–U t= ΔU t + 1 = sE t–fU t.Recall from the text that L = E t + U t, or E t = L –U t, where L is the total labor force (we will assume that L is constant). Substituting for E t in the above equation, we findΔU t + 1 = s(L –U t) –fU t.Dividing by L, we get an expression for the change in the unemployment rate from t to t + 1:ΔU t + 1/L = (U t + 1/L) – (U t/L) = Δ[U/L]t + 1 = s(1 –U t/L) –fU t/L.Rearranging terms on the right side of the equation above, we end up with line 1 below. Now take line1 below, multiply the right side by (s + f)/(s + f) and rearrange terms to end up with line2 below:Δ[U/L]t + 1= s – (s + f)U t/L= (s + f)[s/(s + f) – U t/L].The first point to note about this equation is that in steady state, when the unemployment rate equals its natural rate, the left-hand side of this expression equals zero. This tells us that, as we found in the text, the natural rate of unemployment (U/L)n equals s/(s + f). We can now rewrite the above expression, substituting (U/L)n for s/(s + f), to get an equation that is easier to interpret:Δ[U/L]t + 1 = (s + f)[(U/L)n–U t/L].This expression shows the following:? If U t/L > (U/L)n (that is, the unemployment rate is above its natural rate), then Δ[U/L]t + 1 is negative: the unemployment rate falls.? If U t/L < (U/L)n (that is, the unemployment rate is below its natural rate), then Δ[U/L]t + 1 is positive: the unemployment rate rises.This process continues until the unemployment rate U/L reaches the steady-state rate (U/L)n.4. Consider the formula for the natural rate of unemployment,If the new law lowers the chance of separation s, but has no effect on the rate of job finding f, then the natural rate of unemployment falls.For several reasons, however, the new law might tend to reduce f. First, raising the cost of firing might make firms more careful about hiring workers, since firms have a harder time firing workers who turn out to be a poor match. Second, if job searchers think that the new legislation will lead them to spend a longer period of time on a particular job, then they might weigh more carefully whether or not to take that job. If the reduction in f is large enough, then the new policy may even increase the natural rate of unemployment.5. a. The demand for labor is determined by the amount of labor that a profit-maximizing firm wants tohire at a given real wage. The profit-maximizing condition is that the firm hire labor until themarginal product of labor equals the real wage,The marginal product of labor is found by differentiating the production function with respect tolabor (see Chapter 3 for more discussion),In order to solve for labor demand, we set the MPL equal to the real wage and solve for L:Notice that this expression has the intuitively desirable feature that increases in the real wagereduce the demand for labor.b. We assume that the 27,000 units of capital and the 1,000 units of labor are supplied inelastically (i.e., they will work at any price). In this case we know that all 1,000 units of labor and 27,000 units of capital will be used in equilibrium, so we can substitute these values into the above labor demand function and solve for W P .In equilibrium, employment will be 1,000, and multiplying this by 10 we find that the workers earn 10,000 units of output. The total output is given by the production function: Y =5K 13L 23Y =5(27,00013)(1,00023)Y =15,000.Notice that workers get two-thirds of output, which is consistent with what we know about theCobb –Douglas production function from Chapter 3.c. The real wage is now equal to 11 (10% above the equilibrium level of 10).Firms will use their labor demand function to decide how many workers to hire at the given realwage of 11 and capital stock of 27,000:So 751 workers will be hired for a total compensation of 8,261 units of output. To find the newlevel of output, plug the new value for labor and the value for capital into the production function and you will find Y = 12,393.d. The policy redistributes output from the 249 workers who become involuntarily unemployed tothe 751 workers who get paid more than before. The lucky workers benefit less than the losers lose as the total compensation to the working class falls from 10,000 to 8,261 units of output.e. This problem does focus on the analysis of two effects of the minimum-wage laws: they raise thewage for some workers while downward-sloping labor demand reduces the total number of jobs. Note, however, that if labor demand is less elastic than in this example, then the loss ofemployment may be smaller, and the change in worker income might be positive.6. a. The labor demand curve is given by the marginal product of labor schedule faced by firms. If acountry experiences a reduction in productivity, then the labor demand curve shifts to the left as in Figure 7-1. If labor becomes less productive, then at any given real wage, firms demand less labor. b. If the labor market is always in equilibrium, then, assuming a fixed labor supply, an adverseproductivity shock causes a decrease in the real wage but has no effect on employment orunemployment, as in Figure 7-2.c. If unions constrain real wages to remain unaltered, then as illustrated in Figure 7-3, employment falls to L 1 and unemployment equals L – L 1.This example shows that the effect of a productivity shock on an economy depends on the role ofunions and the response of collective bargaining to such a change.7. a. If workers are free to move between sectors, then the wage in each sector will be equal. If the wages were not equal then workers would have an incentive to move to the sector with the higher wage and this would cause the higher wage to fall, and the lower wage to rise until they were equal.b. Since there are 100 workers in total, L S = 100 – L M . We can substitute this expression into thelabor demand for services equation, and call the wage w since it is the same in both sectors:L S = 100 – L M = 100 – 4wL M = 4w.Now set this equal to the labor demand for manufacturing equation and solve for w:4w = 200 – 6ww = $20.Substitute the wage into the two labor demand equations to find L M is 80 and L S is 20.c. If the wage in manufacturing is equal to $25 then L M is equal to 50.d. There are now 50 workers employed in the service sector and the wage w S is equal to $12.50.e. The wage in manufacturing will remain at $25 and employment will remain at 50. If thereservation wage for the service sector is $15 then employment in the service sector will be 40. Therefore, 10 people are unemployed and the unemployment rate is 10 percent.8. Real wages have risen over time in both the United States and Europe, increasing the reward forworking (the substitution effect) but also making people richer, so they want to “buy” more leisure (the income effect). If the income effect dominates, then people want to work less as real wages go up. This could explain the European experience, in which hours worked per employed person have fallen over time. If the income and substitution effects approximately cancel, then this could explain the U.S.experience, in which hours worked per person have stayed about constant. Economists do not have good theories for why tastes might differ, so they disagree on whether it is reasonable to think that Europeans have a larger income effect than do Americans.9. The vacant office space problem is similar to the unemployment problem; we can apply the sameconcepts we used in analyzing unemployed labor to analyze why vacant office space exists. There is a rate of office separation: firms that occupy offices leave, either to move to different offices or because they go out of business. There is a rate of office finding: firms that need office space (either to start up or expand) find empty offices. It takes time to match firms with available space. Different types of firms require spaces with different attributes depending on what their specific needs are. Also, because demand for different goods fluctuates, there are “sectoral shifts”—changes in the composition ofdemand among industries and regions that affect the profitability and office needs of different firms.。


曼昆宏观经济经济学第九版英文原版答案3(总13页)--本页仅作为文档封面,使用时请直接删除即可----内页可以根据需求调整合适字体及大小--Answers to Textbook Questions and ProblemsCHAPTER3?National Income: Where It Comes From and Where It Goes Questions for Review1. The factors of production and the production technology determine theamount of output an economy can produce. The factors of production are the inputs used to produce goods and services: the most important factors are capital and labor. The production technology determines how much output can be produced from any given amounts of theseinputs. An increase in one of the factors of production or animprovement in technology leads to an increase in the economy’soutput.2. When a firm decides how much of a factor of production to hire ordemand, it considers how this decision affects profits. For example, hiring an extra unit of labor increases output and thereforeincreases revenue; the firm compares this additional revenue to the additional cost from the higher wage bill. The additional revenue the firm receives depends on the marginal product of labor (MPL) and the price of the good produced (P). An additional unit of labor produces MPL units of additional output, which sells for P dollars per unit.Therefore, the additional revenue to the firm is P ? MPL. The cost of hiring the additional unit of labor is the wage W. Thus, this hiring decision has the following effect on profits:ΔProfit= ΔRevenue –ΔCost= (P ? MPL) –W.If the additional revenue, P ? MPL, exceeds the cost (W) of hiring the additional unit of labor, then profit increases. The firm will hire labor until it is no longer profitable to do so—that is, until the MPL falls to the point where the change in profit is zero. In the equation abov e, the firm hires labor until ΔP rofit = 0, which is when (P ? MPL) = W.This condition can be rewritten as:MPL = W/P.Therefore, a competitive profit-maximizing firm hires labor until the marginal product of labor equals the real wage. The same logicapplies to the firm’s decision regarding how much capital to hire:the firm will hire capital until the marginal product of capitalequals the real rental price.3. A production function has constant returns to scale if an equalpercentage increase in all factors of production causes an increase in output of the same percentage. For example, if a firm increases its use of capital and labor by 50 percent, and output increases by50 percent, then the production function has constant returns toscale.If the production function has constant returns to scale, then total income (or equivalently, total output) in an economy ofcompetitive profit-maximizing firms is divided between the return to labor, MPL ? L, and the return to capital, MPK ? K. That is, under constant returns to scale, economic profit is zero.4. A Cobb–Douglas production function has the form F(K,L) = AKαL1–α.The text showed that the parameter αgives capital’s share ofincome. So if capital earns one-fourth of total income, then ? = .Hence, F(K,L) = Consumption depends positively on disposable income—. the amount of income after all taxes have been paid. Higher disposable income means higher consumption.The quantity of investment goods demanded depends negatively on the real interest rate. For an investment to be profitable, itsreturn must be greater than its cost. Because the real interest rate measures the cost of funds, a higher real interest rate makes it more costly to invest, so the demand for investment goods falls.6. Government purchases are a measure of the value of goods and servicespurchased directly by the government. For example, the government buys missiles and tanks, builds roads, and provides services such as air traffic control. All of these activities are part of GDP.Transfer payments are government payments to individuals that are not in exchange for goods or services. They are the opposite of taxes: taxes reduce household disposable income, whereas transfer payments increase it. Examples of transfer payments include Social Security payments to the elderly, unemployment insurance, and veterans’benefits.7. Consumption, investment, and government purchases determine demandfor the economy’s output, whereas the factors of production and the production function determine the supply of output. The real interest rate adjusts to ensure that the deman d for the economy’s goodsequals the supply. At the equilibrium interest rate, the demand for goods and services equals the supply.8. When the government increases taxes, disposable income falls, andtherefore consumption falls as well. The decrease in consumptionequals the amount that taxes increase multiplied by the marginalpropensity to consume (MPC). The higher the MPC is, the greater is the negative effect of the tax increase on consumption. Becauseoutput is fixed by the factors of production and the productiontechnology, and government purchases have not changed, the decrease in consumption must be offset by an increase in investment. Forinvestment to rise, the real interest rate must fall. Therefore, a tax increase leads to a decrease in consumption, an increase ininvestment, and a fall in the real interest rate.Problems and Applications1. a. According to the neoclassical theory of distribution, the realwage equals the marginal product of labor. Because of diminishing returns to labor, an increase in the labor force causes themarginal product of labor to fall. Hence, the real wage falls.Given a Cobb–Douglas production function, the increase in the labor force will increase the marginal product of capital and will increase the real rental price of capital. With more workers, the capital will be used more intensively and will be more productive.b. The real rental price equals the marginal product of capital. Ifan earthquake destroys some of the capital stock (yet miraculously does not kill anyone and lower the labor force), the marginalproduct of capital rises and, hence, the real rental price rises.Given a Cobb–Douglas production function, the decrease in the capital stock will decrease the marginal product of labor and will decrease the real wage. With less capital, each worker becomesless productive.c. If a technological advance improves the production function, thisis likely to increase the marginal products of both capital andlabor. Hence, the real wage and the real rental price bothincrease.d. High inflation that doubles the nominal wage and the price levelwill have no impact on the real wage. Similarly, high inflationthat doubles the nominal rental price of capital and the pricelevel will have no impact on the real rental price of capital.2. a. To find the amount of output produced, substitute the given valuesfor labor and land into the production function:Y = = 100.b. According to the text, the formulas for the marginal product oflabor and the marginal product of capital (land) are:MPL = (1 –α)AKαL–α.MPK = αAKα–1L1–α.In this problem, α is and A is 1. Substitute in the given values for labor and land to find the marginal product of labor is andmarginal product of capital (land) is . We know that the real wage equals the marginal product of labor and the real rental price of land equals the marginal product of capital (land).c. Labor’s share of the output is given by the marginal product oflabor times the quantity of labor, or 50.d. The new level of output is .e. The new wage is . The new rental price of land is .f. Labor now receives .3. A production function has decreasing returns to scale if an equalpercentage increase in all factors of production leads to a smaller percentage increase in output. For example, if we double the amounts of capital and labor output increases by less than double, then the production function has decreasing returns to scale. This may happen if there is a fixed factor such as land in the production function, and this fixed factor becomes scarce as the economy grows larger.A production function has increasing returns to scale if an equalpercentage increase in all factors of production leads to a larger percentage increase in output. For example, if doubling the amount of capital and labor increases the output by more than double, then the production function has increasing returns to scale. This may happen if specialization of labor becomes greater as the population grows.For example, if only one worker builds a car, then it takes him a long time because he has to learn many different skills, and he must constantly change tasks and tools. But if many workers build a car, then each one can specialize in a particular task and become more productive.4. a. A Cobb–Douglas production function has the form Y = AKαL1–α. Thetext showed that the marginal products for the Cobb–Douglasproduction function are:MPL = (1 –α)Y/L.MPK = αY/K.Competitive profit-maximizing firms hire labor until its marginal product equals the real wage, and hire capital until its marginal product equals the real rental rate. Using these factsand the above marginal products for the Cobb–Douglas productionfunction, we find:W/P = MPL = (1 –α)Y/L.R/P = MPK = αY/K.Rewriting this:(W/P)L = MPL ? L = (1 –α)Y.(R/P)K = MPK ? K = αY.Note that the terms (W/P)L and (R/P)K are the wage bill and total return to capital, respectively. Given that the value of α = ,then the above formulas indicate that labor receives 70 percent of total output (or income) and capital receives 30 percent of total output (or income).b. To determine what happens to total output when the labor forceincreases by 10 percent, consider the formula for the Cobb–Douglas production function:Y = AKαL1–α.Let Y1 equal the initial value of output and Y2 equal final output.We know that α = . We also know that labor L increases by 10percent:Y 1 = Y 2 = .Note that we multiplied L by to reflect the 10-percent increase in the labor force.To calculate the percentage change in output, divide Y 2 by Y 1:Y 2Y 1=AK 0.31.1L ()0.7AK 0.3L 0.7=1.1()0.7=1.069.That is, output increases by percent. To determine how the increase in the labor force affects therental price of capital, consider the formula for the real rental price of capital R/P :R/P = MPK = αAK α–1L 1–α.We know that α = . We also know that labor (L ) increases by 10percent. Let (R/P )1 equal the initial value of the rental price ofcapital, and let (R/P )2 equal the final rental price of capitalafter the labor force increases by 10 percent. To find (R/P )2,multiply L by to reflect the 10-percent increase in the laborforce:(R/P )1 = – (R/P )2 = –.The rental price increases by the ratioR /P ()2R /P ()1=0.3AK -0.71.1L ()0.70.3AK -0.7L 0.7=1.1()0.7=1.069So the rental price increases by percent. To determine how the increase in the labor forceaffects the real wage, consider the formula for the real wage W/P :W/P = MPL = (1 – α)AK αL –α.We know that α = . We also know that labor (L ) increases by 10percent. Let (W/P )1 equal the initial value of the real wage, andlet (W/P )2 equal the final value of the real wage. To find (W/P )2, multiply L by to reflect the 10-percent increase in the laborforce:(W/P )1 = (1 – –. (W/P )2 = (1 – –.To calculate the percentage change in the real wage, divide (W/P )2 by (W/P )1:W /P ()2W /P ()1=1-0.3()AK 0.31.1L ()-0.31-0.3()AK 0.3L -0.3=1.1()-0.3=0.972That is, the real wage falls by percent.c. We can use the same logic as in part (b) to setY 1 = Y 2 = A Therefore, we have:Y 2Y 1=A 1.1K ()0.3L 0.7AK 0.3L 0.7=1.1()0.3=1.029This equation shows that output increases by about 3 percent. Notice that α < means that proportional increases to capital will increase output by less than the same proportional increase to labor.Again using the same logic as in part (b) for the change in the real rental price of capital:R /P ()2R /P ()1=0.3A 1.1K ()-0.7L 0.70.3AK -0.7L 0.7=1.1()-0.7=0.935The real rental price of capital falls by percent because there are diminishing returns to capital; that is, when capital increases, its marginal product falls.Finally, the change in the real wage is:W /P ()2W /P ()1=0.7A 1.1K ()0.3L -0.30.7AK 0.3L -0.3=1.1()0.3=1.029Hence, real wages increase by percent because the added capitalincreases the marginal productivity of the existing workers.(Notice that the wage and output have both increased by the same amount, leaving the labor share unchanged —a feature of Cobb –Douglas technologies.)d. Using the same formula, we find that the change in output is:Y 2Y 1= 1.1A ()K 0.3L 0.7AK 0.3L 0.7=1.1This equation shows that output increases by 10 percent. Similarly,the rental price of capital and the real wage also increase by 10 percent:R /P ()2R /P ()1=0.31.1A ()K -0.7L 0.70.3AK -0.7L 0.7=1.1W /P ()2W /P ()1=0.71.1A ()K 0.3L -0.30.7AK 0.3L -0.3=1.15. Labor income is defined asW P ´L =WL PLabor’s share of income is defined asWL P æèççöø÷÷/Y =WL PYFor example, if this ratio is about constant at a value of , then the value of W/P = *Y/L. This means that the real wage is roughlyproportional to labor productivity. Hence, any trend in laborproductivity must be matched by an equal trend in real wages.O therwise, labor’s share would deviate from . T hus, the first fact(a constant labor share) implies the second fact (the trend in realwages closely tracks the trend in labor productivity).6. a. Nominal wages are measured as dollars per hour worked. Prices aremeasured as dollars per unit produced (either a haircut or a unit of farm output). Marginal productivity is measured as units ofoutput produced per hour worked.b. According to the neoclassical theory, technical progress thatincreases the marginal product of farmers causes their real wageto rise. The real wage for farmers is measured as units of farmoutput per hour worked. The real wage is W/P F, and this is equalto ($/hour worked)/($/unit of farm output).c. If the marginal productivity of barbers is unchanged, then theirreal wage is unchanged. The real wage for barbers is measured ashaircuts per hour worked. The real wage is W/P B, and this is equal to ($/hour worked)/($/haircut).d.If workers can move freely between being farmers and being barbers,then they must be paid the same wage W in each sector.e. If the nominal wage W is the same in both sectors, but the realwage in terms of farm goods is greater than the real wage in terms of haircuts, then the price of haircuts must have risen relativeto the price of farm goods. We know that W/P = MPL so that W = P ?MPL. This means that PF MPLF= P H MPL B, given that the nominal wagesare the same. Since the marginal product of labor for barbers has not changed and the marginal product of labor for farmers hasrisen, the price of a haircut must have risen relative to theprice of the farm output. If we express this in growth rate terms, then the growth of the farm price + the growth of the marginalproduct of the farm labor = the growth of the haircut price.f. The farmers and the barbers are equally well off after the technological progress in farming, giventhe assumption that labor is freely mobile between the two sectorsand both types of people consume the same basket of goods. Given that the nominal wage ends up equal for each type of worker andthat they pay the same prices for final goods, they are equallywell off in terms of what they can buy with their nominal income.The real wage is a measure of how many units of output areproduced per worker. Technological progress in farming increased the units of farm output produced per hour worked. Movement oflabor between sectors then equalized the nominal wage.7. a. The marginal product of labor (MPL)is found by differentiatingthe production function with respect to labor:MPL=dY dL=13K1/3H1/3L-2/3An increase in human capital will increase the marginal product of labor because more human capital makes all the existing labor more productive.b. The marginal product of human capital (MPH)is found bydifferentiating the production function with respect to humancapital:MPH=dY dH=13K1/3L1/3H-2/3An increase in human capital will decrease the marginal product of human capital because there are diminishing returns.c. The labor share of output is the proportion of output that goes tolabor. The total amount of output that goes to labor is the real wage (which, under perfect competition, equals the marginalproduct of labor) times the quantity of labor. This quantity is divided by the total amount of output to compute the labor share:Labor Share=(13K1/3H1/3L-2/3)LK1/3H1/3L1/3=1 3We can use the same logic to find the human capital share:Human Capital Share=(13K1/3L1/3H-2/3)HK1/3H1/3L1/3=1 3so labor gets one-third of the output, and human capital gets one-third of the output. Since workers own their human capital (we hope!), it will appear that labor gets two-thirds of output.d. The ratio of the skilled wage to the unskilled wage is:Wskilled Wunskilled =MPL+MPHMPL=13K1/3L-2/3H1/3+13K1/3L1/3H-2/313K1/3L-2/3H1/3=1+LHNotice that the ratio is always greater than 1 because skilledworkers get paid more than unskilled workers. Also, when Hincreases this ratio falls because the diminishing returns tohuman capital lower its return, while at the same time increasing the marginal product of unskilled workers.e. If more colleges provide scholarships, it will increase H, and itdoes lead to a more egalitarian society. The policy lowers thereturns to education, decreasing the gap between the wages of more and less educated workers. More importantly, the policy evenraises the absolute wage of unskilled workers because theirmarginal product rises when the number of skilled workers rises.8. The effect of a government tax increase of $100 billion on (a) publicsaving, (b) private saving, and (c) national saving can be analyzed by using the following relationships:National Saving = [Private Saving] + [Public Saving]= [Y –T –C(Y –T)] + [T –G]= Y –C(Y –T) –G.a. Public Saving—The tax increase causes a 1-for-1 increase inpublic saving. T increases by $100 billion and, therefore, publicsaving increases by $100 billion.b.Private Saving—The increase in taxes decreases disposable income,Y –T, by $100 billion. Since the marginal propensity to consume (MPC) is , consumption falls by ? $100 billion, or $60 billion.Hence,ΔPrivate Saving = –$100b – (–$100b) = –$40b.Private saving falls $40 billion.c. National Saving—Because national saving is the sum of privateand public saving, we can conclude that the $100 billion taxincrease leads to a $60 billion increase in national saving.Another way to see this is by using the third equation for national saving expressed above, that national saving equals Y –C(Y –T) –G. The $100 billion tax increase reduces disposable income and causes consumption to fall by $60 billion. Sinceneither G nor Y changes, national saving thus rises by $60 billion.d. Investment—To determine the effect of the tax increase oninvestment, recall the national accounts identity:Y = C(Y –T) + I(r) + G.Rearranging, we findY –C(Y –T) –G = I(r).The left side of this equation is national saving, so the equation just says that national saving equals investment. Since national saving increases by $60 billion, investment must also increase by $60 billion.How does this increase in investment take place We know that investment depends on the real interest rate. For investment to rise, the real interest rate must fall. Figure 3-1 illustrates saving and investment as a function of the real interest rate.The tax increase causes national saving to rise, so the supply curve for loanable funds shifts to the right. The equilibrium real interest rate falls, and investment rises.9. If consumers increase the amount that they consume today, thenprivate saving and, therefore, national saving will fall. We know this from the definition of national saving:National Saving = [Private Saving] + [Public Saving]= [Y –T –C(Y –T)] + [T –G].An increase in consumption decreases private saving, so national saving falls.Figure 3-2 illustrates saving and investment as a function of the real interest rate. If national saving decreases, the supply curve for loanable funds shifts to the left, thereby raising the realinterest rate and reducing investment.10. a. Private saving is the amount of disposable income, Y – T,that is not consumed:S private= Y – T – C= 8,000 – 2,000 – [1,000 + (2/3)(8,000 –2,000)]= 1,000.Public saving is the amount of taxes the government has left over after it makes its purchases:S public= T – G= 2,000 – 2,500= –500.National saving is the sum of private saving and public saving:S national= S private+ S public= 1,000 + (500)= 500.b. The equilibrium interest rate is the value of r that clears themarket for loanable funds. We already know that national saving is 500, so we just need to set it equal to investment:S national= I500 = 1,200 – 100rSolving this equation for r, we find:r = or 7%.c. When the government increases its spending, private saving remainsthe same as before (notice that G does not appear in the S privateequation above) while government saving decreases. Putting the newG into the equations above:S private= 1,000S public= T – G= 2,000 – 2,000= 0.Thus,S national= S private+ S public= 1,000 + (0)= 1,000.d. Once again the equilibrium interest rate clears the market for loanable funds:S national= I1,000 = 1,200 – 100rSolving this equation for r, we find:r = or 2%.11. To determine the effect on investment of an equal increase in bothtaxes and government spending, consider the national income accounts identity for national saving:National Saving = [Private Saving] + [Public Saving]= [Y –T –C(Y –T)] + [T –G].We know that Y is fixed by the factors of production. We also know that the change in consumption equals the marginal propensity toconsume (MPC) times the change in disposable income. This tells us thatΔNational Saving = {–ΔT – [MPC ? (–ΔT)]} + [ΔT –ΔG]= [–ΔT + (MPC ? ΔT)] + 0= (MPC –1) ΔT.The above expression tells us that the impact on national saving of an equal increase in T and G depends on the size of the marginal propensity to consume. The closer the MPC is to 1, the smaller is the fall in saving. For example, if the MPC equals 1, then the fall in consumption equals the rise in government purchases, so nationalsaving [Y –C(Y –T) –G] is unchanged. The closer the MPC is to 0 (and therefore the larger is the amount saved rather than spent for a one-dollar change in disposable income), the greater is the impact on saving. Because we assume that the MPC is less than 1, we expect that national saving falls in response to an equal increase in taxes and government spending.The reduction in saving means that the supply of loanable funds curve will shift to the left in Figure 3-3. The real interest rate rises, and investment falls.12. a. The demand curve for business investment shifts out to theright because the subsidy increases the number of profitableinvestment opportunities for any given interest rate. The demandcurve for residential investment remains unchanged.b. The total demand curve for investment in the economy shifts out tothe right since it represents the sum of business investment,which shifts out to the right, and residential investment, whichis unchanged. As a result the real interest rate rises as inFigure 3-4.c. The total quantity of investment does not change because it isconstrained by the inelastic supply of savings. The investment tax credit leads to a rise in business investment, but an offsettingfall in residential investment. That is, the higher interest rate means that residential investment falls (a movement along thecurve), whereas the rightward shift of the business investmentcurve leads business investment to rise by an equal amount. Figure3-5 shows this change. Note thatI 1B +I 1R +I 2B +I 2R =S .13. In this chapter, we concluded that an increase in governmentexpenditures reduces national saving and raises the interest rate. The increase in government expenditure therefore crowds outinvestment by the full amount of the increase. Similarly, a tax cut increases disposable income and hence consumption. This increase in consumption translates into a fall in national saving, and theincrease in consumption crowds out investment by the full amount of the increase.If consumption depends on the interest rate, then saving will also depend on it. The higher the interest rate, the greater the return to saving. Hence, it seems reasonable to think that an increase in the interest rate might increase saving and reduce consumption. Figure 3-6 shows saving as an increasing function of the interest rate.Consider what happens when government purchases increase. At anygiven level of the interest rate, national saving falls by the change in government purchases, as shown in Figure 3-7. The figure shows that if the saving function slopes upward, investment falls by less than the amount that government purchases rises by. This happens because consumption falls and saving increases in response to the higher interest rate. Hence, the more responsive consumption is tothe interest rate, the less investment is crowded out by government purchases.14. a. Figure 3-8 shows the case where the demand for loanablefunds is stable but the supply of funds (the saving schedule)fluctuates perhaps reflecting temporary shocks to income, changes in government spending, or changes in consumer confidence. In this case, when interest rates fall, investment rises; when interestrates rise, investment falls. We would expect a negativecorrelation between investment and interest rates.b. Figure 3-9 shows the case where the supply of loanable funds(saving) is stable, whereas the demand for loanable fundsfluctuates, perhaps reflecting changes in firms’ expectationsabout the marginal product of capital. We would now find apositive correlation between investment and the interest rate—when demand for funds rises, it pushes up the interest rate, so we observe that investment and the real interest rate increase at the same time.c. If both curves shift, we might generate a scatter plot as inFigure 3-10, where the economy fluctuates among points A, B, C, and D. Depending on how often the economy is at each of thesepoints, we might find little clear relationship between investment and interest rates.d. Situation (c) seems fairly reasonable—as both the supply of anddemand for loanable funds fluctuate over time in response tochanges in the economy.。
CHAPTER 7ECONOMIC GROWTH AND INTERNATIONAL TRADEOUTLINE7.1 Introduction7.2 Growth of Factors of Production7.2a Labor Growth and Capital Accumulation Over Time7.2b The Rybczynski Theorem7.3 Technical Progress7.3a Neutral, Labor-Saving, and Capital-Saving Technical Progress7.3b Technical Progress and the Nation's Production FrontierCase Study 7-1: Changes in Relative Resource Endowments of Various Countries and Regions Case Study 7-2: Change in Capital-Labor Rations in Selected Countries7.4 Growth and Trade: The Small Country Case7.4a The Effects of Growth on Trade7.4b Illustration of Factor Growth, Trade, and Welfare7.4c Technical Progress, Trade, and WelfareCase Study 7-3: Growth of Output per Worker from Capital Deepening, TechnologicalChange, and Improvements in Efficiency7.5 Growth and Trade: The Large-Country Case7.5a Growth and the Nation's Terms of Trade and Welfare7.5b Immiserizing Growth7.5c Illustration of Beneficial Growth and TradeCase Study 7-4: Growth, Trade, and the Giants of the Future7.6 Growth, Change in Tastes, and Trade in Both Nations7.6a Growth and Trade in Both Nations7.6b Change in Tastes and Trade in Both NationsCase Study 7-5: Change in the Revealed Comparative Advantage of Various Countries or RegionsCase Study 7-6: Growth, Trade, and Welfare in the Leading Industrial NationsAppendix: A7.1 Formal Proof of Rybczynski TheoremA7.2 Growth with Factor ImmobilityA7.3 Graphical Analysis of Hicksian Technical ProgressKey TermsComparative statics Antitrade production and consumptionDynamic analysis Neutral production and consumptionBalanced growth Normal goodsRybczynski theorem Inferior goodsLabor-saving technical progress Terms-of-trade effectCapital-saving technical progress Wealth effectProtrade production and consumption Immiserizing growthLecture Guide1.This is not a core chapter and it is one of the most challenging chapters in international tradetheory. It is included for more advanced students and for completeness.2.If I were to cover this chapter, I would present two sections in each of three lectures.Time permitting, I would, otherwise cover Sections 1 and 2, paying special attention to the Rybczynski theorem.Answer to Problems1. a) See Figure 1.b) See Figure 2c) See Figure 3.2. See Figure 4.3. a) See Figure 5.b) See Figure 6.c) See Figure 7.4. Compare Figure 5 to Figure 1.Compare Figure 6 to Figure 3. Note that the two production frontiers have the same vertical or Y intercept in Figure 6 but a different vertical or Y intercept in Figure 3.Compare Figure 7 to Figure 2. Note that the two production frontiers have the samehorizontal or X intercept in Figure 7 but a different horizontal or X intercept in Figure 2.5. See Figure 8 on page 66.6. See Figure 9.7. See Figure 10.8. See Figure 11.9. See Figure 12.10. See Figure 13 on page 67.11. See Figure 14.12. See Figure 15.13.The United States has become the most competitive economy in the world since the early1990’s while the data in Table 7.3 refers to the 1965-1990 period.14.The data in Table 7.4 seem to indicate that China had a comparative advantage incapital-intensive commodities and a comparative disadvantage in unskilled-labor intensive commodities in 1973. This was very likely due to the many trade restrictions and subsidies, which distorted the comparative advantage of China.Its true comparative advantage became evident by 1993 after China had started to liberalize its economy.App. 1a. See Figure 16.1b. For production and consumption to actually occur at the newequilibrium point after the doubling of K in Nation 2, we mustassume either than commodity X is inferior or that Nation 2 is toosmall to affect the relative commodity prices at which it trades.1c. Px/Py must rise (i.e., Py/Px must fall) as a result of growth only.Px/Py will fall even more with trade.1. If the supply of capital increases in Nation 1 in the production of commodity Yonly, the VMPLy curve shifts up, and w rises in both industries. Some labor shifts to the production of Y, the output of Y rises and the output of X falls, r falls, and Px/Py is likely to rise.2. Capital investments tend to increase real wages because they raise the K/L ratioand the productivity of labor. Technical progress tends to increase K/L and realwages if it is L-saving and to reduce K/L and real wages if it is K-saving. Multiple-Choice Questions1. Dynamic factors in trade theory refer to changes in:a. factor endowmentsb. technologyc. tastes*d. all of the above2. Doubling the amount of L and K under constant returns to scale:a. doubles the output of the L-intensive commodityb. doubles the output of the K-intensive commodityc. leaves the shape of the production frontier unchanged*d. all of the above.3. Doubling only the amount of L available under constant returns to scale:a. less than doubles the output of the L-intensive commodity*b. more than doubles the output of the L-intensive commodityc. doubles the output of the K-intensive commodityd. leaves the output of the K-intensive commodity unchanged4. The Rybczynski theorem postulates that doubling L at constant relative commodity prices:a. doubles the output of the L-intensive commodity*b. reduces the output of the K-intensive commodityc. increases the output of both commoditiesd. any of the above5. Doubling L is likely to:a. increases the relative price of the L-intensive commodityb. reduces the relative price of the K-intensive commodity*c. reduces the relative price of the L-intensive commodityd. any of the above6.Technical progress that increases the productivity of L proportionately more than the productivity of K is called:*a. capital savingb. labor savingc. neutrald. any of the above7. A 50 percent productivity increase in the production of commodity Y:a. increases the output of commodity Y by 50 percentb. does not affect the output of Xc. shifts the production frontier in the Y direction only*d. any of the above8. Doubling L with trade in a small L-abundant nation:*a. reduces the nation's social welfareb. reduces the nation's terms of tradec. reduces the volume of traded. all of the above9. Doubling L with trade in a large L-abundant nation:a. reduces the nation's social welfareb. reduces the nation's terms of tradec. reduces the volume of trade*d. all of the above10.If, at unchanged terms of trade, a nation wants to trade more after growth, then the nation's terms of trade can be expected to:*a. deteriorateb. improvec. remain unchangedd. any of the above11. A proportionately greater increase in the nation's supply of labor than of capital is likely to result in a deterioration in the nation's terms of trade if the nation exports:a. the K-intensive commodity*b. the L-intensive commodityc. either commodityd. both commodities12. Technical progress in the nation's export commodity:*a. may reduce the nation's welfareb. will reduce the nation's welfarec. will increase the nation's welfared. leaves the nation's welfare unchanged13. Doubling K with trade in a large L-abundant nation:a. increases the nation's welfareb. improves the nation's terms of tradec. reduces the volume of trade*d. all of the above14. An increase in tastes for the import commodity in both nations:a. reduces the volume of trade*b. increases the volume of tradec. leaves the volume of trade unchangedd. any of the above15. An increase in tastes of the import commodity of Nation A and export in B:*a. will reduce the terms of trade of Nation Ab. will increase the terms of trade of Nation Ac. will reduce the terms of trade of Nation Bd. any of the aboveADDITIONAL ESSAYS AND PROBLEMS FOR PART ONE1.Assume that both the United States and Germany produce beef and computer chipswith the following costs:United States Germany(dollars) (marks)Unit cost of beef (B) 2 8Unit cost of computer chips (C) 1 2a) What is the opportunity cost of beef (B) and computer chips (C) in each country?b)In which commodity does the United States have a comparative cost advantage?What about Germany?c)What is the range for mutually beneficial trade between the United States andGermany for each computer chip traded?d)How much would the United States and Germany gain if 1 unit of beef isexchanged for 3 chips?Ans. a) In the United States:the opportunity cost of one unit of beef is 2 chips;the opportunity cost of one chip is 1/2 unit of beef.In Germany:the opportunity cost of one unit of beef is 4 chips;the opportunity cost of one chip is 1/4 unit of beef.b) The United States has a comparative cost advantage in beef with respect toGermany, while Germany has a comparative cost advantage in computer chips.c)The range for mutually beneficial trade between the United States and Germanyfor each unit of beef that the United States exports is2C < 1B < 4Cd) Both the United States and Germany would gain 1 chip for each unit of beeftraded.2.Given: (1) two nations (1 and 2) which have the same technology but differentfactor endowments and tastes, (2) two commodities (X and Y) produced under increasing costs conditions, and (3) no transportation costs, tariffs, or other obstructions to trade. Prove geometrically that mutually advantageous trade between the two nations is possible.Note: Your answer should show the autarky (no-trade) and free-trade points of production and consumption for each nation, the gains from trade of each nation,and express the equilibrium condition that should prevail when trade stops expanding.)Ans.: See Figure 1 on page 74.Nations 1 and 2 have different production possibilities curves and different community indifference maps. With these, they will usually end up with different relative commodity prices in autarky, thus making mutually beneficial trade possible.In the figure, Nation 1 produces and consumes at point A and Px/Py=P A in autarky, while Nation 2 produces and consumes at point A' and Px/Py=P A'. Since P A < P A',Nation 1 has a comparative advantage in X and Nation 2 in Y. Specialization inproduction proceeds until point B in Nation 1 and point B' in Nation 2, at which P B=P B' and the quantity supplied for export of each commodity exactly equals the quantity demanded for import. Thus, Nation 1 starts at point A in production and consumption in autarky, moves to point B in production, and by exchanging BC of X for CE of Y reaches point E in consumption. E > A since it involves more of both X and Y and lies on a higher community indifference curve. Nation 2 starts at A' in production and consumption in autarky, moves to point B' in production, and by exchanging B'C' of Y for C'E' of X reaches point E'in consumption (which exceeds A').At Px/Py=P B=P B', Nation 1 wants to export BC of X for CE of Y, while Nation 2 wants to export B'C' (=CE) of Y for C'E' (=BC) of X. Thus, P B=P B'is the equilibrium relative commodity price because it clears both (the X and Y) markets.3.Draw a figure showing: (1) in Panel A a nation's demand and supply curve for Atraded commodity and the nation's excess supply of the commodity, (2) in Panel C the trade partner's demand and supply curve for the same traded commodity and its excess demand for the commodity, and (3) in Panel B the supply and demand for the quantity traded of the commodity, its equilibrium price, and why a price above or below the equilibrium price will not persist. At any other price, QD QS, and P will change to P2.Ans. See Figure 2 on page 74.The equilibrium relative commodity price for commodity X (the traded commodityexported by Nation 1 and imported by Nation 2) is P2 and the equilibrium quantityof commodity X traded is Q2.4.a) Identify the conditions that may give rise to trade between two nations.b) What are some of the assumptions on which the Heckscher-Ohlin theory isbased?c) What does this theory say about the pattern of trade and effect of trade on factorprices?Ans. a) Trade can be based on a difference in factor endowments, technology, or tastes between two nations. A difference either in factor endowments or technology results in a different production possibilities frontier for each nation, which, unless neutralized by a difference in tastes, leads to a difference in relative commodity price and mutually beneficial trade. If two nations face increasing costs and have identical production possibilities frontiers but different tastes, there will also be a difference in relative commodity prices and the basis for mutually beneficial trade between the two nations. The difference in relative commodity prices is then translated into a difference in absolute commodity prices between the two nations, which is the immediate cause of trade.b) The Heckscher-Ohlin theory (sometimes referred to as the modern theory – asopposed to the classical theory - of international trade) assumes that nations have the same tastes, use the same technology, face constant returns to scale (i.e., a given percentage increase in all inputs increases output by the same percentage) but differ widely in factor endowments. It also says that in the face of identical tastes or demand conditions, this difference in factor endowments will result in a difference in relative factor prices between nations, which in turn leads to a difference in relative commodity prices and trade. Thus, in the Heckscher-Ohlin theory, the international difference in supply conditions alone determines the pattern of trade. To be noted is that the two nations need not be identical in other respects in order for international trade to be based primarily on the difference in their factor endowments.c) The Heckscher-Ohlin theorem postulates that each nation will export thecommodity intensive in its relatively abundant and cheap factor and import the commodity intensive in its relatively scarce and expensive factor. As an important corollary, it adds that under highly restrictive assumptions, trade will completely eliminate the pretrade relative and absolute differences in the price of homogeneous factors among nations. Under less restrictive and more usual conditions, however, trade will reduce, but not eliminate, the pretrade differences in relative and absolute factor prices among nations. In any event, the Heckscher-Ohlin theory does say something very useful on how trade affects factor prices and the distribution of income in each nation. Classical economists were practically silent on this point.5. consumers demand more of commodity X (the L-intensive commodity) and less ofcommodity Y (the K- intensive commodity). Suppose that Nation 1 is India, commodity X is textiles, and commodity Y is food. Starting from the no-trade equilibrium position and using the Heckscher-Ohlin model, trace the effect of this change in tastes on India's(a) relative commodity prices and demand for food and textiles,(b) production of both commodities and factor prices, and(c) comparative advantage and volume of trade.(d) Do you expect international trade to lead to the complete equalization ofrelative commodity and factor prices between India and the United States?Why?Ans. a. The change in tastes can be visualized by a shift toward the textile axis in India's indifference map in such a way that an indifference curve is tangentto the steeper segment of India's production frontier (because of increasingopportunity costs) after the increase in demand for textiles. This will causethe pretrade relative commodity price of textiles to rise in India.b. The increase in the relative price of textiles will lead domesticproducers in India to shift labor and capital from the production of food tothe production of textiles. Since textiles are L-intensive in relation to food,the demand for labor and therefore the wage rate will rise in India. At thesame time, as the demand for food falls, the demand for and thus the priceof capital will fall. With labor becoming relative more expensive,producers in India will substitute capital for labor in the production of bothtextiles and food.Even with the rise in relative wages and in the relative price of textiles,India still remains the L-abundant and low-wage nation with respect to anation such as the United States. However, the pretrade difference in therelative price of textiles between India and the United States is nowsomewhat smaller than before the change in tastes in India. As a result thevolume of trade required to equalize relative commodity prices and hencefactor prices is smaller than before. That is, India need now export asmaller quantity of textiles and import less food than before for therelative price of textiles in India and the United States to be equalized.Similarly, the gap between real wages and between India and the UnitedStates is now smaller and can be more quickly and easily closed (i.e., witha smaller volume of trade).c. Since many of the assumptions required for the complete equalization ofrelative commodity and factor prices do not hold in the real world, greatdifferences can be expected and do in fact remain between real wages inIndia and the United States. Nevertheless, trade would tend to reduce thesedifferences, and the H-O model does identify the forces that must beconsidered to analyze the effect of trade on the differences in the relative andabsolute commodity and factor prices between India and the United States.5.(a) Explain why the Heckscher-Ohlin trade model needs to be extended.(b) Indicate in what important ways the Heckscher-Ohlin trade model can beextended.(c) Explain what is meant by differentiated products and intra-industry trade.Ans. (a) The Heckscher-Ohlin trade model needs to be extended because, while generally correct, it fails to explain a significant portion of international trade, particularly the trade in manufactured products among industrial nations.(b)The international trade left unexplained by the basic Heckscher-Ohlin trade modecan be explained by(1) economies of scale,(2) intra-industry trade, and(3) trade based on imitation gaps and product differentiation.(c)Differentiated products refer to similar, but not identical, products (such as cars,typewriters, cigarettes, soaps, and so on) produced by the same industry or broad product group. Intra-industry trade refers to the international trade in differentiated products.。
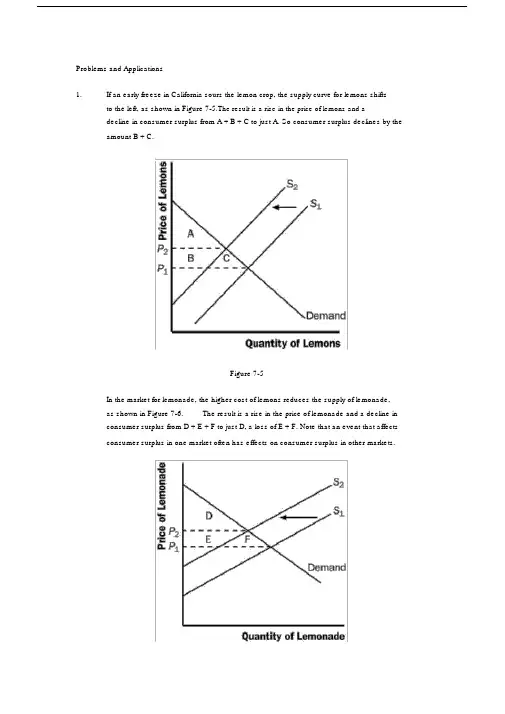
Problems and Applications1.If an early freeze in California sours the lemon crop, the supply curve for lemons shiftsto the left, as shown in Figure 7-5.The result is a rise in the price of lemons and adecline in consumer surplus from A + B + C to just A. So consumer surplus declines by the amount B + C.Figure 7-5In the market for lemonade, the higher cost of lemons reduces the supply of lemonade,as shown in Figure 7-6.The result is a rise in the price of lemonade and a decline inconsumer surplus from D + E + F to just D, a loss of E + F. Note that an event that affectsconsumer surplus in one market often has effects on consumer surplus in other markets.Figure 7-62. A rise in the demand for French bread leads to an increase in producer surplus in themarket for French bread, as shown in Figure 7-7.The shift of the demand curve leads to an increased price, which increases producer surplus from area A to area A + B + C.Figure 7-7The increased quantity of French bread being sold increases the demand for flour, asshown in Figure 7-8.As a result, the price of flour rises, increasing producer surplusfrom area D to D + E + F. Note that an event that affects producer surplus in onemarket leads to effects on producer surplus in related markets.Figure 7-83. a.Bert’ s demand schedule is:Price Quantity DemandedMore than $7 0$5 to $7 1$3 to $5 2$1 to $3 3$1 or less 4Bert’ s demand curve is shown in Figure 7 -9.Figure 7-9b.When the price of a bottle of water is $4, Bert buys two bottles of water.Hisconsumer surplus is shown as area A in the figure.He values his first bottle ofwater at $7, but pays only $4 for it, so has consumer surplus of $3.He valueshis second bottle of water at $5, but pays only $4 for it, so has consumersurplus of $1.Thus Bert’ s total consumer surplus is $3 + $1 = $4, which isthe area of A in the figure.c.When the price of a bottle of water falls from $4 to $2, Bert buys three bottlesof water, an increase of one. His consumer surplus consists of both areas Aand B in the figure, an increase in the amount of area B. He gets consumersurplus of $5 from the first bottle ($7 value minus $2 price), $3 from thesecond bottle ($5 value minus $2 price), and $1 from the third bottle ($3 valueminus $2 price), for a total consumer surplus of $9. Thus consumer surplusrises by $5 (which is the size of area B) when the price of a bottle of water fallsfrom $4 to $2.4. a. Ernie ’ s supply schedule for water is:Price Quantity SuppliedMore than $7 4$5 to $7 3$3 to $5 2$1 to $3 1Less than $1 0Ernie’ s supply curve is shown in Figure 7 -10.Figure 7-10b.When the price of a bottle of water is $4, Ernie sells two bottles of water.Hisproducer surplus is shown as area A in the figure.He receives $4 for his firstbottle of water, but it costs only $1 to produce, so Ernie has producer surplusof $3.He also receives $4 for his second bottle of water, which costs $3 toproduce, so he has producer surplus of$1. Thus Ernie’ s total producersurplus is $3 + $1 = $4, which is the area of A in the figure.c.When the price of a bottle of water rises from $4 to $6, Ernie sells three bottlesof water, an increase of one.His producer surplus consists of both areas Aand B in the figure, an increase by the amount of area B.He gets producersurplus of $5 from the first bottle ($6 price minus $1 cost), $3 from the secondbottle ($6 price minus $3 cost), and $1 from the third bottle ($6 price minus $5price), for a total producer surplus of $9.Thus producer surplus rises by $5(which is the size of area B) when the price of a bottle of water rises from $4to $6.5. a. From Ernie ’ s supply schedule and Bert ’ s demand schedule, the quantitydemanded and supplied are:Price Quantity Supplied Quantity Demanded$ 2 1 34 2 26 3 1Only a price of $4 brings supply and demand into equilibrium, withan equilibrium quantity of 2.b.At a price of $4, consumer surplus is $4 and producer surplus is $4, as shownin problems 3 and 4.Total surplus is $4 + $4 = $8.c.If Ernie produced one fewer bottle, his producer surplus would decline to $3,as shown in problem 4.If Bert consumed one fewer bottle, his consumersurplus would decline to $3, as shown in problem 3. So total surplus would declineto $3 + $3 = $6.d.If Ernie produced one additional bottle of water, his cost would be $5, but theprice is only $4, so his producer surplus would decline by $1.If Bertconsumed one additional bottle of water, his value would be $3, but the priceis $4, so his consumer surplus would decline by $1.So total surplus declinesby $1 + $1 = $2.6. a.The effect of falling production costs in the market for stereos results in a shiftto the right in the supply curve, as shown in Figure 7-11.As a result, theequilibrium price of stereos declines and the equilibrium quantity increases.b.The decline in the price of stereos increases consumer surplus from area A to A+ B + C + D, an increase in the amount B + C + D.Prior to the shift in supply,producer surplus was areas B + E (the area above the supply curve and belowthe price).After the shift in supply, producer surplus is areas E + F + G.Soproducer surplus changes by the amount F + G - B, which may be positive ornegative.The increase in quantity increases producer surplus, while thedecline in the price reduces producer surplus.Since consumer surplus risesby B + C + D and producer surplus rises by F + G - B, total surplus rises by C+ D+F+G.c.If the supply of stereos is very elastic, then the shift of the supply curvebenefits consumers most.To take the most dramatic case, suppose thesupply curve were horizontal, as shown in Figure 7-12.Then there is noproducer surplus at all.Consumers capture all the benefits of fallingproduction costs, with consumer surplus rising from area A to area A + B.Figure 7-11Figure 7-127. Figure 7-13 shows supply and demand curves for haircuts. Supply equals demand ata quantity of three haircuts and a price between $4 and $5. Firms A, C, and D shouldcut the hair of Sally Jessy, Jerry, and Montel. Oprah ’ s willingness to pay is too low and firm B ’ s costs are too high, so they do not participate. The maximum total surplus isthe area between the demand and supply curves, which totals $11 ($8 value minus$2 cost for the first haircut, plus $7 value minus $3 cost for the second, plus $5 valueminus $4 cost for the third).Figure 7-138. a.The effect of falling production costs in the market for computers results in ashift to the right in the supply curve, as shown in Figure 7-14.As a result, theequilibrium price of computers declines and the equilibrium quantity increases.The decline in the price of computers increases consumer surplus from area Ato A + B + C + D, an increase in the amount B + C + D.Figure 7-14Prior to the shift in supply, producer surplus was areas B + E (the area abovethe supply curve and below the price).After the shift in supply, producersurplus is areas E + F + G.So producer surplus changes by the amount F + G- B, which may be positive or negative.The increase in quantity increasesproducer surplus, while the decline in the price reduces producer surplus. Sinceconsumer surplus rises by B + C + D and producer surplus rises by F + G - B,total surplus rises by C + D + F + G.——Figure 7-15b.Since adding machines are substitutes for computers, the decline in the priceof computers means that people substitute computers for adding machines,shifting the demand for adding machines to the left, as shown in Figure 7-15.The result is a decline in both the equilibrium price and equilibrium quantity ofadding machines.Consumer surplus in the adding-machine market changesfrom area A + B to A + C, a net gain of C - B.Producer surplus changes fromarea C + D + E to area E, a net loss of C + D.Adding machine producers aresad about technological advance in computers because their producersurplus declines.c.Since software and computers are complements, the decline in the price andincrease in the quantity of computers means that people’ s demand forsoftware increases, shifting the demand for software to the right, as shown inFigure 7-16. The result is an increase in both the price and quantity of software.Consumer surplus in the software market changes from B + C to A+B, a net increase of A - C. Producer surplus changes from E to C + D + E, anincrease of C + D, so software producers should be happy about the technologicalprogress in computers.d.Yes, this analysis helps explain why Bill Gates is one the world’ s richest msince his company produces a lot of software that’ s a complement withcomputers and there has been tremendous technological advance incomputers.——Figure 7-169. a. Figure 7-17 illustrates the demand for medical care. If each procedure has aprice of $100, quantity demanded will be Q 1 procedures.Figure 7-17b.If consumers pay only $20 per procedure, the quantity demanded will be Q 2procedures.Since the cost to society is $100, the number of proceduresperformed is too large to maximize total surplus.The quantity thatmaximizes total surplus is Q 1 procedures, which is less than Q2.c.The use of medical care is excessive in the sense that consumers getprocedures whose value is less than the cost of producing them.As a result,——the economy’ s total surplus is reduced.d.To prevent this excessive use, the consumer must bear the marginal cost ofthe procedure.But this would require eliminating insurance.Anotherpossibility would be that the insurance company, which pays most of themarginal cost of the procedure ($80, in this case) could decide whether theprocedure should be performed.But the insurance company doesn’ t get thebenefits of the procedure, so its decisions may not reflect the value to theconsumer.10. a. Figure 7-18 illustrates the effect of the drought. The supply curve shifts tothe left, leading to a rise in the equilibrium price from P 1 to P 2 and a decline inthe equilibrium quantity from Q 1 to Q 2 .Figure 7-18b.If the price of water is not allowed to change, there will be an excess demandfor water, with the shortage shown on the figure as the difference between Q 1and Q 3 .c.The system for allocating water is inefficient because it no longer allocateswater to those who value it most highly.Some people who value water atmore than its cost of production will be unable to obtain it, so societysurplus isn’ t maximized.The allocation system seems unfair as well.Water is allocated simply on pastusage, rewarding past wastefulness.If a family’ s demand for water increases,——say because of an increase in family size, the policy doesn ’ t allow them to obtain more water. Poor families, who probably used water mostly fornecessary uses like drinking, would suffer more than wealthier families whowould have to cut back only on luxury uses of water like operating backyardfountains and pools. However, the policy also keeps the price of water lower,which benefits poor families, since otherwise more of their family budgetwould have to go for water.d. If the city allowed the price of water to rise to its equilibrium price P 2 , theallocation would be more efficient. Quantity supplied would equal quantitydemanded and there would be no shortage. Total surplus would bemaximized.Whether the market allocation would be more or less fair than theproportionate reduction in water under the old policy is difficult to say, but it islikely to be more fair. Notice that the quantity supplied would be higher (Q 2)in this case than under the water restrictions (Q 3 ), so there ’ s less reduction inwater usage. To make the market solution even more fair, the governmentcould provide increased tax relief or welfare payments for poor families whosuffer from paying the higher water prices.。
曼昆经济学习题解答Ch5 经济增长2⼀、名词解释劳动效率劳动扩⼤型技术进步内⽣增长理论⼆、选择题1.在有⼈⼝增长和技术进步的索洛模型中,稳定状态时每个效率⼯⼈的产出增长率等于:()A.0 B.技术增长率gC.⼈⼝增长率n+技术增长率g D.储蓄率s2.在有⼈⼝增长和技术进步的索洛模型中,稳定状态时每个⼯⼈的产出增长率等于:()A.0 B.技术增长率gC.⼈⼝增长率n+技术增长率g D.储蓄率s3.在⼈⼝增长⽐率为n和劳动扩⼤型技术进步⽐率为g的索洛模型中,每个效率⼯⼈的资本存量变化等于:()A.sf(k) + (d + n + g)k B.sf(k) + (d - n - g)kC.sf(k) - (d + n + g)k D.sf(k) - (d - n - g)k4.下列可以⿎励技术进步的是()A.新产品实⾏专利制度B.对研发的税收激励C.对研发的政府补贴D.以上都是5.索洛模型表明⾼⼈⼝增长率的国家将会有():A.较低的稳定状态⼈均产出⽔平B.较低的稳定状态⼈均产出增长率C.A和B D.较⾼的稳定状态⼈均产出增长率三、问答题1.政府政策为医学研究提供资⾦是⼀个经常被争论的问题。
a.运⽤外部性,社会收益和私⼈收益的概念,讨论政府为什么应该或者不应该为医学研究提供资⾦。
政府怎样才能⿎励私营公司增加研究开⽀?b.如果政府觉得需要对医学研究投⼊更⼤的资⾦,你认为政府是直接投资研究项⽬还是对投资这些研究私营公司采⽤激励政策更好?你认为这两个计划分别会对药品⽣产所产⽣的费⽤发⽣怎样的影响?2.⽐较两部门内⽣增长模型和索洛模型。
两个模型的相同之处是什么?两个模型的假设有不同?你觉得哪个更实际?请解释。
3.在索洛模型中,谈谈技术进步、资本存量的增长、⼈⼝的增长对稳定状态的⼈均收⼊增长率的影响?4.为了确定⼀个经济的资本⼤于还是⼩于黄⾦规则稳定状态,你需要什么数据?5.决策者可以如何影响⼀国的储蓄率?6.过去40年间⽣产率的增长率发⽣了什么变动?你如何解释这种现象、7.内⽣增长理论如何在没有外⽣技术进步的假设的情况下解释长期增长?这种解释与索洛模型有什么不同?8.证明下列有关⼈⼝增长与技术进步时稳定状态的每⼀种表述。
rketsWHAT’S NEW IN THE SIXTH EDITION:There are no major changes to this chapter.LEARNING OBJECTIVES:By the end of this chapter, students should understand:the link between buyers’ willingness to pay for a good and the demand curve.how to define and measure consumer surplus.the link between sellers’ costs of producing a good and the supply curve.how to define and measure producer surplus.that the equilibrium of supply and demand maximizes total surplus in a market.CONTEXT AND PURPOSE:Chapter 7 is the first chapter in a three-chapter sequence on welfare economics and market efficiency. Chapter 7 employs the supply and demand model to develop consumer surplus and producer surplus as a measure of welfare and market efficiency. These concepts are then utilized in Chapters 8 and 9 to determine the7CONSUMERS, PRODUCERS, AND THE EFFICIENCY OF MARKETSwinners and losers from taxation and restrictions on international trade.The purpose of Chapter 7 is to develop welfare economics—the study of how the allocation of resources affects economic well-being. Chapters 4 through 6 employed supply and demand in a positive framework, which focused on the question, “What is the equilibrium price and quantity in a market?” This chapter now addresses the normative question, “Is the equ ilibrium price and quantity in a market the best possible solution to the resource allocation problem, or is it simply the price and quantity that balance supply and demand?” Students will discover that under most circumstances the equilibrium price and quantity is also the one that maximizes welfare.KEY POINTS:Consumer surplus equals buyers’ willingness to pay for a good minus the amount they actually pay for it, and it measures the benefit buyers get from participating in a market. Consumer surplus can be computed by finding the area below the demand curve and above the price.Producer surplus equals the amount sellers receive for their goods minus their costs of production, and it measures the benefit sellers get from participating in a market. Producer surplus can be computed by finding the area below the price and above the supply curve.An allocation of resources that maximizes the sum of consumer and producer surplus is said to be efficient. Policymakers are often concerned with the efficiency, as well as the equality, of economic outcomes.The equilibrium of supply and demand maximizes the sum of consumer and producer surplus. That is, the invisible hand of the marketplace leads buyers and sellers to allocate resources efficiently.Markets do not allocate resources efficiently in the presence of market failures such as market power or externalities.CHAPTER OUTLINE:I. Definition of welfare economics: the study of how the allocation of resources affects economic well-being.II. Consumer SurplusStudents often are confused by the use of the word “welfare.” Remind them that we are talking about social well-being and not public assistance.A. Willingness to Pay1. Definition of willingness to pay: the maximum amount that abuyer will pay for a good.2. Example: You are auctioning a mint-condition recording ofElvis Presley’s first album. Four buyers show up. Theirwillingness to pay is as follows:If the bidding goes to slightly higher than $80,all buyers drop out except for John. Because Johnis willing to pay more than he has to for the album,he derives some benefit from participating in themarket.3. Definition of consumer surplus: the amount a buyer iswilling to pay for a good minus the amount the buyeractually pays for it.4. Note that if you had more than one copy of the album, theover $70 in the case of two albums) and both John and Paul would gain consumer surplus.B. Using the Demand Curve to Measure Consumer Surplus1. We can use the information on willingness to pay to derivea demand curve for the rare Elvis Presley album.2. At any given quantity, the price given by the demand curvereflects the willingness to pay of the marginal buyer.Because the demand curve shows the buyers’ willingness to pay, we can use the demand curve to measure consumersurplus.Figure 23. Consumer surplus can be measured as the area below thedemand curve and above the price.C. How a Lower Price Raises Consumer SurplusFigure 31. As price falls, consumer surplus increases for two reasons.a. Those already buying the product will receive additionalconsumer surplus because they are paying less for theproduct than before (area A on the graph).b. Because the price is now lower, some new buyers willenter the market and receive consumer surplus on theseadditional units of output purchased (area B on thegraph).D. What Does Consumer Surplus Measure?1. Remember that consumer surplus is the difference between the amount that buyers are willing to pay for a good and the price that they actually pay.2. Thus, it measures the benefit that consumers receive from the good as the buyers themselves perceive it.III. Producer SurplusA. Cost and the Willingness to Sell1. Definition of cost: the value of everything a seller mustgive up to produce a good .ALTERNATIVE CLASSROOM EXAMPLE:Review the material on price ceilings from Chapter 6. Redraw the market for two-bedroom apartments in your town. Draw in a price ceiling below the equilibrium price.Then go through:▪ consumer surplus before the price ceiling is put into place. ▪ consumer surplus after the price ceiling is put into place.You will need to take some time to explain the relationship between the producers’ willingness to sell and the cost of producing the good. The relationship between cost and the supply curve is not as apparent as the relationship between the demand curve and willingness to pay.It is important to stress that consumer surplus is measured in monetary terms. Consumer surplus gives us a way to place a monetary cost on inefficient market outcomes (due to government involvement or market failure).2. Example: You want to hire someone to paint your house. Youaccept bids for the work from four sellers. Each painter is willing to work if the price you will pay exceeds heropportunity cost. (Note that this opportunity cost thusrepresents willingness to sell.) The costs are:3. Bidding will stop when the price gets to be slightly below$600. All sellers will drop out except for Grandma. Because Grandma receives more than she would require to paint the house, she derives some benefit from producing in themarket.4. Definition of producer surplus: the amount a seller is paidfor a good minus the seller’s cost of providing it.5. Note that if you had more than one house to paint, theprice in the auction would end up being higher (a little under $800 in the case of two houses) and both Grandma and Georgia would gain producer surplus.B. Using the Supply Curve to Measure Producer Surplus1. We can use the information on cost (willingness to sell) toderive a supply curve for house painting services.Price Sellers QuantitySupplied$900 ormoreMary, Frida,Georgia, Grandma4$800 to$900Frida, Georgia,Grandma3$600 to$800Georgia, Grandma2$500 to$600Grandma1less than$500None02. At any given quantity, the price given by the supply curverepresents the cost of the marginal seller. Because thesupply curve shows the sellers’ cost (willingness to sell), we can use the supply curve to measure producer surplus. Figure 4Figure 53. Producer surplus can be measured as the area above thesupply curve and below the price.C. How a Higher Price Raises Producer Surplus1. As price rises, producer surplus increases for two reasons.a. Those already selling the product will receiveadditional producer surplus because they are receivingmore for the product than before (area C on the graph).b. Because the price is now higher, some new sellers willenter the market and receive producer surplus on theseadditional units of output sold (area D on the graph).D. Producer surplus is used to measure the economic well-beingof producers, much like consumer surplus is used to measure the economic well-being of consumers.Figure 6ALTERNATIVE CLASSROOM EXAMPLE:Review the material on price floors from Chapter 6. Redraw the market for anagricultural product such as corn. Draw in a price support above the equilibriumprice.Then go through:▪ producer surplus before the price support is put in place.▪ producer surplus after the price support is put in place.IV. Market EfficiencyA. The Benevolent Social Planner1. The economic well-being of everyone in society can bemeasured by total surplus, which is the sum of consumersurplus and producer surplus:Total Surplus = Consumer Surplus + ProducerSurplusTotal Surplus = (Value to Buyers – AmountPaid by Buyers) +(Amount Received by Sellers – Cost toSellers)Because the Amount Paid by Buyers = AmountReceived bySellers:2. Definition of efficiency: the property of a resource allocation of maximizing the total surplus received by all members of society .3. Definition of equality: the property of distributingeconomic prosperity uniformly the members of society .Total Surplus = Value to Buyers Cost to SellersNow might be a good time to point out that many government policies involve a trade-off between efficiency and equity. When you evaluate government policies, like price ceilings or floors, you can explain them in terms of equity and efficiency.Pretty Woman, Chapter 6. Vivien (Julia Roberts) and Edward (Richard Gere) negotiate a price. Afterward, Vivien reveals she would have accepted a lower price, while Edward admits he would have paid more. If you have done a good job of introducing consumer and producer surplus, you will see the light bulbs go off above your students’ heads as they watch this clip.B. Evaluating the Market EquilibriumFigure 71. At the market equilibrium price:a. Buyers who value the product more than the equilibriumprice will purchase the product; those who do not, willnot purchase the product. In other words, the freemarket allocates the supply of a good to the buyers whovalue it most highly, as measured by their willingnessto pay.b. Sellers whose costs are lower than the equilibrium pricewill produce the product; those whose costs are higher,will not produce the product. In other words, the freemarket allocates the demand for goods to the sellers whocan produce it at the lowest cost.2. Total surplus is maximized at the market equilibrium.Figure 8a. At any quantity of output smaller than the equilibriumquantity, the value of the product to the marginal buyer is greater than the cost to the marginal seller so total surplus would rise if output increases.b. At any quantity of output greater than the equilibriumquantity, the value of the product to the marginal buyer is less than the cost to the marginal seller so totalsurplus would rise if output decreases.3. Note that this is one of the reasons that economistsbelieve Principle #6: Markets are usually a good way toorganize economic activity.C. In the News: Ticket Scalping1. Ticket scalping is an example of how markets work toachieve an efficient outcome.2. This article from The Boston Globe describes economist ChipCase’s experience with ticket scalping.It would be a good idea to remind students that there are circumstances when the market process does not lead to the most efficient outcome. Examples include situations such as when a firm (or buyer) has market power over price or when there are externalities present. These situations will be discussed in later chapters.D. Case Study: Should There Be a Market in Organs?1. As a matter of public policy, people are not allowed tosell their organs.a. In essence, this means that there is a price ceiling onorgans of $0.b. This has led to a shortage of organs.2. The creation of a market for organs would lead to a moreefficient allocation of resources, but critics worry aboutthe equity of a market system for organs.V. Market Efficiency and Market FailureA. To conclude that markets are efficient, we made severalassumptions about how markets worked.1. Perfectly competitive markets.2. No externalities.B. When these assumptions do not hold, the market equilibriummay not be efficient.C. When markets fail, public policy can potentially remedy thesituation.SOLUTIONS TO TEXT PROBLEMS:Quick Quizzes1. Figure 1 shows the demand curve for turkey. The price ofturkey is P1 and the consumer surplus that results fromthat price is denoted CS. Consumer surplus is the amount abuyer is willing to pay for a good minus the amount thebuyer actually pays for it. It measures the benefit to buyers of participating in a market.Figure 1 Figure 22. Figure 2 shows the supply curve for turkey. The price ofturkey is P1 and the producer surplus that results from that price is denoted PS. Producer surplus is the amount sellers are paid for a good minus the sellers’ cost of providing it (measured by the supply curve). It measures the benefit to sellers of participating in a market.Figure 33. Figure 3 shows the supply and demand for turkey. The priceof turkey is P1, consumer surplus is CS, and producersurplus is PS. Producing more turkeys than the equilibriumquantity would lower total surplus because the value to themarginal buyer would be lower than the cost to the marginalseller on those additional units.Questions for Review1. The price a buyer is willing to pay, consumer surplus, andthe demand curve are all closely related. The height of thedemand curve represents the willingness to pay of thebuyers. Consumer surplus is the area below the demand curveand above the price, which equals the price that each buyeris willing to pay minus the price actually paid.2. Sellers' costs, producer surplus, and the supply curve areall closely related. The height of the supply curverepresents the costs of the sellers. Producer surplus isthe area below the price and above the supply curve, whichequals the price received minus each seller's costs ofproducing the good.Figure 43. Figure 4 shows producer and consumer surplus in a supply-and-demand diagram.4. An allocation of resources is efficient if it maximizestotal surplus, the sum of consumer surplus and producersurplus. But efficiency may not be the only goal ofeconomic policymakers; they may also be concerned aboutequity the fairness of the distribution of well-being.5. The invisible hand of the marketplace guides the self-interest of buyers and sellers into promoting generaleconomic well-being. Despite decentralized decision makingand self-interested decision makers, free markets oftenlead to an efficient outcome.6. Two types of market failure are market power andexternalities. Market power may cause market outcomes to beinefficient because firms may cause price and quantity todiffer from the levels they would be under perfectcompetition, which keeps total surplus from being maximized.Externalities are side effects that are not taken intoaccount by buyers and sellers. As a result, the free marketdoes not maximize total surplus.Problems and Applications1. a. Consumer surplus is equal to willingness to pay minusthe price paid. Therefore, Melissa’s willingness to paymust be $200 ($120 + $80).b. Her consumer surplus at a price of $90 would be $200 −$90 = $110.c. If the price of an iPod was $250, Melissa would not havepurchased one because the price is greater than herwillingness to pay. Therefore, she would receive noconsumer surplus.2. If an early freeze in California sours the lemon crop, thesupply curve for lemons shifts to the left, as shown inFigure 5. The result is a rise in the price of lemons and adecline in consumer surplus from A + B + C to just A. Soconsumer surplus declines by the amount B + C.Figure 5 Figure 6In the market for lemonade, the higher cost of lemonsreduces the supply of lemonade, as shown in Figure 6. Theresult is a rise in the price of lemonade and a decline inconsumer surplus from D + E + F to just D, a loss of E + F.Note that an event that affects consumer surplus in onemarket often has effects on consumer surplus in othermarkets.3. A rise in the demand for French bread leads to an increasein producer surplus in the market for French bread, asshown in Figure 7. The shift of the demand curve leads to an increased price, which increases producer surplus from area A to area A + B + C.Figure 7The increased quantity of French bread being sold increases the demand for flour, as shown in Figure 8. As a result, the price of flour rises, increasing producer surplus from area D to D + E + F. Note that an event that affectsproducer surplus in one market leads to effects on producer surplus in related markets.Figure 84. a. Bert’s demand schedule is:Price QuantityDemandedMore than$7$5 to $71$3 to $52$1 to $33$1 or less4Bert’s demand curve is shown in Figure 9.Figure 9b. When the price of a bottle of water is $4, Bert buys twobottles of water. His consumer surplus is shown as areaA in the figure. He values his first bottle of water at$7, but pays only $4 for it, so has consumer surplus of $3. He values his second bottle of water at $5, but pays only $4 for it, so has consumer surplus of $1. ThusBert’s total consumer surplus is $3 + $1 = $4, which is the area of A in the figure.c. When the price of a bottle of water falls from $4 to $2,Bert buys three bottles of water, an increase of one.His consumer surplus consists of both areas A and B in the figure, an increase in the amount of area B. He gets consumer surplus of $5 from the first bottle ($7 value minus $2 price), $3 from the second bottle ($5 valueminus $2 price), and $1 from the third bottle ($3 value minus $2 price), for a total consumer surplus of $9.Thus consumer surplus rises by $5 (which is the size of area B) when the price of a bottle of water falls from $4 to $2.5. a. Ernie’s supply schedule for water is:Price Quantity SuppliedMore than$74$5 to $73$3 to $52$1 to $31Less than$1Ernie’s sup ply curve is shown in Figure 10.Figure 10b. When the price of a bottle of water is $4, Ernie sellstwo bottles of water. His producer surplus is shown as area A in the figure. He receives $4 for his firstbottle of water, but it costs only $1 to produce, soErnie has producer surplus of $3. He also receives $4 for his second bottle of water, which costs $3 toproduce, so he has producer surplus of $1. Thus Ernie’s total producer surplus is $3 + $1 = $4, which is thearea of A in the figure.c. When the price of a bottle of water rises from $4 to $6,Ernie sells three bottles of water, an increase of one.His producer surplus consists of both areas A and B inthe figure, an increase by the amount of area B. He gets producer surplus of $5 from the first bottle ($6 priceminus $1 cost), $3 from the second bottle ($6 priceminus $3 cost), and $1 from the third bottle ($6 priceminus $5 price), for a total producer surplus of $9.Thus producer surplus rises by $5 (which is the size of area B) when the price of a bottle of water rises from$4 to $6.6. a. From Ernie’s supply schedule and Bert’s demandschedule, the quantity demanded and supplied are:Only a price of $4 brings supply and demand intoequilibrium, with an equilibrium quantity of two.b. At a price of $4, consumer surplus is $4 and producersurplus is $4, as shown in Problems 3 and 4 above. Total surplus is $4 + $4 = $8.c. If Ernie produced one less bottle, his producer surpluswould decline to $3, as shown in Problem 4 above. IfBert consumed one less bottle, his consumer surpluswould decline to $3, as shown in Problem 3 above. Sototal surplus would decline to $3 + $3 = $6.d. If Ernie produced one additional bottle of water, hiscost would be $5, but the price is only $4, so hisproducer surplus would decline by $1. If Bert consumedone additional bottle of water, his value would be $3,but the price is $4, so his consumer surplus woulddecline by $1. So total surplus declines by $1 + $1 = $2.7. a. The effect of falling production costs in the market forstereos results in a shift to the right in the supplycurve, as shown in Figure 11. As a result, theequilibrium price of stereos declines and theequilibrium quantity increases.Figure 11b. The decline in the price of stereos increases consumersurplus from area A to A + B + C + D, an increase in the amount B + C + D. Prior to the shift in supply, producer surplus was areas B + E (the area above the supply curve and below the price). After the shift in supply,producer surplus is areas E + F + G. So producer surplus changes by the amount F + G – B, which may be positiveor negative. The increase in quantity increases producer surplus, while the decline in the price reduces producer surplus. Because consumer surplus rises by B + C + D andproducer surplus rises by F + G – B, total surplusrises by C + D + F + G.c. If the supply of stereos is very elastic, then the shiftof the supply curve benefits consumers most. To take the most dramatic case, suppose the supply curve werehorizontal, as shown in Figure 12. Then there is noproducer surplus at all. Consumers capture all thebenefits of falling production costs, with consumersurplus rising from area A to area A + B.Figure 128. Figure 13 shows supply and demand curves for haircuts.Supply equals demand at a quantity of three haircuts and a price between $4 and $5. Firms A, C, and D should cut the hair of Ellen, Jerry, and Phil. Oprah’s willingness to pay is t oo low and firm B’s costs are too high, so they do not participate. The maximum total surplus is the area between the demand and supply curves, which totals $11 ($8 value minus $2 cost for the first haircut, plus $7 value minus $3cost for the second, plus $5 value minus $4 cost for the third).Figure 139. a. The effect of falling production costs in the market forcomputers results in a shift to the right in the supply curve, as shown in Figure 14. As a result, theequilibrium price of computers declines and theequilibrium quantity increases. The decline in the price of computers increases consumer surplus from area A to A + B + C + D, an increase in the amount B + C + D.Figure 14 Figure 15Prior to the shift in supply, producer surplus was areasB + E (the area above the supply curve and below theprice). After the shift in supply, producer surplus isareas E + F + G. So producer surplus changes by theamount F + G – B, which may be positive or negative.The increase in quantity increases producer surplus,while the decline in the price reduces producer surplus.Because consumer surplus rises by B + C + D and producersurplus rises by F + G – B, total surplus rises by C +D + F + G.b. Because typewriters are substitutes for computers, thedecline in the price of computers means that peoplesubstitute computers for typewriters, shifting thedemand for typewriters to the left, as shown in Figure15. The result is a decline in both the equilibriumprice and equilibrium quantity of typewriters. Consumersurplus in the typewriter market changes from area A + Bto A + C, a net change of C – B. Producer surpluschanges from area C + D + E to area E, a net loss of C +D. Typewriter producers are sad about technologicaladvances in computers because their producer surplusdeclines.c. Because software and computers are complements, thedecline in the price and increase in the quantity ofcomputers means that the demand for software increases,shifting the demand for software to the right, as shownin Figure 16. The result is an increase in both theprice and quantity of software. Consumer surplus in thesoftware market changes from B + C to A + B, a netchange of A – C. Producer surplus changes from E to C +D + E, an increase of C + D, so software producersshould be happy about the technological progress incomputers.Figure 16d. Yes, this analysis helps explain why Bill Gates is onethe world’s richest people, because his companyproduces a lot of software that is a complement withcomputers and there has been tremendous technologicaladvance in computers.10. a. With Provider A, the cost of an extra minute is $0.With Provider B, the cost of an extra minute is $1.b. With Provider A, my friend will purchase 150 minutes [=150 – (50)(0)]. With Provider B, my friend wouldpurchase 100 minutes [= 150 – (50)(1)].c. With Provider A, he would pay $120. The cost would be $100 with Provider B.Figure 17d. Figure 17 shows the friend’s demand. With Provider A,he buys 150 minutes and his consumer surplus is equal to(1/2)(3)(150) – 120 = 105. With Provider B, hisconsumer surplus is equal to (1/2)(2)(100) = 100.e. I would recommend Provider A because he receives greater consumer surplus.11. a. Figure 18 illustrates the demand for medical care.If each procedure has a price of $100, quantity demandedwill be Q1 procedures.曼昆微观经济学课后练习英文答案(第七章)Figure 18b. If consumers pay only $20 per procedure, the quantitydemanded will be Q2 procedures. Because the cost tosociety is $100, the number of procedures performed istoo large to maximize total surplus. The quantity thatmaximizes total surplus is Q1 procedures, which is lessthan Q2.c. The use of medical care is excessive in the sense thatconsumers get procedures whose value is less than thecost of producing them. As a result, the economy’stotal surplus is reduced.d. To prevent this excessive use, the consumer must bearthe marginal cost of the procedure. But this wouldrequire eliminating insurance. Another possibility wouldbe that the insurance company, which pays most of themarginal cost of the procedure ($80, in this case) coulddecide whether the procedure should be performed. Butthe insurance company does not get the benefits of theprocedure, so its decisions may not reflect the value tothe consumer.151 / 31© 2012 Cengage Learning. All Rights Reserved. May not be scanned, copied or duplicated, or posted to a publicly accessible website, in whole or in part.。
✍ the factors that determine a country’s productivity.✍ how a country’s policies influence its productivity growth. CONTEXT AND PURPOSE:Chapter 12 is the first chapter in a four-chapter sequence on the production of output in the long run. Chapter 12 addresses the determinants of the level and growth rate of output. We find that capital and labor are among the primary determinants of output. In Chapter 13, we address how saving andinvestment in capital goods affect the production of output, and in Chapter 14, we learn about some of the tools people and firms use when choosing capital projects in which to invest. In Chapter 15, we address the market for labor.The purpose of Chapter 12 is to examine the long-run determinants of both the level and the growth rate of real GDP per person. Along the way, we will discover the factors that determine the productivity of workers and address what governments might do to improve the productivity of their citizens. KEY POINTS:?Economic prosperity, as measured by GDP per person, varies substantially around the world. The average income in the world’s richest countries is more than ten times that in the world’s poorest countries. Because growth rates of real GDP also vary substantially, the relative positions of countries can change dramatically over time. ?The standard of living in an economy depends on the economy’s ability to produce goods and services. Productivity, in turn, depends on the amounts of physical capital, human capital, natural resources, and technological knowledge available to workers. ?Government policies can try to influence the economy’s growth rate in many ways: by encouraging saving and investment, encouraging investment from abroad, fostering education, promoting good health, maintaining property rights and political stability, allowing free trade, and promoting the research and development of new technologies. ?The accumulation of capital is subject to diminishing returns: The more capital an economy has, the less additional output the economy gets from an extra unit of capital. As a result, while higher saving leads to higher growth for a period of time, growth eventually slows down as capital, productivity, and income rise. Also because of diminishing returns, the return to capital is especially high in poor countries. Other things equal, these countries can grow faster because of the catch-up effect. ?Population growth has a variety of effects on economic growth. On the one hand, more rapid population growth may lower productivity by stretching the supply of natural resources and by reducing the amount of capital available for each worker. On the other hand, a larger population may enhance the rate of technological progress because there are more scientists and engineers. CHAPTER OUTLINE: I. Economic Growth around the World 2. Growth rates are also reported in the table. Japan has had the largest growth rate over time,2.65% per year (on average).Use Table 1 to make the point that a one-percentage point change in a country’s growth rate can make a significant difference over several generations. The powerfuleffects of compounding should be used to underscore the process of economicgrowth.3. Because of different growth rates, the ranking of countries by income per person changesover time.a. In the late 19th century, the United Kingdom was the richest country in the world.b. Today, income per person is lower in the United Kingdom than in the United States (aformer colony of the United Kingdom).B. FYI: Are You Richer Than the Richest American1. According to the magazine American Heritage, the richest American of all time is John B.Rockefeller, whose wealth today would be the equivalent of approximately $200 billion.2. Yet, because Rockefeller lived from 1839 to 1937, he did not get the chance to enjoy manyof the conveniences we take for granted today such as television, air conditioning, andmodern medicine.3. Thus, because of technological advances, the average American today may enjoy a “richer”life than the richest American who lived a century ago.C. FYI: A Picture Is Worth a Thousand Statistics1. This box presents three photos showing a typical family in three countries – the UnitedKingdom, Mexico, and Mali. Each family was photographed outside their home, together withall of their material possessions.2. These photos demonstrate the vast difference in the standards of living in these countries. II. Productivity: Its Role and DeterminantsA. Why Productivity Is So Important1. Example: Robinson Crusoea. Because he is stranded alone, he must catch his own fish, grow his own vegetables, andmake his own clothes.b. His standard of living depends on his ability to produce goods and services.2. Definition of productivity: the quantity of goods and services produced from eachunit of labor input.3. Review of Principle #8: A Country’s Standard of Living Depends on Its Ability to ProduceGoods and Services.B. How Productivity Is Determined1. Physical Capital per Workera. Definition of physical capital: the stock of equipment and structures used toproduce goods and services.b. Example: Crusoe will catch more fish if he has more fishing poles.2. Human Capital per Workera. Definition of human capital: the knowledge and skills that workers acquirethrough education, training, and experience.b. Example: Crusoe will catch more fish if he has been trained in the best fishing techniquesor as he gains experience fishing.3. Natural Resources per Workera. Definition of natural resources: the inputs into production that are provided bynature, such as land, rivers, and mineral deposits.b. Example: Crusoe will have better luck catching fish if there is a plentiful supply aroundhis island.4. Technological Knowledgea. Definition of technological knowledge: society’s understanding of the best waysto produce goods and services.b. Example: Crusoe will catch more fish if he has invented a better fishing lure.C. FYI: The Production Function1. A production function describes the relationship between the quantity of inputs used inproduction and the quantity of output from production.2. The production function generally is written like this:where Y = output, L = quantity of labor, K = quantity of physical capital, H = quantity of human capital, N = quantity of natural resources, A reflects the available productiontechnology, and F () is a function that shows how inputs are combined to produce output. 3. Many production functions have a property called constant returns to scale.a. This property implies that as all inputs are doubled, output will exactly double.b. This implies that the following must be true: where x = 2 if inputs are doubled.c. This also means that if we want to examine output per worker we could set x = 1/L and we would get the following:This shows that output per worker depends on the amount of physical capital per worker (K /L ), the amount of human capital per worker (H /L ), and the amount of naturalresources per worker (N /L ).4. Case Study: Are Natural Resources a Limit to Growth a. This section points out that as the population has grown over time, we have discoveredways to lower our use of natural resources. Thus, most economists are not worried about shortages of natural resources.1. Because capital is a produced factor of production, a society can change the amount ofcapital that it has. 2. However, there is an opportunity cost of doing so; if resources are used to produce capital goods, fewer goods and services are produced for current consumption.B. Diminishing Returns and the Catch-Up Effect 1. Definition of diminishing returns: the property whereby the benefit from an extraunit of an input declines as the quantity of the input increases .b. This can be seen in Figure 1, which shows how the amount of capital per workerdetermines the amount of output per worker, holding constant all other determinants of output.c. Thus, if workers already have a large amount of capital to work with, giving them an additional unit of capital will not increase their productivity by much.d. In the long run, a higher saving rate leads to a higher level of productivity and income,but not to higher growth rates in these variables. 2. An important implication of diminishing returns is the catch-up effect.a. Definition of catch-up effect: the property whereby countries that start off poor tend to grow more rapidly than countries that start off rich .b. When workers have very little capital to begin with, an additional unit of capital will increase their productivity by a great deal.C. Investment from Abroad1. Saving by domestic residents is not the only way for a country to invest in new capital.2. Investment in the country by foreigners can also occur.a. Foreign direct investment occurs when a capital investment is owned and operated by a foreign entity.b. Foreign portfolio investment occurs when a capital investment is financed with foreignmoney but operated by domestic residents.3. Some of the benefits of foreign investment flow back to foreign owners. But the economy stillexperiences an increase in the capital stock, which leads to higher productivity and higherwages.4. The World Bank is an organization that tries to encourage the flow of investment to poorcountries.a. The World Bank obtains funds from developed countries such as the United States andmakes loans to less-developed countries so that they can invest in roads, sewer systems,schools, and other types of capital.b. The World Bank also offers these countries advice on how best to use these funds.D. Education1. Investment in human capital also has an opportunity cost.a. When students are in class, they cannot be producing goods and services forconsumption.b. In less-developed countries, this opportunity cost is considered to be high; as a result,children often drop out of school at a young age.2. Because there are positive externalities in education, the effect of lower education on theeconomic growth rate of a country can be large.3. Many poor countries also face a “brain drain”—the best educated often leave to go to othercountries where they can enjoy a higher standard of living.E. Health and Nutrition1. Human capital can also be used to describe another type of investment in people:expenditures that lead to a healthier population.2. Other things being equal, healthier workers are more productive.3. Making the right investments in the health of the population is one way for a nation toincrease productivity.F. Property Rights and Political Stability1. Protection of property rights and promotion of political stability are two other important waysthat policymakers can improve economic growth.2. There is little incentive to produce products if there is no guarantee that they cannot betaken. Contracts must also be enforced.3. Countries with questionable enforcement of property rights or an unstable political climatewill also have difficulty in attracting foreign (or even domestic) investment.4. In the News: Does Food Aid Help or Hurta. Economic policies designed to improve productivity sometimes have adverse unintendedeffects.b. This article from The Wall Street Journal, Real Time Economics blog discusses economicresearch on the effects of food aid to poor countries on armed conflict in a recipientcountry.G. Free Trade1. Some countries have tried to achieve faster economic growth by avoiding transacting withthe rest of the world.2. However, trade allows a country to specialize in what it does best and thus consume beyondits production possibilities.3. When a country trades wheat for steel, it is as well off as it would be if it had developed anew technology for turning wheat into steel.4. The amount a nation trades is determined not only by government policy but also bygeography.a. Countries with good, natural seaports find trade easier than countries without thisresource.b. Countries with more than 80 percent of their population living within 100 kilometers of acoast have an average GDP per person that is four times as large as countries with lessthan 20 percent of their population living near a coast.H. Research and Development1. The primary reason why living standards have improved over time has been due to largeincreases in technological knowledge.2. Knowledge can be considered a public good.3. The U.S. government promotes the creation of new technological information by providingresearch grants and providing tax incentives for firms engaged in research.4. The patent system also encourages research by granting an inventor the exclusive right toproduce the product for a specified number of years.I. Population Growth1. Stretching Natural Resourcesa. Thomas Malthus (an English minister and early economic thinker) argued that an ever-increasing population meant that the world was doomed to live in poverty forever.b. However, he failed to understand that new ideas would be developed to increase theproduction of food and other goods, including pesticides, fertilizers, mechanizedequipment, and new crop varieties.2. Diluting the Capital Stocka. High population growth reduces GDP per worker because rapid growth in the number ofworkers forces the capital stock to be spread more thinly.b. Countries with a high population growth have large numbers of school-age children,placing a burden on the education system.3. Some countries have already instituted measures to reduce population growth rates.4. Policies that foster equal treatment for women should raise economic opportunities forwomen leading to lower rates of population.5. Promoting Technological Progressa. Some economists have suggested that population growth has driven technologicalprogress and economic prosperity.b. In a 1993 journal article, economist Michael Kremer provided evidence that increases inSOLUTIONS TO TEXT PROBLEMS:Quick Quizzes1. The approximate growth rate of real GDP per person in the United States is 1.77 percent(based on Table 1) from 1870 to 2010. Countries that have had faster growth include Japan,Brazil, Mexico, China, Germany, and Canada; countries that have had slower growth includeArgentina, India, United Kingdom, Indonesia, Pakistan, and Bangladesh.2. The four determinants of a country’s productivity are: (1) physical capital, which is the stockof equipment and structures that are used to produce goods and services; (2) human capital,which is the knowledge and skills that workers acquire through education, training, andexperience; (3) natural resources, which are inputs into production that are provided bynature, such as land, rivers, and mineral deposits; and (4) technological knowledge, which issociety’s understanding of the best ways to produce goods and services.3. Ways in which a government policymaker can try to raise the growth in living standards in asociety include: (1) investing more current resources in the production of capital, which hasthe drawback of reducing the resources used for producing current consumption; (2)encouraging investment from abroad, which has the drawback that some of the benefits ofinvestment flow to foreigners; (3) increasing education, which has an opportunity cost in thatstudents are not engaged in current production; (4) protecting property rights and promotingpolitical stability, which has the drawback of enforcement costs; (5) pursuing outward-oriented policies to encourage free trade, which may have the drawback of making a countrymore dependent on its trading partners; (6) reducing the rate of population growth, whichmay have the drawbacks of reducing individual freedom and lowering the rate oftechnological progress; and (7) encouraging research and development, which (likeinvestment) may have the drawback of reducing current consumption.Questions for Review1. The level of a nation’s GDP measures both the total income earned in the economy and thetotal expenditure on the economy’s output of goods and services. The level of real GDP is agood gauge of economic prosperity, and the growth rate of real GDP is a good gauge ofeconomic progress. You would rather live in a nation with a high level of GDP, even though ithad a low growth rate, than in a nation with a low level of GDP and a high growth rate,because the level of GDP is a measure of prosperity.2. The four determinants of productivity are: (1) physical capital, which is the stock ofequipment and structures that are used to produce goods and services; (2) human capital,which consists of the knowledge and skills that workers acquire through education, training,and experience; (3) natural resources, which are inputs into production that are provided bynature; and (4) technological knowledge, which is society’s understanding of the best waysto produce goods and services.3. A college degree is a form of human capital. The skills learned in earning a college degreeincrease a worker's productivity.4. Higher saving means fewer resources are devoted to consumption and more to producingcapital goods. The rise in the capital stock leads to rising productivity and more rapid growthin GDP for a while. In the long run, the higher saving rate leads to a higher standard of living.A policymaker might be deterred from trying to raise the rate of saving because doing sorequires that people reduce their consumption today and it can take a long time to get to ahigher standard of living.5. A higher rate of saving leads to a higher growth rate temporarily, not permanently. In theshort run, increased saving leads to a larger capital stock and faster growth. But as growthcontinues, diminishing returns to capital mean growth slows down and eventually settlesdown to its initial rate, though this may take several decades.6. Removing a trade restriction, such as a tariff, would lead to more rapid economic growthbecause the removal of the trade restriction acts like an improvement in technology. Freetrade allows all countries to consume more goods and services.7. The higher the rate of population growth, the lower is the level of GDP per person becausethere's less capital per person, hence lower productivity.8. The U.S. government tries to encourage advances in technological knowledge by providingresearch grants through the National Science Foundation and the National Institute of Health,with tax breaks for firms engaging in research and development, and through the patentsystem.Quick Check Multiple Choice1. b2. c3. d4. c5. c6. aProblems and Applications1. The facts that countries import many goods and services yet must produce a large quantityof goods and services themselves to enjoy a high standard of living are reconciled by notingthat there are substantial gains from trade. To be able to afford to purchase goods fromother countries, an economy must generate income. By producing many goods and services,then trading them for goods and services produced in other countries, a nation maximizes itsstandard of living.2. a. More investment would lead to faster economic growth in the short run.b. The change would benefit many people in society who would have higher incomes as theresult of faster economic growth. However, there might be a transition period in whichworkers and owners in consumption-good industries would get lower incomes, andworkers and owners in investment-good industries would get higher incomes. In addition, some group would have to reduce their spending for some time so that investment could rise.3. a. Private consumption spending includes buying food and buying clothes; privateinvestment spending includes people buying houses and firms buying computers. Manyother examples are possible. Education can be considered as both consumption andinvestment.b. Government consumption spending includes paying workers to administer governmentprograms; government investment spending includes buying military equipment andbuilding roads. Many other examples are possible.4. The opportunity cost of investing in capital is the loss of consumption that results fromredirecting resources toward investment. Over-investment in capital is possible because of diminishing marginal returns. A country can "over-invest" in capital if people would prefer to have higher consumption spending and less future growth. The opportunity cost of investing in human capital is also the loss of consumption that is needed to provide the resources for investment. A country could "over-invest" in human capital if people were too highlyeducated for the jobs they could get for example, if the best job a Ph.D. in philosophy could find is managing a restaurant.5. a. The United States benefited from the Chinese and Japanese investment because it madeour capital stock larger, increasing our economic growth.b. It would have been better for Americans to make the investments because then theywould have received all of the returns on the investments, instead of the returns going to China and Japan.6. Greater educational opportunities for women could lead to faster economic growth in thesedeveloping countries because increased human capital would increase productivity and there would be external effects from greater knowledge in the country. Second, increasededucational opportunities for young women may lower the population growth rate because such opportunities raise the opportunity cost of having a child.7. a. Individuals with higher incomes have better access to clean water, medical care, andgood nutrition.b. Healthier individuals are likely to be more productive.c. Understanding the direction of causation will help policymakers place proper emphasis onthe programs that will achieve both greater health and higher incomes.8. Peace would promote economic growth because it is an indication that property rights will berespected in the future. Armed conflict and the threat of a revolutionary government reduce domestic residents' incentive to save, invest, and start new businesses. Moreover, foreigners have less incentive to invest in the country.Easy taxes would promote economic growth because they result in citizens and businesses retaining a greater share of the income they earn and, thus, being able to save and invest a greater portion of that income.A tolerable administration of justice would promote economic growth because it wouldensure the maintenance of property rights, which encourages domestic saving andinvestment from abroad.。
答:按 1992 年的价格衡量, 1997 年的实际收入是 72419.7 亿元。
二十三章1 下列每种交易会影响 CDP 的哪一部分 (如果有影响的话 ) 并解释之。
A . 家庭购买了一台新冰箱。
答:家庭购买了一台新冰箱会增加GDP 中的消费 (C) 部分,因为家庭用于家用电器的支出计算在消费的耐用品类中。
B . 杰妮姑妈买了一所新房子。
答:杰妮姑妈买了一所新房子会增加 GDP 中的投资 (1) 部分,因为家庭住宅能长期供人 居住,提供服务。
它比一般耐用消费品的使用寿命更长,因此把住宅房屋的投资计算在 投资中。
C.福特汽车公司由其存货中出售了一部雷鸟牌汽车。
答:福利汽车公司由其存货中出售了一部雷鸟牌汽车会减少现期GDP 中的投资, 因为销售 中间物品存货时,企业的存货投资是负的,因而减少了当期的 GDP 。
C . 你买了一个比萨饼。
答:我买了一个比萨饼会增加 GDP 中的消费 (C) ,因为我用于购买食品的支出计算在消 费的非耐用品类中。
D . 加利福尼亚重新铺设了 101 号高速公路。
答:加利福尼亚重新铺设了 101 号高速公路增加了 GDP 中的政府购买 (G) ,因为修建高 速公路是政府的行为。
E . 你的父母购买了一瓶法国红酒。
答:我的父母购买了一瓶法国红酒会减少 GDP 中的净出口 (NX) ,因为法国红酒是进口食品,它的购买增加了美国的进口。
F . 本田公司扩大其在俄亥俄州马利斯维尔的工厂。
答:本田公司扩大其在俄亥俄州马利斯维尔的工厂增加了GDP 中的净出口 (NX) ,因为本 田公司是一家日本企业,它在美国的投资减少了美国对日本本田汽车的进口,使 NX 增 加2. GDP 组成部分中的“政府购买”并不包括用于社会保障这类转移支付的支出。
想想GDP 的定义,解释为什么转移支付不包括在政府购买内答: 因为转移支付并不是要交换现在生产的物品或劳务, 从宏观经济的角度看, 转移支付就像税收和回扣一样。
曼昆《宏观经济学》(第9版)章节习题精编详解第6篇宏观经济政策专题第20章金融系统:机会与危险一、关键概念1.金融系统(financial system)答:金融系统是指代经济中促进储蓄者和投资者之间资金流动的机构的概括性术语,其主要职能是将来自储蓄者的资源引导到各种形式的投资中去。
金融系统的一个部分是金融市场的集合,另一个部分是金融中介的集合。
2.金融市场(financial markets)答:金融市场是指资金融通市场,资金供给者和资金需求者双方通过信用工具进行交易而融通资金的市场。
广义的金融市场是指实现货币借贷、资金融通、办理各种票据和有价证券交易活动的场所。
通过金融市场,家庭能够直接为投资提供资源。
两个重要的金融市场是债券市场和股票市场。
3.债券(bonds)答:债券代表债券持有人给企业的贷款。
通过发行债券来筹集投资资金称为债券融资。
债券是直接融资形式之一,发行者通常是公司或政府。
4.股票(stocks)答:股票代表企业股东的所有权要求。
通过发行股票来筹集资金称为股权融资。
股票是直接融资形式之一。
5.债务融资(debt finance)答:债务融资是指企业通过发行债券来筹集投资资金,资金供给者作为债权人享有到期收回本息的一种融资方式。
债务融资属于直接融资,其经营风险较小,预期收益也相对较小。
6.股权融资(equity finance)答:股权融资是指通过发行股票,引进新股东来筹集资金,企业无须还本付息,但是新老股东共享企业的收益。
股权融资属于直接融资,主要用于解决企业运营资金短缺的问题。
7.金融中介(financial intermediaries)答:金融系统是金融中介的集合,通过金融中介,家庭能够间接地为投资提供资源。
金融中介连接市场的两端,帮助金融资源流向它们的最佳用途。
商业银行是最广为人知的金融中介类型。
它们从储蓄者那里吸收存款,用这些存款给那些需要为投资项目融资的人放贷。
8.厌恶风险(risk averse)答:投资天生是有风险的。
曼昆经济学原理答案英文版一、选择题1、在经济学中,什么是GDP?A.国内生产总值B.国民生产总值C.国内总收入D.国民总收入答案:A.国内生产总值(Gross Domestic Product,GDP)是指一个国家在一定时期内所有常住单位的生产活动的最终成果。
2、GDP的计算方法是什么?A.收入法B.支出法C.生产法D.混合法答案:B.支出法。
GDP可以通过对一国所有常住单位的商品和服务的最终消费支出、资本形成总额和货物与服务净出口进行计算,这种计算方法被称为支出法。
3、在经济学中,什么是通货膨胀?A.货币贬值B.物价上涨C.货币供应增加D.以上都不是答案:A.通货膨胀是指商品和服务的总体价格水平上升,导致货币购买力下降。
4、什么是货币政策?A.政府调节货币供应量的政策B.政府调节利率的政策C.政府调节汇率的政策D.以上都不是答案:A.货币政策是指中央银行通过控制货币供应量来调节利率和影响经济活动的政策。
二、简答题1、请简述GDP的概念及作用。
答案:GDP是指一个国家在一定时期内所有常住单位的生产活动的最终成果。
GDP是国民经济核算的核心指标,也是衡量一个国家经济状况和发展水平的重要指标。
它反映了整个国家经济运行的有效性,以及国民收入分配的公平性。
2、请简述通货膨胀的原因及影响。
答案:通货膨胀的原因有多种,包括货币供应量增加、需求拉动、成本推动等。
其中,货币供应量增加是最主要的原因。
当货币供应量增加时,物价上涨,导致货币购买力下降。
通货膨胀会对经济产生负面影响,包括降低消费者购买力、增加企业成本、扭曲价格信号等。
通货膨胀还会导致社会不稳定和政治风险。
曼昆的经济学原理课件是经济学教育中的重要资源,它以深入浅出的方式解释了经济学的基本原理和概念。
本文将对这些原理进行概述,并解释它们在现实生活中的应用。
曼昆的经济学原理主要包括微观经济学和宏观经济学两个部分。
微观经济学主要研究个体经济单位的行为和决策,如消费者、企业和政府。
【最新整理,下载后即可编辑】Answers to Textbook Questions and ProblemsCHAPTER 9 Economic Growth II: Technology, Empirics, and Policy Questions for Review1. In the Solow model, we find that only technological progress canaffect the steady-state rate of growth in income per worker. Growth in the capital stock (through high saving) has no effect on the steady-state growth rate of income per worker; neither does population growth.But technological progress can lead to sustained growth.2. In the steady state, output per person in the Solow model grows at the rate of technological progress g. Capital per person also grows at rate g. Note that this implies that output and capital per effective worker are constant in steady state. In the U.S. data, output and capital per worker have both grown at about 2 percent per year for the past half-century.3. To decide whether an economy has more or less capital than theGolden Rule, we need to compare the marginal product of capital net of depreciation (MPK –δ) with the growt h rate of total output (n + g). The growth rate of GDP is readily available. Estimating the netmarginal product of capital requires a little more work but, as shown in the text, can be backed out of available data on the capital stockrelative to GDP, the total amount of depreciation relative to GDP, and capital’s share in GDP.4. Economic policy can influence the saving rate by either increasingpublic saving or providing incentives to stimulate private saving. Public saving is the difference between government revenue and government spending. If spending exceeds revenue, the government runs a budget deficit, which is negative saving. Policies that decrease the deficit (such as reductions in government purchases or increases in taxes) increase public saving, whereas policies that increase the deficit decrease saving.A variety of government policies affect private saving. The decision bya household to save may depend on the rate of return; the greater thereturn to saving, the more attractive saving becomes. Tax incentives such as tax-exempt retirement accounts for individuals and investment tax credits for corporations increase the rate of return and encourage private saving.5. The legal system is an example of an institutional difference betweencountries that might explain differences in income per person.Countries that have adopted the English style common law systemtend to have better developed capital markets, and this leads to more rapid growth because it is easier for businesses to obtain financing. The quality of government is also important. Countries with moregovernment corruption tend to have lower levels of income per person.6. Endogenous growth theories attempt to explain the rate oftechnological progress by explaining the decisions that determine the creation of knowledge through research and development. By contrast, the Solow model simply took this rate as exogenous. In the Solowmodel, the saving rate affects growth temporarily, but diminishingreturns to capital eventually force the economy to approach a steady state in which growth depends only on exogenous technologicalprogress. By contrast, many endogenous growth models in essenceassume that there are constant (rather than diminishing) returns tocapital, interpreted to include knowledge. Hence, changes in the saving rate can lead to persistent growth.Problems and Applications1. a. In the Solow model with technological progress, y is defined asoutput per effective worker, and k is defined as capital per effective worker. The number of effective workers is defined as L E (orLE), where L is the number of workers, and E measures theefficiency of each worker. To find output per effective worker y,divide total output by the number of effective workers:Y LE =K12(LE)12LEY LE =K12L12E12LEY LE =K12 L12E12Y LE =KLE æèççöø÷÷12y=k1b. To solve for the steady-state value of y as a function of s, n, g, andδ, we begin with the equation for the change in the capital stock in the steady state:Δk = sf(k) –(δ + n + g)k = 0.The production function ycan also be rewritten as y2 = k.Plugging this production function into the equation for the changein the capital stock, we find that in the steady state:sy –(δ + n + g)y2 = 0.Solving this, we find the steady-state value of y:y* = s/(δ + n + g).c. The question provides us with the following information about each country:Atlantis: s = 0.28 Xanadu: s = 0.10n = 0.01 n = 0.04g = 0.02 g = 0.02δ = 0.04δ = 0.04Using the equation for y* that we derived in part (a), we cancalculate the steady-state values of y for each country.Developed country: y* = 0.28/(0.04 + 0.01 + 0.02) = 4Less-developed country: y* = 0.10/(0.04 + 0.04 + 0.02) = 1 2. a. In the steady state, capital per effective worker is constant, and thisleads to a constant level of output per effective worker. Given that the growth rate of output per effective worker is zero, this means the growth rate of output is equal to the growth rate of effective workers (LE). We know labor grows at the rate of population growth n and the efficiency of labor (E) grows at rate g. Therefore, output grows at rate n+g. Given output grows at rate n+g and labor grows at rate n,output per worker must grow at rate g. This follows from the rule that the growth rate of Y/L is equal to the growth rate of Y minus the growth rate of L.b. First find the output per effective worker production function by dividing both sides of the production function by the number of effective workers LE:Y LE =K13(LE)23LEYLE=K13L23E23LEYLE=K13L13E13YLE=KLEæèçöø÷13y=k13To solve for capital per effective worker, we start with the steady state condition:Δk = sf(k) –(δ + n + g)k = 0.Now substitute in the given parameter values and solve for capital per effective worker (k):Substitute the value for k back into the per effective workerproduction function to find output per effective worker is equal to2. The marginal product of capital is given bySubstitute the value for capital per effective worker to find themarginal product of capital is equal to 1/12.c. According to the Golden Rule, the marginal product of capital isequal to (δ + n + g) or 0.06. In the current steady state, the marginal product of capital is equal to 1/12 or 0.083. Therefore, we have less capital per effective worker in comparison to the Golden Rule. Asthe level of capital per effective worker rises, the marginal product of capital will fall until it is equal to 0.06. To increase capital pereffective worker, there must be an increase in the saving rate.d. During the transition to the Golden Rule steady state, the growth rateof output per worker will increase. In the steady state, output perworker grows at rate g. The increase in the saving rate will increaseoutput per effective worker, and this will increase output pereffective worker. In the new steady state, output per effective worker is constant at a new higher level, and output per worker is growing at rate g. During the transition, the growth rate of output per workerjumps up, and then transitions back down to rate g.3. To solve this problem, it is useful to establish what we know about the U.S. economy:• A Cobb–Douglas production function has the form y = kα, where α is capital’s share of income. The question tells us that α = 0.3,so we know that the production function is y = k0.3.•In the steady state, we know that the growth rate of output equals 3 percent, so we know that (n + g) = 0.03.•The deprec iation rate δ = 0.04.•The capital–output ratio K/Y = 2.5. Because k/y =[K/(LE)]/[Y/(LE)] = K/Y, we also know that k/y = 2.5. (That is, the capital–output ratio is the same in terms of effective workers as it is in levels.)a. Begin with the steady-state condition, sy = (δ + n + g)k. Rewritingthis equation leads to a formula for saving in the steady state:s = (δ + n + g)(k/y).Plugging in the values established above:s = (0.04 + 0.03)(2.5) = 0.175.The initial saving rate is 17.5 percent.b. We know from Chapter 3 that with a Cobb–Douglas production function, capital’s share of income α = MPK(K/Y). Rewriting, we haveMPK = α/(K/Y).Plugging in the values established above, we findMPK = 0.3/2.5 = 0.12.c. We know that at the Golden Rule steady state:MPK = (n + g + δ).Plugging in the values established above:MPK = (0.03 + 0.04) = 0.07.At the Golden Rule steady state, the marginal product of capital is 7 percent, whereas it is 12 percent in the initial steady state. Hence, from the initial steady state we need to increase k to achieve theGolden Rule steady state.d. We know from Chapter 3 that for a Cobb–Douglas production function, MPK = α (Y/K). Solving this for the capital–outputratio, we findK/Y = α/MPK.We can solve for the Golden Rule capital–output ratio using this equation. If we plug in the value 0.07 for the Golden Rule steady-state marginal product of capital, and the value 0.3 for α, we findK/Y = 0.3/0.07 = 4.29.In the Golden Rule steady state, the capital–output ratio equals4.29, compared to the current capital–output ratio of 2.5.e. We know from part (a) that in the steady states = (δ + n + g)(k/y),where k/y is the steady-state capital–output ratio. In theintroduction to this answer, we showed that k/y = K/Y, and in part(d) we found that the Golden Rule K/Y = 4.29. Plugging in thisvalue and those established above:s = (0.04 + 0.03)(4.29) = 0.30.To reach the Golden Rule steady state, the saving rate must risefrom 17.5 to 30 percent. This result implies that if we set the saving rate equal to the share going to capital (30 percent), we will achieve the Golden Rule steady state.4. a. In the steady state, we know that sy = (δ + n + g)k. This implies thatk/y = s/(δ + n + g).Since s, δ, n, and g are constant, this means that the ratio k/y is also constant. Since k/y = [K/(LE)]/[Y/(LE)] = K/Y, we can conclude that in the steady state, the capital–output ratio is constant.b. We know that capital’s share of income = MPK (K/Y). In thesteady state, we know from part (a) that the capital–output ratioK/Y is constant. We also know from the hint that the MPK is afunction of k, which is constant in the steady state; therefore theMPK itself must be constant. Thus, capital’s share of income isconstant. Labor’s share of income is 1 – [C apital’s Share].Hence, if capital’s share is constant, we see that labor’s share of income is also constant.c. We know that in the steady state, total income grows at n + g,defined as the rate of population growth plus the rate oftechnological change. In part (b) we showed that labor’s andcapital’s share of income is constant. If the shares are constant,and total income grows at the rate n + g, then labor income andcapital income must also grow at the rate n + g.d. Define the real rental price of capital R asR = Total Capital Income/Capital Stock= (MPK K)/K= MPK.We know that in the steady state, the MPK is constant becausecapital per effective worker k is constant. Therefore, we canconclude that the real rental price of capital is constant in the steady state.To show that the real wage w grows at the rate of technological progress g, defineTLI = Total Labor IncomeL = Labor ForceUsing the hint that the real wage equals total labor income divided by the labor force:w = TLI/L.Equivalently,wL = TLI.In terms of percentage changes, we can write this asΔw/w + ΔL/L = ΔTLI/TLI.This equation says that the growth rate of the real wage plus thegrowth rate of the labor force equals the growth rate of total labor income. We know that the labor force grows at rate n, and, frompart (c), we know that total labor income grows at rate n + g. We, therefore, conclude that the real wage grows at rate g.5. a. The per worker production function isF(K, L)/L = AKαL1–α/L = A(K/L)α = Akαb. In the steady state, Δk = sf(k) –(δ + n + g)k = 0. Hence, sAkα = (δ + n + g)k, or, after rearranging:k*=sAd+n+géëêêùûúúa1-aæèççöø÷÷.Plugging into the per-worker production function from part (a) givesy *=A a 1-a æèççöø÷÷s d +n +g éëêêùûúúa 1-a æèççöø÷÷.Thus, the ratio of steady-state income per worker in Richland to Poorland isy *Richland /y *Poorland ()=s Richland d +n Richland +g /s Poorland d +n Poorland +g éëêêùûúúa 1-a=0.320.05+0.01+0.02/0.100.05+0.03+0.02éëêêùûúúa 1-ac. If α equals 1/3, then Richland should be 41/2, or two times, richer than Poorland.d. If 4a 1-æèççöø÷÷= 16, then it must be the case that a 1-a æèççöø÷÷, which in turnrequires that α equals 2/3. Hence, if the Cobb –Douglasproduction function puts 2/3 of the weight on capital and only 1/3 on labor, then we can explain a 16-fold difference in levels ofincome per worker. One way to justify this might be to think about capital more broadly to include human capital —which must also be accumulated through investment, much in the way one accumulates physical capital.6. How do differences in education across countries affect the Solowmodel? Education is one factor affecting the efficiency of labor , which we denoted by E . (Other factors affecting the efficiency of laborinclude levels of health, skill, and knowledge.) Since country 1 has amore highly educated labor force than country 2, each worker in country 1 is more efficient. That is, E1 > E2. We will assume that both countries are in steady state.a. In the Solow growth model, the rate of growth of total income is equal to n + g, which is independent of the work force’s level of education. The two countries will, thus, have the same rate ofgrowth of total income because they have the same rate ofpopulation growth and the same rate of technological progress. b. Because both countries have the same saving rate, the samepopulation growth rate, and the same rate of technological progress, we know that the two countries will converge to the same steady-state level of capital per effective worker k*. This is shown in Figure 9-1.Hence, output per effective worker in the steady state, which is y* = f(k*), is the same in both countries. But y* = Y/(L E) or Y/L = y* E. We know that y* will be the same in both countries, but that E1> E2. Therefore, y*E1 > y*E2. This implies that (Y/L)1 > (Y/L)2.Thus, the level of income per worker will be higher in the countrywith the more educated labor force.c. We know that the real rental price of capital R equals the marginalproduct of capital (MPK). But the MPK depends on the capitalstock per efficiency unit of labor. In the steady state, both countries have k*1= k*2= k* because both countries have the same saving rate, the same population growth rate, and the same rate of technological progress. Therefore, it must be true that R1 = R2 = MPK. Thus, the real rental price of capital is identical in both countries.d. Output is divided between capital income and labor income.Therefore, the wage per effective worker can be expressed asw = f(k) –MPK • k.As discussed in parts (b) and (c), both countries have the samesteady-state capital stock k and the same MPK. Therefore, the wage per effective worker in the two countries is equal.Workers, however, care about the wage per unit of labor, not the wage per effective worker. Also, we can observe the wage per unitof labor but not the wage per effective worker. The wage per unitof labor is related to the wage per effective worker by the equationWage per Unit of L = wE.Thus, the wage per unit of labor is higher in the country with the more educated labor force.7. a. In the two-sector endogenous growth model in the text, theproduction function for manufactured goods isY = F [K,(1 –u) EL].We assumed in this model that this function has constant returns to scale. As in Section 3-1, constant returns means that for anypositive number z, zY = F(zK, z(1 –u) EL). Setting z = 1/EL, we obtainY EL =FKEL,(1-u)æèççöø÷÷.Using our standard definitions of y as output per effective worker and k as capital per effective worker, we can write this asy = F[k,(1 –u)]b. To begin, note that from the production function in research universities, the growth rate of labor efficiency, ΔE/E, equals g(u).We can now follow the logic of Section 9-1, substituting the function g(u) for the constant growth rate g. In order to keep capital per effective worker (K/EL) constant, break-even investment includes three terms: δk is needed to replace depreciating capital, nk is needed to provide capital for new workers, and g(u) is needed to provide capital for the greater stock of knowledge E created by research universities. That is, break-even investment is [δ +n + g(u)]k.c. Again following the logic of Section 9-1, the growth of capital pereffective worker is the difference between saving per effectiveworker and break-even investment per effective worker. We now substitute the per-effective-worker production function from part (a) and the function g(u) for the constant growth rate g, to obtainΔk = sF [k,(1 –u)] – [δ + n + g(u)]kIn the steady state, Δk = 0, so we can rewrite the equation above assF [k,(1 –u)] = [δ + n + g(u)]k.As in our analysis of the Solow model, for a given value of u, we can plot the left and right sides of this equationThe steady state is given by the intersection of the two curves. d. The steady state has constant capital per effective worker k as givenby Figure 9-2 above. We also assume that in the steady state, there is a constant share of time spent in research universities, so u is constant. (After all, if u were not constant, it wouldn’t be a“steady” state!). Hence, output per effective worker y is also constant. Output per worker equals yE, and E grows at rate g(u). Therefore, output per worker grows at rate g(u). The saving ratedoes not affect this growth rate. However, the amount of timespent in research universities does affect this rate: as more time is spent in research universities, the steady-state growth rate rises.e. An increase in u shifts both lines in our figure. Output per effectiveworker falls for any given level of capital per effective worker, since less of each worker’s time is spent producing manufactured goods. This is the immediate effect of the change, since at the time u rises, the capital stock K and the efficiency of each worker E are constant.Since output per effective worker falls, the curve showing savingper effective worker shifts down.At the same time, the increase in time spent in research universities increases the growth rate of labor efficiency g(u). Hence, break-even investment [which we found above in part (b)] rises at any given level of k, so the line showing breakeven investment also shifts up.Figure 9-3 shows these shifts.In the new steady state, capital per effective worker falls from k1 to k2. Output per effective worker also falls.f. In the short run, the increase in u unambiguously decreasesconsumption. After all, we argued in part (e) that the immediateeffect is to decrease output, since workers spend less timeproducing manufacturing goods and more time in researchuniversities expanding the stock of knowledge. For a given saving rate, the decrease in output implies a decrease in consumption.The long-run steady-state effect is more subtle. We found in part(e) that output per effective worker falls in the steady state. But welfare depends on output (and consumption) per worker, not per effective worker. The increase in time spent in research universities implies that E grows faster. That is, output per worker equals yE. Although steady-state y falls, in the long run the faster growth rate of E necessarily dominates. That is, in the long run, consumption unambiguously rises.Nevertheless, because of the initial decline in consumption, theincrease in u is not unambiguously a good thing. That is, apolicymaker who cares more about current generations than aboutfuture generations may decide not to pursue a policy of increasing u.(This is analogous to the question considered in Chapter 8 ofwhether a policymaker should try to reach the Golden Rule level ofcapital per effective worker if k is currently below the Golden Rulelevel.)8. On the World Bank Web site (), click on the datatab and then the indicators tab. This brings up a large list of dataindicators that allows you to compare the level of growth anddevelopment across countries. To explain differences in income per person across countries, you might look at gross saving as a percentage of GDP, gross capital formation as a percentage of GDP, literacy rate, life expectancy, and population growth rate. From the Solow model, we learned that (all else the same) a higher rate of saving will lead to higher income per person, a lower population growth rate will lead to higher income per person, a higher level of capital per worker will lead to a higher level of income per person, and more efficient orproductive labor will lead to higher income per person. The selected data indicators offer explanations as to why one country might have a higher level of income per person. However, although we mightspeculate about which factor is most responsible for the difference in income per person across countries, it is not possible to say for certain given the large number of other variables that also affect income per person. For example, some countries may have more developed capital markets, less government corruption, and better access to foreigndirect investment. The Solow model allows us to understand some of the reasons why income per person differs across countries, but givenit is a simplified model, it cannot explain all of the reasons why income per person may differ.More Problems and Applications to Chapter 91. a. The growth in total output (Y) depends on the growth rates oflabor (L), capital (K), and total factor productivity (A), assummarized by the equationΔY/Y = αΔK/K + (1 –α)ΔL/L + ΔA/A, where α is capital’s share of output. We can look at the effect onoutput of a 5-percent increase in labor by setting ΔK/K = ΔA/A =0. Since α = 2/3, this gives usΔY/Y = (1/3)(5%)= 1.67%.A 5-percent increase in labor input increases output by 1.67 percent.Labor productivity is Y/L. We can write the growth rate in labor productivity asD Y Y =D(Y/L)Y/L-D LL.Substituting for the growth in output and the growth in labor, we findΔ(Y/L)/(Y/L) = 1.67% – 5.0%= –3.34%.Labor productivity falls by 3.34 percent.To find the change in total factor productivity, we use the equationΔA/A = ΔY/Y –αΔK/K – (1 –α)ΔL/L.For this problem, we findΔA/A = 1.67% – 0 – (1/3)(5%)= 0.Total factor productivity is the amount of output growth that remains after we have accounted for the determinants of growththat we can measure. In this case, there is no change in technology, so all of the output growth is attributable to measured input growth.That is, total factor productivity growth is zero, as expected.b. Between years 1 and 2, the capital stock grows by 1/6, labor inputgrows by 1/3, and output grows by 1/6. We know that the growthin total factor productivity is given byΔA/A = ΔY/Y –αΔK/K – (1 –α)ΔL/L.Substituting the numbers above, and setting α = 2/3, we findΔA/A = (1/6) – (2/3)(1/6) – (1/3)(1/3)= 3/18 – 2/18 – 2/18= – 1/18= –0.056.Total factor productivity falls by 1/18, or approximately 5.6 percent.2. By definition, output Y equals labor productivity Y/L multiplied by the labor force L:Y = (Y/L)L.Using the mathematical trick in the hint, we can rewrite this asD Y Y =D(Y/L)Y/L+D LL.We can rearrange this asD Y Y =D YY-D LL.Substituting for ΔY/Y from the text, we findD(Y/L) Y/L =D AA+aD KK+(1-a)D LL-D LL =D AA+aD KK-aD LL=D AA+aD KK-D LLéëêêùûúúUsing the same trick we used above, we can express the term in brackets asΔK/K –ΔL/L = Δ(K/L)/(K/L) Making this substitution in the equation for labor productivity growth, we conclude thatD(Y/L) Y/L =D AA+aD(K/L)K/L.3. We know the following:ΔY/Y = n + g = 3.6%ΔK/K = n + g = 3.6%ΔL/L = n = 1.8%Capital’s Share = α = 1/3Labor’s Share = 1 –α = 2/3Using these facts, we can easily find the contributions of each of the factors, and then find the contribution of total factor productivitygrowth, using the following equations:Output = Capital’s+ Labor’s+ Total FactorGrowth Contribution ContributionProductivityD Y Y = aD KK+ (1-a)D LL+ D AA3.6% = (1/3)(3.6%) + (2/3)(1.8%) +ΔA/A.We can easily solve this for ΔA/A, to find that3.6% = 1.2% + 1.2% + 1.2%We conclude that the contribution of capital is 1.2 percent per year, the contribution of labor is 1.2 percent per year, and the contribution of total factor productivity growth is 1.2 percent per year. These numbers match the ones in Table 9-3 in the text for the United States from 1948–2002.。
经济学原理曼昆课后答案chapter7Problems and Applications1. If an early freeze in California sours the lemon crop, the supply curve for lemons shifts to theleft, as shown in Figure 7-5. The result is a rise in the price of lemons and a decline inconsumer surplus from A + B + C to just A. So consumer surplus declines by the amount B + C.Figure 7-5In the market for lemonade, the higher cost of lemons reduces the supply of lemonade, asshown in Figure 7-6. The result is a rise in the price of lemonade and a decline in consumer surplus from D + E + F to just D, a loss of E + F. Note that an event that affects consumer surplus in one market often has effects on consumer surplus in other markets.Figure 7-62. A rise in the demand for French bread leads to an increase in producer surplus in the marketfor French bread, as shown in Figure 7-7. The shift of the demand curve leads to anincreased price, which increases producer surplus from area A to area A + B + C.Figure 7-7The increased quantity of French bread being sold increases the demand for flour, as shown in Figure 7-8. As a result, the priceof flour rises, increasing producer surplus from area D toD +E + F. Note that an event that affects producer surplus in one market leads to effectson producer surplus in related markets.Figure 7-83. a. Bert’s demand schedule is:Price Quantity DemandedMore than $70$5 to $71$3 to $52$1 to $33$1 or less4Bert’s demand curve is shown in Figure 7-9.Figure 7-9b. When the price of a bottle of water is $4, Bert buys two bottles of water. Hisconsumer surplus is shown as area A in the figure. He values his first bottle ofwater at $7, but pays only $4 for it, so has consumer surplus of $3. He values hissecond bottle of water at $5, but pays only $4 for it, so has consumer surplus of $1.Thus Bert’s total consumer surplus is $3 + $1 = $4, which is the area of A in thefigure.c. When the price of a bottle of water falls from $4 to $2, Bert buys three bottles ofwater, an increase of one. His consumer surplus consists of both areas A and B inthe figure, an increase in the amount of area B. He gets consumer surplus of $5from the first bottle ($7 value minus $2 price), $3 from the second bottle ($5 valueminus $2 price), and $1 from the third bottle ($3 value minus $2 price), for a totalconsumer surplus of $9. Thus consumer surplus rises by $5 (which is the size ofarea B) when the price of a bottle of water falls from $4 to $2.4. a. Er nie’s supply schedule for water is:Price Quantity SuppliedMore than $74$5 to $73$3 to $52$1 to $31Less than $10Ernie’s supply curve is shown in Figure 7-10.Figure 7-10b. When the price of a bottle of water is $4, Ernie sells two bottles of water. Hisproducer surplus is shown as area A in the figure. He receives $4 for his first bottleof water, but it costs only $1 to produce, so Ernie has producer surplus of $3. Healso receives $4 for his second bottle of water, which costs $3 to produce, so he hasproducer surplus of $1. Thus Ernie’s total producer surplusis $3 + $1 = $4, whichis the area of A in the figure.c. When the price of a bottle of water rises from $4 to $6, Ernie sells three bottles ofwater, an increase of one. His producer surplus consists of both areas A and B inthe figure, an increase by the amount of area B. He gets producer surplus of $5from the first bottle ($6 price minus $1 cost), $3 from the second bottle ($6 priceminus $3 cost), and $1 from the third bottle ($6 price minus $5 price), for a totalproducer surplus of $9. Thus producer surplus rises by $5 (which is the size of areaB) when the price of a bottle of water rises from $4 to $6.5. a. From Ernie’s supply schedule and Bert’s demand schedule, the quantity demandedand supplied are:Only a price of $4 brings supply and demand into equilibrium, with an equilibriumquantity of 2.b. At a price of $4, consumer surplus is $4 and producer surplus is $4, as shown inproblems 3 and 4. Total surplus is $4 + $4 = $8.c. If Ernie produced one fewer bottle, his producer surplus would decline to $3, asshown in problem 4. If Bert consumed one fewer bottle, his consumer surpluswould decline to $3, as shown in problem 3. So total surpluswould decline to $3 +$3 = $6.d. If Ernie produced one additional bottle of water, his cost would be $5, but the priceis only $4, so his producer surplus would decline by $1. If Bert consumed oneadditional bottle of water, his value would be $3, but the price is $4, so hisconsumer surplus would decline by $1. So total surplus declines by $1 + $1 = $2.6. a. The effect of falling production costs in the market for stereos results in a shift tothe right in the supply curve, as shown in Figure 7-11. As a result, the equilibriumprice of stereos declines and the equilibrium quantity increases.b. The decline in the price of stereos increases consumer surplus from area A to A + B+ C + D, an increase in the amount B + C + D. Prior to the shift in supply, producer surplus was areas B + E (the area above the supply curve and below the price).After the shift in supply, producer surplus is areas E + F + G. So producer surpluschanges by the amount F + G - B, which may be positive or negative. The increase in quantity increases producer surplus, while the decline in the price reducesproducer surplus. Since consumer surplus rises by B + C + D and producer surplus rises by F + G - B, total surplus rises by C + D + F + G.c. If the supply of stereos is very elastic, then the shift of thesupply curve benefitsconsumers most. To take the most dramatic case, suppose the supply curve were horizontal, as shown in Figure 7-12. Then there is no producer surplus at all.Consumers capture all the benefits of falling production costs, with consumersurplus rising from area A to area A + B.Figure 7-11Figure 7-127. Figure 7-13 shows supply and demand curves for haircuts. Supply equals demand at aquantity of three haircuts and a price between $4 and $5. Firms A, C, and D should cut the hair of Sally Jessy, Jerry, and Montel. Oprah’s willingness to pay is too low and firm B’s costs are too high, so they do not participate. The maximum total surplus is the areabetween the demand and supply curves, which totals $11 ($8 value minus $2 cost for thefirst haircut, plus $7 value minus $3 cost for the second, plus $5 value minus $4 cost for the third).Figure 7-138. a. The effect of falling production costs in the market for computers results in a shift tothe right in the supply curve, as shown in Figure 7-14. As a result, the equilibriumprice of computers declines and the equilibrium quantity increases. The decline inthe price of computers increases consumer surplus from area A to A + B + C + D, anincrease in the amount B + C + D.Figure 7-14Prior to the shift in supply, producer surplus was areas B + E (the area above thesupply curve and below the price). After the shift in supply, producer surplus isareas E + F + G. So producer surplus changes by the amount F + G - B, which maybe positive or negative. The increase in quantity increases producer surplus, whilethe decline in the price reduces producer surplus. Since consumer surplus rises byB +C +D and producer surplus rises by F + G - B, total surplus rises by C + D + F + G.Figure 7-15b. Since adding machines are substitutes for computers, the decline in the price ofcomputers means that people substitute computers for adding machines, shiftingthe demand for adding machines to the left, as shown in Figure 7-15. The result isa decline in both the equilibrium price and equilibrium quantity of adding machines.Consumer surplus in the adding-machine market changesfrom area A + B to A + C, a net gain of C - B. Producer surplus changes from area C + D + E to area E, a net loss of C + D. Adding machine producers are sad about technological advance in computers because their producer surplus declines.c. Since software and computers are complements, the decline in the price andincrease in the quantity of computers means that people’s demand for softwareincreases, shifting the demand for software to the right, as shown in Figure 7-16.The result is an increase in both the price and quantity of software. Consumersurplus in the software market changes from B + C to A + B, a net increase of A - C.Producer surplus changes from E to C + D + E, an increase of C + D, so softwareproducers should be happy about the technological progress in computers.d. Yes, this analysis helps explain why Bill Gates is one the world’s richest men, sincehis company pr oduces a lot of software that’s a complement with computers andthere has been tremendous technological advance in computers.Figure 7-169. a. Figure 7-17 illustrates the demand for medical care. If each procedure has a priceof $100, quantity demanded will be Q1 procedures.b. If consumers pay only $20 per procedure, the quantity demanded will be Q2procedures. Since the cost to society is $100, the number of proceduresperformed is too large to maximize total surplus. The quantity that maximizestotal surplus is Q1 procedures, which is less than Q2.c. The use of medical care is excessive in the sense that consumers get procedureswhose value is less than the cost of producing them. As a result, the economy’stotal surplus is reduced.d. To prevent this excessive use, the consumer must bear the marginal cost of theprocedure. But this would require eliminating insurance. Another possibilitywould be that the insurance company, which pays most of the marginal cost of theprocedure ($80, in this case) could decide whether the procedure should beperformed. But the insurance company doesn’t get the benefits of the procedure,so its decisions may not reflect the value to the consumer.10. a. Figure 7-18 illustrates the effect of the drought. The supply curve shifts to the left,leading to a rise in the equilibrium price from P1 to P2 and a decline in theequilibrium quantity from Q1 to Q2.b. If the price of water is not allowed to change, there will be an excess demand forwater, with the shortage shown on the figure as the difference between Q1 and Q3.c. The system for allocating water is inefficient because it no longer allocates water tothose who value it most highly. Some people who value water at more than itscost of productio n will be unable to obtain it, so society’s total surplus isn’tmaximized.The allocation system seems unfair as well. Water is allocated simply on pastusage, rewarding past wastefulness. If a family’s demand for water increases, saybecause of an increas e in family size, the policy doesn’t allow them to obtain morewater. Poor families, who probably used water mostly for necessary uses likedrinking, would suffer more than wealthier families who would have to cut backonly on luxury uses of water like operating backyard fountains and pools.However, the policy also keeps the price of water lower, which benefits poorfamilies, since otherwise more of their family budget would have to go for water.d. If the city allowed the price of water to rise to its equilibrium price P2, the allocationwould be more efficient. Quantity supplied would equal quantity demanded andthere would be no shortage. Total surplus would be maximized.Whether the market allocation would be more or less fair than the proportionatereduction in water under the old policy is difficult to say, but it is likely to be morefair. Notice that the quantity supplied would be higher (Q2) in this case than under the water restrictions (Q3), so there’s less reduction in water usage. To make themarket solution even more fair, the government could provide increased tax reliefor welfare payments for poor families who suffer from paying the higher waterprices.。
Answers to Textbook Questions and ProblemsCHAPTER 7 Unemployment and the Labor MarketQuestions for Review1. The rates of job separation and job finding determine the natural rate of unemployment. The rate of jobseparation is the fraction of people who lose their job each month. The higher the rate of job separation, the higher the natural rate of unemployment. The rate of job finding is the fraction of unemployed people who find a job each month. The higher the rate of job finding, the lower the natural rate ofunemployment.2. Frictional unemployment is the unemployment caused by the time it takes to match workers and jobs.Finding an appropriate job takes time because the flow of information about job candidates and job vacancies is not instantaneous. Because different jobs require different skills and pay different wages, unemployed workers may not accept the first job offer they receive.In contrast, structural unemployment is the unemployment resulting from wage rigidity and job rationing. These workers are unemployed not because they are actively searching for a job that best suits their skills (as in the case of frictional unemployment), but because at the prevailing real wage the quantity of labor supplied exceeds the quantity of labor demanded. If the wage does not adjust to clear the labor market, then these workers must wait for jobs to become available. Structural unemployment thus arises because firms fail to reduce wages despite an excess supply of labor.3. The real wage may remain above the level that equilibrates labor supply and labor demand because ofminimum wage laws, the monopoly power of unions, and efficiency wages.Minimum-wage laws cause wage rigidity when they prevent wages from falling to equilibrium levels. Although most workers are paid a wage above the minimum level, for some workers, especially the unskilled and inexperienced, the minimum wage raises their wage above the equilibrium level. It therefore reduces the quantity of their labor that firms demand, and creates an excess supply ofworkers, which increases unemployment.The monopoly power of unions causes wage rigidity because the wages of unionized workers are determined not by the equilibrium of supply and demand but by collective bargaining between union leaders and firm management. The wage agreement often raises the wage above the equilibrium level and allows the firm to decide how many workers to employ. These high wages cause firms to hire fewer workers than at the market-clearing wage, so structural unemployment increases.Efficiency-wage theories suggest that high wages make workers more productive. The influence of wages on worker efficiency may explain why firms do not cut wages despite an excess supply of labor. Even though a wage reduction decreases the firm’s wage bill, it may also lower workerproductivity and therefore the firm’s profits.4. Depending on how one looks at the data, most unemployment can appear to be either short term orlong term. Most spells of unemployment are short; that is, most of those who became unemployed find jobs quickly. On the other hand, most weeks of unemployment are attributable to the small number of long-term unemployed. By definition, the long-term unemployed do not find jobs quickly, so they appear on unemployment rolls for many weeks or months.5. Europeans work fewer hours than Americans. One explanation is that the higher income tax rates inEurope reduce the incentive to work. A second explanation is a larger underground economy in Europe as a result of more people attempting to evade the high tax rates. A third explanation is the greater importance of unions in Europe and their ability to bargain for reduced work hours. A final explanation is based on preferences, whereby Europeans value leisure more than Americans do, and therefore elect to work fewer hours.Problems and Applications1. a. In the example that follows, we assume that during the school year you look for a part-time job,and that, on average, it takes 2 weeks to find one. We also assume that the typical job lasts 1semester, or 12 weeks.b. If it takes 2 weeks to find a job, then the rate of job finding in weeks isf = (1 job/2 weeks) = 0.5 jobs/week.If the job lasts for 12 weeks, then the rate of job separation in weeks iss = (1 job/12 weeks) = 0.083 jobs/week.c. From the text, we know that the formula for the natural rate of unemployment is(U/L) = [s/(s + f )],where U is the number of people unemployed, and L is the number of people in the labor force.Plugging in the values for f and s that were calculated in part (b), we find(U/L) = [0.083/(0.083 + 0.5)] = 0.14.Thus, if on average it takes 2 weeks to find a job that lasts 12 weeks, the natural rate ofunemployment for this population of college students seeking part-time employment is 14 percent.2. Call the number of residents of the dorm who are involved I, the number who are uninvolved U, and thetotal number of students T = I + U. In steady state the total number of involved students is constant.For this to happen we need the number of newly uninvolved students, (0.10)I, to be equal to thenumber of students who just became involved, (0.05)U. Following a few substitutions:(0.05)U = (0.10)I= (0.10)(T – U),soWe find that two-thirds of the students are uninvolved.3. To show that the unemployment rate evolves over time to the steady-state rate, let’s begin by defininghow the number of people unemployed changes over time. The change in the number of unemployed equals the number of people losing jobs (sE) minus the number finding jobs (fU). In equation form, we can express this as:U t + 1–U t= ΔU t + 1 = sE t–fU t.Recall from the text that L = E t + U t, or E t = L –U t, where L is the total labor force (we will assume that L is constant). Substituting for E t in the above equation, we findΔU t + 1 = s(L –U t) –fU t.Dividing by L, we get an expression for the change in the unemployment rate from t to t + 1:ΔU t + 1/L = (U t + 1/L) – (U t/L) = Δ[U/L]t + 1 = s(1 –U t/L) –fU t/L.Rearranging terms on the right side of the equation above, we end up with line 1 below. Now take line1 below, multiply the right side by (s + f)/(s + f) and rearrange terms to end up with line2 below:Δ[U/L]t + 1= s – (s + f)U t/L= (s + f)[s/(s + f) – U t/L].The first point to note about this equation is that in steady state, when the unemployment rate equals its natural rate, the left-hand side of this expression equals zero. This tells us that, as we found in the text, the natural rate of unemployment (U/L)n equals s/(s + f). We can now rewrite the above expression, substituting (U/L)n for s/(s + f), to get an equation that is easier to interpret:Δ[U/L]t + 1 = (s + f)[(U/L)n–U t/L].This expression shows the following:•If U t/L > (U/L)n (that is, the unemployment rate is above its natural rate), then Δ[U/L]t + 1 is negative: the unemployment rate falls.•If U t/L < (U/L)n (that is, the unemployment rate is below its natural rate), then Δ[U/L]t + 1 is positive: the unemployment rate rises.This process continues until the unemployment rate U/L reaches the steady-state rate (U/L)n.4. Consider the formula for the natural rate of unemployment,If the new law lowers the chance of separation s, but has no effect on the rate of job finding f, then the natural rate of unemployment falls.For several reasons, however, the new law might tend to reduce f. First, raising the cost of firing might make firms more careful about hiring workers, since firms have a harder time firing workers who turn out to be a poor match. Second, if job searchers think that the new legislation will lead them to spend a longer period of time on a particular job, then they might weigh more carefully whether or not to take that job. If the reduction in f is large enough, then the new policy may even increase the natural rate of unemployment.5. a. The demand for labor is determined by the amount of labor that a profit-maximizing firm wants tohire at a given real wage. The profit-maximizing condition is that the firm hire labor until themarginal product of labor equals the real wage,The marginal product of labor is found by differentiating the production function with respect tolabor (see Chapter 3 for more discussion),In order to solve for labor demand, we set the MPL equal to the real wage and solve for L:Notice that this expression has the intuitively desirable feature that increases in the real wagereduce the demand for labor.b. We assume that the 27,000 units of capital and the 1,000 units of labor are supplied inelastically(i.e., they will work at any price). In this case we know that all 1,000 units of labor and 27,000 units of capital will be used in equilibrium, so we can substitute these values into the above labor demand function and solve for .In equilibrium, employment will be 1,000, and multiplying this by 10 we find that the workers earn 10,000 units of output. The total output is given by the production function:Y=5K 13L23Y=5(27,00013)(1,00023)Y=15,000.Notice that workers get two-thirds of output, which is consistent with what we know about theCobb–Douglas production function from Chapter 3.c. The real wage is now equal to 11 (10% above the equilibrium level of 10).Firms will use their labor demand function to decide how many workers to hire at the given realwage of 11 and capital stock of 27,000:So 751 workers will be hired for a total compensation of 8,261 units of output. To find the newlevel of output, plug the new value for labor and the value for capital into the production function and you will find Y = 12,393.d. The policy redistributes output from the 249 workers who become involuntarily unemployed tothe 751 workers who get paid more than before. The lucky workers benefit less than the losers lose as the total compensation to the working class falls from 10,000 to 8,261 units of output.e. This problem does focus on the analysis of two effects of the minimum-wage laws: they raise thewage for some workers while downward-sloping labor demand reduces the total number of jobs.Note, however, that if labor demand is less elastic than in this example, then the loss ofemployment may be smaller, and the change in worker income might be positive.6. a. The labor demand curve is given by the marginal product of labor schedule faced by firms. If acountry experiences a reduction in productivity, then the labor demand curve shifts to the left as in Figure 7-1. If labor becomes less productive, then at any given real wage, firms demand less labor.b. If the labor market is always in equilibrium, then, assuming a fixed labor supply, an adverseproductivity shock causes a decrease in the real wage but has no effect on employment orunemployment, as in Figure 7-2.c. If unions constrain real wages to remain unaltered, then as illustrated in Figure 7-3, employmentfalls to L1 and unemployment equals L –L1.This example shows that the effect of a productivity shock on an economy depends on the role of unions and the response of collective bargaining to such a change.7. a. If workers are free to move between sectors, then the wage in each sector will be equal. If thewages were not equal then workers would have an incentive to move to the sector with the higher wage and this would cause the higher wage to fall, and the lower wage to rise until they wereequal.b. Since there are 100 workers in total, L S = 100 – L M. We can substitute this expression into thelabor demand for services equation, and call the wage w since it is the same in both sectors:L S = 100 – L M = 100 – 4wL M = 4w.Now set this equal to the labor demand for manufacturing equation and solve for w:4w = 200 – 6ww = $20.Substitute the wage into the two labor demand equations to find L M is 80 and L S is 20.c. If the wage in manufacturing is equal to $25 then L M is equal to 50.d. There are now 50 workers employed in the service sector and the wage w S is equal to $12.50.e. The wage in manufacturing will remain at $25 and employment will remain at 50. If thereservation wage for the service sector is $15 then employment in the service sector will be 40.Therefore, 10 people are unemployed and the unemployment rate is 10 percent.8. Real wages have risen over time in both the United States and Europe, increasing the reward forworking (the substitution effect) but also making people richer, so they want to “buy” more leisure (the income effect). If the income effect dominates, then people want to work less as real wages go up. This could explain the European experience, in which hours worked per employed person have fallen over time. If the income and substitution effects approximately cancel, then this could explain the U.S.experience, in which hours worked per person have stayed about constant. Economists do not havegood theories for why tastes might differ, so they disagree on whether it is reasonable to think that Europeans have a larger income effect than do Americans.9. The vacant office space problem is similar to the unemployment problem; we can apply the sameconcepts we used in analyzing unemployed labor to analyze why vacant office space exists. There is a rate of office separation: firms that occupy offices leave, either to move to different offices or because they go out of business. There is a rate of office finding: firms that need office space (either to start up or expand) find empty offices. It takes time to match firms with available space. Different types of firms require spaces with different attributes depending on what their specific needs are. Also, because demand for different goods fluctuates, there ar e “sectoral shifts”—changes in the composition of demand among industries and regions that affect the profitability and office needs of different firms.。