Deformation and vibration of a spatial clamped elastica with noncircular cross section
- 格式:pdf
- 大小:1.50 MB
- 文档页数:12
DEFINITION OF A SPATIAL ENTROPY AND ITS USE FOR TEXTURE DISCRIMINATIONF.Tupin,M.Sigelle,H.MaˆıtreEcole Nationale Suprieure des Tlcommunications,46rue Barrault,75013Paris,FranceABSTRACTThis paper presents a new definition of a spatial entropy mainly based on the Markov Random Field(MRF)prop-erties.Starting with the study of the entropy proposed in[1] for the Potts model,we establish a specific property of the entropy in this special case,and derive the analytical expres-sions for a4-connexity neighborhood.Inspired by the previ-ous property,we propose a new definition mainly based on an heterogeneity measure of the neighborhood.This def-inition is then used to analyze a SAR(Synthetic Aperture Radar)image and it is shown to be able to discriminate dif-ferent types of textures.1.INTRODUCTIONAlthough entropy is widely used in thefield of information theory to express the information content of a message[2], there are relatively few works dealing with entropy in image processing and most of them are related to the use of mu-tual information[3]as a measure of redundancy between sources[3].One of the main limitations of entropy in im-age processing is the entropy definition which,in its general sense,is only related to the image histogram.As it is well known,many like-looking images may have very different histograms and therefore quite different entropies although their whole appearance stay the same[4].Furthermore,the classical entropy definition does not take into account the spatial properties of the image,which is a an aspect of par-ticular importance in image analysis.Our thought processes is the following:in section2,us-ing the previously proposed definition of[1],we study this measure behavior in the particular case of a Markov Ran-dom Field-Potts model in a4-connexity neighborhood-and derive the analytical expression.We also demonstrate an in-teresting property which brings us to propose a new defini-tion of a spatial entropy(section3).In section4,we make a comparison between our approach and other related works, specially[1]and[5].Eventually,we test this definition on SAR images on which it appears to be a good textural dis-criminator(sec.5).2.STUDY OF THE SPATIAL ENTROPY FOR APOTTS MARKOV RANDOM FIELDIn the classical information theory,the information source entropy of a probability law is defined as[2]:where is the set of values.In image processing,is the set of grey-levels(usually)or labels,and is the probability of the grey-level,usually estimated by the normalized histogram computed on the image.In the last15years,Markov Random Fields(MRF)have proven to be powerful tools to introduce contextual knowl-edge in image processing[6][7].Therefore,a classical spa-tial entropy definition introduces the local configuration in-fluence as proposed in[1].Let us denote by a site of the image,by the neighborhood system and by the ran-domfield associated to the image(is the label for the available observation of the random variable associated to pixel).The neighborhood of site is in a configura-tion.Then the spatial entropy is defined for the probability law by:(1) and the total spatial entropy is given by:(2) 2.1.“Independence”propertyLet usfirst study this definition(eq.1)in the case of a sim-ple isotropic Potts model of order2[8].In this case,the potential of a clique constituted by2sites is defined by:and the local potential by. The study of the entropy(eq.1)is then possible,since the lo-cal conditional probability of a MRF is given by:Let usfirst establish an interesting property of this model. Two neighbor configurations and are said to be equiv-alent if there exists a bijection so thatwith.It means that the cardinals of the subsets of pixels with the same label in are equal to the cardinals of the subsets of(cf.sec.3 andfig.2).Their class of equivalence will be noted and the application which associates to a neighborhood con-figuration its equivalence class().The Potts model has the peculiarity thatfor)since it only counts the number of neighbor pixels having the same value than the central one. This implies that for any function and:(3)i.e the sum depends only on the equivalence class.This allows to deduce at once the following properties:a)The local conditional partition functiononly depends on.b)The spatial entropy E(with E the expectation taken conditionally to)depends only on.We will use this“independence”property to propose a new definition for entropy in section3.2.2.Analytical expressionsOf interest is the study of the relationship between the Potts model parameter and the spatial entropy defined by eq.1. In4-connexity,the5following partitions have to be consid-ered(in the case of):where denotes the unique existence.If(respec-tively,binaryfield),(resp.and)does not exist and only to neighborhood types have to be considered(resp.to).Then the following entropies can be derived:This measure is usually expressed in bits using basis.The following comments on the spatial entropy in thecase of a Potts MRF model can be made.Behavior when is high:thefield is made of compacthomogeneous areas.For the neighborhood types,and,there is a numerical superiority of one of the labels in the neighborhood;as increases and the situation becomes deterministic().The samereasoning explains that bit for(2possible labels in the neighborhood)and bits for(4possible labels).Behavior when is0:in this case,there is no model since the clique potentials are equal to0;it corresponds to the most unpredictable situation,and the entropy reaches a max-imum which is.Behavior when is negative:the model corresponds to an anti-ferromagnetism situation;since there are fewer possi-bilities for the site label in the case of with mixed labels:.When the cardinal of is high(many labels),all the entropies are high and close to the maximal entropy.3.DEFINITION OF A NEW SPATIAL ENTROPY Inspired by the“independence”property established in the previous section for the Potts model,we propose to define a new spatial entropy using the equivalence class,i.e based on the conditional law:(4)(5)Instead of considering all the possible configurations of the neighborhood as in[1],our approach distinguishes the configurations by the number of pixels having the same la-bel or grey-level(an example is shownfig.2).Therefore,the entropy definition is mainly based on a characterization of the neighborhood heterogeneity(expressed in terms of sets of pixels with the same grey level or label).This definition has important computational advantages since much less configurations exist compared to ones and there-fore much more realizations are available(statistically speaking)compared to ones in an image.Note that the definition of eq.5and eq.1are not equiva-lent,even in the case of a Potts model for which the“inde-pendence”property isverified.Fig.2.Two neighborhood configurations of the central pixel(8-connexity)belonging to the same equivalence class :there is1subset with cardinal4,1subset with cardinal 2,and2subsets with cardinal1.PARISON WITH OTHER DEFINITIONS In this section we compare our spatial entropy definition with some previous ones:[1]and[5].In[1],E.V olden et al.propose to consider a general definition of a spatial entropy,which is given by eq.1.This definition is very general since the conditioning depends on all the possible configurations of,which means configurations and raises many practical problems for com-putation.In practice,the authors use a MRF-Potts model assumption for the image.In this case,for the label,onlythe number of pixels in the neighborhood having the samelabel have to be considered.Our definition is instead based on the equivalence class of the neighborhood configuration and the2main differ-ences are the following:generality of the definition:since the Potts assumption isused in practice in[1],only the number of pixels havingthe same label as the central pixel influences the spatial en-tropy;in our case,the whole equivalence class configurationis taken into account,which means that the global regularityof the neighborhood is introduced1;central pixel influence:in our definition,the neighbor-hood type does not depend at all from the label of the centralpixel.To conclude about this comparison with[1],the pro-posed definition is more limited but gives tractable compu-tations.In[5],the proposed approach is adapted to segmentationpurposes and the radiometric and spatial entropies of a class are defined.The spatial entropy for a class is defined in the following way:,where is again some neighborhood configuration of the labeled image for the considered neighborhood system.In this case,we see that the definitions go in two“op-posite”directions:our(eq.5)exploits the conditioning ofthe label by the equivalence class of the neighborhood con-figuration,whereas this one is related to the conditioning of the neighborhood configuration by the label.Of course,we may generalize the proposed definition in[5],to define a spatial entropy on the whole image by:and then1For example,consider a central pixel with grey value in8-connexity and suppose we consider two neighborhood configurationsand;the con-tribution of the site will be the same for and in[1]-twice in the neighborhoods-,whereas in our,the irregularity of the neighborhood will be taken into account and both contributions will be very different)the comparison of labeled images and the influence of theneighborhood configuration is much emphasized with their definition than in our.5.APPLICATION TO SAR TEXTURAL ANALYSIS In this section,we present some preliminary experiments using the spatial entropy of eq.5.Since the whole image isnon stationary,we used the total spatial entropy computed on a moving window to establish an“entropy map”.Weconsider a4-connexity neighborhood,which impliesfive equivalence classes(as in sec.2.2).The conditional probabilities,and the neighborhood type probabil-ities are estimated by their normalized frequencies.Since they are many(256)possible labels for a grey level image,this number is preliminary reduced using a linear quantization.We have chosen to consider8classes in our experiments;the pre-processing has been chosen as simple as possible to limit the effect of the labeling on the spatial entropy.A result is shown onfigure3(entropy is stretched be-tween the minimum and maximum value);it gives a tex-tural measure on the SAR image.The most homogeneous areas have a low spatial entropy;this is the case for wa-ter areas(specular scattering implying a very low signal) for instance in the lake or for the river Seine of the image; forest areas have also a low total spatial entropy since they are rather homogeneous on ERS-1images;some parts of urban areas,which are very dense also appear with low en-tropy.The most contrasted regions have a high entropy;for instance,industrial and urban areas which have very high responses due to strong reflectors surrounded by speckle, and relief regions.The total spatial entropy seems to be a good measure for textural discrimination purposes.For instance,compared to the standard deviation of the Mul-tiplicative Autoregressive Model of Chellapa[10](which is often used with SAR images),this textural discriminator seems to be better using a visual comparison.Wider tests should be performed.6.CONCLUSIONIn this article,a new definition of the spatial entropy has been introduced,mainly based on a neighborhood hetero-geneity characterization.Further work will include theo-retical development with other Markov models,or different graphs and neighborhoods(specially for interpretation pur-poses).Concerning the practical interest,SAR images have been used due to our good experience working on them, but the approach should be tested on optical images or im-ages of another kind.Besides,some temporal extension, which we believe should be interesting,are possible.But the speckle effect should be taken into account,as well as the edge and registeringproblem.a)Original image(8levels)b)Total spatial entropy com-puted on a windowsizeFig.3.SAR image and the total spatial entropy locally esti-mated.7.REFERENCES[1]E.V olden,G.Giraudon,and M.Berthod,“Modellingimage redundancy,”IGARSS’95,vol.3,pp.2148–2150,1995.[2]C.E.Shannon,“A mathematical theory of communi-cation,”The Bell System Technical Journal,vol.27, pp.379–423,1948.[3]S.Houzelle and G.Giraudon,“Contribution to mul-tisensor fusion formalization,”Robotics and Au-tonomous Systems,vol.13,pp.69–85,1995.[4]H.Maitre and J.Zinn-Justin,“Entropy informationand image,”Springer-Verlag,pp.81–115,1996.[5]H.Maitre,I.Bloch,and M.Sigelle,“Spatial entropy:A tool for controlling contextual classification conver-gence,”ICIP’94,pp.212–216,1994.[6]S.Geman and D.Geman,“Stochastic Relaxation,Gibbs Distribution,and the Bayesian Restauration of Images,”IEEE PAMI,,no.6,pp.721–741,Nov.1984.[7]C.Chellappa and A.Jain,Markov Random Fields.Theory and Application,Academic Press,1993. [8]F.Y.Wu,“The Potts model,”Review of ModernPhysics,vol.4,no.1,1982.[9]M.Sigelle and A.Maruani,“Critical properties of the2D Ising model:a Markovian approach,”in Maximum Entropy and Bayesian Methods.1993,pp.389–392, Kluwer Academic Publishers.[10]R.T.Frankot and R.Chellappa,“Lognormal randomfield models and their applications to radar image syn-thesis,”IEEE TGARS,vol.25,no.2,pp.195–207, 1987.。

Structural Dynamics and Control Structural dynamics and control play a crucial role in various engineering fields, including civil, mechanical, aerospace, and more. Understanding how structures behave under different loading conditions and controlling their response is essential for ensuring safety, stability, and efficiency. Structural dynamics deals with the study of how structures respond to dynamic forces such as vibrations, earthquakes, wind, and machinery operations. On the other hand,control systems are designed to regulate and manipulate the behavior of structures to achieve desired performance criteria. One of the key aspects of structural dynamics is the analysis of natural frequencies and mode shapes of structures. Natural frequencies are the frequencies at which a structure tends to vibrate when disturbed from its equilibrium position. Mode shapes, on the other hand, describe the spatial distribution of vibration within a structure at a specific natural frequency. By understanding these characteristics, engineers can predict how a structure will respond to dynamic forces and design appropriate control strategies to mitigate unwanted vibrations. Control systems play a vital role in ensuring that structures operate within safe limits and meet performance requirements. By implementing feedback control strategies, engineers can actively adjust the behavior of structures in real-time to counteract external disturbances and maintain stability. For example, in the case of a tall building subjected to wind loads, a tuned mass damper system can be used to reduce structural vibrations and prevent excessive sway. In the field of aerospace engineering, structural dynamics and control are crucial for ensuring the safety and performance ofaircraft and spacecraft. Aircraft structures must withstand various aerodynamic forces and vibrations during flight, while spacecraft must endure extreme conditions during launch and space missions. Control systems are used to stabilize aircraft during flight, adjust wing and control surface positions, and regulate engine thrust. In spacecraft, control systems are essential for attitude control, trajectory adjustments, and docking maneuvers. In the context of civil engineering, structural dynamics and control are essential for designing earthquake-resistant buildings, bridges, and other infrastructure. Earthquakes can exert significant dynamic forces on structures, leading to structural damage andcollapse. By incorporating seismic isolation systems, dampers, and other control devices, engineers can enhance the resilience of structures and protect human lives. Additionally, structural health monitoring systems can be used to detect damage and deterioration in real-time, allowing for timely maintenance and repair. Overall, structural dynamics and control are interdisciplinary fields that merge principles of structural engineering, mechanical engineering, and control theory. By studying the dynamic behavior of structures and implementing effective control strategies, engineers can enhance the safety, performance, and longevity ofvarious engineering systems. Whether it's designing earthquake-resistant buildings, stabilizing aircraft in flight, or optimizing machinery operations, the principles of structural dynamics and control are indispensable in modern engineering practice.。

A Facial Aging Simulation Method Using flaccidity deformation criteriaAlexandre Cruz Berg Lutheran University of Brazil.Dept Computer ScienceRua Miguel Tostes, 101. 92420-280 Canoas, RS, Brazil berg@ulbra.tche.br Francisco José Perales LopezUniversitat les Illes Balears.Dept Mathmatics InformaticsCtra Valldemossa, km 7,5E-07071 Palma MallorcaSpainpaco.perales@uib.esManuel GonzálezUniversitat les Illes Balears.Dept Mathmatics InformaticsCtra Valldemossa, km 7,5E-07071 Palma MallorcaSpainmanuel.gonzales@uib.esAbstractDue to the fact that the aging human face encompasses skull bones, facial muscles, and tissues, we render it using the effects of flaccidity through the observation of family groups categorized by sex, race and age. Considering that patterns of aging are consistent, facial ptosis becomes manifest toward the end of the fourth decade. In order to simulate facial aging according to these patterns, we used surfaces with control points so that it was possible to represent the effect of aging through flaccidity. The main use of these surfaces is to simulate flaccidity and aging consequently.1.IntroductionThe synthesis of realistic virtual views remains one of the central research topics in computer graphics. The range of applications encompasses many fields, including: visual interfaces for communications, integrated environments of virtual reality, as well as visual effects commonly used in film production.The ultimate goal of the research on realistic rendering is to display a scene on a screen so that it appears as if the object exists behind the screen. This description, however, is somewhat ambiguous and doesn't provide a quality measure for synthesized images. Certain areas, such as plastic surgery, need this quality evaluation on synthesized faces to make sure how the patient look like and more often how the patient will look like in the future. Instead, in computer graphics and computer vision communities, considerable effort has been put forthto synthesize the virtual view of real or imaginary scenes so that they look like the real scenes.Much work that plastic surgeons put in this fieldis to retard aging process but aging is an inevitable process. Age changes cause major variations in the appearance of human faces [1]. Some aspects of aging are uncontrollable and are based on hereditary factors; others are somewhat controllable, resulting from many social factors including lifestyle, among others [2].1.1.Related WorkMany works about aging human faces have been done. We can list some related work in the simulation of facial skin deformation [3].One approach is based on geometric models, physically based models and biomechanical models using either a particle system or a continuous system.Many geometrical models have been developed, such as parametric model [4] and geometric operators [5]. The finite element method is also employed for more accurate calculation of skin deformation, especially for potential medical applications such as plastic surgery [6]. Overall, those works simulate wrinkles but none of them have used flaccidity as causing creases and aging consequently.In this work is presented this effort in aging virtual human faces, by addressing the synthesis of new facial images of subjects for a given target age.We present a scheme that uses aging function to perform this synthesis thru flaccidity. This scheme enforces perceptually realistic images by preserving the identity of the subject. The main difference between our model and the previous ones is that we simulate increase of fat and muscular mass diminish causing flaccidity as one responsible element for the sprouting of lines and aging human face.In the next section will plan to present the methodology. Also in section 3, we introduce the measurements procedure, defining structural alterations of the face. In section 4, we present a visual facial model. We describe age simulation thrua deformation approach in section 5. In the last section we conclude the main results and future work.2.MethodologyA methodology to model the aging of human face allows us to recover the face aging process. This methodology consists of: 1) defining the variations of certain face regions, where the aging process is perceptible; 2) measuring the variations of those regions for a period of time in a group of people and finally 3) making up a model through the measurements based on personal features.That could be used as a standard to a whole group in order to design aging curves to the facial regions defined.¦njjjpVM2.1Mathematical Background and AnalysisHuman society values beauty and youth. It is well known that the aging process is influenced by several parameters such: feeding, weight, stress level, race, religious factors, genetics, etc. Finding a standard set of characteristics that could possibly emulate and represent the aging process is a difficult proposition.This standard set was obtained through a mathematical analysis of some face measurements in a specific group of people, whose photographs in different ages were available [7]. To each person in the group, there were, at least, four digitized photographs. The oldest of them was taken as a standard to the most recent one. Hence, some face alterations were attained through the passing of time for the same person.The diversity of the generated data has led to the designing of a mathematical model, which enabled the acquiring of a behavior pattern to all persons of the same group, as the form of a curve defined over the domain [0,1] in general, in order to define over any interval [0,Į] for an individual face. The unknown points Įi are found using the blossoming principle [8] to form the control polygon of that face.The first step consisted in the selection of the group to be studied. Proposing the assessment of the face aging characteristics it will be necessary to have a photographic follow-up along time for a group of people, in which their face alterations were measurable.The database used in this work consisted of files of patients who were submitted to plastic surgery at Medical Center Praia do Guaíba, located in Porto Alegre, Brazil.3.MeasurementsAccording to anatomic principles [9] the vectors of aging can be described aswhich alter the position and appearance of key anatomic structures of the face as can be shown in figure 1 which compares a Caucasian mother age 66 (left side) with her Caucasian daughters, ages 37 (right above) and 33 (right below) respectively.Figure 1 - Observation of family groupsTherefore, basic anatomic and surgical principles must be applied when planning rejuvenative facial surgery and treating specific problems concomitantwith the aging process.4.Visual Facial ModelThe fact that human face has an especially irregular format and interior components (bones, muscles and fabrics) to possess a complex structure and deformations of different face characteristics of person to person, becomes the modeling of the face a difficult task. The modeling carried through in the present work was based on the model, where the mesh of polygons corresponds to an elastic mesh, simulating the dermis of the face. The deformations in this mesh, necessary to simulate the aging curves, are obtained through the displacement of the vertexes, considering x(t) as a planar curve, which is located within the (u,v ) unit square. So, we can cover the square with a regular grid of points b i,j =[i/m,j/n]T ; i=0,...,m; j=0,...,n. leading to every point (u,v ) asfrom the linear precision property of Bernstein polynomials. Using comparisons with parents we can distort the grid of b i,j into a grid b'i,j , the point (u,v )will be mapped to a point (u',v') asIn order to construct our 3D mesh we introduce the patch byAs the displacements of the vertexes conform to the certain measures gotten through curves of aging and no type of movement in the face is carried through, the parameters of this modeling had been based on the conformation parameter.4.1Textures mappingIn most cases the result gotten in the modeling of the face becomes a little artificial. Using textures mapping can solve this problem. This technique allows an extraordinary increase in the realism of the shaped images and consists of applying on the shaped object, existing textures of the real images of the object.In this case, to do the mapping of an extracted texture of a real image, it is necessary that the textureaccurately correspond to the model 3D of that is made use [9].The detected feature points are used for automatic texture mapping. The main idea of texture mapping is that we get an image by combining two orthogonal pictures in a proper way and then give correct texture coordinates of every point on a head.To give a proper coordinate on a combined image for every point on a head, we first project an individualized 3D head onto three planes, the front (x, y), the left (y, z) and the right (y, z) planes. With the information of feature lines, which are used for image merging, we decide on which plane a 3D-head point on is projected.The projected points on one of three planes arethen transferred to one of feature points spaces suchas the front and the side in 2D. Then they are transferred to the image space and finally to the combined image space.The result of the texture mapping (figure 2) is excellent when it is desired to simulate some alteration of the face that does not involve a type of expression, as neutral. The picture pose must be the same that the 3D scanned data.¦¦¦ mi nj lk n j m i lk k j i w B v B u B b w v u 000,,)()()(')',','(¦¦ m i nj n jmij i v B u B b v u 00,)()(),(¦¦ m i nj n j m i j i v B u B b v u 00,)()(')','(¦¦¦ mi nj lk n j m i lk k j i w B v B u B b w v u 000,,)()()(')',','(Figure 2 - Image shaped with texturemapping5.Age SimulationThis method involves the deformation of a face starting with control segments that define the edges of the faces, as¦¦¦ mi nj lk n j m i lk k j i w B v B u B b w v u 000,,)()()(')',','(Those segments are defined in the original face and their positions are changed to a target face. From those new positions the new position of each vertex in the face is determined.The definition of edges in the face is a fundamental step, since in that phase the applied aging curves are selected. Hence, the face is divided in influencing regions according to their principal edges and characteristics.Considering the face morphology and the modeling of the face aging developed [10], the face was divided in six basic regions (figure 3).The frontal region (1) is limited by the eyelids and the forehead control lines. The distance between these limits enlarges with forward aging.The orbitary region (2) is one of the most important aging parameters because a great number of wrinkles appears and the palpebral pouch increases [11]. In nasal region (3) is observed an enlargement of its contour.The orolabial region (4) is defined by 2 horizontal control segments bounding the upper and lower lips and other 2 segments that define the nasogenian fold. Figure 3 - Regions considering the agingparametersThe lips become thinner and the nasogenian fold deeper and larger. The mental region (5) have 8 control segments that define the low limit of the face and descend with aging. In ear curve (6) is observed an enlargement of its size. The choice of feature lines was based in the characteristic age points in figure 6.The target face is obtained from the aging curves applied to the source face, i.e., with the new control segment position, each vertex of the new image has its position defined by the corresponding vertex in the target face. This final face corresponds to the face in the new age, which was obtained through the application of the numerical modeling of the frontal face aging.The definition of the straight-line segment will control the aging process, leading to a series of tests until the visual result was adequate to the results obtained from the aging curves. The extremes of the segments are interpolated according to the previously defined curves, obtained by piecewise bilinear interpolation [12].Horizontal and vertical orienting auxiliary lines were defined to characterize the extreme points of the control segments (figure 4). Some points, that delimit the control segments, are marked from the intersection of the auxiliary lines with the contour of the face, eyebrow, superior part of the head and the eyes. Others are directly defined without the use of auxiliary lines, such as: eyelid hollow, eyebrow edges, subnasion, mouth, nasolabial wrinkle andnose sides.Figure 4 - Points of the control segmentsOnce the control segments characterize the target image, the following step of the aging process can be undertaken, corresponding to the transformations of the original points to the new positions in the target image. The transformations applied to the segments are given by the aging curves, presented in section 4.In the present work the target segments are calculated by polynomial interpolations, based on parametric curves [12].5.1Deformation approachThe common goal of deformation models is to regulate deformations of a geometric model by providing smoothness constraints. In our age simulation approach, a mesh-independent deformation model is proposed. First, connected piece-wise 3D parametric volumes are generated automatically from a given face mesh according to facial feature points.These volumes cover most regions of a face that can be deformed. Then, by moving the control pointsof each volume, face mesh is deformed. By using non-parallel volumes [13], irregular 3D manifolds are formed. As a result, smaller number of deformvolumes are necessary and the number of freedom incontrol points are reduced. Moreover, based on facialfeature points, this model is mesh independent,which means that it can be easily adopted to deformany face model.After this mesh is constructed, for each vertex on the mesh, it needs to be determined which particularparametric volume it belongs to and what valueparameters are. Then, moving control points ofparametric volumes in 3D will cause smooth facialdeformations, generating facial aging throughflaccidity, automatically through the use of the agingparameters. This deformation is written in matricesas , where V is the nodal displacements offace mesh, B is the mapping matrix composed ofBernstein polynomials, and E is the displacementvector of parametric volume control nodes.BE V Given a quadrilateral mesh of points m i,j ,, we define acontinuous aged surface via a parametricinterpolation of the discretely sampled similaritiespoints. The aged position is defined via abicubic polynomial interpolation of the form with d m,n chosen to satisfy the known normal and continuity conditions at the sample points x i,j .>@>M N j i ,...,1,...,1),(u @@>@>1,,1,),,( j j v i i u v u x ¦3,,),(n m n m n m v u d v u x An interactive tool is programmed to manipulate control points E to achieve aged expressions making possible to simulate aging through age ranges. Basic aged expression units are orbicularis oculi, cheek, eyebrow, eyelid, region of chin, and neck [14]. In general, for each segment, there is an associated transformation, whose behavior can be observed by curves. The only segments that do not suffer any transformation are the contour of the eyes and the superior side of the head.5.2Deformation approachThe developed program also performs shape transformations according to the created aging curves, not including any quantification over the alterations made in texture and skin and hair color. Firstly, in the input model the subjects are required to perform different ages, as previouslymentioned, the first frame needs to be approximately frontal view and with no expression.Secondly, in the facial model initialization, from the first frame, facial features points are extracted manually. The 3D fitting algorithm [15] is then applied to warp the generic model for the person whose face is used. The warping process and from facial feature points and their norms, parametric volumes are automatically generated.Finally, aging field works to relieve the drifting problem in template matching algorithm, templates from the previous frame and templates from the initial frame are applied in order to combine the aging sequence. Our experiments show that this approach is very effective. Despite interest has been put in presenting a friendly user interface, we have to keep in mind that the software system is research oriented. In this kind of applications an important point is the flexibility to add and remove test facilities. 6.Results The presented results in the following figuresrefer to the emulations made on the frontalphotographs, principal focus of this paper, with theobjective to apply the developed program to otherpersons outside the analyzed group. The comparisonswith other photographs of the tested persons dependon their quality and on the position in which theywere taken. An assessment was made of the new positions, of the control segments. It consisted in: after aging a face, from the first age to the second one, through the use of polynomial interpolation of the control segments in the models in the young age, the new positions are then compared with the ones in the model of a relative of older age (figure 5). The processed faces were qualitatively compared with theperson’s photograph at the same age. Figure 5 - Synthetic young age model,region-marked model and aged modelAlso the eyelid hollow, very subtle falling of the eyebrow, thinning of the lips with the enlarging of the nasion and the superior part of the lip, enlargingof the front and changing in the nasolabial wrinkle.7.ConclusionsModelling biological phenomena is a great deal of work, especially when the biggest part of the information about the subject involves only qualitative data. Thus, this research developed had has a challenge in the designing of a model to represent the face aging from qualitative data.Due to its multi-disciplinary character, the developed methodology to model and emulate the face aging involved the study of several other related fields, such as medicine, computing, statistics and mathematics.The possibilities opened by the presented method and some further research on this field can lead to new proposals of enhancing the current techniques of plastic face surgery. It is possible to suggest the ideal age to perform face lifting. Once the most affected aging regions are known and how this process occurs over time. Also missing persons can be recognized based on old photographs using this technique. AcknowledgementsThe project TIN2004-07926 of Spanish Government have subsidized this work.8. References[1] Burt, D. M. et al., Perc. age in adult Caucasianmale faces, in Proc. R. Soc., 259, pp 137-143,1995.[2] Berg, A C. Aging of Orbicularis Muscle inVirtual Human Faces. IEEE 7th InternationalConference on Information Visualization, London, UK, 2003a.[3] Beier , T., S. Neely, Feature-based imagemetamorphosis, In Computer Graphics (Proc.SIGGRAPH), pp. 35-42, 1992.[4] Parke, F. I. P arametrized Models for FacialAnimation, IEEE Computer & Graphics Applications, Nov. 1982.[5] Waters, K.; A Muscle Model for Animating ThreeDimensional Facial Expression. Proc SIGGRAPH'87,Computer Graphics, Vol. 21, Nº4, United States, 1987. [6] Koch, R.M. et alia.. Simulation Facial SurgeryUsing Finite Element Models, Proceedings of SIGGRAPH'96, Computer Graphics, 1996.[7] Kurihara, Tsuneya; Kiyoshi Arai, ATransformation Method for Modeling and Animation of the Human Face from Photographs, Computer Animatio n, Springer-Verlag Tokyo, pp.45-58, 1991.[8] Kent, J., W. Carlson , R. Parent, ShapeTransformation for Polygon Objects, In Computer Graphics (Proc. SIGGRAPH), pp. 47-54, 1992. [9] Sorensen, P., Morphing Magic, in ComputerGraphics World, January 1992.[10]Pitanguy, I., Quintaes, G. de A., Cavalcanti, M.A., Leite, L. A. de S., Anatomia doEnvelhecimento da Face, in Revista Brasileira deCirurgia, Vol 67, 1977.[11]Pitanguy, I., F. R. Leta, D. Pamplona, H. I.Weber, Defining and measuring ageing parameters, in Applied Mathematics and Computation , 1996.[12]Fisher, J.; Lowther, J.; Ching-Kuang S. Curveand Surface Interpolation and Approximation: Knowledge Unit and Software Tool. ITiCSE’04,Leeds, UK June 28–30, 2004.[13]Lerios, A. et al., Feature-Based VolumeMetamorphosis, in SIGGRAPH 95 - Proceedings,pp 449-456, ACM Press, N.Y, 1995.[14]Berg, A C. Facial Aging in a VirtualEnvironment. Memória de Investigación, UIB, Spain, 2003b.[15]Hall, V., Morphing in 2-D and 3-D, in Dr.Dobb's Journal, July 1993.。

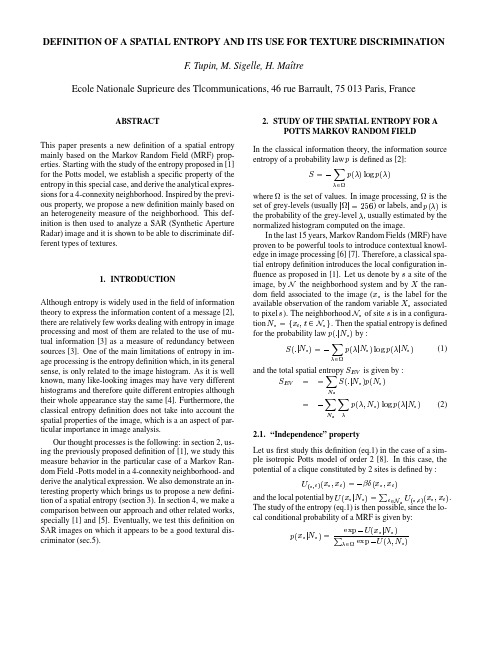
u bend u 型管u stirrup u 形箍筋ultimate bearing capacity 极限承载量ultimate bending moment 极限弯矩ultimate compressive strength 极限抗压强度ultimate design 极限设计ultimate design resisting moment 极限设计抗力矩ultimate factor of safety 极限安全系数ultimate limit state 极限状态ultimate load 极限荷载ultimate load analysis 极限荷载设计ultimate load design 极限荷载设计ultimate loading 极限加荷重ultimate moment 临界矩ultimate resistance 极限强度ultimate shear stress 极限剪应力ultimate shrinkage 极限收缩量ultimate strength 极限强度ultimate strength method 破坏强度设计法ultimate stress 极限应力ultimate tensile strength 极限抗拉应力ultra high strength concrete 超高强度混凝土ultrasonic pulse velocity method 超声脉冲速度法ultrasonic sounding 超声波测深测ultrasound 超声波ultraviolet rays 紫外线umbrella roof 伞形屋顶unbalanced load 不平衡负载unbalanced moment 不平衡力矩unbonded member 未粘结后张预应力构件unbonded post tensioning 无束缚后加拉力unbonded tendon 未粘合的预应力钢筋unbuilt area 未建区unburnt brick 未烧透砖uncased pile 无壳套桩unconfined groundwater 非承压地下水uncontrolled ventilation 无控制通风uncoursed rubble masonry 乱砌毛石under river tunnel 河底隧道underbed 底架underbrush 小试undercoat 底漆undercrossing 下穿交叉underdrainage 地下排水underfloor duct 地板下管道underfloor heating 地板下供暖underfloor heating cable 地板下供暖电缆underflow 地下水流underground 地下underground car park 地下停车站underground concrete 地下混凝土underground construction 地下工程underground garage 地下车库underground palace 地下官殿underground pipeline 地下管道underground railway 地下铁道underground run off 排水暗沟underground shelter 地下防空洞underground structures 地下构造物underground tank 地下储罐underground water 地下水underground water head 地下水水头underlayer 垫层underpinning 加固基础undersanded concrete 少砂混凝土混合料underwater concrete 水下混凝土underwater concreting 水下灌注混凝土underwater structures 水下结构undistorted ground 原壮土undisturbed sample 原状土试样undisturbed soil 原壮土undreground works 地下构造物undressed timber 未刨光木料unframed door 无骨架门扇unglazed tile 滞光瓷砖ungrading 筛分析unhardened concrete 未硬结混凝土uniform beam 等截面粱uniform grading 均匀粒径uniform load 均匀荷载uniform settlement 均匀沉陷uniform stress 均布应力uniformity 均匀性uniformly distributed load 均布载荷union 管接头union flange 管接法兰unique construction 特种结构unit 单位unit air conditioner 单位空气第机unit air heater 空气加热机组unit area 单位面积unit construction 构件组合unit cooler 单位冷却机组unit cost 单价unit deformation 单位变形unit generalized load 广义单位荷载unit heater 热风机unit lateral strain 单位横向应变unit load 单位荷载unit of area 面积单位unit pressure 单位压力unit producing yard 部件预制场unit strain 单位应变unit volume expansion 单位体积膨胀unloaded chord 不载荷弦unprotected metal construction 无保护层金属构造unrammed spread concrete 未夯实混凝土unreactive aggregate 惰性集料unreinforced concrete 无钢筋混凝土unrestrained member 无约束部件unset concrete 未凝结混凝土unsound aggregate 劣质骨料unsound cement 不坚固水泥unsound plaster 劣质不安定灰泥unstability 不稳定性unstable ground 不稳定地面unstable soil 不安定土壤unsteamed concrete 非蒸养混凝土unstiffened member 未加劲构件unsymmetrical beam 不对称梁unsymmetrical bending 不对称弯曲untensioned reinforcement 无受力钢筋unusual structure 异常结构unworkable concrete 难灌筑混凝土up feed heating system 上给下分式供暖系统up ligthing 向上照明up to date technics 现代化的技术upkeep cost 维持费uplift pressure 浮力upper chord 上弦杆upper layer 上层upper reinforcement 上部钢筋upper yield point 上屈服点upright 立柱upright course 竖立砌层upstanding beams slab 上肋形板urban area 城市地区urban art 城市美术urban center 市中心区urban communications 城市交通urban community 城市居住区urban conservation 市区保存urban construction 城市工程urban decoration 市区装饰urban development 城市发展urban dwelling 市区住宅urban environment 城市环境urban form 城市形式urban freeway 城市高速道路urban growth 市区扩展urban hygiene 市区卫生urban morphology 城市形态urban park 市区公园urban patteren 城市形式urban planning 城镇规划urban renewal 市区改建urban sprawl 城市扩展urbanist 城市规划者urinal 小便器usable floor area 可用地板面积use 使用use district 特殊建设区域useful capacity 有效容量useful cross section 有效截面useful load 有效荷载usefull space 有效空间utensil sink 厨房用洗涤盆utilities 城市管理服务行业utility core 公用事业中心utility gas 日用煤气utility shaft 工程设施网用竖井utility structures 公用事业建筑utilization 利用v beam sheeting v 形截面钢护墙板v brick v 形砖v joint v 形缝vacancy area 空地vacuum 真空vacuum concrete 真空混凝土vacuum core 真空采样器vacuum dewatering plant 真空脱水装置vacuum filter 真空过滤机vacuum filtration 真空过滤vacuum form 真空模板vacuum heating system 真空加热系统vacuum lifting equipment 真空提升设备vacuum mat 真空吸垫vacuum method wellpoint 真空预压法井点vacuum mold 真空模板vacuum pad 真空垫vacuum treated concrete 真空处理混凝土valley 谷valley breeze 谷风valley gutter 斜沟槽valley jack 屋顶斜构处撑杆valley rafter 屋顶斜构处椽valley roof 带斜沟屋顶value 值valve 阀valve bag 自封袋vanishing point 灭点vapor 汽vapor lock 汽封vaporization 蒸发vapour 汽variable air volume system 可变空气量系统variable concentrated load 可变集中荷载variable furniture 可变家具variation 变化varnish 清漆varnish brush 清漆刷varnish color 清漆涂料varnish paint 清漆涂料varying load 变动负荷vault 穹窿vault abatment 穹窿支座vault bay 拱顶跨度vault construction 拱顶结构vault rib 穹窿拱肋vault thrust 穹窿推力vaulting tile 穹形中空陶瓷块vav system 可变空气量系统vebe apparatus 贝氏振动式稠度计vector 失量vee gutter v形排水槽vehicle 运输工具;媒液velocity 速度veneer 胶合板veneer partition 镶板间壁veneer tie 镶面板系材veneered construction 贴面结构veneered door 镶胶合板veneered plywood 饰面胶合板veneered wall 镶面墙vent sash 楣窗vent shaft 通风井vented form 有通气孔模板ventilating duct 通风管道ventilating pipe 通气管ventilating shaft 通风井ventilating skylight 通风天窗ventilation 换气ventilation brick 通风砖ventilation cavity 通风穴ventilation heat loss 通风热损失ventilation installation 通风装置ventilation load 换气负荷ventilation opening 通风口ventilation plant room 通风装置室ventilation rate 换气次数ventilation system 通风系统ventilator 送风机ventlight 楣窗veranda 阳台verdurization 绿化verge board 挡风板verge cutter 边缘切割机verge fillet 檐口瓦嵌条vermex concrete 隔声混凝土vermiculite aggregate 蛭石骨料vermiculite concrete 蛭石混凝土vermiculite mortar 蛭石灰浆vertex 顶点vertical alignment 竖向定线vertical bar 竖杆vertical displacement 垂直位移vertical links 垂直连杆vertical meeting rail 窗扇盖缝条vertical pivoting window 竖轴转窗vertical plan 垂直面图vertical sash 竖拉窗vertical shoring 托换基础vertical sliding window 竖拉窗vertical strip door 垂直条幅木板门vertical ties 垂直系材vertical tiling 竖墙贴砖vertical web member 垂直桁材very light aggregate concrete 特殊轻质骨料混凝土very light concrete 特殊轻质混凝土vessel 容器vest pocket park 小型公园vestibule 门厅vets housing 老手住宅viaduct 高架桥vibrated concrete 振实混凝土vibrating beam 震捣梁vibrating chute 抖动式滑槽vibrating circular pipe line circular 振动输送管vibrating conveyor 振动式输送机vibrating float 振动抹子vibrating grizzly 振动筛vibrating mold 振动模vibrating pebble mill 振动砾磨机vibrating plate 振动板vibrating roller 振动辊vibrating screed 震捣梁vibrating screen 振动筛vibrating stressing bed 振动张拉台座vibrating table 振动台vibrating tamper 振动压实机vibration 振动vibration control 振动控制vibration isolation 振动控制vibration limit 振动限度vibrator 振动器vibrator cylinder 圆筒振捣器vibratory bullfloat 振动抹子vibratory compactor 振动压实机vibratory pile hammer 振动打桩机vibratory spiral elevator 振动螺旋升降机vibro driver 振动打桩机vibrofinisher 振动轧平机vibrofloat machine 振浮压实器vibroflotation soil compaction 振浮压实土壤vibrolithic concrete 分割浇注混凝土vibromill 振动磨vibromold 振动模vibropile 振动灌注桩vibropiling 振动打桩vibroplatform 振动台vibroroller 振动滚轧vibrorolling 振动压延vibrosieve 振动筛vibrotrunk 振动滑槽vice 虎钳vierendeel girder 带上下桁条的梁view 情景villa 别墅village 乡村vinyl asbestostiles 石棉尸铺板vinyl tiles 乙烯基板viscoelastic strain 粘弹性变形viscometer 粘度计viscosity 粘度viscosity factor 粘度系数visibility 能见度visibility factor 视度系数vision 视界visionproof glass 毛玻璃vista 远景visual concrete 外露混凝土vitrified brick 玻璃砖void 空隙void cement ratio 隙灰比void filler 填隙料void formers 制孔机void pockets 气窝voids 空隙voids content 孔隙含量voids ratio 空穴系数voids volume 孔隙体积volcano 火山volt 伏特voltage 电压voltmeter 电压电量计volume 容积volume batcher 按体积比配料器volume batching 按体积比配合volume expansion 体积膨胀volume ratio 容积比volumetric analysis 容积分析volumetric batch plant 容积计量设备volumetric batcher 按体积比配料器volumetric change 体积变化vortex 涡旋vortex air supply panel 旋涡空气分配板vortex reactor 涡动反应器vortex tube 涡淋voussoir 拱楔块voussoir arch 楔形块拱wa ce cretor 水灰计量装置waffle slab 格子板wages 工资wagner fineness 瓦格纳细度wagon 货车wagon ceiling 拱形顶棚wainscot 护壁镶板waisted specimen 缩腰的试件waiting room 等待室walk up building 无电梯的公寓walked on roof covering 有步行道的屋顶walks 搭板walkway 跳板wall 墙wall absorption 墙吸水wall air conditioner 墙挂式空碟wall anchor 墙锚wall base 墙座wall beam 墙托梁wall bearing construction 墙承重的结构wall bed 壁床wall bracket 墙托座wall brick 墙砖wall cabinet 嵌墙绸wall chase 墙槽wall column 墙柱wall component 墙装配件wall crane 墙上起重机wall facing 墙饰面wall footing 墙基脚wall form 墙模板wall handrail 墙上扶手wall heatiing panel 散热墙板wall hung water closet 墙挂式自洗便器wall in trench 壕沟墙wall iron 墙上管夹wall line 墙外围线wall luminaire 壁照描备wall mounted heater 壁装式加热器wall opening 墙洞wall panel 护墙板wall paper 墙纸wall plate 承梁板wall pointing machine 墙勾缝机wall run 暂时的墙洞wall skin 地下室墙防水wall string 墙楼梯斜梁wall tie 系墙铁wall tile 墙面贴砖wall urinal 墙挂式小便器wall wash lumunaire 筑入墙的照眠wallboard 墙板waller's hammer 石垛工锤walling 墙wallpapering work 贴墙纸warm air curtain 热风幕warm air duct 热空气管warm air heating 热风供暖warm air heating unit 热风供暖装置warm water method 温水法warning system 警报系统warp 翘曲warren girder 瓦伦大梁warren truss 瓦伦大梁wash 洗wash basin 洗脸盆wash fountain 公用洗涤池wash house 餐具洗涤室wash primer 洗涤底漆wash water trough 洗涤排水沟washing and screening plant 洗选装置washing screen 洗矿筛washing screw 螺旋洗涤机waste disposal unit 废物处理装置waste heat 废热waste heat utilization 废热利用waste heating 废热供暖wasted energy 损失的能量watch room 警卫室water 水water air heating system 水气供热系统water basin 硫water bearing ground 含水地层water boiler 热水锅炉water booster system 加压装置water borne dumper 砾石倾卸船water boundary 水界water cement 水硬水泥water cement ratio 水灰比water circulation 水循环water closet 抽水马桶water conservation 水源保护water consumption 水消耗water contained in aggregates 骨料的自然湿度water cured concrete 水熟混凝土water curing 水养护water demand rate 水消耗定额water filled roof 充水屋顶water filled steel framed structure 充水钢框架结构water filter 滤水器water filtration plant 水过滤场water fittings 给排水管配件water front construction 沿岸建筑物water gallery 排水坑道water glass 水玻璃water glass color 硅酸盐颜料water glass paint 水玻璃颜料water hammer 水锤water hardness 水硬度water heater 水加热器water holding capacity 含水能力water jet pump 喷射泵water jetting 水冲法water level 水位water main 给水干管water management 用水管理water meter 量水器water monitoring 水监测water of hydration 结合水water paint 水性漆water pipe 给水管water post 给水站water power dam 水电站坝water pressure 水压water protection zone 水源保护区域water putty 防水油灰water reducing admixture 减水外加剂water reducing agent 减水剂water repellent facing 防水饰面water resistance 耐水性water resistance paint 耐水漆water retaining admixture 保持水外加剂water retaining capacity 保水能力water retaining structure 挡水建筑物water retentive portland cement 保水性波特兰水泥water service 给水water service pipe 给水管water softening plant 软水设备water storage tank 贮水箱water strainer 滤水器water supply 给水water supply engineering 给水工程water supply facilities 给水设备water supply fittings 给水管零件water supply network 给水管网water supply reservoir 给水用贮水池water supply scheme 给水系统water supply system 给水系统water tight concrete 防水混凝土water to water heater 水水加热器water to water system 水水系统water tower 给水塔water treatment plant 净水厂water treatment works 净水厂water tube boiler 水管式锅炉water vapor 水汽water works 自来水厂water works engineering 给水工程water/binder ratio 水灰比waterfall 瀑布waterline network 给水管网waterlogged soils 浸饱水的土壤waterproof agent 防水剂waterproof canvas 防水帆布waterproof cement 防水水泥waterproof concrete 防水混凝土waterproof construction 防水构造物waterproof mortar 防水灰浆waterproof paint 防水漆waterproof plaster 防水抹灰waterproofing 防水waterproofing admixture 防水外加剂waterproofing compound 防水化合物waterproofing course 防水层waterproofing emulsion 防水乳剂waterproofing felt 防水毛毡waterproofing materials 防水材料waterproofing work 防水处理waterrepellent cement 援性水泥waterrepellent concrete 援性混凝土waterrepelling admixture 援外加剂watersphere 球状水压式贮水器watertight core 防渗心墙waterway 水路watery city 水上城市wave 波wave erosion 波蚀wave force 波力wave generator 波形信号发生器wave impact 波浪冲击wave load 波浪荷载wave pressure 波浪压力wavy line 波形线wax 蜡wax emulsion 蜡乳化液way 道wc and bathroom unit 厕所浴室设备单元wc flushing cistern 冲洗水箱wc pan 抽水马桶wc suite 厕所套间weak concrete 低标号混凝土wear 磨耗;磨耗wearing course 磨耗层wearing layer 磨耗层weather 天气weather boarding 安装风雨板weather groove 泻水槽weather resistance 抗风化weather resistant concrete 抗风化混凝土weathering 风化web 腹板web member 腹杆web plate 腹板web splice 腹板搭接web stiffener 腹板加劲件wedge 楔wedge anchor 楔锚固装置wedge anchorage 插楔wedge of failure 楔形滑坍wedge valve 楔形阀wedging 楔固weigh batch plant 重量配料设备weigh batching 按重量配料weigh box 计量箱weigh hopper 秤料斗weighing apparatus 秤weighing batchbox 重量配料器weighing batcher 重量计量器weight 重量weight ratio 重量比weighted cement 重水泥weir 堰weld 焊weld crete 混凝土粘结剂weld decay 焊缝腐烂welded construction 焊接结构welded reinforcement 焊接钢筋welded steel structure 焊接钢结构welded wire fabric 焊接钢筋网welding 焊接welding arc 焊弧welding goggles 焊工护目镜welding helmet 焊工面罩weldment 焊件well 井well burned brick 烧透砖well cementing 钻孔灌浆well foundation 井筒基础well interference 井间干扰wet concrete 塑性混凝土wet consistency 塑性稠度wet construction 湿式施工wet mix shotcrete 湿拌喷射水泥灰浆wet mortar 湿灰浆wet screed 抹灰刮板wet screening 湿筛wettest stable consistency 塑性混凝土稳定稠度wetting agent 润湿剂wharf 码头wheel 轮whetstone 磨石white brick 白砖white cement 白水泥white lead 铅白white portland cement 白色硅酸盐水泥whitewash 石灰水whole brick wall 一砖墙wibdow fastener 窗闩销wide flange beam 宽翼缘梁wimble 手摇钻winch 绞盘wind 风wind bracing 抗风支撑wind deflection 风力偏移wind effect 风力影响wind girder 风障梁wind load 风荷载wind pressure 风压wind pressure coefficient 风力系数wind protection screen 防风板wind speed alarm 风速警报器wind uplift 风浮力wind vibration 风振windbreak 防风林winder 斜踏步winding 线圈winding machine 缠绕机window 窗window air conditioner 窗式空调window back 窗腰window band 带形窗window bar 窗闩window board 窗舌板window box garden 窗台花坛window butt 窗铰链window catch 窗钩window fittings 窗配件window frame 窗框window glass 窗玻璃window guards 窗铁栅window hangings 窗帘window head 窗框上槛window lintel 窗过梁window mullion 窗框的中框window opening 窗口window panel 带窗口板件window pier 窗间壁window reveal 窗帮window schedule 窗一览表window sill 窗盘window space 窗户玻璃面积window unit 窗单元window wall 玻璃墙windowless building 无窗房屋windward side 迎风面wing 耳房wing pile 翼状桩winter 冬季winter building construction 建筑物冬季施工winter building techiniques 冬季施工法winter concreting 冬季浇筑混凝土winter garden 冬景花园winterized concrete plant 冬季制造混凝土工厂wire 金属线wire anchorage 铁丝锚固wire brushing 钢丝刷清理wire cable 钢索钢丝绳wire cloth 金属丝布wire construction 钢酸构wire dam 石框坝wire fabric 铁丝网wire fence 铁丝栅栏wire glass 夹丝玻璃wire lath 金属网wire mesh reinforced concrete 钢丝网配筋混凝土wire reinforced concrete 钢丝配筋混凝土wire rope 钢丝绳wire rope sling 钢丝绳吊索wire tie 铁丝系材wiree gauze 铁丝网wireless tower 天线塔wiring 配线wiring diagram 配线图withe 烟囱隔板wobble coefficient 摆动系数wood 木wood block 木块wood brick 木砖wood cement concrete 木屑混凝土wood chipboard 碎木板wood chisel 木凿wood construction 木结构wood fiber 木纤维wood fiber board 木纤维板wood fiber concrete 木丝混凝土wood fiber slab 木纤维板wood fibered insulation 木纤维绝热wood fibered plaster 木纤维灰浆wood float 木抹子wood flooring 木地板wood flour 木屑wood frame construction 木框架结构wood frame house 木框架房屋wood laminated arch 木制叠层拱wood lath 木板条wood panel construction 木板结构wood screw 木螺钉wood stave pipe 木条拼成的水管wood structure 木结构wood wool 木丝wood wool cement slab 木丝水泥平板wood wool concrete 木丝混凝土wood wool slab 木丝平板wooden apartment 木质公寓wooden barrack 木质工棚wooden construction 木结构wooden door 木门wooden form 木模板wooden furniture 木制家具wooden shingle 木板瓦wooden turned baluster 精制木质栏杆小柱wooden weir 木堰woodwork 木制品woodworker's vise 木工虎钳woodworking industry 木制品工业woodworking machinery 木工机械wool 羊毛work as executed drawing 实测图work cubes 混凝土方体work in progress 过程进行中的工作work level 工捉台work progress 施工过程workability 可加工性workability admixture 增塑外加剂workable concrete 有和易性混凝土workable weather 做活适合天气worker 工人working 椎working area 工住地working chamber 工滓working crew 椎队working deck 工专working design 施工设计working drawing 工准working load 使用负载working load limit 极限工咨载working place 工住所working plan 工灼划working platform 工专working platform of a scaffold 脚手架工捉台working pressure 工坠力working range 工锥围working stress 工爪力working stress design 许用应力设计法working width 工醉度working zone 工坐域workmanship 工资量workmen's shelter 工人临时生活设施works 结构物works beam test 就地梁试验works cube strength 实际小方块强度workshop 工厂;修理厂wrench 扳钳x ray analysis x射线分析x ray examination x射线检查x ray intensity monitor x光强度检验x ray shielding concrete x线屏蔽混凝土x ray test x射线检查xunderground plant 地下工厂xylograph 木板画xylolite 菱苦土木屑板y branch y 形支管y junction y形接头yard 庭院yard drainage 庭院排水yard gulley 庭院排水沟year round air conditioning 全年式空气第yellow 黄色yellow ocher 羝yield 屈服yield point 怜点yield range 屈服区域yield strength 屈服强度yield stress 屈服应力yielding 屈服yielding ground 松软土地yielding support 可缩性支座yoke 轭状物young's modulus of elasticity 杨氏模量youth center 青年厅堂zenith 顶点zero end of survey 路线测量的起点桩zero line 零位线zero moment 零力矩zero moment method 零力矩法zero slump concrete 坍落度为零的混凝土zinc 锌zinc white 锌白zonal ventilation 区域通风zone 带zoning 分地带zoning plan 分区规划zoo 动物园zoological garden 动物园zoological park 动物园。

测绘工程专业本科培养方案学科门类:工学专业大类:测绘类专业名称:测绘工程专业代码: 081201 学制:四年授予学位:工学学士一、培养目标本专业培养适应经济社会发展需要,德、智、体、美全面发展,具有扎实的自然科学与人文科学素养,具备数学、计算机、外语、经济、管理等方面的应用基础,获得工程师的基本训练,掌握地面测量、空间测量与导航、摄影测量与遥感以及地图和地理信息系统等方面的基础理论和知识,掌握地理空间信息获取、处理、表达和应用的基本原理、方法及测绘工程项目管理的技能,具有继续学习能力、创新能力和国际视野的专业技术人才。
本专业学生毕业5年左右,具有高尚的职业道德和较强的社会责任感,具备胜任工程师或相应职称的专业技术能力和条件,能在国民经济各部门从事国家基础测绘、城市和工程测绘、国土资源调查与管理,测绘地理信息综合服务,及在环境保护与灾害预防等领域从事生产、设计、开发、研究、教学及管理等方面工作。
二、毕业要求本专业学生主要学习测绘工程的基本理论和基本知识,掌握测绘及数据处理的手段与方法,接受测绘工程师的基本技能训练,具有应用所学基础理论和专业知识,分析解决复杂工程问题、开展科学研究、从事生产设计和组织管理的基本能力。
毕业生应获得以下方面的知识、能力与素质:1、工程知识:掌握数学、物理、地球科学等方面基础理论和知识,掌握工程基础知识与测绘工程专业的基础理论和知识,掌握地理空间信息获取、处理、分析、表达、应用与服务的基本原理与方法,能够将数学、自然科学、工程基础和测绘专业知识用于解决复杂工程问题。
2、问题分析:具有发现问题、分析问题的能力,能够应用数学、自然科学、工程科学的基本原理,识别、表达、并通过文献研究分析大地测量、工程测量、摄影测量与遥感以及地理信息系统工程等有关的复杂工程问题,以获得有效结论。
3、设计/开发解决方案:能够设计大地测量、工程测量、摄影测量与遥感以及地理信息系统工程等有关的复杂工程问题的解决方案,设计满足特定工程需求的系统、单元或工艺流程,并能够在设计环节中体现创新意识,考虑社会、健康、安全、法律、文化以及环境等因素。

非牛顿流体的英语实验结果Experimental Results on Non-Newtonian Fluids.Non-Newtonian fluids are a unique class of liquids that do not obey the classical laws of fluid mechanics established by Sir Isaac Newton. These fluids exhibit a complex relationship between stress and strain rate, making them behave differently from the more familiar Newtonian fluids like water or air. The behavior of non-Newtonian fluids can range from viscoelastic, where they resist deformation and exhibit a memory of past deformations, to dilatant, where their viscosity increases with shear rate, or pseudoplastic, where their viscosity decreases with shear rate.To delve deeper into the fascinating properties of non-Newtonian fluids, we conducted a series of experiments designed to observe and understand their behavior under various conditions. In this article, we present thedetailed experimental results from our investigation.Experiment 1: Shear Thickening Behavior.In the first experiment, we aimed to observe the shear thickening behavior of a pseudoplastic non-Newtonian fluid, such as cornstarch suspension. We used a viscometer to measure the viscosity of the fluid at different shear rates. As the shear rate increased, we observed a significant increase in viscosity, indicating the shear thickening effect. This behavior is counterintuitive as most fluids become less viscous with increased shear rate. The experiment revealed that the cornstarch suspensionexhibited a dramatic increase in viscosity when subjectedto rapid shear, making it behave like a solid under high-stress conditions.Experiment 2: Flow Patterns.For our second experiment, we investigated the flow patterns of a non-Newtonian fluid in a closed loop system. We used a transparent tube filled with the fluid and observed its flow behavior as it was pumped through theloop. We found that the fluid exhibited complex flow patterns, with regions of high and low shear ratescoexisting within the same flow stream. This behavior isnot seen in Newtonian fluids, where the shear rate is uniform throughout the flow. The experiment highlighted the importance of considering both spatial and temporal variations in shear rate when studying non-Newtonian fluids.Experiment 3: Rheological Properties.In our third experiment, we focused on characterizingthe rheological properties of a non-Newtonian fluid using a rheometer. Rheometers allow for precise measurement ofstress and strain rate relationships, providing insightsinto the fluid's viscoelastic behavior. We observed thatthe fluid exhibited both viscous and elastic components,with the elastic component becoming more dominant at lower frequencies. This finding is significant as it suggeststhat non-Newtonian fluids can store and release energy like solids, making them behave like viscoelastic solids under certain conditions.Experiment 4: Impact Response.Finally, in our fourth experiment, we investigated the impact response of a non-Newtonian fluid. We dropped a weight into a container filled with the fluid and observed the resulting deformation and recovery behavior. We found that the fluid exhibited a unique ability to resist deformation upon impact but recovered its original shape quickly after the impact. This behavior is distinct from that of Newtonian fluids, which typically deform permanently upon impact. The experiment demonstrated the unique properties of non-Newtonian fluids in dynamic loading conditions.In conclusion, our experiments have provided valuable insights into the complex behavior of non-Newtonian fluids. These fluids exhibit a rich array of rheological properties that are not seen in Newtonian fluids, making them fascinating and challenging to study. The findings from our experiments have implications in various fields, including industrial processing, biomechanics, and material science, where non-Newtonian fluids play crucial roles. Futureresearch in this area is likely to yield even more surprising discoveries and potential applications for these unique fluids.。
测绘工程专业介绍英语作文Title: Introduction to Surveying and Mapping Engineering。
Surveying and Mapping Engineering is a multifaceted discipline that plays a pivotal role in various fields such as construction, urban planning, environmental management, and resource exploration. This profession involves the collection, analysis, and presentation of spatial data to facilitate informed decision-making and effective project implementation. In this essay, we will delve into the fundamental aspects of Surveying and Mapping Engineering, exploring its significance, core principles, methodologies, and potential career pathways.To begin with, Surveying and Mapping Engineering encompasses a diverse range of activities aimed at acquiring, managing, and utilizing spatial information. Its primary objective is to accurately represent the Earth's surface and its features in two-dimensional or three-dimensional formats. Through the use of advanced technologies such as Global Navigation Satellite Systems (GNSS), Geographic Information Systems (GIS), Remote Sensing, and LiDAR (Light Detection and Ranging), surveyors and mappers can capture detailed spatial data with unprecedented precision and efficiency.One of the fundamental principles of Surveying and Mapping Engineering is geodesy, which deals with the measurement and representation of the Earth's shape, gravitational field, and rotation. Geodetic surveys provide essential reference frameworks for mapping and spatial analysis, enabling accurate positioning and navigation across various geographical scales.In addition to geodesy, Surveying and Mapping Engineering encompasses several specialized subfields, including:1. Land Surveying: Land surveyors are responsible for determining the boundaries, contours, and features of land parcels. They play a crucial role in land developmentprojects, property transactions, and cadastral mapping.2. Topographic Surveying: Topographic surveyors focuson mapping the natural and man-made features of aparticular area, including terrain, vegetation, water bodies, and infrastructure. These surveys are essential for infrastructure planning, environmental monitoring, and disaster management.3. Hydrographic Surveying: Hydrographic surveyors specialize in mapping underwater terrain, including the depth, shape, and composition of seabeds, lakes, and rivers. Their work is critical for maritime navigation, offshore resource exploration, and coastal zone management.4. Engineering Surveying: Engineering surveyors provide support to civil engineers and construction professionalsby conducting precise measurements, monitoring deformation, and ensuring the accuracy of construction projects. Their expertise is indispensable in infrastructure development, urban planning, and structural analysis.Surveying and Mapping Engineering offers a wide range of career opportunities in both the public and private sectors. Graduates can pursue careers as land surveyors, GIS specialists, remote sensing analysts, cartographers, geospatial engineers, or academic researchers. Moreover, with the increasing integration of digital technologies and data-driven decision-making processes, the demand for skilled surveying and mapping professionals is expected to grow significantly in the coming years.In conclusion, Surveying and Mapping Engineering is a dynamic and interdisciplinary field that plays a vital role in modern society. By providing accurate spatial information and analytical tools, surveyors and mappers contribute to sustainable development, environmental conservation, and efficient resource management. As technology continues to advance, the importance of surveying and mapping will only continue to increase, making it an exciting and rewarding career choice for those interested in geography, technology, and problem-solving.。
Geometric ModelingGeometric modeling is a crucial aspect of computer graphics, engineering, and design. It involves creating digital representations of objects and environments using mathematical and computational techniques. Geometric modeling plays a significant role in various industries, including architecture, automotive design, video game development, and virtual reality. The process of geometric modeling allows designers and engineers to visualize and analyze complex structures, simulate real-world scenarios, and create realistic visualizations of their ideas. One of the key challenges in geometric modeling is achieving a balance between accuracy and efficiency. Designers and engineers often need to create highly detailed models with complex geometries, which can be computationally expensiveand time-consuming. At the same time, they also need to ensure that the models can be manipulated and rendered in real-time for interactive applications. This trade-off between accuracy and efficiency requires careful consideration of the modeling techniques and algorithms used to represent and manipulate geometric data.Another important consideration in geometric modeling is the representation of curved surfaces and freeform shapes. While simple geometric primitives such as cubes, spheres, and cylinders can be easily defined using mathematical equations, representing more complex shapes like human bodies, organic forms, and natural landscapes requires more advanced techniques. B-spline and NURBS (Non-Uniform Rational B-Splines) are commonly used to represent and manipulate curved surfacesin geometric modeling, allowing for smooth and flexible deformation of shapes. Geometric modeling also involves the creation of 3D models from 2D sketches or images. This process, known as 3D reconstruction, requires the use of computer vision and image processing techniques to extract depth and spatial information from 2D data. 3D reconstruction has applications in fields such as medical imaging, remote sensing, and augmented reality, where 3D models are generated from 2D images to facilitate analysis and visualization. In addition to creating static3D models, geometric modeling also encompasses the simulation and animation of dynamic objects and environments. Physics-based modeling techniques are used to simulate the behavior of physical systems, such as the motion of rigid bodies, the deformation of elastic materials, and the interaction of fluids and gases. Thesesimulations are essential for applications like virtual prototyping, computer-aided engineering, and special effects in movies and video games. Moreover, geometric modeling is closely related to the field of computational geometry, which focuses on the development of algorithms and data structures for solving geometric problems. Computational geometry has applications in areas such as computer-aided design, robotics, geographic information systems, and computer graphics. It addresses fundamental problems like geometric intersection, proximity queries, convex hull computation, and mesh generation, which are essential for many geometric modeling tasks. In conclusion, geometric modeling is a multifaceted discipline that encompasses a wide range of techniques and applications. It plays a critical role in various industries and research fields, enabling the creation, analysis, and visualization of complex geometric data. The challenges in geometric modeling, such as balancing accuracy and efficiency, representing curved surfaces, reconstructing 3D models from 2D data, simulating dynamic systems, and solving fundamental geometric problems, require innovative solutions and advancements in computational and mathematical techniques. As technology continues to evolve, geometric modeling will continue to be anessential tool for shaping the virtual and physical world around us.。
Piezoelectric sensor determination of arterial pulse wave velocityArterial pulse wave velocity (APWV) is a measure of the elasticity (or stiffness) of peripheral arterial blood vessels. The pulse referred to here will be the pressure pulse as opposed to the flow pulse measured by ultrasound Doppler.The pressure pulse velocity varies over the range from about 12 m s?1 to15 m s?1 in stiff peripheral arteries, whereas in normal arteriesit has a velocity in the range of 7 to 9 m s?1.The aim of this project was the development of a fast and easy to use system for the determination of peripheral arterial pulse wave velocity. The principle of the PWV measurement is based on simultaneous measurement of two pulse waves at two different positions, such as the radial artery at the wrist and the brachial artery just above the elbow. By determining the pulse transit time between these points and the distance measured between the two locations, pulse wave velocity may then be calculated. The pressure pulse detection is done by using two piezoelectric sensors which generate a measurable voltage at the output contacts if they are mechanically deformed. The deformation produced voltage is first amplified and filtered and then digitalized with a data acquisition card. The analysis of the data obtained from the sensors includes a filtering process, the calculation of the PWV with three different methods— foot-to-foot, cross-correlation and peak-to-peak—and the determination of the arterial pulse rate.Extensive measurements with human test subjects were carried out to optimize the techniques of data acquisition and analysis. For example, it was found that the best procedure was to hold the sensors in place using elastic straps alone. The data analysis was upgraded with an additional software module, which deletes, in effect, outriders or invalid measurements. With the optimized system, a series involving eight test subjects ranging in age from 22 to 32 years was completed (all normotensive). The arterial pulse wave velocities determined covered a range from 6 m s?1to 12 m s?1, with an average standard deviation of less than 2.5 m s?1for individual results. These areslightly higher,but close to published APWV data. The results showedthat reproducible results can be obtained with the existing PWV acquirement and analysis system.The measurement of arterial pulse wave velocity (APWV) is one of the methods used to measure physiological changes in peripheral vascular disease. Others include pressure pulse contour, arterial elasticity, pulsatile flow, complex vascular impedance and cardiac work.There have been many investigations over the past 30 years or so to relate changes in age and progress of arterial disease, to vessel pathology and distensibility based on the propagation characteristics of the arterial pulse (Malindzak and Meredith 1970, McCormack 1981, Persson et al 2001, Ramsey 1995, Wilkinson 1998). They have only been partially successful from a clinical point of view, mainly due to the difficulty in controlling the effects of patient parameters (autonomic system, patient movement, etc).Early on, the methods of determining APWV involved direct invasive measurement of the pulse pressure at two points along anarterial segment and measuring the time taken for the pulse to travelthe length of the segment. Such investigations had to be limited to animals usually dogs.The sensor technique used in this work involves the piezoelectric effect in polyvinyllidene fluoride (PVDF), which produces an output voltage in response to mechanical pressure on the material.Three methods of APWV determination are used: foot-to-foot APWV; peak-to-peak APWV and cross-correlation APWV. The FFAPWV and CCAPWV methods are less sensitive to pressure wave reflections at bifurcations, etc in the arterial tree, than the PPAPWV method. Mean values and standard deviations were computed for all three methods and compared.‘Foot-to-foot’ APWV (FFAPWV). This is based on the velocity of the ‘foot’, or leading edge, of the pressure pulse wave. The ar rival times of the foot of the pulse wave at two positions along the artery are recorded. If Δt is the difference in arrival times and Δs the distance between the two recording positions (proximal and distal), the FFAPWV is simplyFFAPWV = Δs/Δt.‘Peak-to-peak’ APWV (PPAPWV). This is completely analogous to the FFAPWV except that the points of observation are the two (proximal and distal) peaks of the pulse wave andPPAPWV = Δs/Δt.Apparent pulse wave velocity (AAPWV). The pressure wave may be represented as aFourier series,P(t) = P0 +Pn sin(nωt + θn)Where P0 is the mean fluid pressure, n is the harmonic number, Pnis the amplitude of the nth harmonic and θn is the phase angle of the nth harmonic.The spatial rate of change of the phase for one harmonic based on two simultaneous pressure measurements separated by a distance _s along an artery, is related to the apparent arterial pulse wave velocity (AAPWV) by the following equation,AAPWVn = (Δs)n(f )(360o)/(θx1? θx2)Where AAPWV n is the apparent pulse wave velocity for the nth harmonic, f is the heart rate,θx1 is the phase angle for the proximal harmonic n and θx2 is the phase angle for the distal harmonic n.Cross-correlation PWV. If the arterial pulse at the proximal measurement position is represented by the pressure time series P(x1, t) and that at the distal position by P(x2, t) andthe cross-correlation coefficient is Φx1,x2(τ ), then Φwill have a maximum value at some time lag.The correlation function can be expressed asΦx1,x2(τ ) = (1/T )P(x1, t)P(x2, t) dt.The value of τ at which maximum correlation occurs represents the transit time (_t) of the pressure wave from position x1 to position x2 along the arterial segment. From the separation distance and transit time data the correlation arterial pulse wave velocity isCCAPWV = (x2 ? x1)/ Δt.In this work normal, young test subjects were used, and it has the primary objectives of optimizing the measurement procedures and establishing the statistical spread and mean values of the observed PWVs for a specific peripheral arterial segment. Based on this, it is planned to use the system in clinical trials involving patients with peripheral arterial disease (due to diabetes, hypertension, etc), pre-, during and post treatment (pharmaceutical or surgical).Analogue and digital circuitryAnalogue charge amplifier. Piezoelectric materials convert mechanical stress or strain into proportionate electrical energy, by producing a charge when subjected to mechanical stress. The charge is converted to a voltage by an operational amplifier connected as a current integrator, called a charge amplifier. The signal output of the amplifier is approximately ?30 mV. It is augmented by signal amplification.Analogue signal amplification . This is done by use of an inverting amplifier. Because a dc signal appears at the output of the chargeamplifier, dc offset removal is essential and is implemented in the inverting summingThe next phase of the analogue circuitry is a low pass filter to remove the 50 Hz noise interference.Digital controlled data acquisition and analysis. A dataacquisition board (DAQ) is required when the transducer signals need interfacing with a PC. The board contains 12 bit plus sign and a successive approximation and self-calibrating analogue-to-digital (ADC) converter. The ADC incurs a systematic error known as the quantization error. It is due to limited resolution and with the analogue input limit set at ?5 to +5 V, the quantization error of the A/D converter used here was calculated to be 0.122 mV.The data acquisition and analysis was done using Lab View—a powerful instrumentation and analysis programming language for PCs.Digital data acquisition program. The data acquisition circuit performs all the necessary operations for the data acquisition with Lab View. The functions of the circuit initialize the data acquisition and read the data from the acquisition card. These data are stored for later use in the data analysis part of the program.Lab View programs are called virtual instruments (VIs) because of their appearance and operations are analogous to measuring instruments.A VI that is called within another VI is called a sub-VI and is analogous to a subroutine in text-based languages.The data acquisition, analysis and presentation are comprised of three main procedures:(1) Data acquisition card to interface the hardware to the PC.(2) Data acquisition program to acquire and store data in a spreadsheet file.(3) Data analysis to carry out digital signal processing, calculate PWV and present results.PWV Calculation1. PWV calculation using peak detection. To calculate PWV using peaks, the location of the peaks must first be determined, so that the transit time of the wave between the peaks can be determined. It was found that the best method of peak detection is the derivative of the curve method. If the first derivative of a curve is zero, then an extreme value can exist—eithera peak or a turning point. It is necessary to take the second derivative at this point—if this is also zero, then an extreme value exists. The second VI used to determine the PWV is PWVcalc, using the time separation between the located peaks.2. PWV with pressure wave foot detection. The VI named PWV Foot determines the leading edge (foot) of the pressure wave at the upstream and downstream locations. The VI named PWVcalc is again used to compute the PWV from the time separation between the two leading edges (‘foot-to-foot’ APWV or FFAPWV).3. PWV with cross-correlation. The PWV determination with cross-correlation is done with the VI named CalcPWV. The VI is in two parts: a part for the initialization function and a part for the calculation of the CCAPWV.In all cases PWV values are assembled in an array and the mean value, standard deviation and variance are calculated.Sensor positioningSensor placement is critical to obtaining consistent measurements.A screw mechanism was first used to apply the sensors to the skin. But readings were very variable and so this technique was replaced by that in which the sensors are fixed to the skin by elastic strips. This led to better results.。
非均匀塞曼展宽英语Inhomogeneous Zeeman Broadening in Spectral AnalysisSpectral analysis plays a crucial role in variousscientific fields, including astrophysics, chemistry, and material science. One of the phenomena that can significantly affect the interpretation of spectral lines is Zeeman broadening, which arises due to the interaction between the magnetic field and the magnetic moment of the particles emitting the light. Inhomogeneous Zeeman broadening is a specific case where the broadening effect is not uniform across the entire spectral line.The inhomogeneous broadening occurs when there is aspatial variation in the magnetic field strength across the region of the emitting source. This can lead to a spread inthe energy levels of the emitting particles, which in turn causes a broadening of the spectral lines that is not uniform. The effect is particularly noticeable in stars, where the magnetic field can vary significantly from the surface to the core.To analyze the inhomogeneous Zeeman broadening, one must consider the distribution of the magnetic field within the emitting region. This can be complex, as it may involve turbulent fields, localized magnetic spots, or other non-uniformities. The spectral lines will be broadened todifferent extents depending on the local magnetic fieldstrength, leading to a complex profile that can be challenging to interpret.In the context of stellar atmospheres, the inhomogeneous broadening can be modeled using various techniques. One common approach is to use a magneto-optical model that takes into account the Hanle and Zeeman effects. These models can help in disentangling the effects of the magnetic field from other broadening mechanisms, such as thermal broadening or pressure broadening.The study of inhomogeneous Zeeman broadening is not only important for understanding the magnetic properties of celestial objects but also for diagnosing physical conditions such as temperature, density, and velocity fields within the emitting medium. Accurate measurements and analysis of this broadening can provide insights into the dynamics of stellar interiors and the behavior of plasmas in various astrophysical environments.In conclusion, inhomogeneous Zeeman broadening is a complex but important aspect of spectral analysis that can reveal valuable information about the magnetic fields and physical conditions of the sources under study. Advanced modeling and careful interpretation of the spectral data are essential for extracting meaningful physical parameters from the observed spectra.。
Deformation and vibration of a spatial clamped elastica with noncircular cross sectionJoyce Fang,Jen-San Chen*Department of Mechanical Engineering,National Taiwan University,Taipei10617,Taiwana r t i c l e i n f oArticle history:Received24November2013 Accepted8April2014 Available online18April2014Keywords:Spatial elasticaNoncircular cross section Vibration a b s t r a c tIn this paper we study the deformation and vibration of a clamped e clamped spatial rod with noncircular cross section.Focus is placed on the effect of the bending stiffness ratio in the two principal directions of the cross-section on the rod deformation and stability.The equations of motion are formulated within the framework of director theory and solved by shooting method.Static analysis shows that the clamped rod possesses both planar and spatial deformations.The planar deformation may be of self contact or not. The locus of the planar deformation is independent of the bending stiffness ratio.The locus of spatial deformation emerges from a bifurcation point on the locus of planar non-self-contact deformation.The bifurcation point depends on the stiffness ratio.Vibration method is adopted to determine the stability of the deformations.Both force-and displacement-driven procedures are considered.For the planar non-self-contact deformation,the natural frequency of the out-of-plane mode with one nodal point de-creases to zero when the end shortening approaches the bifurcation point.The experimental results on a rod with circular cross section agree qualitatively with the theoretical predictions.In particular,the jump phenomena in force-driven experiment during loading and unloading processes are confirmed.Ó2014Elsevier Masson SAS.All rights reserved.1.IntroductionWhen a clamped e clamped rod is under edge thrust,it mayfirst buckle into a planar curved configuration(Humer,2013).As the edge thrust increases further,the deformation evolves to a shape similar to a helix,see Miyazaki and Kondo(1997),Stump et al. (2001),Neukirch and Henderson(2002),van der Heijden et al. (2003),Henderson and Neukirch(2004),Goss and Neukirch (2005),and Phungpaingam et al.(2009,2012).In the case when the rod is infinitely long,complex localized writhing and self-contact can occur;see Thompson and Champneys(1996),van der Heijden and Thompson(2000),Neukirch et al.(2002),and Coman(2006).The static analyses cited above are focused on spatial rods with circular cross sections.Extra complications arise when the cross section of the rod is not circular,or more specifically when the bending stiffnesses about two orthogonal planes are not equal.The static analysis of a spatial elastica with noncircular cross section has also been studied by some researchers;mostly on infinitely long rod.One of the main results is that if the cross section is circular,the rod equations are integrable.This implies the existence of a smooth manifold of localized buckling solutions.In the case of noncircular cross section, the integrability is lost and the manifold splits;see Champneys and Thompson(1996),van der Heijden et al.(1998),and van der Heijden and Thompson(1998).Compared to static analysis,the studies on the vibration of spatial elastica are relatively rare.Lu and Perkins(1994)used Hamilton’s principle to formulate the equations of motion of a spatial elastica supported by spherical hinges.Cusumano and Moon (1995)investigated the chaotic non-planar vibration of a thin elastica.Plaut and Virgin(2004)studied the three-dimensional vibration of a vertical half-loop under self-weight.Fang and Chen (2013)studied the natural frequencies of a spatial elastica with adjustable end slopes.Chen and Fang(2014)investigated the effect of axial extensibility on the natural frequencies of a spatial elastica with spherical hinges.The spatial rods studied in these works are of circular cross sections.A straight rod with circular cross section is axially symmetric. Therefore,there exist an infinite number of possible deformations when it is buckled into a curved shape.In static analysis,it is usually necessary to assume that the rod deformation is in a certain plane (van der Heijden et al.,2003).In the vibration analysis of a spatial elastica,it is found that there always exists a zero natural frequency, which is attributed to axial symmetry of the cross section(Chen and Fang,2014).*Corresponding author.E-mail address:jschen@.tw(J.-S.Chen).Contents lists available at ScienceDirectEuropean Journal of Mechanics A/Solids journal homep age:/locate/ejmsol/10.1016/j.euromechsol.2014.04.0020997-7538/Ó2014Elsevier Masson SAS.All rights reserved.European Journal of Mechanics A/Solids47(2014)182e193The static and dynamic responses of a planar clamped e clamped elastica are much more well-defined than its spatial counterpart.In static response,the planar clamped e clamped rod under edge thrust will deform only in a plane and eventually contact itself before the two end clamps meet.In vibration analysis,the lowest natural frequency is always greater than zero.The geometry of a noncircular cross section may be characterized by the ratio be-tween the bending stiffnesses along the two principal directions.A spatial elastica with circular cross section and a planar elastica correspond to two extreme cases of a rod with noncircular cross sections,one with stiffness ratio approaching one and the other infinity.Although the two extreme cases have been well studied, the static and dynamic responses of an elastica between these two extreme cases are still not clear.In particular,it is desirable to clarify how the behavior of a spatial elastica with circular cross section reduces to the one of a planar elastica.In this paper,we study the deformation and vibration of a clamped e clamped rod with noncircular cross section.Focus is placed on the effect of the bending stiffness ratio on the natural frequencies of a clamped e clamped spatial elastica.In Section2we present the governing equations of a spatial elsatica with noncir-cular cross section.In Section3we conduct a static analysis and demonstrate the effect of anisotropy on the load-deflection relation of a clamped e clamped rod.It is noted that the spatial rod may be of self-contact or not.In Section4we present a complete vibration analysis addressing these two different cases.Both displacement-and force-driven procedures are considered.The behaviors of the rod during loading and unloading processes are predicted.In Sec-tion5,an experiment on a rod with circular cross section is con-ducted to verify the theoretical predictions.Finally,Section6 summarizes the conclusions.erning equationsWe consider a uniform,inextensible,and unshearable elastic rod with length l,cross section area A,Young’s modulus E,shear modulus G,and mass density per unit volume m.The bending stiffness in the two principal directions of the cross section are I1 and I2,where I1!I2.The polar area moment J can be calculated from J¼I1þI2.The rod is initially straight and stress free.We assume that the rodis compressed by axial force P*B at the right end B and buckles withthe two ends being brought closer by a distance d*B.A space-fixed x*y*z*-coordinate system with origin attached to the left end O is chosen to describe the geometry of the rod.The x*-axis is pointing in the longitudinal axis of the rod before deformation.The inertial orthonormal frame{e x,e y,e z}is associated with the x*y*z*-coordi-nate system.The location of a material point on the neutral axis of the deformed rod is denoted by arc length s*measured from end O.A body-fixed right-handed orthonormal frame{d1,d2,d3}is chosen in such a manner that vector d3is in the direction of the local tangent of the deformed neutral axis.Vectors d1and d2are in the normal cross section of the rod and rotate along with the cross section.Vector d1is along the principal direction with smaller bending stiffness.When the rod is in the unstressed straight state, the frame{d1,d2,d3}coincides with the frame{e x,e y,e z}in such a manner that d3h e x,d1h e y,d2h e z.The vectors d i(s*,t*)(i¼1,2, 3),where t*is time,can be expanded asd is*;t*¼d ixs*;t*e xþd iys*;t*e yþd izs*;t*e zði¼1;2;3Þ(1) It is assumed that the cross section of the rod remains plane andnormal to the neutral axis after deformation.The rotation of the cross section can be defined by the vector d1.The deformed neutral axis is a space curve defined by position vector R*(s*,t*),which can be related to local tangent d3asR*0¼d3(2) The evolution of the frame{d1,d2,d3}along the deformed rod is governed by the vector equation.d0i¼U*Âd iði¼1;2;3Þ(3) ()’in Eqs.(2)e(3)represents the derivative with respect to s*.U* is the generalized strain vector,U*¼k*1d1þk*2d2þs*d3(4) Knowledge of k*1and k*2is equivalent to knowledge of curvature and geometrical torsion of the neutral axis regarded as a space curve.The strain s*measures physical twist,which is independent of the geometrical torsion.The internal force F*(s*,t*)and internal moment M*(s*,t*)can be written asF*¼F*1d1þF*2d2þF*3d3¼F*x e xþF*y e yþF*z e z(5) M*¼M*1d1þM*2d2þM*3d3¼M*x e xþM*y e yþM*z e z(6)F*1and F*2are shear forces and F*3is the axial force.M*1and M*2arebending moments in the directions of d1and d2,respectively.M*3is the twisting moment along the direction of d3.The constitutive equations of the rod can be written asM*1¼EI1k*1;M*2¼EI2k*2;M*3¼GJ s*(7) By extending the formulations in(Coleman et al.,1993)and (Goriely and Tabor,1997)from circular cross section to noncircular one,we can write the dimensionless governing equations of the spatial elastica without self-contact as follows.R0ðs;tÞ¼d3ðs;tÞ(8) F’ðs;tÞ¼€Rðs;tÞ(9) M’ðs;tÞþd3ðs;tÞÂFðs;tÞ¼anhd1ðs;tÞ€d1ðs;tÞiþlhd2ðs;tÞ€d2ðs;tÞio(10) d01ðs;tÞ¼Mðs;tÞÂd1ðs;tÞþ1Àgg½Mðs;tÞ$d3ðs;tÞ½d3ðs;tÞÂd1ðs;tÞ(11) d02ðs;tÞ¼Mðs;tÞÂd2ðs;tÞþ1Àgg½Mðs;tÞ$d3ðs;tÞ½d3ðs;tÞÂd2ðs;tÞ þ1Àll½Mðs;tÞ$d1ðs;tÞ½d1ðs;tÞÂd2ðs;tÞ(12) d03ðs;tÞ¼Mðs;tÞÂd3ðs;tÞþ1Àll½Mðs;tÞ$d1ðs;tÞ½d1ðs;tÞÂd3ðs;tÞ(13)J.Fang,J.-S.Chen/European Journal of Mechanics A/Solids47(2014)182e193183The relations between the dimensionless variables (without asterisks)and the physical ones areðR ;s Þ¼1R *;s *;M ¼M *l2;F ¼F *l 22;U ¼l U *;g ¼GJ EI 2;l ¼I 1I 2;a ¼I 2Al2;u ¼l 2ffiffiffiffiffiffiffim A EI 2s u *;t ¼1l 2ffiffiffiffiffiffiffiEI 2m A s t *(14)u is a dimensionless natural frequency,and t is time.a is theslenderness ratio of the rod.For a circular rod,the stiffness ratiol ¼1.In the case l /N ,the equations can be reduced to governing equations of a planar elastica.Eqs.(8)e (13)can be called the Lagrangian version of the governing equations.s may be called the Lagrangian coordinate of a point on the elastica.These six coupled nonlinear equations can be used to solve for the six vector functions R ,F ,M ,d 1,d 2,and d 3.In the case when the elastica has a self-contact point,the bal-ance of linear momentum Eq.(9)is modi fied toF ’ðs ;t ÞÀD F 1ðt Þ½d ðs Às 1Àh 1ðt ÞÞÀd ðs Às 2Àh 2ðt ÞÞ ¼€Rðs ;t Þ(15)d ( )is the dimensionless Dirac ’s function.s 1and s 2represent thetwo material points C 1and C 2on the neutral axis occupying thesame location in static equilibrium.In other words,R (s 1)¼R (s 2).The functions h 1(t )and h 2(t )represent small movements of the contact points away from the static equilibrium.The solid and dashed lines in Fig.1represent the static con figuration and the oneafter perturbation.C 01and C 02represent the new contact points after perturbation.D F 1(t )is the contact force at the self-contact point.It is noted that while D F 1(t )affects the bending moment,it does not affect Eq.(10).For ease of writing,we expand all vectors in component forms within the {e x ,e y ,e z }frame as followsR ¼ðx ;y ;z Þ(16)d i ¼Àd ix ;d iy ;d izÁði ¼1;2;3Þ(17)F ¼ÀF x ;F y ;F z Á(18)M ¼ÀM x ;M y ;M zÁ(19)3.Static analysisWe first consider the case when the elastica does not contact itself.For static analysis,the time-dependent variables in Eqs.(9)and (10)vanish.One can obtain the static solution by solving Eqs.(8),(11)and (13)for unknowns R (s ),d 1(s ),and d 3(s ).The internal moment M (s )in Eqs.(11)and (13)can be obtained from Eq.(10)asM ðs Þ¼ÀR ðs ÞÂF 0þM 0(20)where M 0and F 0represent the moment and force at s ¼0.It can be found from Eq.(9)that F ¼F 0throughout the elastica.The boundary conditions at s ¼0can be written asR ð0Þ¼ð0;0;0Þ(21)d 1ð0Þ¼ð0;1;0Þ(22)d 3ð0Þ¼ð1;0;0Þ(23)In this paper we consider only the first symmetric buckling mode.It is assumed that the buckled rod is on the xy -plane and is symmetric with respect to the midpoint.This implies the conditionsM y ð0:5Þ¼0(24)d 1z ð0:5Þ¼0(25)d 3y ð0:5Þ¼0(26)z ð0:5Þ¼0(27)The end shortening d B under edge thrust P B can be written asd B ¼1À2x ð0:5Þ(28)Furthermore,the symmetry condition in a free-of-contact deformation results in F y ¼0throughout the elastic.For a prescribed end displacement d B ,a shooting method can be used to solve for the deformation of the rod.In our calculation,we take an elliptic cross section with semi-major and semi-minor axes a and b as an example.By specifying material property G/E ¼5/14and ab 3/l 4¼(1/50)4,the parameters g ,l ,and a can be obtained.After making guesses on five parameters F 0x ,F 0z ,M 0x ,M 0y ,and M 0z ,we can integrate the nine scalar equations in Eqs.(8),(11)and (13)as an initial value problem from s ¼0to 0.5.The nine conditions (21)e (23)are used as initial conditions.The five conditions (24)e (28)are used to check the accuracy of the five guesses.If the result is not satisfactory,a Newton e Raphson algorithm is adopted for a new set of guesses.The end force P B can be calculated as P B ¼ÀF 0x .After finding vectors d 1(s )and d 3(s ),vector d 2(s )can be recovered fromd 2ðs Þ¼d 3ðs ÞÂd 1ðs Þ(29)The solution in the range s ¼0.5to 1and be found from the reversing symmetry conditions after the solutions in the range s ¼0to 0.5are obtainedsuccessfully.Fig.1.The equilibrium con figuration (solid line)and the one after perturbation (dashed line)of a deformation with self-contact.The region near the contact point is magni fied on the right.J.Fang,J.-S.Chen /European Journal of Mechanics A/Solids 47(2014)182e 193184In the case when the deformed rod contacts itself,the solution method has to be modi fied as follows.The force in x -direction and the moment in z -direction in the range from s ¼0to 0.5areF x ¼F 0x þD F 1x H ðs Às 1Þ(30)M z ¼F x y ðs ÞÀF y x ðs ÞþM 0z ÀD F 1x H ðs Às 1Þy s 1(31)where y s 1is the initial guess of y (s 1).H ( )is the Heaviside function.To solve for the self-contact deformation,we make guesses on five parameters F 0x ,M 0z ,s 1,D F 1x ,and y s 1.Since the self-contact defor-mation is planar and symmetric,the “out-of-plane ”variables F 0y ,F 0z ,M 0x ,M 0y ,D F 1y ,and D F 1z can be set to zero.After integrating the nine scalar equations in Eqs.(8),(11)and (13)from s ¼0to 0.5,the five conditions (26),(28),andx ðs 1Þ¼x ð0:5Þ(32)y ðs 1Þ¼y s 1(33)d 3x ðs 1Þ¼0(34)are used to check the accuracy of the five guesses.Fig.2shows the relation between the longitudinal force P B and end displacement d B for the cases when l ¼1(a/b ¼1),1.44(a/b ¼1.2),and 3.24(a/b ¼1.8).All the cross sections with different l have the same moment of inertia I 2.First of all,the straight line A 0e A 1on d B ¼0represents the straight con figuration before buckling.We assume that the elliptic rods first buckle on the xy -plane,i.e.,in the direction with the weakest bending strength.The thick lines represent planar deformations,and the thin lines represent spatial deformations.The planar deformations are the same for all l ,as shown by loci A 1e A 2e A 3e S e A 7e A 9and S e A 4.In the range A 1e A 2e A 3e S the planar deformation is free of self-contact.In the range S e A 4the planar deformation contacts itself at a point with the contact normal on the xy -plane.It ’s impossible for the self-contact deformation to reach d B ¼1,because it requires an in finitely large of P B .In the range S e A 7e A 9the elastica is “almost ”planar with the neutral axis crossing itself on the xy -plane but the physical elastica touching itself on the lateral surface (with contact normal in the z -direction)at the crossing point.Although this con figuration is not precisely planar,we still call it a planar deformation because the neutral axis is on a plane.It is assumed that the contact force in this con figuration can be neglected.In this paper this con figuration is classi fied as planarnon-self-contact deformation.It will be shown later that this deformation is physically possible in an unloading process.It is noted that at A 9when d B ¼1the two clamped ends meet and the elastica becomes the shape of “8”.The edge thrust P B corre-sponding to A 9is 86.2.In this shape the elastica can withstand any amount of end thrust P B greater than 86.2.Spatial deformation exists for all l .The locus emerges from a bifurcation point on locus A 1e A 2e A 3e S e A 7e A 9of planar free-of-contact deformation.The bifurcation point depends on the stiff-ness ratio l .In the case of l ¼1and d B ¼1,the elastica at point A 5becomes a circle with P B ¼0.For l >1,the elastica is a non-planar closed loop similar to a circle when d B ¼1,such as at points A 6and A 8.The con figurations of typical deformations are also depicted in Fig.2.4.Vibration analysisThe load-de flection relations in Fig.2show only the static deformations.In order to predict the behavior of the loaded rod,the stability of these deformations must be determined.The sta-bility of a deformation depends on the loading mechanism,including displacement-and force-driven procedures.In this sec-tion we use vibration method to find the natural frequencies of the loaded rod under these two loading conditions,from which the stability of the elastica can be determined.As demonstrated in Section 3,the elastica may contact itself or may not.The vibration analyses of these two cases are different and will be discussed separately.4.1.A spatial rod without self-contactWe first consider the case when the spatial rod does not contact itself.The static solutions of the buckled rod have been found in previous sections.They are denoted R e (s ),F e (s ),M e (s ),d 1e (s ),d 2e (s ),and d 3e (s ).We superpose small harmonic perturbations onto these static solutions in the formsR ðs ;t Þ¼R e ðs ÞþR d ðs Þsin u t (35)d i ðs ;t Þ¼d ie ðs Þþd id ðs Þsin u t ði ¼1;2;3Þ(36)F ðs ;t Þ¼F e ðs ÞþF d ðs Þsin u t (37)M ðs ;t Þ¼M e ðs ÞþM d ðs Þsin u t(38)After substituting Eqs.(35)e (38)into Eqs.(8)e (13)and ignoring the higher order terms,one can obtain the linearized equationsR 0d ðs Þ¼d 3d ðs Þ(39)F 0d ðs Þ¼Àu 2R d ðs Þ(40)M 0d ðs Þ¼½F e ðs ÞÂd 3d ðs ÞþF d ðs ÞÂd 3e ðs Þ þau 2f½d 1d ðs ÞÂd 1e ðs Þ þl ½d 2d ðs ÞÂd 2e ðs Þ g(41)d 01d ðs Þ¼M e ðs ÞÂd 1d ðs ÞþM d ðs ÞÂd 1e ðs Þþ1ÀggÂf½M e ðs Þ$d 3e ðs Þ ½d 3e ðs ÞÂd 1d ðs Þþd 3d ðs ÞÂd 1e ðs Þ þ½d 3e ðs ÞÂd 1e ðs Þ ½M e ðs Þ$d 3d ðs ÞþM d ðs Þ$d 3e ðs Þ g(42)Fig.2.Relation between longitudinal force P B and end displacement d B for the caseswhen l ¼1,1.44,and 3.24.The thick lines represent the planar deformations on x e y plane,and the thin lines represent spatial deformations,respectively.J.Fang,J.-S.Chen /European Journal of Mechanics A/Solids 47(2014)182e 193185d 02d ðs Þ¼Me ðs ÞÂd 2d ðs ÞþM d ðs ÞÂd 2e ðs Þþ1ÀggÂf½M e ðs Þ$d 3e ðs Þ ½d 3e ðs ÞÂd 2d ðs Þþd 3d ðs ÞÂd 2e ðs Þ þ½d 3e ðs ÞÂd 2e ðs Þ ½M e ðs Þ$d 3d ðs ÞþM d ðs Þ$d 3e ðs Þ gþ1Àl lf½M e ðs Þ$d 1e ðs Þ ½d 1e ðs ÞÂd 2d ðs Þþd 1d ðs ÞÂd 2e ðs Þ ½d 1e ðs ÞÂd 2e ðs Þ ½M e ðs Þ$d 1d ðs ÞþM d ðs Þ$d 1e ðs Þ g(43)d 03d ðs Þ¼Me ðs ÞÂd 3d ðs ÞþM d ðs ÞÂd 3e ðs Þþ1ÀllÂf½M e ðs Þ$d 1e ðs Þ ½d 1e ðs ÞÂd 3d ðs Þþd 1d ðs ÞÂd 3e ðs Þ þ½d 1e ðs ÞÂd 3e ðs Þ ½M e ðs Þ$d 1d ðs ÞþM d ðs Þ$d 1e ðs Þ g(44)Eqs.(39)e (44)are six vector equations which can be used tosolve for the frequency and mode shape of an elliptic rod.The boundary conditions for Eqs.(39)e (44)at s ¼0areR d ð0Þ¼ð0;0;0Þ(45)d id ð0Þ¼ð0;0;0Þði ¼1;2;3Þ(46)If the rod is under displacement-driven procedure with pre-scribed end shortening d B ,the boundary conditions at end s ¼1areR d ð1Þ¼ð0;0;0Þ(47)d id ð1Þ¼ð0;0;0Þði ¼1;2;3Þ(48)In the case when the rod is under force-driven procedure,the first of the three conditions in (47)is replaced byF xd ð1Þ¼0(49)The components of vectors d 1,d 2,and d 3are subject to sixconstraints;they are j d 1j ¼1,j d 2j ¼1,d 1,d 2¼0and d 3¼d 1Âd 2.Among them there are only three independent conditions in Eq.(48).In this paper we choosed 1xd ð1Þ¼d 2yd ð1Þ¼d 3zd ð1Þ¼0(50)The eighteen linearized scalar differential Eqs.(39)e (44)admitnontrivial solutions only when u is equal to an eigenvalue of the system of equations.In the solution method we first set F xd 0¼1.After guessing 6variables F yd 0,F zd 0,M xd 0,M yd 0,M zd 0,and u 2,one can integrate the differential Eqs.(39)e (44)from s ¼0to s ¼1.The assigned F xd 0¼1,and guessed F yd 0,F zd 0,M xd 0,M yd 0,M zd 0,together with boundary conditions (45)and (46)provide the needed initial conditions.The 6conditions in (47)and (50)at s ¼1are used to check the accuracy of the 6guesses.4.2.A spatial rod with self-contactWe next consider the case when the spatial rod contacts itself at an intermediate point with the condition R (s 1)¼R (s 2).During vi-bration,the contact points may change from s 1and s 2to s 1þh 1and s 2þh 2,respectively,as de fined in Fig.1.We first consider the vi-bration in the range from s ¼0to s 2.The function F (s ,t )in Eq.(37)can be replaced byF ðs ;t Þ¼F e ðs Þþf D F 1½H ðs Às 1Àh 1ÞÀH ðs Às 1Þ g þ½F d ðs Àh 1ÞþD F 1d H ðs Às 1Àh 1Þ sin u t(51)Where F e (s )¼F 0þD F 1H (s Às 1).By substituting F e (s )into Eq.(51),onecan obtainF ðs ;t Þ¼F e ðs Àh 1Þþ½F d ðs Àh 1ÞþD F 1d H ðs Às 1Àh 1Þ sin u t(52)After de fining a new variable31¼s Àh 1(53)Eq.(52)can be rewritten asb F ð31;t Þ¼F e ð31Þþh b F d ð31ÞþD F 1d H ð31Às 1Þisin u t(54)where b F ð31;t Þ¼F ð31þh 1;t Þ.It is noted that b F and F are two different functions,and F e (31)can be obtained from static analysis.Similarly,the other perturbed vector functions may be written asb R ð31;t Þ¼R e ð31Þþb R d ð31Þsin u t (55)c M ð31;t Þ¼M e ð31ÞþcM d ð31Þsin u t (56)b d i ð31;t Þ¼d ie ð31Þþb d id ð31Þsin u t ði ¼1;2;3Þ(57)The parameter 31in Eqs.(54)e (57)may be called Eulerian co-ordinate of a point on the elastica.By noting that v 31/v s ¼1,theLagrangian version of the governing Eqs.(8)e (13)can be trans-formed to the Eulerian version asc R 0ð31;t Þ¼bd 3ð31;t Þ(58)b F ’ð31;t ÞÀD F 1ðt Þd ð31Às 1Þ¼€b R ð31;t Þ(59)c M ’ð31;t Þþbd 3ð31;t ÞÂb F ð31;t Þ¼a nh b d 1ð31;t Þ€b d 1ð31;t Þi þl h b d 2ð31;t Þ€b d 2ð31;t Þio (60)b d 01ð31;t Þ¼c M ð31;t ÞÂbd 1ð31;t Þþ 1Àg g h c M ð31;t Þ$b d 3ð31;t Þi Âhb d 3ð31;t ÞÂb d 1ð31;t Þi (61)b d 02ð31;t Þ¼c M ð31;t ÞÂbd 2ð31;t Þþ 1Àg gh c M ð31;t Þ$b d 3ð31;t Þi Âhb d 3ð31;t ÞÂb d 2ð31;t Þi þ1Àl lÂhc M ð31;t Þ$bd 1ð31;t Þih b d 1ð31;t ÞÂb d 2ð31;t Þi (62)b d 03ð31;t Þ¼c M ð31;t ÞÂb d 3ð31;t Þþ1Àl l h c M ð31;t Þ$b d 1ð31;t Þi Âhb d 1ð31;t ÞÂb d 3ð31;t Þi (63)After substituting Eqs.(54)e (57),together with the relationsD F 1ðt Þ¼D F 1e þD F 1d sin u t(64)J.Fang,J.-S.Chen /European Journal of Mechanics A/Solids 47(2014)182e 193186。