windows perform监控计数器简介
- 格式:doc
- 大小:47.50 KB
- 文档页数:11

以跟踪IIS应用程序中的数据库连接数为例运行> perfmance 打开性能计数器管理界面。
创建收集器集
给收集器集取名字,设置成手动。
选择要跟踪“性能计数器”
添加计数器。
在.NET Data Provider for Oracle或.NET Data Provider for SqlServer中选择计数器:NumberOfPooledConnections
为了避免IIS发生reset 后,需要重新增加计数器,这里选择所有实例。
最后确定。
同时,你可以根据自己的需要添加CPU 内存或者磁盘等的相关监控。
设置跟踪的停止时间,我一般设置跟踪一周。
也可以根据需要调整。
对于重现周期比较长的问题,比如月度等,可以设置总持续周期为5,如下图
右键开始跟踪即可。
跟踪状态
从指定的路径可以获取跟踪文件分析。
应用服务器需要关注的计数器
数据库服务器需要关注的计数器。

performance monitor使用方式Performance Monitor(性能监视器)是一款Windows操作系统自带的工具,用于监视和分析计算机系统的性能。
它可以帮助用户实时监控系统资源使用情况,定位系统性能问题,并进行性能优化。
本文将介绍Performance Monitor的使用方式,包括监视对象的选择、计数器的配置、性能数据的收集和分析等。
1.启动Performance MonitorPerformance Monitor可以通过多种方式启动,以下是一些常见的启动方式:-在Windows任务栏的搜索框中输入"perfmon",并点击打开Performance Monitor。
-按下Windows键+R,输入"perfmon"并点击确定。
-在Windows管理工具中找到Performance Monitor并点击打开。
2.监视对象的选择一旦打开Performance Monitor,就可以开始选择要监视的对象。
监视对象是指需要监视其性能的计算机组件或应用程序。
Performance Monitor提供了许多预定义的监视对象,如处理器、内存、磁盘、网络等。
可以在左侧的“性能监视器”窗格中的“监视”选项卡中选择要监视的对象。
选择对象后,相关计数器将显示在“显示计数器”窗格中。
3.计数器的配置计数器是Performance Monitor用于监测监视对象性能的单位。
每个监视对象都有一系列计数器可以选择。
在“显示计数器”窗格中,可以通过点击“添加”按钮将计数器添加到监视器。
计数器可以按照某个特定的类别选择,也可以根据关键字搜索。
可以选择多个计数器来监视多个性能方面。
4.性能数据的收集当选择完要监视的对象和计数器后,就可以开始收集性能数据了。
在Performance Monitor窗口的下方,有一个“性能计数器日志”选项卡。
点击该选项卡后,可以看到实时的性能数据以图形和表格的形式显示出来。
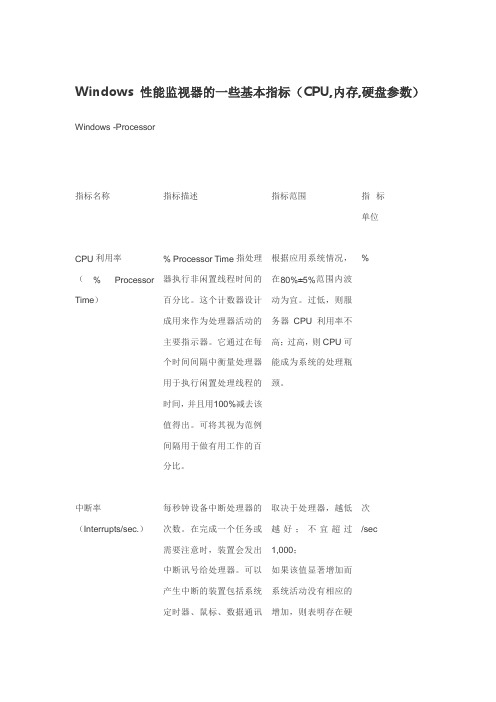
Windows 性能监视器的一些基本指标(CPU,内存,硬盘参数)Windows -Processor指标名称指标描述指标范围指标单位CPU利用率(% Processor Time)% Processor Time指处理器执行非闲置线程时间的百分比。
这个计数器设计成用来作为处理器活动的主要指示器。
它通过在每个时间间隔中衡量处理器用于执行闲置处理线程的时间,并且用100%减去该值得出。
可将其视为范例间隔用于做有用工作的百分比。
根据应用系统情况,在80%±5%范围内波动为宜。
过低,则服务器CPU利用率不高;过高,则CPU可能成为系统的处理瓶颈。
%中断率(Interrupts/sec.)每秒钟设备中断处理器的次数。
在完成一个任务或需要注意时,装置会发出中断讯号给处理器。
可以产生中断的装置包括系统定时器、鼠标、数据通讯取决于处理器,越低越好;不宜超过1,000;如果该值显著增加而系统活动没有相应的增加,则表明存在硬次/sec联机、网络卡以及其它的外部装置。
在中断过程中,一般的执行绪执行将被暂停,而且一个中断可以使处理器切换到另一个具有较高优先等级的执行绪。
频率中断是频繁和周期性的,并且中断动作在背景执行。
件问题,需要检查引起中断的网络适配器、磁盘或其他硬件。
系统调用率System Call/sec. 指运行在计算机上的所有处理器调用操作系统服务例行程序的综合速率。
这些例行程序执行所有在计算机上的如安排和同步活动等基本的程序,并提供对非图形设备、内存管理和名称空间管理的访问。
如果Interrupts/sec大于SystemCalls/sec.,则系统中某一硬件设备产生过多的中断。
次/secProcessor Queue Length 处理器队列的线程数量。
此计数器只显示就绪线程,而不是正在运行的线程。
如果处理器队列中总是有两个以上的线程通常表示处理器堵塞。
进程切换率Context Switches/sec 指计算机上的所有处理器全都从一个线程转换到另一个线程的综合速率。

最近研究性能测试工具中发现这些所谓的性能测试工具的数据、全部来至windows操作系统提供的数据、然后通过API提供给性能测试工具、性能测试工具在用一种比较直观的图形展示出来。
也就是说不部分情况下如果把你没有弄明白性能监视器中数据得意义,那么性能测试工具的那些图表对你的意义也就没有多大的用处。
下面我整理了一部分windows中性能监视器中比较常用的性能计数器。
这里整理的比较多的内容:处理器对象、系统对象、逻辑磁盘对象、物理磁盘对象、内存。
这些性能计数器我们经常在使用的过程中都会用得到,所以这篇文章大部分内容是这些的。
▪ 1. 处理器对象(Processor Object)一条经验规则是不要使你所监控的每个处理器的C P U使用率高于9 0%。
峰值超过9 0%是可以接受的,但平均使用率超过9 0%则是应该避免的。
• 处理器时间百分比(%Processor Time)处理器执行一个非空闲线程的时间百分比。
用%1 0 0减去处理器空闲的总时间得出这个值。
这是整个系统的C P U使用的一个好的指示器。
• 特权时间百分比(%Privileged Time) 处理器用于在特权模式下(即,执行操作系统功能和运行驱动器,如I / O )工作时间的百分比。
这个时间包括C P U (或C P U )用于维护中断和延迟过程调用( D P C )的时间。
• 用户时间百分比(%User Time) 处理器用于在用户模式工作的时间百分比。
这种类型的工作是由应用产生的。
通常,希望极大化用户时间百分比的值,极小化特权时间百分比的值。
• 中断时间百分比(%Interrupt Time) CPU忙于维护硬件中断的时间百分比。
系统中的许多硬件部件,如鼠标、网络接口卡或磁盘控制器,都可以发出处理器中断。
你可以将中断看作为Windows NT正常操作的一部分发生。
• 中断数/秒(Interrupts/sec) 处理器每秒接收并处理的硬件中断的数量。

performancecounter 参数PerformanceCounter是.NET Framework中用于性能计数的类,它允许开发者监视和测量计算机硬件和应用程序的性能。
PerformanceCounter类位于System.Diagnostics命名空间下。
使用PerformanceCounter,可以获取和设置计数器的值,以便了解应用程序或系统的运行状态。
PerformanceCounter的参数主要包括以下几个:CategoryName:这是性能计数器的类别名称。
性能计数器被组织成类别,每个类别都包含一组相关的计数器。
例如,处理器类别可能包含“% Processor Time”计数器,用于显示处理器的利用率。
CounterName:这是具体计数器的名称。
在一个类别中,可以有多个计数器,每个计数器都测量不同的东西。
例如,在内存类别中,可能有“Available MBytes”计数器来显示可用内存的数量。
InstanceName:这是性能计数器的实例名称。
一些计数器可能有多个实例,每个实例都代表一个不同的对象或资源。
例如,进程类别中的每个进程都可能有其自己的实例。
ReadOnly:这是一个布尔值,指示计数器是只读的还是可写的。
如果ReadOnly为true,则只能获取计数器的值,不能设置它。
如果ReadOnly为false,则可以获取和设置计数器的值。
MachineName:这是要监视的计算机的名称。
如果未指定此参数,则默认监视本地计算机。
使用PerformanceCounter时,通常需要创建一个PerformanceCounter实例,然后调用它的NextValue()方法来获取计数器的当前值。
此外,还可以使用它的RawValue属性来获取计数器的原始值,或者使用它的Value属性来获取格式化后的值。
总之,PerformanceCounter的参数允许开发者精确地指定要监视的性能计数器,从而获取有关计算机硬件和应用程序性能的有用信息。

Windows操作系统的性能监控工具――Perfmon一、概述Perfmon(Performance Monitor)是Windows自带的的性能监控工具,这个工具可监控包括CPU、内存、网络、进程、磁盘等多个对象的上百个指标。
Perfmon提供了图表化的系统性能实时监视器、性能日志和警报管理,系统的性能日志可定义为二进制文件、文本文件、SQLSERVER表记录等方式,可以很方便地使用第三方工具进行性能分析。
二、常用的性能指标系统的整体性能由许多因素决定,例如CPU利用率、CPU队列长度、磁盘空间和I/O、内存使用情况、网络流量等等。
对于实时性要求较高的系统而言,对系统关键性指标的有效监控和管理是保证系统高可用性的重要手段,因此,务必制定出明确的系统性能策略规划,并对这些性能指标进行有效的实时监控。
当关键性能指标严重偏离或者系统发生故障时,应该采取有效手段来准确定位问题引发的原因,并通过调优系统配置或改进应用程序等手段来有效提高系统的可用性。
(一)Perfmon的监控对象Perfmon提供了比较全面的系统性能指标,并且能够根据性能管理的要求订制日志内容、制定关键指标偏离时的警报措施。
《表一》列出了Perfmon可以监控的性能对象,每一个性能对象项下包含多个性能指标计数器。
(二)常用的Perfmon监控对象与指标以上列出的性能对象总共有上百个性能指标,我们关注一个系统的性能时,不可能关注这么多指标,有些对象对实际的应用系统影响并不大。
但对一个Windows操作系统来说,CPU、Memmory、Disk 和Network等关键对象是性能监控中必不可少的项。
《表二》列举了最常用的性能对象的重要指标。
(三)Perfmon对进程的监控指标一般说来,服务器上都布署了一个或多个应用程序,这些应用程序在运行期间经常体现为若干个应用进程。
为了便于监控应用程序的运行情况,在程序设计过程中一般都会同时布署应用系统的监控程序。
windows服务器性能监控工具、方法及关键指标推荐使用windows自带的“性能监视器”(老版本的windows叫性能计数器)来监控服务器的性能。
打开控制面板内的管理工具,在管理工具内打开性能监视器,出现如下界面(各版本的window操作系统的性能监视器的界面可能略有不同):点击中上部的绿色加号图标,可以添加一项监视内容,添加界面如下图所示,可以在左侧选中需要监控的内容,点击添加,即可监控该内容。
选中下方的“显示描述”复选框,可以查看被监控内容的具体描述信息。
关键指标CPU监控Processor Time地址\processor(_Total)\% Idle Tile描述% Processor Time 指处理器用来执行非闲置线程时间的百分比。
计算方法是,度量处理器用来执行空闲线程的时间,然后用 100% 减去该值。
(每个处理器有一个空闲线程,该线程在没有其他线程可以运行时消耗周期)。
此计数器是处理器活动的主要指示器,显示在采样间隔期间所观察的繁忙时间平均百分比。
应注意,对处理器是否空闲的计算是在系统时钟的内部采样间隔期间(10ms)执行的。
考虑到现在的处理器速度非常快,因此,在处理器可能会用大量时间为系统时钟采样间隔之间的线程提供服务时,% Processor Time 会低估处理器利用率。
当恰好进行采样后即向计时器发出信号时,更可能对应用程序做出不准确地度量,基于工作负荷的计时器应用程序是一个这样的示例。
建议指标该监控内容不宜超过80%说明过高说明CPU资源即将耗尽,应增加CPU资源或实施分布式策略内存监控Available Mbytes地址\Memory\Available MBytes描述Available MBytes 指能立刻分配给一个进程或系统使用的物理内存数量,以 MB 为单位表示。
它等于分配给待机(缓存的)、空闲和零分页列表内存的总和。
建议指标该值不宜低于400一般要保留10%的可用内存,假设系统有8G内存,则该值最好不要低于800说明过高说明内存资源即将耗尽,应考虑增加内存Pages/sec地址\Memory\Pages/sec描述Pages/sec 是指为解决硬页错误从磁盘读取或写入磁盘的速度。
Windows⾃带性能监控⼯具Perfmon使⽤介绍⼀、Perfmon简介 Perfmon(Performance Monitor)是⼀款Windows⾃带的性能监控⼯具,提供了图表化的系统性能实时监视器、性能⽇志和警报管理。
通过添加性能计数器(Performance Counter)可以实现对CPU、内存、⽹络、磁盘、进程等多类对象的上百个指标的监控。
其中,性能⽇志可定义输出格式为⼆进制⽂件、⽂本⽂件、SQLSERVER记录等,以⽅便后续使⽤第三⽅⼯具进⾏分析。
⼆、Perfmon的启⽤和监控设置 Perfmon使⽤⽅法:2.1 Windows开始中输⼊perfmon后回车,即可打开perfmon.exe2.2 点击性能监视器;2.3 在右窗格中单击右键,然后单击“添加计数器”;或点击监控图上⽅的"+"也可以打开添加计数器的窗⼝;2.4 在性能对象列表中,选择所需的性能指标计数器类别,以在Perfmon.exe中显⽰对应指标的监控图形,然后单击【添加】-->【确认】2.5 在计数器勾选区域: 选中监控图底部的某个计数器,右键【属性】,可编辑该计数器的线条颜⾊、宽度等样式2.6 通过切换点击不同的计数器类别,可实时观察到所统计的【最新值、平均值、最⼩值、最⼤值、持续时间】2.7 在监控图区域右键【属性】,可设置采样的持续时间(默认100s)、每间隔多少时间采样⼀次右键【图形另存为】,可将本地性能监控的采样图保存到本地右键【清除】,可将当前监控上的采样图清空,⽽后从左⾄右继续开始新的采样图三、性能分析⽅法1.内存分析⽅法内存分析:⽤于判断系统有⽆内存瓶颈,是否需要通过增加内存等⼿段提⾼系统性能表现内存分析的主要⽅法和步骤:(1)⾸先查看Memory:% Commitued Bytes in Use指标如果该指标数值⽐较⼤,系统可能出现了内存⽅⾯的问题,需要继续下⾯步骤进⼀步分析。
windows系统评估工具Windows 系统评估工具是一种用于评估 Windows 操作系统性能和稳定性的工具。
它可以提供关于系统硬件、软件和配置的详细信息,以及性能和安全方面的建议。
下面将介绍一些常用的 Windows 系统评估工具。
1. Windows Experience Index (Windows 经验指数):是Windows 操作系统自带的一个评估工具,它对系统的处理器、内存、图形、游戏图形和主硬盘进行评估,从而为用户提供一个整体性能得分。
通过这个得分,用户可以了解自己的系统在哪些方面需要改进。
2. Performance Monitor(性能监视器):是 Windows 操作系统中的一个工具,可以监视和记录系统的各项性能指标,例如CPU 使用率、内存使用率、磁盘读写速度等。
通过性能监视器,用户可以实时了解系统资源的使用情况,并据此做出优化调整。
3. Windows System Assessment Tool(Windows 系统评估工具):也是 Windows 操作系统自带的评估工具,它可以对系统硬件和软件进行全面评估,并生成一份系统评估报告。
该报告包括处理器、内存、图形、硬盘等方面的性能数据,以及建议的优化措施。
用户可以根据报告中的数据和建议来改进系统的性能和稳定性。
4. CrystalDiskMark:是一款用于测试硬盘性能的工具,它可以评估硬盘的读写速度、随机访问性能等。
通过运行CrystalDiskMark,用户可以了解自己的硬盘在不同场景下的性能表现,并据此选择适合自己需求的硬盘。
5. PassMark PerformanceTest:是一款综合性能评测工具,可以对整个系统进行评估。
它可以测试处理器、内存、图形、硬盘等硬件性能,以及计算机的整体性能得分。
通过运行PerformanceTest,用户可以了解自己的系统在不同方面的性能表现,并对性能较差的方面进行优化。
总之,Windows 系统评估工具可以帮助用户全面了解系统的性能和稳定性,并提供相应的优化建议。
操作系统的性能监控与分析工具所有的计算机系统都需要一个可靠的性能监控和分析工具,以保证系统运行的稳定性和高效性。
在操作系统中,性能监控和分析工具对于检测系统性能瓶颈、优化系统资源分配以及及时发现和解决系统故障非常重要。
本文将介绍几种主要的操作系统性能监控与分析工具,包括系统监视器、性能分析器和追踪工具等。
一、系统监视器系统监视器是一种常用的性能监控工具,用于实时监视和记录系统资源的使用情况。
系统监视器可以监控CPU的使用率、内存的使用情况、磁盘IO、网络流量等关键指标,帮助用户全面了解系统的运行状况。
Windows操作系统自带的任务管理器就是一种简单的系统监视器。
它提供了实时的CPU、内存和磁盘使用情况的图表展示,以及进程和服务的详细信息。
在Linux系统中,常用的系统监视器包括top、htop和nmon等工具,它们提供了更丰富的性能指标和定制化的显示选项。
二、性能分析器性能分析器是一种用于深入分析和诊断系统性能问题的工具。
它可以帮助用户找到系统性能瓶颈,并提供优化建议。
性能分析器通常可以分析CPU的使用情况、内存泄漏、磁盘IO性能、网络延迟等问题。
在Windows系统中,常用的性能分析器包括Windows Performance Monitor和Windows Performance Toolkit。
它们可以生成系统的性能报告,包括CPU利用率、内存使用情况、进程信息等。
对于Linux系统,perf和gprof是常用的性能分析工具,它们可以分析CPU使用情况、函数调用关系等。
三、追踪工具追踪工具是一种用于跟踪和记录系统运行轨迹的工具。
它可以捕获和分析系统中的各种事件,包括进程调度、中断处理、系统调用等。
通过分析这些事件的顺序和时间戳,可以帮助用户定位系统的性能瓶颈和故障。
在Windows系统中,Event Tracing for Windows(ETW)是一种常用的追踪工具,它可以跟踪和记录系统的各种事件。
Memory Object% Committed Bytes In UseShows the ratio of Memory\ Committed Bytes to the Memory\ Commit Limit. Committed memory is physical memory in use for which space has been reserved in the paging file so that it can be written to disk. The commit limit is determined by the size of the paging file. If the paging file is enlarged, the commit limit increases, and the ratio is reduced.Available BytesShows the amount of physical memory, in bytes, available to processes running on the computer. It is calculated by adding the amount of space on the zeroed, free, and standby memory lists. Free memory is ready for use; zeroed memory consists of pages of memory filled with zeros to prevent later processes from seeing data used by a previous process; standby memory is memory that has been removed from a process's working set (its physical memory) en route to disk but is still available to be recalled.Available KBytesShows the amount of memory available to processes running on the computer, in kilobytes rather than bytes, as reported by Memory\Available Bytes.Available MBytesShows the amount of memory available to processes running on the computer, in megabytes rather than bytes, as reported by Memory\Available Bytes.Cache BytesShows the sum of the values of System Cache Resident Bytes, System Driver Resident Bytes, System Code Resident Bytes, and Pool Paged Resident Bytes.Cache Bytes PeakShows the maximum number of bytes used by the file system cache since the system was last restarted. This might be larger than the current size of the cache.Cache Faults/secShows the rate at which faults occur when a page sought in the file system cache is not found and must be retrieved from elsewhere in memory (a soft fault) or from disk (a hard fault). This counter shows the number of faults, without regard for the number of pages faulted in each operation.Commit LimitShows the amount of virtual memory, in bytes, that can be committed without having to extend the paging file(s). Committed memory is physical memory which has space reserved on the disk paging files. There can be one or more paging files on each physical drive. If the paging file(s) are expanded, this limit increases accordingly.Committed BytesShows the amount of committed virtual memory, in bytes.Demand Zero Faults/secShows the rate at which a zeroed page is required to satisfy the fault. Zeroed pages, pages emptied of previously stored data and filled with zeros, are security features in Windows 2000 that prevent processes from seeing data stored by earlier processes that used the memory space. Windows 2000 maintains a list of zeroed pages to accelerate this process. This counter shows numbers of faults, without regard to the numbers of pages retrieved to satisfy the fault.Free _AND_ Zero Page List BytesShows the amount of physical memory, in bytes, that is assigned to the free and zero page lists. This memory does not contain cached data. It is immediately available for allocation to a process or for system use. For a full explanation of the memory manager, refer to MSDN and/or the System Performance and Troubleshooting Guide chapter in the Windows Server 2003 Resource Kit.Free System Page Table EntriesShows the number of page table entries not currently in use by the system.Modified Page List BytesShows the amount of physical memory, in bytes, that is assigned to the modified page list. This memory contains cached data and code that is not actively in use by processes, the system and the system cache. This memory needs to be written out before it will be available for allocation to a process or for system use. For a full explanation of the memory manager, refer to MSDN and/or the System Performance and Troubleshooting Guide chapter in the Windows Server 2003 Resource Kit.Page Faults/secShows the average number of pages faulted per second. It is measured in numbers of pages faulted; because only one page is faulted in each fault operation, this is also equal to the number of page fault operations. This counter includes both hard faults (those that require disk access) and soft faults (where the faulted page is found elsewhere in physical memory). Most processors can handle large numbers of soft faults without significant consequence. However, hard faults, which require disk access, can cause delays.Page Reads/secShows the rate at which the disk is read to resolve hard page faults. It shows numbers of read operations, without regard to the number of pages retrieved in each operation. Hard page faults occur when a process references a page in virtual memory that is not in its working set or elsewhere in physical memory, and must be retrieved from disk. This counter is a primary indicator of the kinds of faults that cause system-wide delays. It includes read operations to satisfy faults in the file system cache (usually requested by applications) and in noncached mapped memory files. Compare the value of Page Reads/sec to the value of Pages Input/sec to find an average of how many pages were read during each read operation.Page Writes/secShows the rate at which pages are written to disk to free up space in physical memory. Pages are written to disk only if they are changed while in physical memory, so they are likely to hold data, not code. This counter shows write operations, without regard to the number of pages written in each operation.Pages Input/secShows the rate at which pages are read from disk to resolve hard page faults. Hard page faults occur when a process refers to a page in virtual memory that is not in its working set or elsewhere in physical memory, and must be retrieved from disk. When a page is faulted, the system tries to read multiple contiguous pages into memory to maximize the benefit of the read operation. Compare Pages Input/sec to Page Reads/sec to find the average number of pages read into memory during each read operationPages Output/secShows the rate at which pages are written to disk to free up space in physical memory. A high rate of pages output might indicate a memory shortage. Windows 2000 writes more pages back to disk to free up space when physical memory is in short supply. This counter shows numbers of pages, and can be compared to other counts of pages without conversion.Pages/secShows the rate at which pages are read from or written to disk to resolve hard page faults. This counter is a primary indicator of the kinds of faults that cause system-wide delays. It is the sum of Memory\ Pages Input/sec and Memory\ Pages Output/sec. It is counted in numbers of pages, so it can be compared to other counts of pages, such as Memory\ Page Faults/sec, without conversion. It includes pages retrieved to satisfy faults in the file system cache (usually requested by applications) and noncached mapped memory files.Pool Nonpaged AllocsShows the number of calls to allocate space in the nonpaged pool. It is measured in numbers of calls to allocate space, regardless of the amount of space allocated in each call.Pool Nonpaged BytesShows the size, in bytes, of the nonpaged pool. Memory\ Pool Nonpaged Bytes is calculated differently than Process\ Pool Nonpaged Bytes, so it might not equal Process(_Total )\ Pool Nonpaged Bytes.Pool Paged AllocsShows the number of calls to allocate space in the paged pool. It is measured in numbers of calls to allocate space, regardless of the amount of space allocated in each call.Pool Paged BytesShows the size, in bytes, of the paged pool. Memory\ Pool Paged Bytes is calculated differently than Process\ Pool Paged Bytes, so it might not equal Process(_Total )\ Pool Paged Bytes.Pool Paged Resident BytesShows the current size, in bytes, of the paged pool. Space used by the paged and nonpaged pools is taken from physical memory, so a pool that is too large denies memory space to processes.Standby Cache Core BytesShows the amount of physical memory, in bytes, that is assigned to the core standby cache page lists. This memory contains cached data and code that is not actively in use by processes, the system and the system cache. It is immediately available for allocation to a process or for system use. If the system runs out of available free and zero memory, memory on lower priority standby cache page lists will be repurposed before memory on higher priority standby cache page lists. For a full explanation of the memory manager, refer to MSDN and/or the System Performance and Troubleshooting Guide chapter in the Windows Server 2003 Resource Kit.Standby Cache Normal Priority BytesShows the amount of physical memory, in bytes, that is assigned to the normal priority standby cache page lists. This memory contains cached data and code that is not actively in use by processes, the system and the system cache. It is immediately available for allocation to a process or for system use. If the system runs out of available free and zero memory, memory on lower priority standby cache page lists will be repurposed before memory on higher priority standby cache page lists. For a full explanation of the memory manager, refer to MSDN and/or the System Performance and Troubleshooting Guide chapter in the Windows Server 2003 Resource Kit.Standby Cache Reserve BytesShows the amount of physical memory, in bytes, that is assigned to the reserve standby cache page lists. This memory contains cached data and code that is not actively in use by processes, the system and the system cache. It is immediately available for allocation to a process or for system use. If the system runs out of available free and zero memory, memory on lower priority standby cache page lists will be repurposed before memory on higher priority standby cache page lists. For a full explanation of the memory manager, refer to MSDN and/or the System Performance and Troubleshooting Guide chapter in the Windows Server 2003 Resource Kit.System Cache Resident BytesShows the size, in bytes, of pageable operating system code in the file system cache. This value includes only current physical pages and does not include any virtual memory pages not currently resident. It does not equal the System Cache value shown in Task Manager. As a result, this value may be smaller than the actual amount of virtual memory in use by the file system cache. This value is a component of Memory\ System Code Resident Bytes which represents all pageable operating system code that is currently in physical memory.System Code Resident BytesShows the size, in bytes, of operating system code currently in physical memory that can be written to disk when not in use. This value is a component of Memory\ System Code Total Bytes, which also includes operating system code on disk. Memory\ System Code Resident Bytes (and Memory\System Code Total Bytes) does not include code that must remain in physical memory and cannot be written to disk.System Code Total BytesShows the size, in bytes, of pageable operating system code currently in virtual memory. It is a measure of the amount of physical memory being used by the operating system that can be written to disk when not in use. This value is calculated by adding the bytes in Ntoskrnl.exe, Hal.dll, the boot drivers, and file systems loaded by Ntldr/osloader. This counter does not include code that must remain in physical memory and cannot be written to disk.System Driver Resident BytesShows the size, in bytes, of pageable physical memory being used by device drivers. It is the working set (physical memory area) of the drivers. This value is a component of Memory\ System Driver Total Bytes, which also includes driver memory that has been written to disk. Neither Memory\ System Driver Resident Bytes nor Memory\ System Driver Total Bytes includes memory that cannot be written to disk.System Driver Total BytesShows the size, in bytes, of pageable virtual memory currently being used by device drivers. Pageable memory can be written to disk when it is not being used. It includes physical memory (Memory\ System Driver Resident Bytes) and code and data written to disk. It is a component of Memory\ System Code Total Bytes.Transition Faults/secShows the rate at which page faults are resolved by recovering pages that were being used by another process sharing the page, or were on the modified page list or the standby list, or were being written to disk at the time of the page fault. The pages were recovered without additional disk activity. Transition faults are counted in numbers of faults; because only one page is faulted in each operation, it is also equal to the number of pages faulted.Transition Pages RePurposed/secShows the rate at which the number of transition cache pages were reused for a different purpose. These pages would have otherwise remained in the page cache to provide a (fast) soft fault (instead of retrieving it from backing store) in the event the page was accessed in the future. Note these pages can contain private or sharable memory.Write Copies/secShows the rate at which page faults are caused by attempts to write that have been satisfied by copying the page from elsewhere in physical memory. This is an economical way of sharing data since pages are only copied when they are written to; otherwise, the page is shared. This counter shows the number of copies, without regard to the number of pages copied in each operationNetwork Interface ObjectBytes Received/secShows the rate at which bytes are received over each network adapter. The counted bytes include framing characters. Bytes Received/sec is a subset of Network Interface\Bytes Total/sec.Bytes Sent/secShows the rate at which bytes are sent over each network adapter. The counted bytes include framing characters. Bytes Sent/sec is a subset of Network Interface\Bytes Total/sec.Packets Received/secShows the rate at which packets are received on the network interface.Packets Sent/secShows the rate at which packets are sent on the network interface.PhysicalDisk ObjectThe Windows data adapter collects a set of aggregate metrics for all disks on a system and a set for each disk. The object instances are:· _Total· disk% Disk Read TimeShows the percentage of time that the selected disk drive is busy servicing read requests.% Disk TimeShows the percentage of elapsed time that the selected disk drive is busy servicing read or write requests.% Disk Write TimeShows the percentage of elapsed time that the selected disk drive is busy servicing write requests.% Idle TimeShows the percentage of time that the disk was idle during the sample interval.Avg. Disk Bytes/ReadShows the average number of bytes transferred from the disk during read operations.Avg. Disk Bytes/TransferShows the average number of bytes transferred to or from the disk during write or read operations.Avg. Disk Bytes/WriteShows the average number of bytes transferred to the disk during write operations.Avg. Disk Queue LengthShows the average number of both read and write requests that were queued for the selected disk during the sample interval.Avg. Disk Read Queue LengthShows the average number of read requests that were queued for the selected disk during the sample interval.Avg. Disk sec/ReadShows the average time, in seconds, of a read of data from the disk.Avg. Disk sec/TransferShows the average time, in seconds, of a disk transfer.Avg. Disk sec/WriteShows the average time, in seconds, of a write of data to the disk.Avg. Disk Write Queue LengthShows the average number of write requests that were queued for the selected disk during the sample interval.Current Disk Queue LengthShows the number of requests that are outstanding on the disk at the time that the performance data is collected. It includes requests in service at the time of the collection. This is a snapshot, notan average over the time interval. It includes requests in service at the time of the collection. Multispindle disk devices can have multiple requests active at one time, but other c oncurrent requests are awaiting service. This counter might reflect a transitory high or low queue length, but if there is a sustained load on the disk drive, it is likely that this is consistently high. Requests experience delays proportional to the length of this queue minus the number of spindles on the disks. This difference should average less than two.Disk Bytes/secShows the rate at which bytes are transferred to or from the disk during write or read operations.Disk Read Bytes/secShows the rate at which bytes are transferred from the disk during read operations.Disk Reads/secShows the rate of read operations on the disk.Disk Transfers/secShows the rate of read and write operations on the disk.Disk Write Bytes/secShows the rate at which bytes are transferred to the disk during write operations.Disk Writes/secShows the rate of write operations on the disk.Split IO/SecShows the rate at which that I/O requests to the disk were split into multiple requests. A split I/O may result from requesting data in a size that is too large to fit into a single I/O or that the disk is fragmented on single-disk systems.Processor Object·% DPC Time% DPC Time is the percentage of time that the processor spent receiving and servicing deferred procedure calls (DPCs) during the sample interval. (DPCs are interrupts that run at a lower priority than standard interrupts.) % DPC Time is a component of % Privileged Time because DPCs are executed in privileged mode. They are counted separately and are not a component of the interrupt counters.% Interrupt Time% Interrupt Time is the percentage of time the processor spent receiving and servicing hardware interrupts during the sample interval. This value is an indirect indicator of the activity of devices that generate interrupts, such as the system clock, the mouse, disk drivers, data communication lines, network interface cards and other peripheral devices. These devices normally interrupt the processor when they have completed a task or require attention. Normal thread execution is suspended during interrupts. Most system clocks interrupt the processor every 10 milliseconds, creating a background of interrupt activity.% Processor Time% Processor Time is the percentage of elapsed time that all of the threads of this process used the processor to execute instructions. An instruction is the basic unit of execution in a computer, a thread is the object that executes instructions, and a process is the object created when a program is run. Code executed to handle some hardware interrupts and trap conditions are included in this count.Interrupts/secInterrupts/sec is the average number of hardware interrupts the processor is receiving and servicing in each second. It does not include DPCs, which are counted separately. This value is an indirectindicator of the activity of devices that generate interrupts, such as the system clock, the mouse, disk drivers, data communication lines, network interface cards and other peripheral devices. These devices normally interrupt the processor when they have completed a task or require attention. Normal thread execution is suspended during interrupts. Most system clocks interrupt the processor every 10 milliseconds, creating a background of interrupt activity.Redirector ObjectCurrent CommandsCurrent Commands counts the number of requests to the Redirector that are currently queued for service. If this number is much larger than the number of network adapter cards installed in the computer, then the network(s) and/or the server(s) being accessed are seriously bottlenecked.System Object% Registry Quota In UseShows the percentage of the Total Registry Quota Allowed that is currently being used by the system.Alignment Fixups/secShows the rate of alignment faults fixed by the system.Average Processor Queue LengthThis metric is calculated by the data adapter and does not correspond to a Windows performance counter. It is the Processor Queue Length divided by the number of processors on the machine. Context Switches/secShows the combined rate at which all processors on the computer are switched from one thread to another. Context switches occur when a running thread voluntarily relinquishes the processor, is preempted by a higher priority, ready thread, or switches between user-mode and privileged (kernel) mode to use an Executive or subsystem service. It is the sum of the values of Thread\Thread: Context Switches/sec for each thread running on all processors on the computer and is measured in numbers of switches. There are context switch counters on the System and Thread objects.CpuTimeSpentOnHWThis metric is calculated by the data adapter and does not correspond to a Windows performance counter. It is the sum of the %DPC Time and the %Interrupt Time.Exception Dispatches/secShows the rate at which exceptions are dispatched by the system.File Control Bytes/secFile Control Bytes/sec shows the overall rate at which bytes are transferred for all file system operations that are neither read nor write operations, including file system control requests and requests for information about device characteristics or status. It is measured in numbers of bytes per second.File Control Operations/secShows the combined rate of file system operations that are neither read nor write operations, such as file system control requests and requests for information about device characteristics or status. This is the inverse of System\System: File Data Operations/sec and is measured in numbers of operations.File Data Operations/secShows the combined rate of read and write operations on all logical disks on the computer. This is the inverse of System\System: File Control Operations/sec.File Read Bytes/secShows the overall rate at which bytes are read to satisfy file system read requests to all devices on the computer, including read operations from the file system cache. It is measured in numbers of bytes per second.File Read Operations/secShows the combined rate of file system read requests to all devices on the computer, including requests to read from the file system cache. It is measured in numbers of read operations per second.File Write Bytes/secShows the overall rate at which bytes are written to satisfy file system write requests to all devices on the computer, including write operations to the file system cache. It is measured in numbers of bytes per second.File Write Operations/secShows the combined rate of file system write requests to all devices on the computer, including requests to write to data in the file system cache. It is measured in numbers of write operations per second.Floating Emulations/secShows the rate of floating emulations performed by the system.ProcessesProcesses is the number of processes in the computer at the time of data collection. Notice that this is an instantaneous count, not an average over the time interval. Each process represents the running of a program.Processor Queue LengthProcessor Queue Length is the number of threads in the processor queue. There is a single queue for processor time even on computers with multiple processors. Unlike the disk counters, this counter counts ready threads only, not threads that are running. A sustained processor queue of greater than two threads generally indicates processor congestion.Ratio of InterruptsToSysCallsThis metric is calculated by the data adapter and does not correspond to a Windows performance counter. It is the ratio of Interrupts/sec to System Calls/sec.Ratio of Page Reads/Disk ReadsThis metric is calculated by the data adapter and does not correspond to a Windows performance counter. It is the Ratio of Page Reads/sec to Disk Reads/sec.System Calls/secSystems Calls/sec is the combined rate of calls to Windows NT system service routines by all processes running on the computer. These routines perform all of the basic scheduling and synchronization of activities on the computer, and provide access to non-graphic devices, memory management, and name space management.System Up TimeSystem Up Time is the elapsed time (in seconds) that the computer has been running since it was last started. This counter displays the difference between the start time and the current time.ThreadsThreads is the number of threads in the computer at the time of data collection. Notice that this is an instantaneous count, not an average over the time interval. A thread is the basic executable entity that can execute instructions in a processor.。