劳动经济学第二章
- 格式:ppt
- 大小:1.21 MB
- 文档页数:35


劳动经济学复习资料 第二章1.无差异曲线有什么特点?无差异曲线是用来表示两种商品的不同数量的组合给消费者所带来的效用完全相同的一条曲线。
无差异曲线具有四个重要特征:1)同一条无差异曲线上所有点之间的效用相同。
离原点越远的无差异曲线所表示的效用越高。
2)任意两条无差异曲线不相交。
3)无差异曲线是一条斜率为负、凸向原点的曲线。
斜率为负,表示物品消费与闲暇消费是一种替代关系;无差异曲线凸向原点是由于无差异曲线的边际替代率的绝对值递减。
4)主体偏好不同,无差异曲线的形状也不同,即不同的人有不同的劳动收入替代闲暇的比率(边际替代率)。
2.什么是预算约束线?预算约束线是指在既定工资率条件下,个人可能实际获得的收入和闲暇的所有组合。
预算约束线又称预算线,消费可能线或等支出线,它表示在消费者收入和商品价格假定的条件下,消费者全部收入所能购买到的商品的不同数量组合。
3.图示效用最大化并指出其条件条件:无差异曲线与预算线相切。
根据边际效用理论,如果物品和服务的价格是p ,工资率是w ,那么闲暇和物品的效用最大化的条件是:4.什么是劳动力供给的收入效应和替代效应?并用图分离出来收入效应:如果收入增加,工资和个人偏好不变,将导致劳动供给的减少,称为收入效应。
替代效应:如果收入不变,工资率的增加,将导致闲暇需求的减少,从而增加劳动供给,称为替代效应。
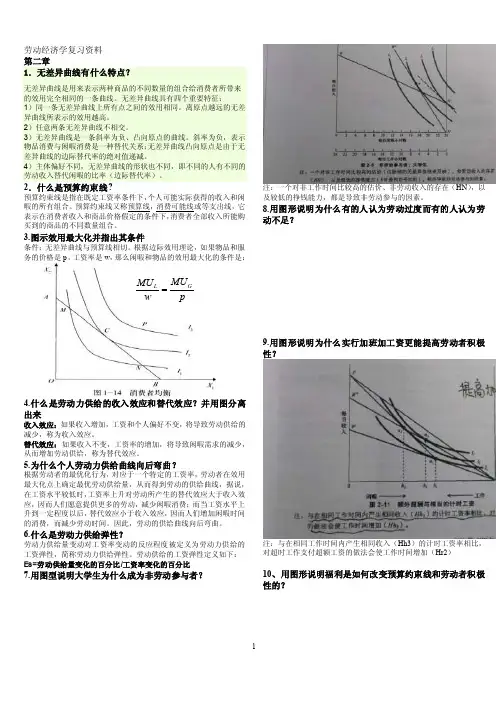
5.为什么个人劳动力供给曲线向后弯曲?根据劳动者的最优化行为,对应于一个特定的工资率,劳动者在效用最大化点上确定最优劳动供给量,从而得到劳动的供给曲线,据说,在工资水平较低时,工资率上升对劳动所产生的替代效应大于收入效应,因而人们愿意提供更多的劳动,减少闲暇消费;而当工资水平上升到一定程度以后,替代效应小于收入效应,因而人们增加闲暇时间的消费,而减少劳动时间。
因此,劳动的供给曲线向后弯曲。
6.什么是劳动力供给弹性?劳动力供给量变动对工资率变动的反应程度被定义为劳动力供给的工资弹性,简称劳动力供给弹性。


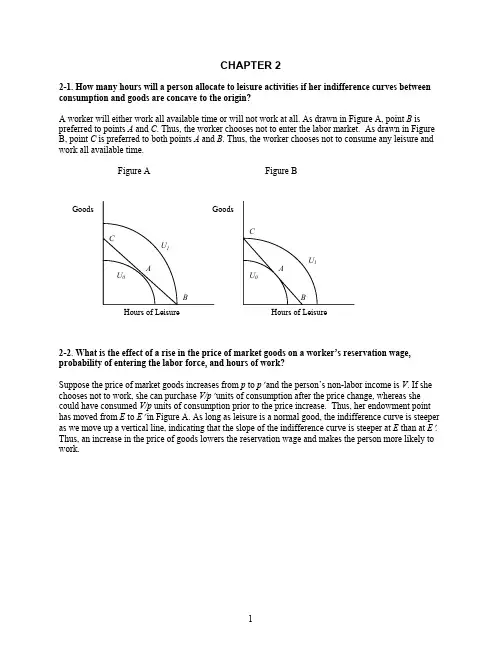
CHAPTER 22-1. How many hours will a person allocate to leisure activities if her indifference curves between consumption and goods are concave to the origin?A worker will either work all available time or will not work at all. As drawn in Figure A, pointB is preferred to points A andC . Thus, the worker chooses not to enter the labor market. As drawn in Figure B, point C is preferred to both points A and B . Thus, the worker chooses not to consume any leisure and work all available time.Figure A Figure B2-2. What is the effect of a rise in the price of market goods on a worker’s reservation wage, probability of entering the labor force, and hours of work?Suppose the price of market goods increases from p to p ′ and the person’s non-labor income is V . If she chooses not to work, she can purchase V/p ′ units of consumption after the price change, whereas she could have consumed V/p units of consumption prior to the price increase. Thus, her endowment point has moved from E to E ′ in Figure A. As long as leisure is a normal good, the indifference curve is steeper as we move up a vertical line, indicating that the slope of the indifference curve is steeper at E than at E ′. Thus, an increase in the price of goods lowers the reservation wage and makes the person more likely to work.Hours of LeisureHours of LeisureGoods GoodsBCA ABCU 1U 1U 0U 0Figure A.To simplify the illustration of the effect on hours of work, assume for simplicity that V = 0. The increase in the price of goods shifts the budget line from FE to GE , moving the worker from P to point R . This shift induces both an income effect and a substitution effect. The price increase in effect lowers the person’s real wage rate, increasing the demand for leisure and leading to fewer hours of work. Thissubstitution effect is illustrated by the move from point P to point Q in Figure B. The price increase also reduces the worker’s wealth, lowering the demand for leisure and leading to more hours of work. This income effect is illustrated by the move from Q to R . As drawn the income effect dominates thesubstitution effect and the price increase lowers the demand for leisure and increases hours of work. It is, of course, possible for the substitution effect to dominate the income effect (not pictured), so that hours of work decreases. Thus, without further restrictions on preferences, an increase in the price of market goods has an ambiguous effect on hours worked.Figure B.GoodsV /p ′V /LeisureHours of Leisure2-3. Sally can work up to 3,120 hours each year (a busy social life and sleep take up the remaining time). She earns a fixed hourly wage of $25. Sally owes a 10 percent payroll tax on the first $40,000 of income. Above $40,000 of income, there is no payroll tax. Sally also faces a progressive income tax rate. There is no income tax on the first $10,000 of income. From $10,000 up to $60,000, the marginal income tax rate is 25 percent. Above $60,000, the marginal income tax rate is 50 percent. Graph Sally’s budget line.Sally’s budget line will have kinks at gross income levels of $10,000, $40,000, and $60,000. As her wage is $25 per hour, these kinks occur after 400 hours, 1,600 hours, and 2,400 hours of work respectively, or, similarly, at 2,720, 1,520, and 720 hours of leisure.•From 0 to 400 hours, Sally’s after-tax wage is $22.50 (90 percent of $25). If she works exactly 400 hours, her after-tax income is $9,000.•From 400 to 1,600 hours, Sally’s after-tax wage is $16.25 (65 percent of $25). If she works exactly 1,600 hours, her after-tax income is $9,000 + $16.25 (1600-400) = $28,500.•From 1,600 to 2,400 hours, Sally’s after-tax wage is $18.75 (75 percent of $25). If she works exactly 2,400 hours, her after-tax income is $28,500 + $18.75 (2400-1600) = $43,500.•From 2,400 to 3,120 hours, Sally’s after-tax wage is $12.50 (50 percent of $25). If she works exactly 3,120 hours, her after-tax income is $43,500 + $12.50 (3120-2400) = $52,500.2-4. Tom earns $15 per hour for up to 40 hours of work each week. He is paid $30 per hour for every hour in excess of 40. Tom faces a 20 percent tax rate and pays $4 per hour in child care expenses for each hour he works. Tom receives $80 in child support payments each week. There are 168 hour in the week. Graph Tom’s weekly budget line.•If Tom does not work, he leisures for 168 hours and consumes $80.•For all hours Tom works up to his first 40, his after-tax and after-child care wage equals (80 percent of $15) – $4 = $8 per hour. Thus, if he works for 40 hours, he will be able to leisure for 128 hours and consume $80 + $8(40) = $400.•For all hours Tom works over 40, his after-tax and after-child care wage equals (80 percent of $30) – $4 = $20. Thus, if he works for 168 hours (128 hours at the overtime wage), he will notleisure at all, but he will consume $80 + $8(40) + $20(128) = $2,960.2-5. What happens to a worker’s desired hours of work if employers pay an overtime premium equal to “time and a half”(that is, 1.5 times the straight-time wage) for any hours worked in excess of 40 hours? What would happen to hours of work if the overtime premium were raised to double the straight-time wage?The availability of overtime pay generates a new (steeper) segment of the budget line originating at the point where the person works 40 hours per week. The figure below illustrates three different possibilities. If the person works 40 hours per week (person B), he or she will be better off by moving to the tangency point labeled X. This person, therefore, will take advantage of the overtime pay and work more hours. If the person is working more than 40 hours per week initially (as is the case for person C), the move from C to X involves both income and substitution effects, and hence we cannot determine which effect dominates. If the person works many fewer than 40 hours per week (person A) he or she will not be affected by the possibility of overtime pay. If the overtime pay were increased to double-pay, it would steepen the line segment originating at 40 hours of work, and perhaps induce some of the persons like A to take advantage of the overtime pay. Person B would continue to work more than 40 hours under a double-time rate, while the double-time rate would have an ambiguous effect on the hours worked of person C.Dollars of Consumption$2,960$400 $80128 168 Hours of LeisureTom’s Weekly Budget Line2-6. A person owns a small farm near a large city and must decide whether to work on that small farm or take a job in the city. Her utility depends on her income per day, Y , and the number of hours allocated to leisure activities, L . Daily income from farm work is:220f f f h h Y −=,where h f is hours of work on the farm; and daily income from the city job is:Y C = 14h C ,where h C is hours of work in the city.To calculate the budget lines associated with each of the opportunities, it is easiest to work through a numerical calculation of what a worker’s earnings would be if he or she allocated 1 hour, 2 hours, 3 hours, etc., to each of the sectors and worked in that sector exclusively. This calculation leads to:Total Earnings Marginal EarningsHours of Work Farm City Farm City1 19 14 19 142 36 28 17 143 51 42 15 14 4 64 56 13 145 75 70 11 146 84 84 9 147 91 98 7 14 8 96 112 5 14Consumption ($)Leisure(a) If she can work on the farm or in the city, but not both, which sector would she choose?The table above suggests the budget line associated with working exclusively in the city is given by CE and on the farm is the parabola FE . As a result, if a worker can only work in either the city or on the farm, a worker with indifference curves like person A is better off working on the farm, while a worker with indifference curves like person B is better off in the city.(b) If she can work both on the farm and in the city, how would she allocate her time?If a worker can allocate her time to both the city and the farm, the worker is then better off allocating the first few hours of work to the farm sector. As the table indicates, the first hour allocated to the farm sector generates $19 worth of income, the second hour generates $17, the third hour generates $15, the fourth hour generates $13, and so on. The worker is thus best off by allocating the first three hours to the farm sector and working any remaining hours she wishes in the city where each additional hour of work generates a constant $14.2-7. Cindy gains utility from consumption C and leisure L . The most leisure she can consume in any given week is 168 hours. Her utility function is U(C,L) = C × L . This functional form implies that Cindy’s marginal rate of substitution is C / L . Cindy receives $630 each week from her great-grandmother – regardless of how much Cindy works. What is Cindy’s reservation wage?The reservation wage is the MRS when not working at all. Thus, w RES = MRS at maximum leisure = C / L = $630 / 168 = $3.75.Leisure2-8. The utility function of a worker is represented by U(C, L) = C ×L, so that the marginal utility of leisure is C and the marginal utility of consumption is L. Suppose this person currently has a weekly income of $600 and chooses to enjoy 70 hours of leisure per week. How many additional dollars of income would it take to entice the worker to work 10 more hours?Initially the person’s utility is U(C,L) = U(600,70) = 600 × 70 = 42,000. She would agree to work 10 more hours (i.e., give up 10 hours of leisure) if the increase in consumption would allow her to achieve at least the same level of utility. Letting Y be her new total income, therefore, Y must solve 60Y = 42,000, which requires Y = $700. Thus, the person’s income would have to rise by $100 to compensate her for the loss of 10 hours of leisure.2-9. You can either take a bus or drive your car to work. A bus pass costs $5 per week, whereas driving your car to work costs $60 weekly (parking, tolls, gas, etc.). You spend half-an-hour less on a one-way trip in your car than on a bus. How would you prefer to travel to work if your wage rate is $10 per hour? Will you change your preferred mode of transportation if your wage rate rises to $20 per hour? Assume you work five days a week and time spent riding on a bus or driving a car does not directly enter your utility.Taking a bus will save you $55 a week, but it will cost you 5 hours of leisure time due to the longer commute. Since the price of leisure is equal to the wage rate, the monetary value of the time lost is $50 when the hourly wage is $10 and $100 when the hourly wage is $20. Therefore, it makes sense for you to take a bus to work if you are paid $10 per hour, but you will switch to driving your car if your wage increases to $20 per hour.2-10. Shelly’s preferences for consumption and leisure can be expressed asU(C,L) = ( C – 200 )× ( L – 80 ).This utility function implies that Shelly’s marginal utility of leisure is C – 200 and her marginal utility of consumption is L – 80. There are 168 hours in the week available to split between work and leisure. Shelly earns $5 per hour after taxes. She also receives $320 worth of welfare benefits each week regardless of how much she works.(a) Graph Shelly’s budget line.If Shelly does not work, she leisures for 168 hours and consumes $320. If she does not leisure at all, she consumes $320 + $5(168) = $1,160.(b) What is Shelly’s marginal rate of substitution when L = 100 and she is on her budget line?If Shelly leisures for 100 hours, she works for 68 hours and consumes $320 + $5(68) = $660. Thus, her MRS when doing this is:23$204608010020066080200==−−=−−==L C MUcMU MRS L .(c) What is Shelly’s reservation wage?The reservation wage is defined as the MRS when working no hours. When working no hours, Shelly leisures for 168 hours and consumes $320. Thus,36.1$8812080168200320≈=−−=RES w .Dollars of Consumption$1,160$320168 Hours of LeisureShelly’s Weekly Budget Line(d) Find Shelly’s optimal amount of consumption and leisure.Her optimal mix of consumption and leisure is found by setting her MRS equal to her wage and solving for hours of leisure given the budget line: C = 320 + 5(168–L )..1365960400580200)168(53205802005=−=−−−−+=−−==L LL L L L C MRSwThus, Shelly will choose to leisure 136 hours, work 32 hours, and consume $320 + $5(32) = $480 each week.2-10. Among single, college-educated women aged 22 – 25, average annual hours worked is 2,160 and the average wage is $22.50. If the average wage increases to $25 per hour, average annual hours worked increases to 2,340. What is the elasticity of labor supply for this group of workers?The elasticity of labor supply is75.09112150.2250.2200.25160,2160,2340,2%%==−−=∆∆=wL S σ.2-11. Mike’s utility for consumption and leisure is U(C,L) = C × L so that his marginal rate ofsubstitution between leisure and consumption is C/L . There are 168 hours in the week and he earns $10 per hour.(a) What is Mike’s optimal amount of consumption and leisure?Mike’s optimal mix of consumption and leisure is found by setting his MRS equal to his wage and solving for hours of leisure given that the budget line is C = 10(168–L ).. 84101680 1010=−== =L LLLCMRS wThus, Mike will choose to leisure 184 hours, work 84 hours, and consume $10(84) = $840 each week. (b) If the government starts a welfare policy that pays B to all non-workers and pays $0 to all workers, at what value of B will Mike opt out of the labor force in order to go on welfare?Given our answer in part (a), we know that if Mike opts to work, his utility will be u work(840,84) =840(84) = 70,560. If he opts out of the labor market, his utility will be u welfare(B,168) = 168B. Mike will not work, therefore, as long as u welfare≥ u work, which requires that B≥ $420.2-12. Explain why a lump sum government transfer can entice some workers to stop working (and entices no one to start working) while the earned income tax credit can entice some people who otherwise would not work to start working (and entices no one to stop working).A lump sum transfer is associated with an income effect but not a substitution effect, because it doesn’t affect the wage rate. Thus, if leisure is a normal good, a lump sum transfer will likely cause workers to work fewer hours (and certainly not cause them to work more hours) while possibly enticing some workers to exit the labor force. On the other hand, the Earned Income Tax Credit raises the effective wage of low-income workers by 20 percent (at least for the poorest workers). Thus, someone who had not been working faces a wage that is 20 percent higher than it otherwise was. This increase may be enough to encourage the person to start working. For example, if a worker’s reservation wage is $6.50 per hour but the only job she can find pays $6.00 per hour, she will not work. Under the earned income tax credit, however, the worker views this same job as paying $7.20 per hour, which exceeds her reservation wage. Furthermore, the EITC cannot encourage a worker to exit the labor force, as the benefits of the EITC are received only by workers.2-13. In 1999, 4,860 TANF recipients were asked how many hours they worked in the previous week. In 2000, 4,392 of these recipients were again subject to the same TANF rules and were again asked their hours of work during the previous week. The remaining 468 individuals were randomly assigned to a “Negative Income Tax” (NIT) experiment which gave out financial incentives for welfare recipients to work and were subject to its rules. Like the other group, they were asked about their hours of work during the previous week. The data from the experiment are contained in the table below.TotalNumber OfRecipients Number ofRecipients Who Worked At Some Time in the SurveyWeek Total Hours Of Work By All Recipients in the Survey Week1999 2000 1999 2000TANF 4,392 1,217 1,568 15,578 20,698NIT 468 131 213 1,6382,535Total 4,860 1,348 1,781 17,21623,233(a) What effect did the NIT experiment have on the employment rate of public assistance recipients? Develop a standard difference-in-differences table to support your answer.EmploymentRate1999 2000 Diff Diff-in-DiffTANF 27.7% 35.7% 8.0%NIT 28.0% 45.5% 17.5% 9.5%The NIT increased the probability of employment by 9.5 percentage points.(b) What effect did the NIT experiment have on the weekly hours worked of public assistance recipients who worked positive hours during the survey week? Develop a standard difference-in-differences table to support your answer.Weekly Hours Worked Per Working Person1999 2000 Diff Diff-in-DiffTANF 12.8 13.2 0.4NIT 12.5 11.9 -0.6 -1.0The NIT decreased weekly hours worked, of those working, by 1 hour.11。

劳动经济学第二章课后习题答案一、关键词解释劳动力供给:从性质上说:是指劳动力的供给主体(劳动者个人,在某些情况下可以指家庭)在一定劳动条件下自愿对存在于主体中的劳动力使用权的出让;从量的角度说:是指一个经济体(大至一个国家,小至一个企业,一个雇请了保姆的家庭)在某一段时期中,可以获得的劳动者愿意提供的劳动能力的总和。
劳动力参与率:指劳动范围内的人口参与市场性劳动的比率,是反映就业和劳动人口参与劳动程度的重要指标。
劳动力供给曲线:是指在其他条件不变,市场工资率作为影响劳动力供给的唯一因素的条件下,根据劳动力供给量相对于市场工资率的变动程度绘制而成的曲线劳动力供给弹性:指劳动力供给量变动对工资率变动的反映程度效用理论:效用是指消费者在消费商品或劳务时的满足程度,与此相关的理论就叫效用理论,主要包括基数效用理论和序数效用理论收入约束线:表示个人在时间和劳动能力状况约束下所能消费余暇和获得收入的最大组合线余暇-收入无差异曲线:可以带来一定水平的余暇时间与收入的组合点连接所形成的曲线称为余暇-收入无差异曲线主体均衡:所谓主体均衡,就是在资源约束的条件下余暇和收入的组合能使主体获得最大效用的状态收入效应:收入效应指由商品价格的变动所引起的实际收入水平的变动,进而由由实际收入水平的变动所引起的商品需求量的变动替代效应:因该商品名义价格的变动而导致消费者所购买的商品组合中,该商品与其他商品之间的替代个人劳动力供给曲线:揭示劳动者个人劳动力供给意愿随工资率变动而变动的规律,工资率的上升会导致个人劳动力供给时间的增加,而在此工资率水平之上,工资率的上升反而会导致个人劳动力供给时间的减少。
市场劳动力供给曲线:将一个市场中的个人劳动力供给曲线相加即是市场劳动力供给曲线劳动力的流量:把就业、失业等各种各样的劳动力状况在某个时间点的劳动力的存量向某个方向的流入或流出的量称为劳动力的流量劳动力的流量表:把劳动力人口分为就业、失业、非劳动力三种状态,以观察存量劳动力状况的时间点的变化而形成的劳动力流量,由此而绘制成的表格就是劳动力流量表转移率:从流动量和存储量,到流动的概率,换言之对原本的存量也可以计算流动的变化概率二、问答题1.如何理解劳动力供给的含义?劳动力供给是指在某一特定时间内,在一定工资率水平下,劳动者愿意并且能够提供的劳动力数量深入理解劳动力供给概念,需把握以下三点:个体决策:在市场经济体制下,劳动者是寄寓于其身上的劳动力的法定产权所有者劳动者有充分的自由使用权和处置权,并有凭借直接提供劳务或出租劳动力使用权获得收益的权利主体意愿,劳动力市劳动者的私有财产,劳动者是否愿意提供劳动取决于多种因素,如工资率高低、工作时间长短、个人家庭经济状况等,因此劳动力供给的量和质在很大程度上受到劳动力供给者主观愿望的影响时间要素:包括两层含义:劳动者愿意提供的工作时间、劳动力供给分析的时间2.分析劳动力供给通常有哪些假设(1)劳动力供给主体的目标假设,该假设认为劳动者在作出供给决策时,以追求效用最大化为目标(2)市场环境假设:假定市场是完全竞争状态(3)关于劳动力质量的假设:假定劳动力是同质的3、影响劳动力个人供给的主要因素有哪些?答:一般说来,影响劳动力个人供给的因素包括以下几方面:劳动者受教育时间的长短;工资政策及工资关系;工资水平;个人非劳动收入;居民家庭生产率的变化;社会保障制度;宏观经济状况;其它社会文化、风俗习惯、社会心理等。
第二章劳动力供给一、名词解释劳动力供给——从本质上说,是指劳动力的供给主体在一定的劳动条件下自愿对存在于主体之中的劳动力使用权的出让;从量的角度说,是指一个经济体在某一段时期中,可以获得的劳动者愿意提供的劳动能力的总和。
主体均衡——在资源约束的条件下余暇与收入的组合能使主体获得最大盗用的状态。
劳动力供给弹性——由工资率变动引起的劳动力供给变动的百分比与工资率变动的百分比的比值。
收入效应——在其他条件不变时,由于非劳动收入的增加,个人可达到的效用水平将提高。
替代效应——相对价格提高的商品必然引起较小的需求,价格提高的商品必然增加其供给。
二、单项选择1.序数效用论对消费者偏好的性质作了()假设。
两点三点四点五点2.基数效用论将效用分为总效用和()。
边际效用心理效用消费效用生产效用3.对劳动力供给的基本分析,是建立在()的经济决策分析基础之上。
生产者个体消费者个体劳动者个体消费者群体4.长期以来,我国实行就业、工资、()三位一体的社会保障制度。
福利医疗保险社会保险社会救济5 .()在继承了基数效用论的部分理论基础之上,为效用理论的实际应用寻找到了可靠的方法。
A .边际效用论B .生产效用论C .消费效用论D .序数效用论三、判断改错没有就业意愿或就业要求的人口同样属于劳动力的范畴。
×(不属于)所谓经济周期,是指经济运行过程中繁荣与衰退的间歇性交替。
×(周期性交替)基数效用并不假设每个人都是“经济人”。
×(基数效用论假设每个人都是“经济人”)在序数效用论的假设中,要求消费者的偏好有明确的单向性。
(√)无差异曲线是可能相交的。
×(不可能)四、简答题1.试述个人和家庭的劳动力供给的特点。
答:个人:在工资率较低且收入较少时,由工资率提高产生的替代效应大于收入效应,故随着工资率的提高,劳动力供给增加;在工资率维持较高水平且收入也在较高水平时,替代效应小于收入效应,表现为工资率对劳动力供给的负向影响。