国际会议poster模板
- 格式:ppt
- 大小:2.28 MB
- 文档页数:4


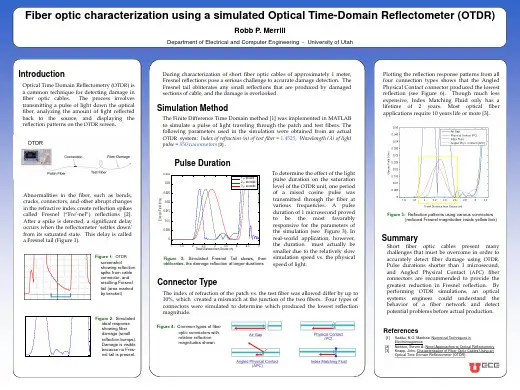
原创国际学术会议海报(poster)模板(英文)原创国际学术会议海报(poster)模板(英文)Fiber optic characterization using a simulated Optical TimeDomain Reflectometer (OTDR)Robb P. MerrillDepartment of Electrical and Computer Engineering - University of Utah IntroductionOptical Time Domain Reflectometry (OTDR) is a common technique for detecting damage in fiber optic cables. The process involves transmitting a pulse of light down the optical fiber, analyzing the amount of light reflected back to the source, and displaying the reflection patterns on the OTDR screen.During characterization of short fiber optic cables of approximately 1 meter, Fresnel reflections pose a serious challenge to accurate damage detection. The Fresnel tail obliterates any small reflections that are produced by damaged sections of cable, and the damage is overlooked.Simulation MethodThe Finite Difference Time Domain method [1] was implemented in MATLAB to simulate a pulse of light traveling through the patch and test fibers. The following parameters used in the simulation were obtained from an actual OTDR system: Index of refraction (n) of test fiber = 1.4525, Wavelength (λ) of light pulse = 850 nanometers [3] .Plotting the reflection response patterns from all four connection types shows that the Angled Physical Contact connector produced the lowest reflection (see Figure 6). Though much less expensive, Index Matching Fluid only has a lifetime of 2 years. Most optical fiber applications require 10 years life or more [3].Pulse DurationT o determine the effect of the light pulse duration on the saturation level of the OTDR unit, one period ofa raised cosine pulse was transmitted through the fiber at various frequencies. A pulse duration of 1 microsecond proved to be the most favorably responsive for the parameters of the simulation (see Figure 3). In realworld application, however, the duration must actually be smaller due to the relatively slow simulation speed vs. the physical speed of light.OTDR Saturation at Increased Pulse Durations 0.035 1 second 0.03 2 seconds 3 secondsAbnormalities in the fiber, such as bends, cracks, connectors, and other abrupt changes in the refractive index create reflection spikes called Fresnel ( Fre'-nel ) reflections [2]. After a spike is detected, a significant delay occurs when the reflectometer ‘settles down’ from its saturated state. This delay is called a Fresnel tail (Figure 1).Figure 1: OTDR screenshot showing reflection spike from cable connector, and resulting Fresnel tail (area marked by bracket)0.025Electric Field (V/m)0.020.01510.01Figure 5: Reflection patterns using various connectors (reduced Fresnel magnitudes inside yellow box)0.0050 1 1.5 2 2.5 3 3.5 4 Travel Distance from Source (m) 4.5 5SummaryShort fiber optic cables present many challenges that must be overcome in order to accurately detect fiber damage using OTDR. Pulse durations shorter than 1 microsecond, and Angled Physical Contact (APC) fiber connectors are recommended to provide the greatestreduction in Fresnel reflection. By performing OTDRsimulations, an optical systems engineer could understand the behavior of a fiber network and detect potential problems before actual production.Figure 3: Simulated Fresnel Tail skews, then obliterates, the damage reflection at larger durationsConnector TypeThe index of refraction of the patch vs. the test fiber was allowed differ by up to 10%, which created a mismatch at the junction of the two fibers. Four types of connectors were simulated to determine which produced the lowest reflection magnitude.15x 10-3Ideal Reflection Characteristics (No OTDR Saturation)105Figure 2: Simulated ideal response showing fiber damage (small reflection bumps). Damage is visible because no Fres-nel tail is present.Electric Field (V/m)Figure 4: Common types of fiber optic connectors with relative reflection magnitudes shownReferences[1] Sadiku, N.O. Matthew. Numerical Techniques in Electromagnetics [2] Newton, Steven A. Novel Approaches to Optical Reflectometry [3] Knapp, John. Characterization of FiberOptic Cables Using an Optical Time Domain Reflectometer (OTDR)0 2 2.5 3 Travel Distance from Source (m) 3.5Fiber optic characterization using a simulated Optical TimeDomain Reflectometer (OTDR)Robb P. MerrillDepartment ofElectrical and Computer Engineering - University of UtahIntroductionOptical Time Domain Reflectometry (OTDR) is a common technique for detecting damage in fiber optic cables. The process involves transmitting a pulse of light down the optical fiber, analyzing the amount of light reflected back to the source, and displaying the reflection patterns on the OTDR screen.During characterization of short fiber optic cables of approximately 1 meter, Fresnel reflections pose a serious challenge to accurate damage detection. The Fresnel tail obliterates any small reflections that are produced by damaged sections of cable, and the damage is overlooked.Simulation MethodThe Finite Difference Time Domain method [1] was implemented in MATLAB to simulate a pulse of light traveling through the patch and test fibers. The following parameters used in the simulation were obtained from an actual OTDR system: Index of refraction (n) of test fiber = 1.4525, Wavelength (λ) of light pulse = 850 nanometers [3] .Plotting the reflection response patterns from all four connection types shows that the Angled Physical Contact connector produced the lowest reflection (see Figure 6). Though much less expensive, Index Matching Fluid only has a lifetime of 2 years. Most optical fiber applications require 10 years life or more [3].Pulse DurationTo determine the effect of the light pulse duration on the saturation level of the OTDR unit, one period of a raised cosine pulse was transmitted through the fiber at various frequencies. A pulse duration of 1 microsecond proved to be the most favorably responsive for the parameters of the simulation (see Figure 3). In realworld application, however, the duration must actually be smaller due to the relatively slow simulation speed vs. the physical speed of light.OTDR Saturation at Increased Pulse Durations 0.035 1 second 0.03 2 seconds 3secondsAbnormalities in the fiber, such as bends, cracks, connectors, and other abrupt changes in the refractive index create reflection spikes called Fresnel ( Fre'-nel ) reflections [2]. After a spike is detected, a significant delay occurs when the reflectometer ‘settles down’ from its saturated state. This delay is called a Fresnel tail (Figure 1).Figure 1: OTDR screenshot showing reflection spike from cable connector, and resulting Fresnel tail (area marked by bracket)0.025Electric Field (V/m)0.020.01510.01Figure 5: Reflection patterns using various connectors (reduced Fresnel magnitudes inside yellow box)0.0050 1 1.5 2 2.5 3 3.5 4 Travel Distance from Source (m) 4.5 5SummaryShort fiber optic cables present many challenges that must be overcome in order to accurately detect fiber damage using OTDR. Pulse durations shorter than 1 microsecond, and Angled Physical Contact (APC) fiber connectors are recommended to provide the greatest。
poster学术模板通常包括以下几个部分:
1. 标题页:包括poster的标题、作者姓名、所在单位等信息。
2. poster主体:这是展示研究成果或实验数据的主要部分。
通常使用图表、图片、文字等手段,清晰简洁地展示研究目的、方法、结果和讨论等内容。
在摆放poster时,应该确保这些信息是观众可以轻松阅读和理解的部分。
3. 问题与答案部分:在poster展示过程中,观众可能会提出疑问,因此留出空间和准备答案非常重要。
4. 引用和参考文献:在poster的末尾,需要列出所有引用的文献和参考文献。
5. 作者信息:在poster的下方或背面,可以提供作者们的联系方式,如电子邮件、电话、地址等,以便感兴趣的专家和学者与作者联系,进行进一步交流和合作。
6. 布局和设计:poster的布局应该简洁、明了,易于阅读。
可以使用不同的颜色、字体和图片,但要避免使用过于花哨的设计,以免分散观众的注意力。
7. 使用标签和标题:使用简洁明了的标题和标签,可以帮助观众更快地理解poster的内容。
请注意,poster的尺寸和材质应该根据展示场合和观众群体来选择。
一般而言,poster的尺寸应该适中,既能够展示所有的信息,又不会占据过多的空间。
同时,选择一种适合展示环境的材质,如喷绘布等。

英语国际会议邀请函邀请信ALetterofInvitation5第一篇:英语国际会议邀请函邀请信A Letter of Invitation5A Letter of InvitationSchool of Material Science and Engineering XXXX University XXX RoadXXX DistractShanghai 201805 P.R.China Nov.18,2015 Prof.Smith College of Science and T echnology Central Michigan University ET Building 200 Mount Pleasant, MI 48859 U.S.A Dear Prof.Smith, On behalf of the School of Material Science and Engineering at XXX University, I am honored to invite you to be a keynote speaker at the 5th international XXXXX Convention to be held, May 20 – 28, at Shanghai International Convention Center.The workshop will focus on the innovative researches, advanced production procedures, and applications especially in aero-industry in XXX field.Your presence will attract numerous professionals to the seminar because you are the top expert worldly in the field.Your round-trip flight,local expense including hotel accommodation, meals and registration fee will be covered by the organizers.The more detailed information and a copy of the advance schedule on the workshop is enclosed.If you have something unclear on the conference, please do not hesitate to contact our convenor, Mrs.Feng, at 86-021-********.We hope you can spare time from your tight schedule to attend the forum.We are looking forward to your reply.Yours sincerely,Dean of the school Chair of the Organizing Committee第二篇:国际会议邀请函国际会议邀请函范文汇编5篇邀请函可适当添加个性化的邀约文字。
学术poster格式学术海报(poster)是学术会议或研讨会上展示研究成果的一种形式。
下面我将从多个角度来介绍学术海报的格式。
1. 尺寸和布局:学术海报的尺寸通常为A0或A1纸张大小,也就是841mm × 1189mm或594mm × 841mm。
海报通常是纵向布局,但也可以是横向布局,具体取决于会议的要求。
2. 标题和作者信息:学术海报的顶部通常包含标题,以吸引观众的注意力。
标题应该简明扼要地概括研究主题。
在标题下方,列出作者的姓名和所属机构。
3. 导言部分:在海报的上部,通常会有一个导言部分,介绍研究的背景、目的和重要性。
这一部分应该简洁明了,吸引观众的兴趣。
4. 方法:接下来的部分应该描述研究的方法和实验设计。
这包括实验步骤、数据采集和分析方法等。
使用图表、流程图或示意图来帮助解释方法。
5. 结果:在海报的中间部分,展示研究的主要结果。
使用图表、表格、图片等方式呈现数据,确保数据清晰可读。
对结果进行简要的解释和分析,突出研究的亮点。
6. 讨论和结论:在海报的下部,进行讨论和结论部分。
讨论研究结果的意义、局限性和未来的研究方向。
总结研究的主要发现,并强调其对学术领域的贡献。
7. 参考文献:在海报的底部,列出引用的参考文献。
使用规范的引用格式,如APA、MLA等。
8. 图片和图表:使用高质量的图片和图表来支持研究结果和分析。
确保图像清晰可见,字体大小适宜,图表简洁明了。
9. 字体和颜色:选择清晰易读的字体,如Arial、Times New Roman等。
使用适当的字号和行间距,确保文字可读性。
对于颜色的选择,使用明亮的颜色来吸引观众的注意力,但避免使用过于刺眼的颜色组合。
10. 布局和排版:将内容分为多个模块,使用合适的标题和分段来组织信息。
保持整体布局的一致性和平衡性,避免内容过于拥挤或稀疏。
总之,学术海报应该简洁明了地展示研究的背景、方法、结果、讨论和结论。
合理的布局、清晰的图表和适当的字体颜色都是制作学术海报时需要考虑的因素。