Presenter/timing Presenter/timing Presenter/timing Presenter/timing Presenter/timing Presenter/timing
Bar graph, 1 data series
Category A
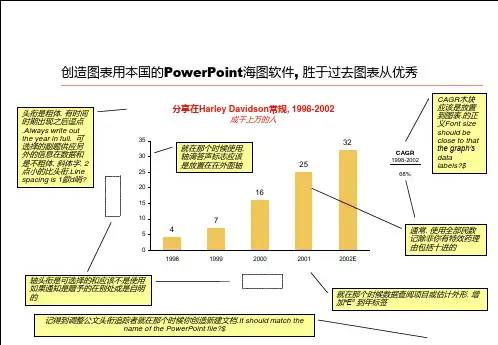
Title, time period
Create graphs using the native PowerPoint chart software, rather than pasting graphs from Excel
Title is bold, with the time period appearing after a comma. Always write out the year in full. The optional subtitle provides additional info on the data and is not bold, italics, 2 points smaller than the title. Line spacing is 1
Fill R-0 G-52 B-102
Accent R-239 G-196 B-089
Accent 2 R-040 G-108 B-026
Additional colors, if needed
Accent 3 R-255 G-245 B-200
Title Text R-222 G-029 B-014
Bar graph, 2 data series
Axis title
Category A Category B Category C Category D Category E
0