拉曼光谱基线校正解读
- 格式:doc
- 大小:201.00 KB
- 文档页数:9

激光共聚焦显微拉曼光谱仪校准程序激光共聚焦显微拉曼光谱仪是一种高分辨率的光谱技术,可以用于化学成分的分析和谱图的记录。
然而,为了保证该仪器的准确性和可靠性,需要进行校准程序。
校准程序主要包括仪器本身和样品。
以下是一些常用的校准程序:1.仪器本身的校准(1)激光光源的初始设置:光源的初始设置是非常重要的,必须确保其处于最佳状态,以产生稳定而精确的光束。
(2)光学组件的位置调整:校准光学组件可以提高系统的精确度。
这些光学组件可能包括对光束进行分束和收集的镜子、分光镜、光栅等。
(3)光滤波器的选择:激光共聚焦显微拉曼光谱仪需要使用定制的光滤波器,以保证仪器在可见光到近红外范围内的灵敏度和特定波长的选择。
2.样品的校准(1)样品的准备:样品应该完全干燥,以减少水分对分析结果的影响。
(2)样品的制备:样品制备需要精确且一致,以确保分析结果的可比性。
例如,如果使用荧光标记物,需要确保标记物的数量和位置是一致的。
(3)样品的测试:样品测试的顺序应该是随机的,以避免任何测试次序对结果的影响。
最后,需要对校准程序进行验证,以确保它们提供准确的结果。
在激光共聚焦显微拉曼光谱仪的校准程序中,需要特别关注以下几个问题:1.激光的线宽和时域性质:激光的线宽和时域性质会直接影响到拉曼信号的强度和分辨率。
为了保证精确度,需要对激光进行时间分辨和谱分辨的测试。
2.样品的形态和性质:样品的形态和性质也会直接影响到拉曼信号的强度和分辨率。
因此,需要对样品进行多次测试,以确定最佳测试条件,并记录下每次测试的结果。
3.环境因素的影响:环境因素如温度、压力等也会对测试结果产生影响。
因此,需要保持测试条件稳定,并对测试环境进行记录。
激光共聚焦显微拉曼光谱仪的校准程序是非常重要的。
通过精确的校准程序,可以确保仪器在分析化学成分和谱图时具有高度的准确性和可靠性。
同时,需要定期验证校准程序,以确保结果的可重复性和一致性。

拉曼光谱解析教程拉曼光谱是一种非常有效的光谱分析技术,可用于分析分子和材料的结构、组成和状态。
以下是拉曼光谱解析的教程:1. 原理:拉曼效应是指分子或材料在受激光照射时,部分光子与分子或晶体格子内原子发生相互作用,导致光的散射现象。
拉曼光谱通过测量样品散射光的频率差异,从而提供有关样品成分、结构和状态的信息。
2. 实验设备:进行拉曼光谱分析需要一台拉曼光谱仪,通常包括一个激光器、一个样品台、一个光学系统和一个光学探测器。
激光器会产生单色的激光光束,样品台用于支撑和定位待测样品,光学系统用于收集和分析散射光,光学探测器将光信号转换成电信号。
3. 样品准备:将待测样品放置在样品台上,确保样品表面光洁,没有表面污染或杂质。
拉曼光谱可以对几乎所有类型的样品进行分析,包括液体、固体和气体。
4. 数据采集:使用拉曼光谱仪进行光谱采集,通过调整激光功率、扫描范围和积分时间等参数进行实验优化。
通常会采集多个波数点的拉曼光谱数据,越多的数据点可以提供更多信息,但也需要更长的采集时间。
5. 数据分析:通过对采集到的拉曼光谱数据进行分析,可以获得样品的结构、组成和状态信息。
常见的数据处理方法包括光谱峰拟合、数据平滑和峰位校准等。
6. 数据解释:根据拉曼光谱的特征峰位和峰形,结合已知的拉曼光谱库,可以对样品进行定性和定量分析。
可以通过比较待测样品和标准品的拉曼光谱,或者使用化学计量学方法进行定量分析。
7. 应用领域:拉曼光谱广泛应用于材料科学、生物医学、环境监测和药物研发等领域。
例如,可以用于分析化学反应中的中间产物和催化剂,检测食品和药品中的污染物,研究生物分子的结构和功能等。
希望以上的教程可以帮助您了解拉曼光谱解析的基本知识和步骤。
开展拉曼光谱实验前,请确保已熟悉仪器的操作和数据处理方法,以获得可靠的结果。

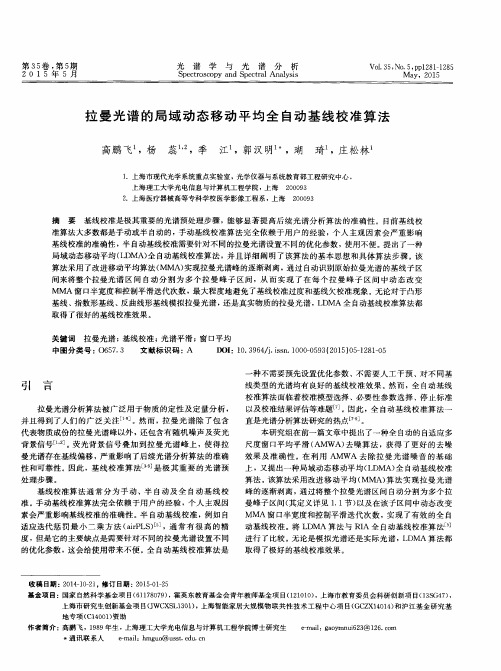
基于多项式拟合的拉曼光谱基线漂移校正方法在拉曼光谱分析中,光谱基线漂移是一个普遍存在的问题。
拉曼光谱中的基线漂移会干扰峰信号的判断和峰位的计算,因此对光谱进行准确的基线漂移校正非常重要。
而基于多项式拟合的方法是一种常用的拉曼光谱基线漂移校正方法。
1. 多项式拟合原理在拉曼光谱分析中,基线漂移是由一些非拉曼散射效应引起的,例如荧光、连续光等。
这些非拉曼散射效应对光谱的基线产生干扰,导致基线的漂移。
我们可以利用多项式拟合来对这些非拉曼散射效应进行建模,从而实现基线漂移的校正。
2. 多项式拟合方法多项式拟合是一种通过拟合多项式函数来逼近一组数据的方法。
在拉曼光谱基线漂移校正中,我们可以选择合适的多项式阶数,利用最小二乘法来拟合基线漂移的干扰部分,然后将拟合结果与原始光谱进行相减,从而实现基线漂移的校正。
3. 多项式拟合的优势基于多项式拟合的方法具有一定的优势。
多项式拟合是一种简单而有效的方法,不需要对光谱数据做过多的假设,适用于各种类型的拉曼光谱。
多项式拟合可以通过选择不同阶数的多项式来适应不同的基线漂移情况,具有一定的灵活性和通用性。
多项式拟合方法的计算速度较快,可以在较短的时间内完成基线漂移校正。
4. 个人观点与理解在我的个人观点和理解中,基于多项式拟合的方法是一种简单而有效的拉曼光谱基线漂移校正方法。
通过选择合适的多项式阶数和利用最小二乘法来拟合基线漂移的干扰部分,可以较好地实现基线漂移的校正。
然而,需要注意的是在选择多项式阶数时,要避免过拟合或欠拟合的情况,以免影响基线漂移校正的准确性和可靠性。
总结回顾基于多项式拟合的方法是一种常用的拉曼光谱基线漂移校正方法。
通过对非拉曼散射效应进行多项式拟合来建模,然后将拟合结果与原始光谱进行相减,可以较好地实现基线漂移的校正。
多项式拟合方法具有简单、灵活、通用和高效的特点,但需要注意选择合适的多项式阶数,避免过拟合或欠拟合的情况。
在实际应用中需要综合考虑光谱特征和数据情况,选择合适的方法来进行基线漂移校正。

拉曼光谱基线校正
拉曼光谱的基线校正可以通过多种方法实现,以下是一些常用的方法:
1.峰值消除:通过寻找并消除光谱中的峰值,可以消除基线校正中的噪声和干扰。
2.多项式拟合逼近基线:利用多项式拟合的方法逼近基线,能够得到较为平滑的基线。
这种方法需要选择合适的多项式阶数,以避免过拟合或欠拟合。
3.减去基线:在拉曼光谱中减去基线,可以突出光谱中的特征峰。
常用的基线校正算法有分段线性拟合法、局部极值中值法、多项式拟合法等。
4.小波变换法:小波变换法是一种有效的信号处理方法,可以对拉曼光谱进行多尺度分析和处理,从而提取出光谱中的特征信息并消除噪声。
5.插值法:插值法是一种数学方法,通过插值可以获得更加平滑的基线。
常用的插值方法包括线性插值、多项式插值、样条插值等。
6.最小二乘法:最小二乘法是一种数学优化技术,通过最小化误差的平方和来寻找最佳函数匹配。
在拉曼光谱基线校正中,可以利用最小二乘法对光谱数据进行拟合,从而得到较为准确的基线。
以上是一些常用的拉曼光谱基线校正方法,根据具体情况选择合适的方法可以提高校正的准确性和稳定性。
1。
拉曼光谱基线处理
拉曼光谱基线处理是对拉曼光谱中的基线进行去除或调整,以提高光谱数据的准确性和可视化效果。
基线指的是光谱中的背景信号,可能来自仪器噪声、样品自发辐射或散射等因素,而且可能会掩盖或干扰目标信号的分析。
下面是一些常见的拉曼光谱基线处理方法:
1. 多项式拟合法:利用多项式函数对整个光谱曲线进行拟合,然后将拟合的曲线视为基线,并将其从原始光谱中减去。
2. 线性插值法:选择光谱曲线中的几个谷底或谷峰点,通过这些点之间的线性插值来拟合基线,然后将其从原始光谱中减去。
3. Small Region Iterative Standard Deviation(依标准偏差进行
小区域迭代)法:这是一种自动的基线处理方法,通过在光谱中选择一段小区域,在该区域内计算标准偏差,并将位于该区域之外的数据点视为异常点,然后将这些点剔除,重新计算标准偏差,循环迭代直到标准偏差达到稳定。
4. Whittaker Smoothing方法:这是一种光滑峰值式的方法,通
过对光谱数据进行平滑操作,去除光谱中的噪声和振荡,从而得到基线。
以上只是一些简单的基线处理方法,根据实际情况和需求,还可以结合其他方法进行基线处理,如小波变换、曲线拟合、光
谱差异谱等方法。
最终目的是去除基线的干扰,凸显光谱中的目标信号,以便进行更准确的光谱分析和解释。
raman光谱扣除基线
在Raman光谱分析中,基线扣除是一种常见的数据处理技术,用于去除光谱中的基线漂移或连续光谱噪声。
Raman光谱的基线是指不相关于样品的光谱信号,可能来自仪器噪声、荧光背景或其他原因。
以下是一些常见的Raman光谱扣除基线的方法:
1.线性拟合:通过选择位于Raman光谱中无特征峰的区域,
使用线性函数拟合这些点,然后从整个光谱中减去这个线
性拟合曲线,去除基线。
2.多项式拟合:使用高阶多项式(如二次或三次多项式)来
逼近光谱中的基线。
通过选择适当的多项式阶数,并拟合
光谱中无特征峰的区域,然后从整个光谱中减去多项式的
拟合曲线。
3.Savitzky-Golay滤波:使用Savitzky-Golay滤波器对光谱进
行平滑处理,同时去除基线。
该滤波器可平滑数据并保留
数据中的截止峰,从而提取出光谱中的特征峰。
4.低通滤波:应用低通滤波器对光谱进行滤波,通过去除高
频噪声和连续波动来去除基线。
5.考虑拉曼特征峰:对于特定的样品,可以利用已知特征峰
的位置和形状来扣除基线。
首先,找到并拟合各个特征峰
的实际形状,然后从整个光谱中减去这些特征峰的拟合曲
线。
选择适当的基线扣除方法取决于样品的性质和所需分析的特定问题。
通常建议在进行基线扣除之前,对数据进行预处理和峰识别,以确保所选取的区域和方法能够准确去除基线而不损失样品的信息。
此外,可能需要进行参数调整和多次尝试,直到满意的基线扣除结果得到。
origin拉曼光谱归一化Origin拉曼光谱归一化一、引言(100字)Origin拉曼光谱归一化是一种数据处理技术,用于将不同样品之间的光谱数据进行标准化处理。
这种方法能够有效消除由于样品之间差异所引起的光谱强度偏移,提高数据比较的准确性和可靠性。
二、原理解释(200字)光谱数据归一化的原理是通过对光谱曲线的处理,使其具备相同的基线和最大峰值。
归一化处理可以分为两个步骤:基线校正和峰值调整。
基线校正是通过调整曲线上的各个点,使其在整个光谱范围内保持平坦。
常用的基线校正方法有多项式拟合、平滑滤波和基线修复等。
峰值调整是为了使光谱曲线中的特定峰点在不同样品之间具有相同的强度。
常见的峰值调整方法有最大值法、内标法和标准品法等。
三、应用场景(150字)Origin拉曼光谱归一化在许多领域都有广泛的应用。
例如,在材料科学中,不同材料的拉曼光谱数据往往受到样品的形态和结构的影响,通过归一化处理可以排除这些影响,方便进行比较和分析。
在生物医学领域,归一化可以消除样品间的差异,揭示出药物对细胞或组织的影响差异,为药物研发提供参考。
四、实验方法(100字)在Origin软件中,实施拉曼光谱归一化的方法通常如下:首先,选择一个适当的基线校正方法,消除光谱中的噪声和基线偏移。
其次,根据实验需求选择合适的峰值调整方法对光谱进行归一化处理。
最后,通过调整不同参数,如多项式阶数、滤波窗口大小等,优化归一化的效果。
五、实例分析(150字)以拉曼光谱分析矿石成份为例,先进行基线校正,采用三阶多项式拟合方法,消除基线漂移和噪声。
然后,选取显著峰点进行峰值调整,通过内标法和最大值法得到不同矿石的归一化光谱数据。
比较归一化后的光谱图,明显看出不同矿石的峰位和强度差别。
六、结论(100字)Origin拉曼光谱归一化是一种有效的数据处理方法,能够提高光谱数据的可比性和可靠性。
通过基线校正和峰值调整,归一化可以消除样品间的差异,减小实验误差,为数据的后续分析提供准确的基础。
引言概述:拉曼光谱是一种非侵入性的光谱分析技术,可以用来研究物质的化学成分、结构和分子间相互作用等信息。
通过测量样品与激发光相互作用后反散射光的频移,可以得到样品的拉曼光谱图谱。
拉曼光谱具有快速、灵敏和无需样品处理等优势,因此在化学、材料科学、生物医学和环境科学等领域被广泛应用。
正文内容:一、理论基础1. 拉曼散射原理:介绍拉曼光谱的基本原理,包括应力引起的拉曼散射和分子振动引起的拉曼散射。
2. 基本理论模型:介绍拉曼光谱的基本理论模型,包括简谐振动模型和谐振子模型等。
二、仪器设备1. 激发光源:介绍常用的激发光源,如激光器和光纤激光器等,以及它们的特点和选择。
2. 光谱仪:介绍常用的拉曼光谱仪,包括激光外差光谱仪和光纤光谱仪等,以及它们的原理和优缺点。
3. 采样系统:介绍拉曼光谱的采样系统,包括反射式、透射式和光纤探头等,以及它们的适用范围和操作注意事项。
三、数据处理与分析1. 光谱预处理:介绍光谱预处理的方法,包括光谱平滑、噪声抑制和基线校正等,以提高数据质量和减少干扰。
2. 谱图解析:介绍拉曼光谱谱图的解析方法,包括峰拟合、峰识别和谱图比较等,以确定样品的化学成分和结构信息。
3. 定量分析:介绍拉曼光谱的定量分析方法,包括多元线性回归和主成分分析等,以快速准确地测量样品的含量和浓度。
四、应用领域1. 化学分析:介绍拉曼光谱在化学分析中的应用,包括有机物和无机物的定性和定量分析,以及催化剂和原位反应研究等。
2. 材料科学:介绍拉曼光谱在材料科学中的应用,包括纳米材料、多晶材料和聚合物等的表征和结构分析。
3. 生物医学:介绍拉曼光谱在生物医学中的应用,包括体液中代谢产物和蛋白质的检测,以及癌症和药物代谢研究等。
4. 环境科学:介绍拉曼光谱在环境科学中的应用,包括土壤和水体中有机物和无机物的检测,以及大气污染和环境污染物的监测等。
五、发展前景与挑战1. 发展前景:介绍拉曼光谱在未来的发展前景,包括高灵敏度和高分辨率的光谱仪、纳米尺度的光学探针和超快激光技术等。