第九章 相关分析与Correlate过程
- 格式:ppt
- 大小:11.51 MB
- 文档页数:29
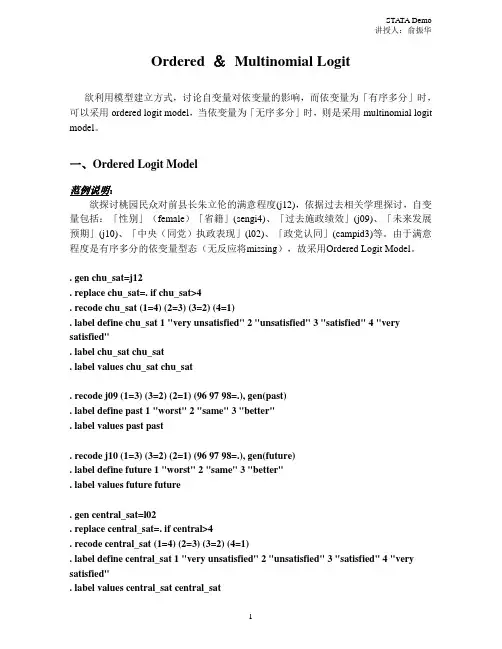
相关分析(Correlate)Correlation and dependenceIn statistics, correlation and dependence are any of a broad class of statistical relationships between two or more random variables or observed data values.Correlation is computed(用...计算)into what is known as the correlation coefficient(相关系数), which ranges between -1 and +1. Perfect positive correlation (a correlation co-efficient of +1) implies(意味着)that as one security(证券)moves, either up or down, the other security will move in lockstep(步伐一致的), in the same direction. Alternatively(同样的), perfect negative correlation means that if one security moves in either direction the security that is perfectly negatively correlated will move by an equal amount in the opposite(相反的)direction. If the correlation is 0, the movements of the securities are said to have no correlation; they are completely random(随意、胡乱).There are several correlation coefficients, often denoted(表示、指示)ρ or r, measuring(衡量、测量)the degree of correlation. The most common of these is the Pearson correlation coefficient, which is sensitive only to a linear(只进行两变量线性分析)relationship between two variables (which may exist even if one is a nonlinear function of the other).Other correlation coefficients have been developed to be more robust(有效的、稳健)than the Pearson correlation, or more sensitive to nonlinear relationships.Rank(等级)correlation coefficients, such as Spearman's rank correlation coefficient and Kendall's rank correlation coefficient (τ) measure the extent(范围)to which, as one variable increases, the other variable tends to increase, without requiring(需要、命令)that increase to be represented by a linear relationship. If, as the one variable(变量)increases(增加), the other decreases, the rank correlation coefficients will be negative. It is common to regard these rank correlation coefficients as alternatives to Pearson's coefficient, used either to reduce the amount of calculation or to make the coefficient less sensitive to non-normality in distributions(分布). However, this view has little mathematical basis, as rank correlation coefficients measure a different type of relationship than the Pearson product-moment correlation coefficient, and are best seen as measures of a different type of association, rather than as alternative measure of the population correlation coefficient.Common misconceptions(错误的想法)Correlation and causality(因果关系)The conventional(大会)dictum(声明)that "correlation does not imply causation" means that correlation cannot be used to infer a causal relationship between the variables.Correlation and linearityFour sets of data with the same correlation of 0.816The Pearson correlation coefficient indicates the strength of a linear relationship between two variables, but its value generally does not completely characterize their relationship. In particular, if the conditional mean of Y given X, denoted E(Y|X), is not linear in X, the correlation coefficient will not fully determine the form ofE(Y|X).The image on the right shows scatterplots(散点图)of Anscombe's quartet, a set of four different pairs of variables created by Francis Anscombe. The four y variables have the same mean (7.5), standard deviation (4.12), correlation (0.816) and regression line (y = 3 + 0.5x). However, as can be seen on the plots, the distribution of the variables is very different. The first one (top left) seems to be distributed normally, and corresponds to what one would expect when considering two variables correlated and following the assumption of normality. The second one (top right) is not distributed normally; while an obvious relationship between the two variables can be observed, it is not linear. In this case the Pearson correlation coefficient does not indicate that there is an exact functional relationship: only the extent to which that relationship can be approximated(大概)by a linear relationship. In the third case (bottom left), the linear relationship is perfect, except for one outlier which exerts enough influence to lower the correlation coefficient from 1 to0.816. Finally, the fourth example (bottom right) shows another example when one outlier(异常值)is enough to produce a high correlation coefficient, even though the relationship between the two variables is not linear.(离群值可降低、也可以增加数据的相关性。


相关分析(Correlate)Correlation and dependenceIn statistics, correlation and dependence are any of a broad class of statistical relationships between two or more random variables or observed data values.Correlation is computed(用...计算)into what is known as the correlation coefficient(相关系数), which ranges between -1 and +1. Perfect positive correlation (a correlation co-efficient of +1) implies(意味着)that as one security(证券)moves, either up or down, the other security will move in lockstep(步伐一致的), in the same direction. Alternatively(同样的), perfect negative correlation means that if one security moves in either direction the security that is perfectly negatively correlated will move by an equal amount in the opposite(相反的)direction. If the correlation is 0, the movements of the securities are said to have no correlation; they are completely random(随意、胡乱).There are several correlation coefficients, often denoted(表示、指示)ρ or r, measuring(衡量、测量)the degree of correlation. The most common of these is the Pearson correlation coefficient, which is sensitive only to a linear(只进行两变量线性分析)relationship between two variables (which may exist even if one is a nonlinear function of the other).Other correlation coefficients have been developed to be more robust(有效的、稳健)than the Pearson correlation, or more sensitive to nonlinear relationships.Rank(等级)correlation coefficients, such as Spearman's rank correlation coefficient and Kendall's rank correlation coefficient (τ) measure the extent(范围)to which, as one variable increases, the other variable tends to increase, without requiring(需要、命令)that increase to be represented by a linear relationship. If, as the one variable(变量)increases(增加), the other decreases, the rank correlation coefficients will be negative. It is common to regard these rank correlation coefficients as alternatives to Pearson's coefficient, used either to reduce the amount of calculation or to make the coefficient less sensitive to non-normality in distributions(分布). However, this view has little mathematical basis, as rank correlation coefficients measure a different type of relationship than the Pearson product-moment correlation coefficient, and are best seen as measures of a different type of association, rather than as alternative measure of the population correlation coefficient.Common misconceptions(错误的想法)Correlation and causality(因果关系)The conventional(大会)dictum(声明)that "correlation does not imply causation" means that correlation cannot be used to infer a causal relationship between the variables.Correlation and linearityFour sets of data with the same correlation of 0.816The Pearson correlation coefficient indicates the strength of a linear relationship between two variables, but its value generally does not completely characterize their relationship. In particular, if the conditional mean of Y given X, denoted E(Y|X), is not linear in X, the correlation coefficient will not fully determine the form ofE(Y|X).The image on the right shows scatterplots(散点图)of Anscombe's quartet, a set of four different pairs of variables created by Francis Anscombe. The four y variables have the same mean (7.5), standard deviation (4.12), correlation (0.816) and regression line (y = 3 + 0.5x). However, as can be seen on the plots, the distribution of the variables is very different. The first one (top left) seems to be distributed normally, and corresponds to what one would expect when considering two variables correlated and following the assumption of normality. The second one (top right) is not distributed normally; while an obvious relationship between the two variables can be observed, it is not linear. In this case the Pearson correlation coefficient does not indicate that there is an exact functional relationship: only the extent to which that relationship can be approximated(大概)by a linear relationship. In the third case (bottom left), the linear relationship is perfect, except for one outlier which exerts enough influence to lower the correlation coefficient from 1 to0.816. Finally, the fourth example (bottom right) shows another example when one outlier(异常值)is enough to produce a high correlation coefficient, even though the relationship between the two variables is not linear.(离群值可降低、也可以增加数据的相关性。

Ordered &Multinomial Logit欲利用模型建立方式,讨论自变量对依变量的影响,而依变量为「有序多分」时,可以采用ordered logit model,当依变量为「无序多分」时,则是采用multinomial logit model。
一、Ordered Logit Model范例说明:欲探讨桃园民众对前县长朱立伦的满意程度(j12),依据过去相关学理探讨,自变量包括:「性别」(female)「省籍」(sengi4)、「过去施政绩效」(j09)、「未来发展预期」(j10)、「中央(同党)执政表现」(l02)、「政党认同」(campid3)等。
由于满意程度是有序多分的依变量型态(无反应将missing),故采用Ordered Logit Model。
. gen chu_sat=j12. replace chu_sat=. if chu_sat>4. recode chu_sat (1=4) (2=3) (3=2) (4=1). label define chu_sat 1 "very unsatisfied" 2 "unsatisfied" 3 "satisfied" 4 "very satisfied". label chu_sat chu_sat. label values chu_sat chu_sat. recode j09 (1=3) (3=2) (2=1) (96 97 98=.), gen(past). label define past 1 "worst" 2 "same" 3 "better". label values past past. recode j10 (1=3) (3=2) (2=1) (96 97 98=.), gen(future). label define future 1 "worst" 2 "same" 3 "better". label values future future. gen central_sat=l02. replace central_sat=. if central>4. recode central_sat (1=4) (2=3) (3=2) (4=1). label define central_sat 1 "very unsatisfied" 2 "unsatisfied" 3 "satisfied" 4 "very satisfied". label values central_sat central_satSTATA语法:ologit Y X1 X2 X3 [iw=var.]. ologit chu_sat female i.sengi4 past future central_sat i.campid3其它相关的次指令,或是Postestimation Analysis等相关指令,皆与Binary Logit Model 相同,请自行参阅及利用。


第九章相关分析――Correlate菜单详解(医学统计之星:张文彤)上次更新日期:9.1 Bivariate过程9.1.1 界面说明9.1.2 分析实例9.1.3 结果解释9.2 Partial过程9.2.1 界面说明9.2.2 结果解释9.3 Distances过程在医学中经常要遇到分析两个或多个变量间关系的情况,有时是希望了解某个变量对另一个变量的影响强度,有时则是要了解变量间联系的密切程度,前者用下一章将要讲述的回归分析来实现,后者则需要用到本章所要讲述的相关分析实现。
SPSS的相关分析功能被集中在Statistics菜单的Correlate子菜单中,他一般包括以下三个过程:∙Bivariate过程此过程用于进行两个/多个变量间的参数/非参数相关分析,如果是多个变量,则给出两两相关的分析结果。
这是Correlate子菜单中最为常用的一个过程,实际上我们对他的使用可能占到相关分析的95%以上。
下面的讲述也以该过程为主。
∙Partial过程如果需要进行相关分析的两个变量其取值均受到其他变量的影响,就可以利用偏相关分析对其他变量进行控制,输出控制其他变量影响后的相关系数,这种分析思想和协方差分析非常类似。
Partial过程就是专门进行偏相关分析的。
∙Distances过程调用此过程可对同一变量内部各观察单位间的数值或各个不同变量间进行距离相关分析,前者可用于检测观测值的接近程度,后者则常用于考察预测值对实际值的拟合优度。
该过程在实际应用中用的非常少。
§9.1Bivariate过程9.1.1 界面说明【Variables框】用于选入需要进行相关分析的变量,至少需要选入两个。
【Correlation Coefficients复选框组】用于选择需要计算的相关分析指标,有:∙Pearson复选框选择进行积距相关分析,即最常用的参数相关分析∙Kendall's tau-b复选框计算Kendall's等级相关系数∙Spearman复选框计算Spearman相关系数,即最常用的非参数相关分析(秩相关)【Test of Significance单选框组】用于确定是进行相关系数的单侧(One-tailed)或双侧(Two-tailed)检验,一般选双侧检验。
简述相关分析的概念及流程下载温馨提示:该文档是我店铺精心编制而成,希望大家下载以后,能够帮助大家解决实际的问题。
文档下载后可定制随意修改,请根据实际需要进行相应的调整和使用,谢谢!并且,本店铺为大家提供各种各样类型的实用资料,如教育随笔、日记赏析、句子摘抄、古诗大全、经典美文、话题作文、工作总结、词语解析、文案摘录、其他资料等等,如想了解不同资料格式和写法,敬请关注!Download tips: This document is carefully compiled by theeditor. I hope that after you download them,they can help yousolve practical problems. The document can be customized andmodified after downloading,please adjust and use it according toactual needs, thank you!In addition, our shop provides you with various types ofpractical materials,such as educational essays, diaryappreciation,sentence excerpts,ancient poems,classic articles,topic composition,work summary,word parsing,copy excerpts,other materials and so on,want to know different data formats andwriting methods,please pay attention!相关分析是研究两个或多个变量之间关系的一种统计方法,主要目的是探讨变量之间的线性关系。
correlate用法Correlate 是一个常见的英语单词,它的用法比较广泛,涉及到数据分析、科学研究、语言表达等方面。
以下是对 correlate 用法的分步解析。
一、数据分析在数据分析领域,correlate 通常被用来表示变量之间的相关性。
这种相关性可以用 Pearson 相关系数来衡量,它的取值范围从 -1 到1,其中 -1 表示完全负相关,0 表示完全不相关,1 表示完全正相关。
例如,我们可以使用 Excel 中的 CORREL 函数来计算两个变量之间的相关系数,如下所示:=CORREL(A1:A10, B1:B10)这个公式的结果是一个小数,它表示 A 列和 B 列之间的相关性程度。
二、科学研究在科学研究中,correlate 也常常被用来表示一种变量与另一种变量之间的关系。
例如,在心理学研究中,研究人员可以使用correlate 来探索某个人格特征与其他行为的相关性。
在这种情况下,研究人员需要采集大量的数据,并使用统计软件来计算相应的相关系数。
他们还需要使用适当的图表来展示数据,以便更好地理解变量之间的关系。
三、语言表达在语言表达方面,correlate 可以用来表示两个不同事物之间的联系。
例如,在英语写作中,一个句子或段落可以使用 correlate 来表达它们之间的关系。
例如,我们可以使用如下句式:"The increase in temperature correlates with thedecrease in atmospheric pressure."这个句子的意思是“温度上升与大气压力下降有关系”。
通过这样的句式,我们可以更直观地表达不同事物之间的关系,从而使我们的语言更加精确和自然。
总结:综合来看,correlate 是一个十分重要的英语单词,它的应用范围非常广泛。
无论是在数据分析、科学研究还是语言表达方面,它都具有重要的作用。
因此,我们应该充分学习和掌握这个单词的用法,以便更好地应用到实际生活和工作中。
correlate用法介绍在统计学和数据分析中,correlate一词指的是两个变量之间的关联程度。
简单来说,correlate用于衡量两个变量是否呈现出类似的趋势或变化模式。
通过计算相关系数,我们可以了解两个变量之间的线性关系强度和方向。
相关系数的定义皮尔逊相关系数皮尔逊相关系数是最常用的一种相关系数。
它衡量的是两个变量之间的线性关系程度,取值范围为-1到1。
相关系数为正值表示两个变量呈正相关,即一个变量增加,另一个变量也会相应增加;相关系数为负值表示两个变量呈负相关,即一个变量增加,另一个变量会相应减少;相关系数为0表示两个变量之间没有线性关系。
斯皮尔曼相关系数斯皮尔曼相关系数是一种非参数相关系数,用于衡量两个变量之间的单调关系,即在一个变量增加的情况下,另一个变量是增加还是减少。
斯皮尔曼相关系数的取值范围也是-1到1,与皮尔逊相关系数一样,相关系数为正值表示两个变量呈正相关,相关系数为负值则表示两个变量呈负相关。
判定系数判定系数(coefficient of determination),也称为R方值,用于衡量一个变量能否被另一个变量线性拟合的程度,其取值范围在0到1之间。
R方值越接近1,表示拟合程度越好,即一个变量能够较好地解释另一个变量的变异。
相关系数的计算方法皮尔逊相关系数的计算方法皮尔逊相关系数的计算方法比较简单,可以通过以下公式计算:其中,n表示样本数量,X和Y分别表示两个变量的取值,μX和μY分别表示两个变量的均值,σX和σY表示两个变量的标准差。
斯皮尔曼相关系数的计算方法斯皮尔曼相关系数的计算方法稍微复杂一些。
首先,需要将两个变量的取值按照大小顺序进行排列,并计算出两个变量的秩次值。
然后,可以使用以下公式计算斯皮尔曼相关系数:其中,d表示两个变量的秩次差,n表示样本数量。
判定系数的计算方法判定系数的计算方法比较简单,可以通过以下公式进行计算:其中,SSR表示回归平方和,SST表示总平方和。
相关性分析(c o r r e l a t i o n-a n a l y s i s)相关性分析(correlation analysis)➢概述相关性分析可以用来验证两个变量间的线性关系,从相关系数r我们可以知道两个变量是否呈线性关系、线性关系的强弱,以及是正相关还是负相关。
➢适用场合·当你有成对的数字数据时;·当你画了一张散点图,发现数据有线性关系时;·当你想要用统计的方法测量数据是否落在一条线上时。
➢实施步骤尽管人工可以进行相关性分析,然而计算机软件可以使计算更简便。
按照以下的介绍来使用你的软件。
分析计算出相关性系数r,它介于-l到1之间。
·如果r接近0则两个变量没有线性相关性;·当r接近-l或者1时,说明两个变量线性关系很强;·正的r值代表当y值很小时x值也很小,当y值很大时r值也很大;·负的r值代表当y值很大时x值很小,反之亦然。
➢示例图表5.39到图表5.42给出了两个变量不同关系时的散点图。
图表5.39给出了一个近似完美的线性关系,r=0.98;图表5.40给出了一个弱的负线性相关关系,R=-0. 69,与图表5.39比较,数据散布在更宽的范围内;在图表5.41中,两个变量不相关,r=0.l5;在图表5.42中,相关性分析计算出相同的r值——=0.15,但是,在这个情况下显然两个变量是相关的,尽管不是线性的。
➢注意事项·如果,r=0,则变量不相关,但是可能有弯曲的相关性,如图表5.42那样。
为避免这种情况,首先画出数据的散点图来判断它们的关系。
相关性分析只对于存在线性关系的变量有意义。
·相关性分析可以证实两个变量间关系的强弱,但不能计算出那条回归线,如果想找到最符合的线,请参阅回归分析。
·对于系数的决定,回归分析中使用r2,它是相关系数r一的平方。
END。
相关性分析的流程(中英文版)Title: The Process of Correlation AnalysisTitle: 相关性分析的流程Introduction:Correlation analysis is a statistical method used to determine the strength and direction of the relationship between two variables.It is widely applied in various fields, including finance, economics, psychology, and social sciences.This document outlines the step-by-step process of conducting a correlation analysis.引言:相关性分析是一种统计方法,用于确定两个变量之间的强度和方向关系。
它广泛应用于金融、经济学、心理学和社会科学等领域。
本文概述了进行相关性分析的步骤。
Step 1: Define the Research QuestionBefore starting the correlation analysis, it is essential to clearly define the research question or objective.This will help in identifying the relevant variables and determining the appropriate correlation measure.第一步:定义研究问题在开始相关性分析之前,明确定义研究问题或目标至关重要。
这将有助于识别相关变量并确定适当的关联度量。
Step 2: Collect DataCollect relevant data for the variables of interest.Ensure that the data is accurate, reliable, and collected from a representative e appropriate data collection methods, such as surveys, experiments, or secondary data sources.第二步:收集数据收集感兴趣变量的相关数据。