performancemeasurement.docx.doc
- 格式:doc
- 大小:42.50 KB
- 文档页数:7
PerformanceMeasurementonARMPerformance Measurement on ARMAfter working mostly with different ARM processors in the 200...400 MHz range in lots of Embedded Linux projects over the last years, we have seen an interesting development in the market recently:•ARM cpus, having been known fortheir low power consumption, arebecoming faster and faster (example:OMAP3, Beagleboard, MX51/MX53).•x86, having been known for its highcomputing performance, is becomingmore and more SoC-like, power friendlyand slower.If you read the marketing stuff from the chip manufacturers, it sounds like if ARM is the next x86 (in terms of performance) and x86 is the next ARM (in terms of power consumption). But where do we stand today? How fast are modern ARM derivates?The Pengutronix Kernel team wanted to know, and so we measured, in order to get some real numbers. Here are the results, and they turn up some interesting questions. Don't take the "observations" below too scientifically - I try to sum up the results in short claims.As ARM is explicitly a low power architecture, it would have been interesting to measure some "performance vs. power consumption" data. However, as we have done our experiments on board level products, this couldn't be done. Somemanufacturers tend to put more peripheral chips on their modules than others, so we would have only measured the effects of the board BoMs.Test HardwareIn order to find out more about the real speed of today's hardware, we collected some typical industrial hardware in our lab, so this is the list of devices we have benchmarked:How fast are these boards? Yours truely assumed that the order in the table above does more or less reflect the systems in ascending performance order: PXA270 is a platform from the past, MX27 reflects the current generation of busmatrix optimized ARM9s, the ARM11 should be the next step there, Cortex-A8 appears to be the next killer platform and the Atom would probably be an order of magnitude above that.So let's look at what we've measured.BenchmarksExplanatory note: In the following charts, the "error" bars (sometimes merely visible) deviantly indicate the range between minimum and maximum values of ten benchmark cycles, while the bar height shows the arithmetic mean.Floating Point Multiplication (lat_ops)This benchmark measures the time for a floating point multiplication. It shall be an indication of the computation power and is heavily influenced by the fact whether a SoC has a hardware floating point unit or not. Here are the results:PXA270 50.90MX27 72.39MX35 15.08OMAP-EVM 20.13OMAP-Beagle 20.11Atom Z510 4.57 The PXA270 and i.MX27 both have no hardware floating point unit, so the difference between the plots seems to directly reflect the different CPU clock speed.An interesting observation is that the MX35 (ARM1136, 532 MHz) is faster than the OMAPs (Cortex-A8, 500 MHz). Thefrequency differs by 6%, whereas the speed is about 25% higher.Memory Bandwidth (bw_mem)We measure the memory transfer speed with the bw_mem benchmark.CPU Bandwidth [MB/s]PXA270 54.40MX27 101.30MX35 128.02OMAP-EVM 254.05OMAP-Beagle241.13Atom Z510 601.39Context Switching Time (lat_ctx)An important indicator of the system speed is the time to switch the CPU context. This benchmark measures the context switching time and it can be configured which number of processes with which size shall be tested. The processes are started, read a token from a pipe, perform a certain amount of work and give the token to the next process.CPU Context Switch Time [μs]PXA270 462.19MX27 130.40MX35 38.85OMAP-EVM 71.51OMAP-Beagle32.29AtomZ51012.4716 processes, 8 KiB eachSyscall Performance (lat_syscall)/cgi-bin/man?keyword=lat_syscall§ion=8In order to estimate the performance of calling operating system functionality, we measured the syscall latency with lat_sys. The benchmark performs an open() and close() on a 1 MB random data file located in a ramdisk (tmpfs), accessing the file with a relative path (absolute paths seem to give other results). The time for both operations after each other is measured.CPU Syscall Time[μs]PXA270 10.79 MX27 14.16 MX358.66 OMAP-EVM 13.67 OMAP-Beagle10.46 Atom Z5105.84The lat_proc benchmark forks processes and measures thetime to do so.CPU Fork Time [μs] PXA270 5426.4 MX27 3153.6 MX351365.6 OMAP-EVM 3052.63 OMAP-Beagle1687.63 Atom Z510390.66SpecificationsKernel and -configsAn approach has been made to uniformly use kernel 2.6.34 on all targets. After optimization, care has been taken to always set the following config options:•Tree-based hierarchical RCU•Preemptible Kernel (Low-Latency Desktop)•Choose SLAB allocator (SLAB)THUMB mode has never been used. Turning off NEON on the OMAP did not produce significantly different results. Using v5TE versus v4T is repeatedly showing worse results (not only on the OMAP), which we still not quite understand. Anyway, the figures published here for the OMAP have been obtained using a Cortex-A8 toolchain.LMbench command lineslat_opsroot@target:~ lat_ops 2>&1filtered bygrep "^float mul:" | cut -f3 -d" "bw_memroot@target:~ list="rd wr rdwr cp fwr frd bzero bcopy"; \for i in $list; \do echo -en "$i\t"; done; \echo; \for i in $list; \do res=$(bw_mem 33554432 $i 2>&1 | awk "{print \$2}"); \echo -en "$res\t"; done; \echo MB/Secfiltered byawk "/rd\twr\trdwr\tcp\tfwr\tfrd\tbzero\tbcopy/ { getline; print \$3 }"lat_ctxroot@target:~ list="0 4 8 16 32 64" amount="2 4 8 16 24 32 64 96"; \for size in $list; do lat_ctx -s $size $amount 2>&1; \donefiltered bygrep -A4 "^\"size=8k" | grep "^16" | cut -f2 -d" "lat_syscallroot@target:~ list="null read write stat fstat open"; \cd /tmp; \dd if=/dev/urandom of=test.pattern bs=1024 count=1024 2>/dev/null; \for i in $list; do echo -en "$i\t"; done; echo; \for i in $list; do \res=$(lat_syscall $i test.pattern 2>&1 | awk "{print \$3}"); \echo -en "$res\t"; done; echo microsecondsfiltered byawk "/null\tread\twrite\tstat\tfstat\topen/ { getline; print \$6 }"lat_procroot@target:~ list="procedure fork exec shell"; \cp /usr/bin/hello /tmp; \for i in $list; do echo -en "$i\t"; done ;echo; \for i in $list; do res=$(lat_proc $i 2>&1 | awk "{FS=\":\"} ; {print \$2}" \| awk "{print \$1}"); echo -en "$res\t"; done ; echo microsecondsfiltered byawk "/procedure\tfork\texec\tshell/ { getline; print \$2 }"Thinking about CachesThe influence of Linux caches is not much of an issue, as ensuring cold caches by directly preceding every lmbench invocation bysync; echo 3> /proc/sys/vm/drop_caches;leads to only slightly (0% to 3%, depending on type of benchmark) worse figures, which has been verified on several targets.GCC FlagsHere is an overview of the compiler variants used, with some of the relevant config switches (as shown by gcc -v) jotted down. The last column links to snippets taken from the output of objdump -d lat_ops.o, enabling comparison of the code used in float_mul.Resulting from the use of PTXdist as build system, the gcc flags in action are uniformly the same across all targets.With LMbench's bw_mem as an example, the complete compiler command line in its original order is-DPACKAGE_NAME=\"lmbench\"-DPACKAGE_TARNAME=\"lmbench\"-DPACKAGE_VERSION=\"trunk\"-DPACKAGE_STRING=\"lmbench\ trunk\"-DPACKAGE_BUGREPORT=\"*******************\"-DPACKAGE_URL=\"\"-DSTDC_HEADERS=1-DHAVE_SYS_TYPES_H=1-DHAVE_SYS_STAT_H=1-DHAVE_STDLIB_H=1-DHAVE_STRING_H=1-DHAVE_MEMORY_H=1-DHAVE_STRINGS_H=1-DHAVE_INTTYPES_H=1-DHAVE_STDINT_H=1-DHAVE_UNISTD_H=1-DHAVE_DLFCN_H=1-DLT_OBJDIR=\".libs/\"-DPACKAGE=\"lmbench\"-DVERSION=\"trunk\"-I.-I../include-I../include-isystem /home/.../sysroot-target/include-isystem /home/.../sysroot-target/usr/include -W-Wall-O2-DHAVE_uint-DHAVE_uint64_t-DHAVE_int64_t-DHAVE_socklen_t-DHAVE_DRAND48-DHAVE_RAND-DHAVE_RANDOM-MT bw_mem.o-MD-MP-MF .deps/bw_mem.Tpo-c-o bw_mem.obw_mem.cConclusionThese measurements are probably not completely scientifically correct. The intention was to give us a raw idea of how the systems perform.We expected the Cortex-A8 to be an order of magnitude faster than the ARM11. This doesn't seem to be the case. Only the memory bandwidth is much faster, but most of the other benchmarks show almost the same values. It's currently totally unclear to us where the performance win we expected from an ARMv7 over an ARMv6 core went to.There seems to be a pattern that, at double the clock frequency, the Atom is often three times faster than the ARM11/Cortex-A8.FeedbackDo you have any remarks, ideas about the observed effects and other things you might want to tell us? We want to improve this article with the help of the community. So please send us your feedback to the mail address in the box below.•Contact: Pengutronix Kernel Team •Author: Robert Schwebel。

Performance Measurement Challenges and Strategies(June 18, 2003)I. IntroductionThis document provides practical strategies for addressing common performance measurement challenges. It grew out of the workshop on performance measurement organized by the Office of Management and Budget (OMB) and the Council for Excellence in Government which was held on April 22, 2003.The document is meant to complement the Program Assessment Rating Tool (PART) guidance document (/PART), which also addresses performance measurement. Following this introduction, Section II discusses basic performance measurement definitions and concepts. Section III then discusses six common performance measurement problems that were the subject of break-out sections at the workshop.Many of the performance measurement issues that Federal program managers face are extremely difficult, and this document offers no easy solutions. Rather, this paper suggests some potentially useful strategies for addressing these issues. Suggestions on additional challenges, strategies, and examples are welcome, so that this document can evolve. Suggestions may be sent to performance@ or to any member of OMB’s Performance Evaluation Team.Performance measurement indicates what a program is accomplishing and whether results are being achieved. It helps managers by providing them information on how resources and efforts should be allocated to ensure effectiveness. It keeps program partners focused on the key goals of a program. And, it supports development and justification of budget proposals by indicating how taxpayers and others benefit.However, information provided by performance measurement is just part of the information that managers and policy officials need to make decisions. Performance measurement must often be coupled with evaluation data to increase our understanding of why results occur and what value a program adds. Performance measurement cannot replace data on program costs, political judgments about priorities, creativity about solutions, or common sense. A major purpose of performance measurement is to raise fundamental questions; the measures seldom, by themselves, provide definitive answers.Because performance measurement keeps a focus on results, it has been a central aspect both of the Government Results and Performance Act (GPRA) and of the PART. One goal of the PART is to try to ensure that the most relevant performance information is readily accessible to policy makers.The PART seeks to answer whether a program is demonstrating value to the taxpayer. In doing so, the PART sets a standard for performance information that is highbut also basic and compelling. Ideally, it seeks to demonstrate that a program 1) has a track record of results and 2) warrants continued or additional resources.We are far from having the data and ability to do such analysis on the full range of Federal programs. But, the identification of adequate performance measures is a necessary step in integrating performance information and budget decisions.II. Key Definitions and Concepts1. Definitions used in the PARTStrategic goals are statements of purpose or mission that agencies may include in a strategic plan. Strategic goals might not be easily measurable. For example, a strategic goal for a weather program might be protecting life and property, and promoting commerce and the quality of life, through accurate forecasts. To the greatest extent reasonable, the PART encourages agencies to use their strategic goals to develop specific, operational performance goals.Performance goals are the target levels of performance expressed as a measurable objective, against which actual achievement can be compared. Performance goals can be stated as either outcomes or outputs, but to be complete they should incorporate targets and timeframes into a performance measure.•Performance measures are the indicators or metrics that are used to gauge program performance. Performance measures can be either outcome or outputmeasures. Using again the example of a weather program, a measure might beaverage advance warning time for tornadoes. Performance measures correspondwith questions 2.1 and 2.3 in the PART.•Targets are the quantifiable or otherwise measurable characteristics that tell how well a program must accomplish a performance measure. The target for tornadowarning time, for example, might be an average of 20 minutes by the year 2008.Targets correspond with questions 2.2 and 2.4 in the PART.In summary, together with the performance measure, the targets and timeframes establish a performance goal. For the weather program example, the performance goal would be an average tornado warning time of 20 minutes by 2008.The PART requires two types of performance goals:•long-term performance goals address performance that is generally several years or more in the future. There are two basic types of long-term goals: 1) anannual performance goal in the future, (e.g., tornado warning times in 2008, orunit costs of an activity in 2010); and 2) the cumulative effect of annual activities(e.g., development of an AIDS vaccine by 2010). Long-term program goals arerequired under both GPRA (termed “general goals”) and the PART (questions 2.1 and 2.2).•annual performance goals should be stated in yearly increments (questions 2.3 and 2.4). For the weather program example, an annual performance goal mightinclude the same performance measure (advance warning time), but a lessambitious target (e.g., 15 minutes average warning time in 2005) due to lesswidespread use of advanced technologies.2. Outcomes, Outputs, and InputsOutcomes describe the intended result or consequence that will occur from carrying out a program or activity. Outcomes are of direct importance to beneficiaries and the public generally. While performance measures should distinguish between outcomes and outputs, there should be a logical connection between them, with outputs supporting outcomes in a logical fashion. The PART strongly encourages the use of outcomes because they are much more meaningful to the public than outputs, which tend to be more process-oriented or means to an end. Outcomes may relate to society as a whole or to the specific beneficiaries of programs, depending on the size and reach of the program.Example (see 2004 PART for Maternal and Child Health Block Grants (MCHBG)):•Long-term measure: National rate of maternal deaths per 100,000 live births in 2008.•Annual measure: National rate of illnesses and complications due to pregnancy per 100 deliveries in 2004.It is sometimes not possible to measure outcomes annually. In these cases, it is likely that output goals will be used for annual measurement.Example:An outcome goal for a space program might be to determine whether there is life on Mars by 2011; annual goals, however, might relate to accomplishing steps toward developing the exploration vehicle and systems.Outputs are the goods and services produced by a program or organization and provided to the public or others. They include a description of the characteristics and attributes (e.g., timeliness) established as standards.Example (see 2004 MCHBG PART):•Number of Medicaid-eligible children who receive MCHBG services.Managers are more likely to manage against outputs rather than outcomes. This is because output data is collected and reported more frequently, and outputs more typically correspond to activities and functions being directly controlled, as opposed to focusing on results. Nevertheless, outputs should help track a program’s progress toward reaching its outcomes.Outputs can include process measures (e.g., paper flow, adjudication), attribute measures (e.g., timeliness, accuracy, customer satisfaction), and measures of efficiency. They may be measured either as the total quantity of a good or service produced, or may be limited to those goods or services having certain attributes (e.g., number of timely and accurate benefit payments). Typically, outputs are measured at least annually.Inputs are resources, often measured in dollars, used to produce outputs and outcomes. Performance measures may include consideration of inputs, particularly in the context of cost-efficiency or unit costs. Programs are encouraged to consider the most meaningful level of such input measures. For example, cost-efficiency measures based on outputs per dollar will typically be more useful than measures of output per unit of personnel (such as Full Time Equivalents). Similarly, social costs may be more meaningful than Federal budget costs when evaluating effectiveness of regulatory programs. Inputs from State and local partners may be relevant in assessing the effectiveness of some programs matched by Federal assistance.3. Characteristics of good performance goalsThe key to assessing program effectiveness is measuring the right things. Performance measures should capture the most important aspects of a program’s mission and priorities. Appropriate performance goals should: 1) include both performance measures and targets; 2) focus on outcomes, but use outputs when necessary; and 3) include both annual and long-term measures and targets.Characteristics of good performance goals include:•Quality over quantity. Performance goals should be relevant to the core mission of the program and to the result the program is intended to achieve. Thisgenerally argues for quality over quantity, with a focus on a few good measures.However, programs should not feel compelled to collapse complex activities to a single measure, particularly if that measure is a proxy for the true objective.•Importance to budget decisions. Performance goals included in the PART should provide information that helps make budget decisions. Agencies can maintainadditional performance goals to improve the management of the program, butthey do not need to be included in the PART.•Public clarity. Performance goals should be understandable to the users of what is being measured. Publicize (internally and externally) what you are measuring.This also helps program partners understand what is expected from the program.•Feasibility. Performance goals should be feasible, but not the path of least resistance. Choose performance goals based on the relevancy of the outcomesand not for other reasons -- not because you have good data on a less relevantmeasure, for example. If necessary, terminate less useful data collections to help fund more useful ones.•Collaboration. Agencies and their partners (e.g., States, contractors) need to work together and not worry about “turf” – the outcome is what is important.4. Getting StartedDefining the right performance measures can sometimes be like talking to a four-year-old child – whatever you say, the response is always “Why? Why? Why?” Similarly, getting to a good measure can often grow out of asking why a certain activity, input, or output is important and what it is really trying to achieve that matters to the public. This kind of drilling down to get to the right outcome measure might look like this for a job training program:Example: Possible Measures for Job Training Programso Dollars appropriated to the program o Number and size of grantsWhy do these matter? What do they buy?Inputs:Funding (Federal and perhaps State and local)o Number of classes attended by program participants o Number of people trainedWhy do these matter? What result do they produce? Outputs:Products (e.g., classes taught, service delivered, participants serviced)o Number of people with useful skillso Number of people who get a job after leaving the program Why do these matter? Is this the result the public is seeking? Intermediate outcomes: (e.g., new knowledge, increased skills, changed behavior)o Number of program participants who remain employed for a specified time and increase their earningso Number of people who are self-sufficient Program outcome Societal outcomeConsidering the scope of a program is also key to identifying proper performance measures. For example, output goals were used in the 2004 PART for the U.S. Fish and Wildlife Service (USFWS) National Fish Hatchery System (NFHS) because of the difficulties in attributing success in achieving species conservation goals – a higher level outcome – based solely on propagation of hatchery fish. Success at the outcome goal of species conservation would be better assessed by considering a broader scope, such as the USFWS Fisheries Program, which includes both the hatchery (NFHS) and habitat improvement aspects of species conservation. In addition, while external factors such asother stakeholders’ actions and drought also affect species conservation, the Fisheries Program can take these into account as it develops its goals and carries out its activities. III. Common Performance Measurement IssuesBased on the April 22nd workshop and follow-up discussions, this portion of the document outlines six common performance measurement issues and offers possible strategies for addressing them. The issues address programs that: 1) have outcomes that are extremely difficult to measure; 2) are among many contributors to a desired outcome;3) have results that will not be achieved for many years; 4) relate to deterrence or prevention of specific behaviors; 5) have multiple purposes and funding that can be used for a range of activities; and 6) are administrative or process oriented.Whenever possible, the document provides examples of performance goals and 2004 PARTs that effectively address the problem at hand. All PART summaries and the completed PART worksheets can be found at/omb/budget/fy2004/pma.html.1. The program’s outcomes are extremely difficult to measureSome programs’ outcomes are inherently difficult to measure. For example, programs designed to address foreign policy objectives might fall into this category. By focusing on why a program is important and what makes it difficult to measure, the scope of the problem can sometimes be more specifically defined. Going through this process may also identify the root of the ‘difficult to measure’ problem as one of the other core problems identified in this document.challenges can often be traced back to fundamental Performancemeasurequestions about the program, which when reexamined may yield insights into better ways to assess effectiveness. As mentioned earlier, one way to reexamine those issues is to relentlessly ask “why?”•Why it is important that the program receive funding?•Why are program operations important?•Why does the program do what it does?•If the program were fabulously successful, what problem would it solve?•How would you know?This line of questioning should help clarify the program’s true purpose and what its desired outcome is, which should help determine what really needs to be measured. For example, a program’s purpose may be to support an international coalition. In trying to define a performance measure, it might be helpful to ask “Why is the success of that coalition important and what role does the program play in achieving that goal?”It also can be helpful to identify what core issues make measurement difficult. For example:•The program purpose is not clear.•The beneficiary or customer is not defined. Consider who are the direct and indirect beneficiaries. Who are the long- and short-term beneficiaries? If thegovernment does not do this, who would pay for it?•Stakeholders have a different view of the program than program managers. How would stakeholders be affected if the program did not exist? Are thereperformance measures for stakeholders that shed light on the program’seffectiveness?•Some programs are difficult to measure because data is not available. To help address this situation, ask the following questions: Why is data unavailable?What data is available? Can we fund the cost to find data? If data is notavailable, are there proxy measures that will indirectly measure the program’soutcomes? Do stakeholders have data that they generate to track the program?•If quantitative data is unavailable and inappropriate, consider using qualitative data, such as assembling a panel of experts on the topic. For example, inassessing the quality of public defenders’ services, a survey of judges may beuseful, and could complement output measures such as cost per case.2. The program is one of many contributors to the desired outcomeOften several Federal programs, programs from various levels of government (Federal, State, local), private-sector or non-profit activities, or even foreign countries all contribute to achieving the same goal. The contribution of any one Federal program may be relatively small or large. Examples of programs with these characteristics include international peacekeeping (PKO 2004 PART), special education pre-school grants (IDEA Preschool 2004 PART), highways (FHWA Highways 2004 PART), Vocational Education (2004 PART), and many education, labor, and housing formula grant programs.One approach to this situation is to develop broad, yet measurable, outcome goals for the collection of programs, while also having program-specific performance goals. For a collection of programs housed primarily in one Federal agency, a broad outcome measure may be one of the goals in an agency strategic plan (e.g., increasing the home ownership rate). The broad outcome goal can often be tracked using national data that is already being collected, while the program-specific goals may require more targeted data collection. Both the broad outcome goal and the program-specific goals could be addressed in the PART.Several Federal education programs, totaling nearly $14 billion,Example:contribute to helping children learn to read. One of those programs, Reading First State Grants, provides about $1 billion to help implement proven literacy reforms in schools with low reading scores.•Common outcome goal: Percentage of children in high-poverty schools reading proficiently by the end of third grade.•Reading First goal: Percentage of at-risk third graders receiving Reading First services who can read at or above grade level.It is important to “right size” the measure to suit the program. Sometimes a program is such a significant contributor, or leverages so many dollars, that an appropriate goal is a societal outcome. Other times it is more appropriate to write measures specific to program beneficiaries. There is no rule of thumb on where that threshold is. We suggest only that programs of similar size, or with a similar percentage contribution to the desired outcome, approach this issue similarly.Example:Several Federal programs provide student aid so that low and moderate income students can afford to attend college. Of these, only the Pell Grant program and the loan programs contribute a large enough share of student aid to merit a societal outcome. The Pell Grant program provides grants to nearly one-third of all college students, while about half of all students receive loans from or backed by the Federal government. In contrast, the College Work Study program reaches only about 6% of college students, and so the measures relate to the program participants only: •Federal Pell Grant long-term measure (see 2004 PART): College enrollment gap between low-income and high-income high school graduates.•College Work Study long-term measure: Rate of College Work Study students who complete their post-secondary education program.Sometimes programs are designed to work together toward a common goal, but each provides a different piece of the service or activity. In other cases, programs are designed to merge funds and support the same activities as well as goals; this is particularly true when Federal, State, and local dollars all contribute to reaching a common goal.When programs fund different activities and do not co-mingle funds, programs should be able to develop activity-specific performance goals that support the broader outcome. It is likely, however, that these will be output goals and the challenge will be agreeing on how each of the separate activities contributes to the outcome.When programs co-mingle funds in support of a goal, it is extremely difficult to assess the marginal impact of the program dollar since all funding supports similar activities. Programs may seek to claim responsibility for the entire outcome and output, despite having a shared, and sometimes small, role in the overall activity. However, we should seek to evaluate whether such claims are realistic. It may be useful in such situations to consider measures such as unit costs in terms of output per Federal dollar spent as well as the output per combined Federal, State and local dollars spent.There are three basic sets of questions that one would aim to answer with performance information:•First, is the overall effort working? Are there outcome measures for the overall effort/program? Are there evaluations?•Second, is the Federal contribution making a difference? Because withholding funding as an experiment is not a viable option, analysts should consider whether there are other ways of seeing what would happen in the absence of Federalfunding. Can one compare current funding to an earlier time when there was noFederal funding? Are there regions of the country where there is no Federalfunding?•Third, how is funding effort shared between Federal and non-Federal partners?How does the distribution of funding effort compare to measures of need or thedistribution of benefits?3. Results will not be achieved for many yearsIn some cases, the outcome of a program may not be realized for many years. In some cases, this can be addressed by identifying meaningful output-oriented milestones that lead to achieving the long-term outcome goal. Many research and development(R&D) programs, such as Hydrogen Technology (2004 PART) and Mars Exploration (2004 PART), fall into this category.To address this issue, a program should define the specific short- and medium-term steps or milestones to accomplish the long-term outcome goal. These steps are likely to be output-oriented, prerequisite accomplishments on the path toward the outcome goal. A road map can identify these interim goals, suggest how they will be measured, and establish an evaluation schedule to assess their impact on the long-term goal. It is important that these steps are meaningful to the program, measurable, and linked to the outcome goal.Example:The purpose of NASA’s Mars Exploration program is to explore Mars, focusing on the search for evidence of life. To that end, NASA defines spacecraft missions, which provide one level of measures to assess program effectiveness: mission success. Further, within each Mars mission, the program develops technologies; builds, launches, and operates robotic spacecraft; and performs research using the spacecraft instruments. While these steps take many years to complete, they provide many milestones against which a mission – and the program – can be monitored. Useful measures could include timeliness in achieving certain steps as well as percentage cost overruns.It may also be useful to track process-oriented measures, such as the extent to which programs make decisions based on competitive review. For example, research programs can have many uncertainties, including their expected outcomes. So, while research programs are encouraged to define measures that can track progress, not all will be able to. Such programs may rely, in part, on process measures, such as the extent to which the program uses merit-based competitive review in making awards.To qualitatively address the research itself, some programs develop measures to reflect meaningful external validation of the quality and value of the program’s research. To address the uncertainty of research outcomes, programs may also be able to demonstrate performance in terms of the broad portfolio of the efforts within the program. Expert independent evaluators might also help determine if the process of choosing appropriate long-term investments is fair, open and promises higher expected payoffs in exchange for higher levels of risk. Rotating evaluators periodically may help ensure independence and objectivity.Another solution is estimation of future results using computer models or expert panels. EPA uses the former to estimate cancer cases avoided.4. The program relates to deterrence or prevention of specific behaviorsPrograms with a deterrence or prevention focus can be difficult to measure for a variety of reasons. Most importantly, deterrence measurement requires consideration of what would happen in the absence of the deterrence program. Also, it is often difficult to isolate the impact of the individual program on behavior that may be affected by multiple other factors.programs: Coast Guard drug interdiction (2004 PART), Department of SampleLabor/Office of Federal Contract Compliance (2004 PART), Nuclear Regulatory Commission’s Inspection and Performance Assessment Program.If performance measures reflect a continuum from lower-level outputs to higher-level outcome measures related to the overall strategic goal, it is important for deterrence programs to choose measures that are far enough along the continuum that they tie to the ultimate strategic goal as well as to the program’s activity. This will help ensure that the measures are both meaningful and genuinely affected by the program. Care should be taken, as some measures may create perverse incentives if they do not reach the correct balance between output and outcome (e.g., measures that focus on enforcement actions, as opposed to crime rates).Example:A useful measure for the Coast Guard drug interdiction program could be the total volume of drugs entering the United States. This measure might be contrasted with drug seizure rates. High drug seizure rates might suggest that the Coast Guard interdiction strategies are effective. However, if the amount of drugs being sent rises significantly, and the number of seizures goes up to a lesser extent, the measure would still show that the Coast Guard program was effective, even though the volume of drugs getting through has increased substantially. In contrast, the total volume of drugs entering the U.S. is tied more closely to the overall strategic goal of reducing the flow of drugs into the country. On the downside, the Coast Guard has only partial control over the measure of volume entering the country.Establishing deterrence targets. For some programs, deterring a majority of the negative outcome is appropriate. For other programs, most, if not all, of the negativeoutcome must be avoided. In principle, the target for the program should reflect consideration of the maximization of net benefits (see, for example, OMB guidance on rulemaking under E.O. 12866). In any event, understanding the costs and benefits of compliance at the margins will help the program to determine the correct target level for compliance.Example: For programs in which non-compliance is not life-threatening, and for which compliance is historically low, a legitimate long-term target may fall short of 100% compliance. In these cases, short-term targets that demonstrate forward progress toward the acceptable long-range goal may make sense.Programs where failure is not an option. For programs where failure to prevent a negative outcome would be catastrophic (including programs to prevent terrorism or nuclear accidents), traditional outcome measurement might lead to an “all-or-nothing” goal. As long as the negative outcome is prevented, the program might be considered successful, regardless of the costs incurred in prevention or any close calls experienced that could have led to a catastrophic failure.However, proxy measures can be used to determine how well the deterrence process is functioning. These proxy measures should be closely tied to the outcome, and the program should be able to demonstrate -- such as through the use of modeling -- how the proxies tie to the eventual outcome. Because failure to prevent a negative outcome is catastrophic, it may be necessary to have a number of proxy measures to help ensure that sufficient safeguards are in place. Failure in one of the proxy measures would not lead, in itself, to catastrophic failure of the program as a whole; however, failure in any one of the safeguards would be indicative of the risk of an overall failure.Example: Outcome goals for the Nuclear Regulatory Commission of no nuclear reactor accidents, no deaths from acute radiation exposures from nuclear reactors, no exposure events at reactors, and no radiological sabotage are not necessarily sufficient to evaluate the program. There have been no occurrences of the above-mentioned events during the years 1999 to date. Therefore, annual goals used for the program include no more than one precursor event per year, no statistically significant adverse industry trends in safety performance, and no overexposures exceeding applicable regulatory limits. These proxy measures are useful to assess the ongoing effectiveness of this program.5. The program has multiple purposes and funding can be used for a range of activities.Some Federal programs are both large and diverse. They may be designed to address multiple objectives or support a broad range of activities or both. Block grant programs often have these characteristics, with the added feature of allowing grantees the flexibility to set priorities and make spending choices. Increased flexibility at the local level can limit efforts to set national goals and standards or create obstacles for ensuring accountability. In other cases, the program may focus on a limited set of activities which。

1. identify the responsibility centres and discuss how the performanceof each centre might be measured , including in your discussion examples of controllable and non-controllable factors● a responsibility centre is part of an organisation for whose activities amanager is deemed to be responsible. The types depend on the type of activities for which responsibility is carried●cost centre : manager is accountable only for costs that are under hiscontrol. Cost centres may be either standard cost centres, where output can be measured and the input needed for a given output can be specified.【production in a factory—standard costing】Or discretionary centres where output cannot be measured easily and the relationship between inputs and outputs cannot be specified. 【a health and safety dpartment in the government -- ZBB】. The manager is responsible for the cost of inputs.His performance can be measured by comparing actual performance with budgeted targets for price, usage, and efficiency. 【cost variances;】●revenue centre : the manager is only accountable for the revenuegeneration that is under his control. 【a sales team with a target area】the manager is only responsible for meeting sales targets in terms of sales volume, sales revenue or market share. 【both financial and non-financial】the manager is responsible for the revenue generated by outputs . the performance of a manager is assessed by comparing actual performance with budgeted targets for price, mix, and volume. 【variances】●profit centre: a combination of a cost centre and a revenue centre. Amanager is responsible for both production costs and sales revenue. The degree of responsibility is higher. The manager may be responsible for purchasing, production planning, product mix and pricing decisions. The performance of the manager may be assessed by the extent to which agreed targets for overall cost,revenue and profit have been achieved.【value for money—economy, efficiency, effectiveness】●investment centre : given additional responsibility for investment decisionsregarding working capital and the purchase and replacement of non-current assets. The performance of the manager is likely to be assessed with an aggregated measure that links periodic profit to the assets employed in the period. 【ROI】●it is critical that managers can be assessed only on the cash flows that areunder their control. If a manager has no control over a cash flow, he cannot influence its size or timing and so cannot be held responsibility for any value changes.●For example, in a production cost centre, the manager may be able tocontrol material usage, but can not influence over the material price, which is accountable by purchasing department.●In a revenue centre, a sales manager can hold responsibility for generatingrevenue, but might not have control over the selling price totally which ispartly determined by market conditions.●The manager of a profit centre will have control of operating costs, but willnot be able to influence the financing costs arising from investment decisions.●The manager of an investment centre could have his performanceassessed on profit before tax, but the profit should exclude overhead cost, that he cannot influence. Like, allocated head adminstration costs.2. discuss whether return on investment or residual income should beused to assess managerial performance in an investment centre●assessment of the performance of an investment centre will usuallyinclude a performance measure that relates profit to assets employed.●Return on investment expresses controllable profit as a percentage ofcaptical employed. It is thus a relative measure. It can be used to compare performance between investment centres. ROI also offers a way of assessing the past investment decisions made by an investment centre, since it is measured after these investment decisions have been made. To get a higher ROI, manager will be keen on maximising controllable profit.The desire to maximise can be assisted by the use of performance related pay and incentive schemes. But the manager may also be keen on minimising capital employed. This will encourage managers to dispose of obsolete equipment and minimise working capital, or result in disincentive to invest in projects with a ROI that is less than the current ROI. Or retain assets with a low written down value to genearate a higher ROI. Therefore, it can lead to sub-optimal decisions for the company as a whole. 【decision not to invest will not be consistent with the overall objectives of maximising shareholder wealth】●RI has been suggested as a way of overcoming some of the perceivedshortcomings of ROI. It is an absolute measure which means that comparisons between investment centres cannot be made directly. The major advantage of using RI is that the manager will accept all projects with a positive RI. So , this decision will increase the company’s overall return. Sub-optimal decisions should therefore be reduced or eliminated.However, ageing assets could also increase RI.●Although, RI is superior to ROI in theory, ROI appears in practice to bepreferred to RI. 【maybe because it assists in comparisons between divisions】✋ROI = controllable profit (after depreciation ) / capital employed✋RI = controllable profit – capital employed * %✋― Capital employed ―may be replace by ―non-current assets‖【based on net value after depreciation】✋Capital employed = total assets – current liabilities✋Problems from using ROI:✋Dispose of obosolete equipment to minimise working captial✋Disincentive to invest in projects with a ROI less than the current one✋Retain assets with a lower written down value, since ageing assets can simple leads to increasing ROI✋Consequences : short-term concerns can outweigh longer-term interest.Decisions not to invest will not be consistent with the overall objectives of maximising the shareholder wealth.Working capital = current assets – current liabilitiesCapital employed = total assets – current liabilitiesNet assets value = total assets – total liabilities = equity valueNet value 【written down value 】= book value【original costs】-- depreciation ROCE= profit / capital employedROE= profit / equity = profit / net assets value3. assess the financial performance against its targets and reach a conclusionas to the promotion prospects/ bonus scheme4. revise the forecast to take account of all changes5. suggest two improvements to the performance measurement system interms of a longer term view6. comment on the use of ROI as a performance measure7. suggest and illustrate an alternative to ROI and give reasons8. explain the implications of using RI for evaluation9. briefly discuss the strengths and weakness of ROI and RI10. explain two further methods of assessment11. any additional ratios to assist in assessing the performance of the division Transfer price1. explain why a ―full cost plus‖ transfer pricing model may not be appropriate2. explain advantages and disadvantages of structuring the department asprofit centres3. discuss implications that a bonus scheme may have in performancemeasure for different divisions4. evaluate and discuss the impact of the group’s policies on profits of sellingand buying divisions and on group profit.5. comment on the performance based on the figures from the statements6. explain the problems that could arise for divisions and the group as a resultof giving full autonomy7. discuss problems that arise when setting up an overseas manufacturingdivision8. assess the financial performance of the new business during its first twoquarters.9. comment on each of the non-financial data10.。

Title 文件名Performance Measurement and Monitoring 绩效测量和监视Code编号Revision版本Responsible department 负责部门Author作者Verifier审核者Approver批准者Validity date生效期Content目录:1.Purpose目的2.Proactive Measures 主动测量3.Reactive Measures 被动测量4.Monitoring and Measure Equipment 测量和监视设备1.Purpose目的This procedure defines how to measure and monitor HSE system performance. The results of measurement and monitoring should be analyzed and used to identify both successes and areas requiring correction and improvement. 本程序定义了如何测量和监视HSE体系的绩效。
公司应分析和利用测量和监视的结果以识别须要纠正或改善的区域。
2.Proactive Measures 主动测量2.1Near Miss and Deviation report未遂偏差报告2.1.1P-HS-GE-008 Near Miss and Deviation is applied to establish a channel for associatesto participate in HSE management by reporting unsafe behaviors or conditions. 公司执行《P-HS-GE-008未遂偏差》以建立员工可以通过报告不安全行为或状态参与HSE管理的渠道。

Task 23Divisional performance measurementsReturn on investment (ROI) & Residual income (RI)Transfer pricingTask 23-1Return on investment (ROI) & Residual income (RI)Divisional responsibility accounting:Type of division DescriptionTypical performancemeasureCost centre Division incurs costs but has norevenue stream.Cost per unit,Cost variance,NFPIs related to quality,Productivity efficiencyProfit centre Division has both costs andrevenue. Manager does not havethe authority to invest in newassets or dispose existing onesTotal sales, Marketshare, Controllableprofit, NFPIsInvestment centre Division has costs and revenuemanager does have the authorityto in new assets or dispose ofexisting onesROI,RIThe following are some of the areas which require control within a division:(i) Generation of revenues(ii) Investment in non-current assets(iii) Investment in working capital(iv) Apportioned head office costsWhich of the above does the manager have control over in an investment centre?A.(i), (ii) and (iii) onlyB.(ii), (iii) and (iv) onlyC.(i), (ii) and (iv) onlyD.All of the aboveReturn on investment (ROI)Controllable profit: usually use profit after depreciation butbefore tax. In the exam you should use the profit figure thatis closest to this and assume the profit is controllableunless told otherwise..Capital employed: total assets less long term liabilities ortotal equity plus long term debt. Use net assets if capitalemployed is not given.Non-current assets could be valued at cost, net replacementcost or net book value.ROI = × 100%Controllable profitCapital employedExample:Division A is an investment centre. It has reported profit of$35000, Non-current assets at net book value of $210,000inventory of $30000 and trade receivables of $40000. It hastrade payables of $8000.Calculate the ROI for this division.Capital employed = total assets - current liability= non current assets + current Assets - current liability= 210000 + 30000 + 40000 - 8000 = $272000ROI = ×100% = 35000 /272000×100% = 12.87% Controllable profit Capital employedAdvantages of ROI:It is widely used and acceptable.It enables comparisons between divisions or companies of different sizes.Disadvantages of ROI:It may lead to dysfunctional decision making.ROI increases with the age of the asset if NBV are used.It encourages the manipulation of figures to improve results. It is not appropriate to compare companies that have different accounting policiesIt focuses on the short-term performanceExample:Park Ltd has division A and division B.Division A has a project costing $300,000 and providing annual returns of $35,000. Division B has a project costing $300,000 and providing annual returns of $30,000. The company cost of capital is 15%. Divisional performance is judged on ROI and ROI related bonus is high enough to influence manager’s behaviour.Required:What decisions will management make if they act in the best interests of their division?Division A Division BProfit 96000 5000Capital employed 600,000 100,000ROI 16% 5%ROI of project A = annual return / project cost = 35000/300000 ×100% = 11.67% ROI of project B = annual return / project cost = 30000/300000 × 100% = 10% < ROI of division A(16%) > ROI of division B(5%) Reject by the manager of division AAccept by the manager of division B Cost of capital for the company is 15% Both rejectResidual income (RI)RI = controllable divisional profit – notional interest on capital Controllable profit is same as ROI.Notional interest on capital = capital employed in the division ×notional cost of capital or interest rate.•Capital employed is same as ROI•The notional cost of capital could be the company’s cost of capitalAdvantages of RI:It overcomes the dysfunctional behaviour by ROI. Therefore, it encourages investment center managers to make new investments as long as it increases RI.It increases the awareness of cost of the assets controlled by investment center managersDisadvantages of RI:It does not provide the facility to compare divisions’performance because RI is driven by the size of divisions.It uses accounting information which may be manipulated.You’re a Champion! Thanks for staying with us. You have finished this task.Task 23-2 Transfer pricingTransfer pricingTransfer price is the price of goods or services transferred from one division to another division within the same organization Objectives of a transfer pricing system•Goal congruence-the organization profit is maximized •Performance measurement-the divisional performance is not affected•Autonomy•Assist recording the movement of goods and servicesTransfer pricingThe limits within which transfer prices should fall are as follows.•The minimum:Transfer pricingThe limits within which transfer prices should fall are as follows.•The maximum.:Opportunity costMinimum Maximum Company Variable cost+ Opportunity cost External marketpriceGoalCongruenceIf an external marker exists for the intermediate product, opportunity cost is equal to contribution foregone. If no external market, the opportunity cost is likely to be nil.Opportunity costSetting the transfer priceMarket based approachThe transfer price can be set at the external market price if the market exists for the transferred goods or services. The production division is able to obtain a market for all of its production capacity.To selling division: receive same amount for any internal and external sales.To buying division: happy to accept the transfer price as no elsewhere is cheaper.To company:goal congruence is not affected.Setting the transfer priceCost based approach•Full cost•Marginal cost•Standard full cost %•Standard marginal cost %Full costStandard Full costSelling division Buying division Company Doesn’t receiveany profit ontransfers Happy toaccept transferMay lead to dysfunctional behaviorMay not transfer unless it has spare capacityMarginal costMarginal costSelling division Buying division Company Doesn’t receiveany contributiontowards fixedcosts or profit Happy toaccepttransferMay lead to dysfunctional behaviorWill not want to transfer unless it has sparecapacityStandard full cost %Standard Full cost + %Selling division Buying division Company Covers all costsand makes acontribution towards profitMay lead to dysfunctional behaviorWill not want totransferPrice may be higher than market price May not wish to accept transferStandard marginal cost %Standard marginal cost + %Selling division Buying division Company May not coverall fixed costs Likely to behappy to accepttransfer(assuming percentage is not so large thatfinal price exceeds marketprice)May lead to dysfunctional behaviorMay not wish to transfer if percentage does not provideenough contribution towards fixedcostsDivisional performancemeasuresResponsibility accounting ROI-Return On InvestmentRI-Residual IncomeInvestment centre performance appraisal methods Transfer pricingApproaches•Market based•Cost based•Opportunity costAimsYou’re a Champion! Thanks for staying with us. You have finished this task.。
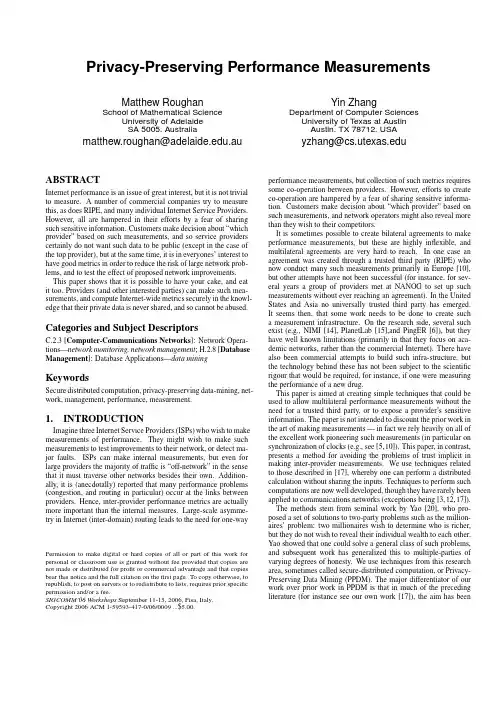
Privacy-Preserving Performance MeasurementsMatthew RoughanSchool of Mathematical ScienceUniversity of AdelaideSA5005,Australia matthew.roughan@.auYin Zhang Department of Computer Sciences University of Texas at AustinAustin,TX78712,USAyzhang@ABSTRACTInternet performance is an issue of great interest,but it is not trivial to measure.A number of commercial companies try to measure this,as does RIPE,and many individual Internet Service Providers. However,all are hampered in their efforts by a fear of sharing such sensitive information.Customers make decision about“which provider”based on such measurements,and so service providers certainly do not want such data to be public(except in the case of the top provider),but at the same time,it is in everyones’interest to have good metrics in order to reduce the risk of large network prob-lems,and to test the effect of proposed network improvements. This paper shows that it is possible to have your cake,and eat it too.Providers(and other interested parties)can make such mea-surements,and compute Internet-wide metrics securely in the knowl-edge that their private data is never shared,and so cannot be abused. Categories and Subject DescriptorsC.2.3[Computer-Communications Networks]:Network Opera-tions—network monitoring,network management;H.2.8[Database Management]:Database Applications—data mining KeywordsSecure distributed computation,privacy-preserving data-mining,net-work,management,performance,measurement.1.INTRODUCTIONImagine three Internet Service Providers(ISPs)who wish to make measurements of performance.They might wish to make such measurements to test improvements to their network,or detect ma-jor faults.ISPs can make internal measurements,but even for large providers the majority of traffic is“off-network”in the sense that it must traverse other networks besides their own.Addition-ally,it is(anecdotally)reported that many performance problems (congestion,and routing in particular)occur at the links between providers.Hence,inter-provider performance metrics are actually more important than the internal rge-scale asymme-try in Internet(inter-domain)routing leads to the need for one-way Permission to make digital or hard copies of all or part of this work for personal or classroom use is granted without fee provided that copies are not made or distributed for profit or commercial advantage and that copies bear this notice and the full citation on thefirst page.To copy otherwise,to republish,to post on servers or to redistribute to lists,requires prior specific permission and/or a fee.SIGCOMM’06Workshops September11-15,2006,Pisa,Italy.Copyright2006ACM1-59593-417-0/06/0009...$5.00.performance measurements,but collection of such metrics requires some co-operation between providers.However,efforts to create co-operation are hampered by a fear of sharing sensitive informa-tion.Customers make decision about“which provider”based on such measurements,and network operators might also reveal more than they wish to their competitors.It is sometimes possible to create bilateral agreements to make performance measurements,but these are highly inflexible,and multilateral agreements are very hard to reach.In one case an agreement was created through a trusted third party(RIPE)who now conduct many such measurements primarily in Europe[10], but other attempts have not been successful(for instance,for sev-eral years a group of providers met at NANOG to set up such measurements without ever reaching an agreement).In the United States and Asia no universally trusted third party has emerged. It seems then,that some work needs to be done to create such a measurement infrastructure.On the research side,several such exist(e.g.,NIMI[14],PlanetLab[15],and PingER[6]),but they have well known limitations(primarily in that they focus on aca-demic networks,rather than the commercial Internet).There have also been commercial attempts to build such infra-structure,but the technology behind these has not been subject to the scientific rigour that would be required,for instance,if one were measuring the performance of a new drug.This paper is aimed at creating simple techniques that could be used to allow multilateral performance measurements without the need for a trusted third party,or to expose a provider’s sensitive information.The paper is not intended to discount the prior work in the art of making measurements—in fact we rely heavily on all of the excellent work pioneering such measurements(in particular on synchronization of clocks(e.g.,see[5,10]).This paper,in contrast, presents a method for avoiding the problems of trust implicit in making inter-provider measurements.We use techniques related to those described in[17],whereby one can perform a distributed calculation without sharing the inputs.Techniques to perform such computations are now well developed,though they have rarely been applied to communications networks(exceptions being[3,12,17]). The methods stem from seminal work by Yao[20],who pro-posed a set of solutions to two-party problems such as the million-aires’problem:two millionaires wish to determine who is richer, but they do not wish to reveal their individual wealth to each other. Yao showed that one could solve a general class of such problems, and subsequent work has generalized this to multiple-parties of varying degrees of honesty.We use techniques from this research area,sometimes called secure-distributed computation,or Privacy-Preserving Data Mining(PPDM).The major differentiator of our work over prior work in PPDM is that in much of the preceding literature(for instance see our own work[17]),the aim has beento perform data-mining on datasets collected by multiple parties. Each party holds one piece of data,and we wish to perform some algorithm(e.g.,regression)on the collection of data.However,in our case,the measurements themselves are distributed.To clar-ify,in[17]the measurements to be combined were intra-domain measurements(for example of traffic volumes),which can be per-formed by a single network operator.The goal was to apply PPDM to combine each of these individual datasets to form a global pic-ture(e.g.,of the total Internet traffic).In this paper we consider inter-domain measurements,where the measurements themselves require the co-operation of multiple providers.We show that there are many problems one can solve in this domain:for example,our methods allow a provider to determine its average inter-domain delay without any provider learning inter-domain delays between specific providers.Thus one can measure one’s own performance without learning any sensitive information about other networks.The methods applied are actually rather sim-ple,requiring only basic mathematical and cryptographic opera-tions,though measuring delay in the presence of packet loss(where we cannot reveal which packets are lost)is somewhat more chal-lenging.We present a new PPDM algorithm that allows computa-tion of average delays where some probe packets are dropped. 2.THE PROBLEMWe pose a simple inter-provider performance measurement prob-lem.A group of N Internet Service Providers(ISPs)wish to be able to measure their inter-domain performance.They can do so by sending probe packets between servers on each network and mea-suring the delays these packets experience.However,they each have concerns about the other learning any information about their network.In particular,imagine that they do not wish anyone to learn the delays between their network,and any other network.It appears on the surface that this is an intractable problem.How can we use such measurements without automatically learning the im-plicit information in the measurements?First,let us refine our notation to allow a precise description of the problem.Imagine that the N providers send probe packets be-tween networks during measurement interval[0,T],and record the transmission and arrival times of the packets12.Note however,that they will not share this information.Formally,we define t(k)ijandr(k) ij to be the transmission and receive times,respectively,of thek th probe packet between networks i and j.The delay(or latency)measurement is given by d(k)ij =r(k)ij−t(k)ij.The data is initiallypartitioned in the sense thatt(k)ijis known to node i,r(k) ij is known to node j.(1)For the moment we shall only consider the case where no packets are dropped,though in Section4we generalize to allow packet loss. The average delay between nodes is defined to be¯D ij =1K ijK ijXk=1r(k)ij−t(k)ij=¯R ij−¯T ij.(2)where there are K ij probe packets between networks i and j,and¯R ij =1K ijP Kijk=1r(k)ijand¯T ij=1K ijP Kijk=1t(k)ij.The¯D ij areconsidered to be information that ISPs do not wish to allow to 1We assume that the clocks are carefully synchronized,which is non-trivial,but the issues have been well investigated[5,10].2A packet may arrive after the end of the measurement interval [0,T]which we use to specify the transmission times of packets.slip into the hands of their competitors.However,they do wish to know¯D outi,and¯D in i,the average delay of packets going out of, and coming into their network,as well as the average delay across all networks.Such data are useful for benchmarking themselves against the notional average provider,detecting network problems, and long-term planning.Formally,we wish keep the values¯D ij secret from all participants,but to compute¯D outi=1N−1NXj=1j=i¯Dij,(3)¯D ini=1N−1NXj=1j=i¯Dji,(4)¯D=1NXi=1¯D outi=1N Xi=1¯D ini.(5)The obvious approach to making such a calculation is for a trusted third party to collect the data,and share the results.In the absence of such a third party,there is another way to proceed,which we discuss in Section3.2.1AssumptionsIn any PPDM we must define the security model under consid-eration.We will assume here the commonly used“honest-but-curious”model.That is we assume that the ISPs in question are honest in the sense that they follow the algorithms correctly,but they are curious in the sense that they will perform additional op-erations in order to attempt to discover more information than in-tended.The honest-but-curious assumption has been widely used, and appears applicable here.ISPs will benefit from participating honestly in a such a scheme,and there is no downside in partici-pating honestly,and so dishonest partners in computation(partners who do not follow the algorithm)will reduce their own benefits, without any notional gain.It is noteworthy that while we assume that participants follow the algorithm correctly,we do allow collusion.Multiple partners are allowed to collude to attempt to learn more information than they otherwise could.The protocols we present can be made resistant to such collusion in the presence of a majority of non-colluding partic-ipants.Additionally,there is now a substantial literature on secure distributed computation and data mining(e.g.,see[1–4,18,20,21] and the references therein),and this literature considers many vari-ations on the type of assumptions considered here.It is likely that the assumption of honest-but-curious participants can therefore be substantially weakened.On the practical side of the measurements,we assume that the measurements themselves are accurate.We do not include any measurement noise,or artifacts(e.g.,such as might be introduced by imperfect clock synchronization).There is a large literature on performing such measurements(including IETF standards),and so we assume these problems are solved,though we realize that it may be non-trivial to do so,particular in the case of one-way mea-surements.We primarily consider one-way measurements here. Round-trip measurements can be performed(at least to a rough degree of accuracy)using mechanisms like’ping’without any co-operation.However inter-domain routing is fundamentally asym-metric,and so one-way measurements are far more useful.Forexample,a large discrepancy in¯D outiand¯D in i might be a useful indication that routing problems exist.There is an additional issue of importance here(as opposed to the majority of the PPDM literature).We consider inter-domainmeasurements here,that is,the measurements themselves are dis-tributed (not just the datasets in question).As such,the measure-ments must be carried out in such a way that they don’t reveal in-formation in themselves.We must take steps to avoid a receiver being able to infer packet loss/delay from its measurements alone.Hence•We avoid using a regular (uniform)sampling pattern for probe transmission times because this might allow the inference of delays (by the receiver),and also loss,through gaps in the pattern.•We avoid putting sequence numbers in packets,because once again,out-of-order packets could then be used to infer loss.The irregular sampling pattern we use is a Poisson Process (PP).Poisson probes have previously been proposed to avoid synchro-nization with network periodicities.Their advantage lies in the Poisson Arrivals See Time Averages (PASTA)property [19],and the fact that one cannot anticipate points in a PP [19].Poisson sampling removes any ability to anticipate when samples “should have”happened,and hence one cannot determine their ordering from their arrival time.Furthermore,when events are removed (at random)from a PP the resulting stream is also a PP,and hence loss would be much harder to infer from such a sequence.We might in-fer loss by observing the difference between the observed number of probe packets,and the (user configurable)probe rate,but where loss rates are small,and the observation time not unduly larger,this strategy is unlikely to provide any reasonable degree of accuracy,given the natural variability in the number of Poisson probes.3.THE SOLUTIONLet us delve slightly further into the calculation we wish to per-form,in particular to compute ¯D out i .From (2)and (3)we get¯Dout i =1N −1N X j =1j =i1K ijK ij X k =1h r (k )ij −t (k )iji =1264NX j =1j =i¯R ij −NX j =1j =i¯T ij 375(6)The second summation involves only terms such as t (k )ij and so is known to ISP i .However,ISP i does not know the receive times r (k )ij ,so the problem (for ISP i )becomes that of calculating¯Rout i =1N −1N X j =1,j =i¯Rij ,(7)the average receive time over the probes.Each of the terms ¯Rij is known to ISP j ,but we cannot directly share these values with ISPi because this would reveal ¯Dij for each j .The problem amounts to a distributed summation (a summation over a distributed set of datapoints),for which approaches are now well understood (see [4,17]and the references therein).There are at least three approaches to the problem with varying degrees of efficiency and robustness to collusion.We describe the simplest here for the purpose of exposition.The problem is a special case of the problem of computing V =P N j =1v j ,where the individual values v j are kept by ISP j ,and considered to be secret.We can perform the distributed summation as follows.Assume the value V is known to lie in the interval [0,n ],where n may be large.Start from a particular ISP (we will denote this ISP 1),and list the otherISPs in some order with labels 2,3,...,N .ISP 1generates a ran-dom number R uniformly on the interval [0,n ],adds R to its value v 1mod n ,and sends this to the next ISP,which adds its value,and repeats,until we get to the end of the sequence.The last ISP returns the total to ISP 1,who can then subtract the original random number R ,and compute the total (and then provide this number to the other ISPs).Formally we specify the algorithm byISP 1:randomly generate R ∼U (0,n )ISP 1:compute s 1=v 1+R mod n ISP 1:pass s 1to ISP 2for i=2to NISP i:compute s i =s i −1+v i mod n ISP i:pass s i to ISP i +1mod N endforISP 1:compute v N =s N −R mod n Each ISP i =2,...,N has only the information v i and s i −1,which can be written in full ass i =R +i X i =1v i mod n.(8)Since this value is uniformly distributed across the interval [0,n ],ISP i learns nothing about the other values v j ,j =i .At the last step,ISP 1has s N ,and when it subtracts R away it gets the V .Note that where we wish to allow computation of quantities that may be negative,the condition that V ∈[0,n ]can be easily replaced by V ∈[−n/2,n/2].The algorithm above requires only that we adjust the range of the initial sum (i.e.,in the second step ISP 1takes s 1=n/2+v 1+R mod n ),and that in the last step ISP 1reverses this addition (i.e.,v N =s N −n/2−R mod n ).Any ISP,given V can compute V −v i =Pj =i v i ,and so this approach only works for N >2,and in reality,where one could make meaningful guesses about some values,it is only really secure for reasonable values of N ,and this is the case we consider here.This incredibly simple process can,unfortunately,be corrupted if ISPs collude.If ISP l −1and ISP l +1share information,they can compute v l by taking s l −s l −1(s l is received by ISP l +1,and s l −1is sent by ISP l −1).There are various approaches to avoid this issue,as well as dealing with potentially unreliable partners in the summation,for instance see [17]for more discussion.Once we compute ¯R out i via a distributed summation,it is a sim-ple matter for ISP i to compute ¯D out i via (6).This approach pro-vides a powerful,yet very simple way of combining transmit andreceive times in such a way that we can compute the average per-formance without revealing the specifics.However,there are many generations,and we consider these below.3.1Other statisticsThere are many other possible statistics of interest.In particular,percentiles of the distribution of delay (including the median,or 50th percentile),the minimum,and maximum delays,and higher-order statistics such as variance.All of these may be calculated from the distribution of delays.Note that the distribution may also reveal information that is sensitive even if the computation proce-dure is secure 3,and so we must take this into consideration in any future work.Furthermore,note that the receive times may not be ordered,inthe sense that we may have r (k )ij >r (k +1)ij ,resulting in an am-biguity in packet measurements where the packets lack sequence3Any multiparty computation (secure or otherwise)gives out the result,and hence cannot be secure against revealing whatever can be deduced from the input of a party and the ultimate output.numbers.Figure 1shows a set of measurement times and two possible interpretations of these.The interpretation doesn’t mat-ter when computing the averages,but is very important for higher-order statistics.Without some kind of packet ID we cannot resolve these ambiguities.We might choose some kind of cryptographic approach to create packet IDs,but we suggest a simpler approach.r(1)r(2)r(4)r (5)r (6)r(3)(a) packet probe patternr(1)r(2)r (6)r(3)r (4)r(5)(b) alternative explanationFigure 1:Example transmission and receive patterns.Rather than try to preserve everything as secret,we will allow some information to leak,while keeping the critical information a secret.We do so by putting a timestamp into each probe packet,however,we do not put the transmission time into the packet.At the start of the experiment,each operator chooses a random num-ber S i uniformly over the interval [0,S ],where S is chosen so that it is larger than the longest reasonable delay (for instance,it might be chosen to take the value of the loss detection timeout),perhaps a value of the order of 10seconds.When the experiment nomi-nally starts,the actual transmission of the first packet from node i is delayed by S i ,and each packet is timestamped with the time t (k )ij −S i .Therefore,the receiver j can determined (k )ij=r (k )ij −t (k )ij +S i ,(9)from which j may compute a distribution for d ij .Note however,that j does not know S i ,so it cannot infer the true distribution –in effect j sees a shifted distribution.If j were to transmit this infor-mation back to i ,then i would know the true distribution (which is not allowed),and so j cannot perform this step directly.However,j may approximate the distribution (via one of two approaches de-scribed below),and then perform a distributed summation to obtain a shifted distribution for the group of receivers {j |j =i },which can then be transmitted to i ,who removes S i ,and obtains an un-shifted distribution for its delays to the group of other ISPs.We may approximate distributions in a number of ways.Mostsimply,given some set of data points d (k )ij,we simply create a set a set of bins [hn,h (n +1)),and count the number of data points in each bin,i.e.,we obtainc (n )ij =X kI h d (k )ij∈[hn,h (n +1))i ,(10)where I (·)denotes an indicator function,i.e.,I (A )=¡1,if A is true,0,otherwise.(11)We then perform a distributed sum to computec (n )i=N X j =1,j =ic (n )ij ,(12)which can be used to approximate the density of the delay distribu-tion,and this value is transmitted to ISP i .The value of c (n )i givesan approximation to the shifted distribution of delays of packets transmitted from ISP i ,and so we can recover an approximation of the original delay distribution by reversing the shift by −S i .Once one has a distribution,other statistics are easy to compute.This approach,while useful,has the problem one often encoun-ters when making empirical measurements of density functions,that the bin size is of some importance.Too small a bin size re-sults in large errors in the probabilities (per bin),whereas too large a bin results in a coarse histogram of the distribution.Moreover,the smaller the bins,the higher the communications cost of com-puting the sum.An alternative is to use some other approximation technique for the distributions.For instance,one could approxi-mate by a truncated Fourier series,and then sum the Fourier coef-ficients,and invert to obtain an approximation of the distribution.One could use any type of approximation basis that fits the distri-bution functions reasonably,as long as it has the property that sums of approximations are equal to the approximation of sums.There is clearly information leakage in the above approach.Ob-viously,once one has the shifted distribution,one can compute the variance of the distribution,and so j ,can compute Var (d ij ).How-ever,neither i nor j can compute the mean of the delay between their networks,and so the critical information we wish to retain as a secret is preserved.The question here is how much information is needed about delays,and how much information do we need to keep secret?Only the participants in such a computation can an-swer such a question.3.2Traffic weighted statisticsAn additional set of statistics one might be interested in are traffic-weighted performance metrics.An ISP is perhaps less worried about performance on paths that carry little traffic,and so might wish to give these less weight in an overall traffic performance met-ric.The simplest traffic-weighted performance metric would beˆDout i =1N −1NX j =1j =iTM ij ¯D ij ,=1264NX j =1j =iTM ij ¯R ij −NX j =1j =iTM ij ¯T ij 375,(13)where TM denotes the origin-destination traffic matrix between theparticipating ISPs,i.e.,TM ij denotes the traffic volume from net-work i to j .If all network operators measured their inter-domain traffic (for instance using flow-level collection on peering links),the multipli-cations TM ij ¯Rij can be performed locally,and then secure dis-tributed summation used to compute the results.However,the case might arise where a single provider wants this metric,and not all other providers can make the flow-level measurements required.In this case,operator i measures TM ij for all j ,and so can easily cal-culate P N j =1,j =i TM ij ¯T ij .However,ISP i may not wish to share TM ij with other ISPs,so we need to use PPDM to perform thecomputation of P N j =1,j =i TM ij ¯R ij .More precisely,we use a PPDM primitive [8]that allows two parties to compute an inner product a ·b where one party knows a vector a ,the other knows b .Obviously the result of this compu-tation could reveal information,so the result is partitioned so that parties A and B learn v a and v b respectively,wherev a +v b =a ·b =Xia ib i .(14)The v a and v b should be determined in such a way that no infor-mation is revealed about a and b.For existing algorithms this may not be the case for arbitrary a and b.We will discuss this further in Section4below,but note that for the case of traffic weighted performance metrics there should be no significant problem. Given a privacy preserving protocol for performing this calcula-tion,we can build a protocol as follows:assume ISP i wishes tocompute its outgoing traffic-weighted delayˆD outi .(1)for each j=i,use PPDM to computev(a) ij +v(b)ij=NXj=1,j=iTM ij¯R ijwhere ISP x learns v(x)ij .(2)The ISPs perform a distributed sumV(b) i =1N−1NXj=1,j=iv(b)ijwhich they transmit to i.(3)ISP i computesV(a) i =1N Xj=1,j=iv(a)ijand thenceˆD out i =−V(a)i−V(b)i+1N−1NXj=1j=iTM ij¯R ij.Thus the desired results is obtained by i.Step(1)uses the PPDM inner product operation,and so reveals nothing about the inputs to the participants.In step(2),ISP i learns only an aggregatedversion of the v(b)ij ,and so cannot separate out the individual termsto determine the value of the individual inner products.Hence at no stage does any other ISP hold enough data to determine sensitive data.A similar approach could be performed for computingˆD in i.4.LOSSUntil now,we have assumed that all probe packets are received, however,in the Internet packets are sometimes dropped.This intro-duces the problem of measuring loss rates,but it also complicates the problem of measuring delays as we must censor the lost packets from our measurement data.We consider both problems below. 4.1Estimating loss ratesLet usfirst consider the case where all data is shared.In this case, one can set a timeout S beyond which we believe the packet could not survive“in the wild”of the Internet.If a packet is delayed by more than this time,we assume it has been ually this timeout is several orders of magnitude larger than typical lifetimes, resulting in minimal false positive packet-loss detection.If the total measurement time interval is T S and the number of probes is also large then it is a reasonable approximation to count the number of packets which were transmitted K ij and received M ij in the time-interval and compute to get the loss ratep ij 1−M ij/K ij.(15) There is an error in this calculation at the edges,of the order of S/T,resulting from packets which we transmitted,but which don’t arrived during the measurement interval[0,T].Likewise,we can compute average loss rates such asp out i 1−M i/K i,(16)where K i=Pj=iK ij,and M i=Pj=iM ij.It is simple to generalize this approach to PPDM.The counts K ijand M ij are known to ISP i and j respectively.Hence ISP i can di-rectly compute K i,and M i can be computed(as in Section3)usinga secure distributed sum,and we can perform similar operations toobtain p in i.4.2Estimating delay in the presence of lossA much trickier problem is estimating delay in the presence ofloss.The above approach tells us how many packets were lost,butnot which packets,and so we cannot appropriately censor the databeing used to calculate the averaged delay(for received packets).One approach would be to simply use the shifted timestampsdescribed in Section3.1in order to compute the distribution,fromwhich we may calculate the mean.However,as noted above,thisapproach results in information leakage.We can do better.We will add a packet ID to each packet,but note that these arenot sequential.We choose the packet IDs in some random fashionfrom the numbers{1,2,...,L},where L≥K ij for all i and j.The transmitter knows K ij,but the receiver does not(rememberwe use Poisson sampling intervals for measurements).The receiveronly knows L.The receiver can form a series of indicator vectorsI(k)ij=¡1,if the packet with ID k from i to j is received,0,otherwise.As before,the receivers can use distributed summation to computethe sum of receive times(for packets which are not lost).The re-ceivers may also(as noted above)perform a standard distributedsummation to compute M i=Pj=iM ij=Pj=iPLk=1I(k)ij.Hence we need only provide a distributed method for computingthe sum of transmit times for the packets which are not dropped.We denote this bys ij=LXk=1I(k)ijt(k)ij,(17)and we note that the value is not dependent on the value of L,i.e.,we can have as many“dummy”probes in the sequence as required.One way to choose L would be maximize the entropy of the indi-cator functions by assuring that p{I(k)ij=1}=0.5.Given smallloss rates,we can do so approximately by taking L=2E[K ij].In order to compute this value we exploit methods designed toallow the computation of inner products.Given such a protocolour task is relatively easy:the inner product s ij is divided into twocomponents,s(a)ij,and s(b)ijwhich are learnt by the sender i andthe receiver j,respectively.Then the sender performs a simple sumover his values,and the receivers perform a secure-distributed sum-mation over their values,and provide this value to the transmitter i.The transmitter then calculates¯D outi=1M i264NXj=1j=iLXk=1I(k)ijr(k)ij−NXj=1j=is(a)ij−NXj=1j=is(b)ij375.There are several existing approaches for computing the innerproduct(without a trusted third party).However,most of them mayresult in information leakage in the case where we know that oneof the vectors in the inner product is a{0,1}vector(e.g.,,[8]).This issue was not a problem when computing traffic-weightedperformance measures(as in Section3.2),but is a problem here.We present here a novel approach to solving the distributed innerproduct which avoids this pitfall.We use the inner product pro-tocol described in[7],which is based on another primitive fromPPDM referred to as1-in-n Oblivious Transfer(OT)(for original。

IntroductionPerformance measurement is a fundamental building block of TQM and a total quality organisation.Historically, organisations have always measured performance in some way through the financialperformance, be this success by profit or failure through liquidation.However, traditional performance measures, based on cost accounting information, provide little to support organisations on their quality journey, because they do not map process performance and improvements seen by the customer. In a successful total quality organisation, performance will be measured by the improvements seen by the customer as well as by the results delivered to other stakeholders, such as the shareholders.This section covers why measuring performance is important. This is followed by a description of cost of quality measurement, which has been used for many years to drive improvement activities and raiseawareness of the effect of quality problems in an organisation.A simple performance measurement framework is outlined, which includes more than just measuring, butalso defining and understanding metrics, collecting and analysing data, then prioritising and takingimprovement actions. A description of the balanced scorecard approach is also covered.Why measure performance?‘When you can measure what you are speaking about and express it innumbers, you know something about it’.Kelvin ‘You cannot manage what you cannot measure’.AnonThese are two often-quoted statements that demonstrate why measurement is important. Yet it issurprising that organisations find the area of measurement so difficult to manage.In the cycle of never-ending improvement, performance measurement plays an important role in:•Identifying and tracking progress against organisational goals•Identifying opportunities for improvement•Comparing performance against both internal and external standardsReviewing the performance of an organisation is also an important step when formulating the direction of the strategic activities. It is important to know where the strengths and weaknesses of the organisation lie, and as part of the ‘Plan –Do – Check – Act’cycle, measurement plays a key role in quality and productivity improvement activities. The main reasons it is needed are:•To ensure customer requirements have been met•To be able to set sensible objectives and comply with them•To provide standards for establishing comparisons•To provide visibility and a “scoreboard” for people to monitor their own performance level•To highlight quality problems and determine areas for priority attention•To provide feedback for driving the improvement effortIt is also important to understand the impact of TQM on improvements in business performance, onsustaining current performance and reducing any possible decline in performance.Cost of quality measurementThe cost of doing a quality job, conducting quality improvements and achieving goals must be carefully managed, so that the long-term effect of quality on the organisation is a desirable one. These costs must be a true measure of the quality effort, and are best determined from an analysis of the costs of quality.Such an analysis provides:• A method of assessing the effectiveness of the management of quality• A means of determining problem areas, opportunities, savings and action prioritiesCost of quality is also an important communication tool. Crosby demonstrated what a powerful tool it could be to raise awareness of the importance of quality. He referred to the measure as the “Price of Non-conformance”, and argued that organisations chose to pay for poor quality.Quality-related activities that will incur costs may be split into prevention costs, appraisal costs and failure costs.Prevention costs are associated with the design, implementation and maintenance of the TQM system.They are planned and incurred before actual operation, and could include:•Product or service requirements – setting specifications for incoming materials, processes, finished products/services•Quality planning – creation of plans for quality, reliability, operational, production, inspection•Quality assurance – creation and maintenance of the quality system•Training – development, preparation and maintenance of programmesAppraisal costs are associated with the suppliers’ and customers’ evaluation of purchased materials,processes, products and services to ensure they conform to specifications. They could include:•Verification – checking of incoming material, process set-up, products against agreed specifications•Quality audits – check that the quality system is functioning correctly•Vendor rating – assessment and approval of suppliers, for products and services Failure costs can be split into those resulting from internal and external failure.Internal failure costs occur when the results of work fail to reach designed quality standards and aredetected before they are transferred to the customer. They could include:•Waste – doing unnecessary work or holding stocks as a result of errors, poor organisation or communication•Scrap – defective product or material that cannot be repaired, used or sold•Rework or rectification – the correction of defective material or errors•Failure analysis – activity required to establish the causes of internal product or service failureExternal failure costs occur when the products or services fail to reach design quality standards, but are not detected until after transfer to the customer. They could include:•Repairs and servicing – of returned products or those in the field•Warranty claims – failed product that are replaced or services re-performed under a guarantee•Complaints – all work and costs associated with handling and servicing customers’ complaints•Returns – handling and investigation of rejected or recalled products, including transport costsThe relationship between the quality-related costs of prevention, appraisal and failure (the P-A-F model) and increasing quality awareness and improvement in the organisation is shown graphically as:Expenditure on prevention and improvement activities is an investment from which a return is expected.Effective quality improvements should result in a future stream of benefits, such as:•Reduced failure costs •Lower appraisal costs •Increased market share •Increased customer base •More productive workforceMany organisations will have true quality related costs as high as 15% of their sales revenue, and effective quality improvement programmes can reduce this substantially, thus making a direct contribution to profits.An alternative to the P-A-F model is the Process Cost Model, which categorises the cost of quality (COQ)into the cost of conformance (COC) and the cost of non-conformance (CONC), where:COC is the process cost of providing products/services to the required standards, by a given specified process in the most effective manner.CONC is the failure cost associated with a process not being operated to the requirements, or the cost due to the variability of the process.Quality awareness and improvementQualityrelatedcostsTo identify, understand and reap the cost benefits of quality improvement activities the followingfundamental steps should be included in the approach:•Management commitment to finding the true costs of quality• A quality costing system to identify, report and analyse quality related cost• A quality related cost management team responsible for direction and co-ordination of the quality costing system•The inclusion of quality costing training to enable everyone to understand the financial implications of quality improvement•The presentation of significant costs of quality to all personnel to promote the approach•Introduction of schemes to achieve maximum participation of all employeesThe system, once established, should become dynamic and have a positive impact on the achievement of the organisation’s mission, goals and objectives.A simple performance measurement frameworkA good performance measurement framework will focus on the customer and measure the right things.Performance measures must be:•Meaningful, unambiguous and widely understood•Owned and managed by the teams within the organisation•Based on a high level of data integrity•Such that data collection is embedded within the normal procedures•Able to drive improvement•Linked to critical goals and key drivers of the organisationThere are four key steps in a performance measurement framework - the strategic objectives of theorganisation are converted into desired standards of performance, metrics are developed to compare the desired performance with the actual achieved standards, gaps are identified, and improvement actionsinitiated. These steps are continuously implemented and reviewed:Initially, focus on a few key goals that are critical to the success of the organisation or business, and ensure they are SMART, i.e:S pecificM easurableA chievableR elevantT imelyFrom QualityTo assist in the development of these goals, consider the use of a balanced scorecard, as discussed in the following section.Once the goals have been defined, the next step in developing a performance measurement framework is to define the outcome metrics- what has to be measured to determine if these goals are being achieved. If it is difficult to define outcome metrics for a particular goal, it is possible that the goal is either not “SMART” or critical to the success of the business.For each outcome metric, brainstorm candidate drivers by answering the question, “What measurable factors influence this outcome?”Once the list is complete, select those with greatest impact, and these, the most important drivers, should have driver metrics, and be put in place first. Driver metrics at one level will be outcome metrics at the next level down.An organisation needs to evolve its own set of metrics, using any existing metrics as a starting point in understanding current performance. To ensure they trigger the improvement cycle, they should be in three main areas:Effectiveness=Actual output x 100%Expected outputThis is about the process output, and doing what you said you would do. The effectiveness metrics should reflect whether the desired results are being achieved, the right things being accomplished. Metrics could include quality, e.g., grade of product or level of service, quantity, e.g., tonnes, timeliness, e.g., speed of response, and cost/price, e.g., unit cost.Efficiency=Resource actually used x 100%Resources planned to be usedThis is about the process input, e.g., labour, staff, equipment, materials, and measures the performance of the process system management. It is possible to use resources efficiently, but ineffectively.Productivity=Outputs which can be quoted as:InputsExpected productivity=Expected output orResources expected to be consumedActual productivity= Actual outputResources actually consumedSimple ratios, e.g., tonnes per person-hour, computer output per operator day, are used.Next, design a data collection/reporting process using the following steps:•Set up a system for collecting and reporting data•Write clear definitions•Agree method for establishing current performance (if not already determined)•List resources required to support the design•Agree data formats and classifications for aggregation and consolidation•Identify possible sources of benchmark data•Set reporting calendar•Establish roles and responsibilities•Detail training requirements•Validate with process stakeholdersThe gap between current and desired performance now has to be measured. Some of the metrics already exist and their current performance data must be collected, as well as data for new metrics.Once all the data has been collected to identify the current performance, the target level of performance for the medium- and long-term must be decided. These performance levels must be achievable, and should be broken down into targets for discrete short-term intervals, e.g, the next three quarters.To implement the performance measurement framework, a plan with timescales and designated responsibilities is needed. Once the plan has been implemented and data collected, new baselines can be set, comparisons made and new standards/targets set.The metrics, targets and improvement activities must be cascaded down through the organisation, involving people and teamwork in the development of new metrics, data collection and improvement activities.Improvement can be initiated by examining the gaps between current and target performance of the driver metrics at each level. A minimum, achievable set of actions is determined, with plans, assigned responsibilities and owners.The critical elements of a good performance measurement activity are very similar to those required for a total quality improvement activity:•Leadership and commitment•Good planning and a sound implementation strategy•Appropriate employee involvement•Simple measurement and evaluation•Control and improvementThe balanced scorecard approachFirst developed by Kaplan and Norton, a balanced scorecard recognises the limitations of purely financial measurement of an organisation, which is normally short-term measurement.A scorecard has several measurement perspectives, with the original scorecard having financial, customer,internal business and innovation and learning perspectives. Balanced scorecards are normally a key output from the strategy formulation process.The key goals that are identified as being critical to the success of the business, as part of a performance measurement framework, can also be considered in the context of a balanced scorecard.A balanced scorecard derived from the EFQM Excellence Model® (discussed in the Excellence section)would include financial and non-financial results, customer results, employee results and societal results.。
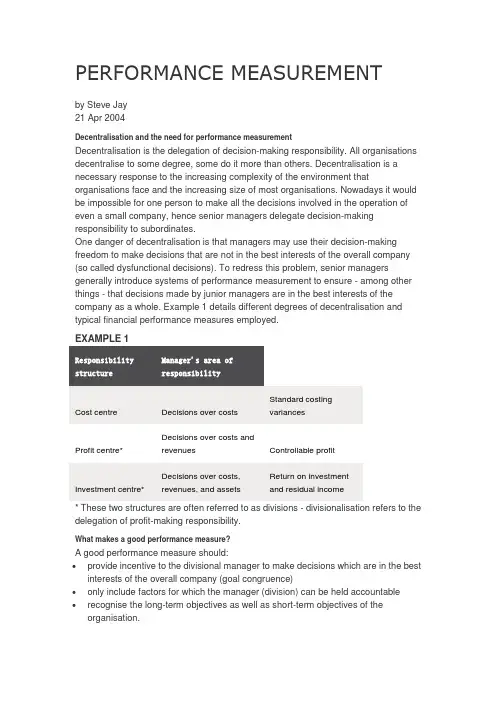
PERFORMANCE MEASUREMENTby Steve Jay21 Apr 2004Decentralisation and the need for performance measurementDecentralisation is the delegation of decision-making responsibility. All organisations decentralise to some degree, some do it more than others. Decentralisation is a necessary response to the increasing complexity of the environment that organisations face and the increasing size of most organisations. Nowadays it would be impossible for one person to make all the decisions involved in the operation of even a small company, hence senior managers delegate decision-making responsibility to subordinates.One danger of decentralisation is that managers may use their decision-making freedom to make decisions that are not in the best interests of the overall company (so called dysfunctional decisions). To redress this problem, senior managers generally introduce systems of performance measurement to ensure - among other things - that decisions made by junior managers are in the best interests of the company as a whole. Example 1 details different degrees of decentralisation and typical financial performance measures employed.EXAMPLE 1Responsibility structure Manager's area ofresponsibilityTypical financialperformance measureCost centre Decisions over costs Standard costing variancesProfit centre* Decisions over costs andrevenues Controllable profitInvestment centre* Decisions over costs,revenues, and assetsReturn on investmentand residual income* These two structures are often referred to as divisions - divisionalisation refers to the delegation of profit-making responsibility.What makes a good performance measure?A good performance measure should:∙provide incentive to the divisional manager to make decisions which are in the best interests of the overall company (goal congruence)∙only include factors for which the manager (division) can be held accountable∙recognise the long-term objectives as well as short-term objectives of the organisation.Traditional performance indicatorsCost centresStandard costing variance analysis is commonly used in the measurement of cost centre performance. It gives a detailed explanation of why costs may have departed from standard. Although commonly used, it is not without its problems. It focuses almost entirely on short-term cost minimisation which may be at odds with other objectives, for example, quality or delivery time. Also, it is important to be clear about who is responsible for which variance - is the production manager or the purchasing manager (or both) responsible for raw material price variances? There is also the problem with setting standards in the first place - variances can only be as good as the standards on which they are based.Profit centresControllable profit statements are commonly used in profit centres. A proforma statement is given in Example 2.EXAMPLE 2: CONTROLLABLE PROFIT STATEMENT$ $Sales (external) XXX(internal) XXXXXXControllable divisional variable costs (XXX)Controllable divisional fixed costs (XXX)Controllable divisional profit XXXOther traceable divisional variable costs (X)Other traceable divisional fixed costs (XXX)Traceable divisional profit XXXApportioned head office cost (XXX)Net profit XXXThe major issue with such statements is the difficulty in deciding what is controllable or traceable. When assessing the performance of a manager we should only consider costs and revenues under the control of that manager, and hence judge the manager on controllable profit. In assessing the success of the division, our focus should be on costs and revenues that are traceable to the division and hence judge the division ontraceable profit. For example, depreciation on divisional machinery would not be included as a controllable cost in a profit centre. This is because the manager has no control over investment in fixed assets. It would, however, be included as a traceable fixed cost in assessing the performance of the division.Investment centresIn an investment centre, managers have the responsibilities of a profit centre plus responsibility for capital investment. Two measures of divisional performance are commonly used:1 Return on investment (ROI) =controllable (traceable) profit %controllable (traceable) investment2 Residual income = controllable (traceable) profit - an imputed interest charge on controllable (traceable) investment.Example 3 demonstrates their calculation and some of the drawbacks of return on investment.Example 3Division X is a division of XYZ plc. Its net assets are currently $10m and it earns a profit of $2.2m per annum. Division X's cost of capital is 10% per annum. The division is considering two proposals.Proposal 1 involves investing a further $1m in fixed assets to earn an annual profit of $0.15m.Proposal 2 involves the disposal of assets at their net book value of $2.3m. This would lead to a reduction in profits of $0.3m.Proceeds from the disposal of assets would be credited to head office not Division X.Required: calculate the current ROI and residual income for Division X and show how they would change under each of the two proposals.Current situationReturn on investmentROI = $2.2m = 22%$10.0mResidual incomeProfit $2.2mImputed interest charge$10.0m x 10% $1.0mResidual income $1.2mComment: ROI exceeds the cost of capital and residual income is positive. The division is performing well.Proposal 1Return on investmentROI = $2.35m = 21.4% $11.0mResidual incomeProfit $2.35mImputed interest charge$11.0m x 10% $1.1mResidual income $1.25mComment: In simple terms the project is acceptable to the company. It offers a rate of return of 15% ($0.15m/$1m) which is greater than the cost of capital. However, divisional ROI falls and this could lead to the divisional manager rejecting proposal 1. This would be a dysfunctional decision. Residual income increases if proposal 1 is adopted and this performance measure should lead to goal congruent decisions.Proposal 2Return on investmentROI = $1.9m = 24.7% $7.7mResidual incomeProfit $1.90mImputed interest charge$7.7m x 10% $0.77mResidual income $1.13mComment: In simple terms the disposal is not acceptable to the company. The existing assets have a rate of return of 13.0% ($0.3m/$2.3m) which is greater than the cost of capital and hence should not be disposed of. However, divisional ROI rises and this could lead to the divisional manager accepting proposal 2. This would be a dysfunctional decision. Residual income decreases if proposal 2 is adopted and once again this performance measure should lead to goal congruent decisions.Relative merits of ROI and residual incomeReturn on investment is a relative measure and hence suffers accordingly. For example, assume you could borrow unlimited amounts of money from the bank at a cost of 10% per annum. Would you rather borrow £100 and invest it at a 25% rate of return or borrow $1m and invest it at a rate of return of 15%?Although the smaller investment has the higher percentage rate of return, it would only give you an absolute net return (residual income) of $15 per annum after borrowing costs. The bigger investment would give a net return of $50,000. Residual income, being an absolute measure, would lead you to select the project that maximises your wealth.Residual income also ties in with net present value, theoretically the best way to make investment decisions. The present value of a project's residual income equals theproject's net present value. In the long run, companies that maximise residual income will also maximise net present value and in turn shareholder wealth. Residual income does, however, experience problems in comparing managerial performance in divisions of different sizes. The manager of the larger division will generally show a higher residual income because of the size of the division rather than superior managerial performance.Problems common to both ROI and residual incomeThe following problems are common to both measures:∙Identifying controllable (traceable) profits and investment can be difficult.∙If used in a short-term way they can both overemphasise short-term performance at the expense of long-term performance. Investment projects with positive net present value can show poor ROI and residual income figures in early yearsleading to rejection of projects by managers (see Example 4).∙If assets are valued at net book value, ROI and residual income figures generally improve as assets get older. This can encourage managers to retain outdated plant and machinery (see Example 4).∙Both techniques attempt to measure divisional performance in a single figure.Given the complex nature of modern businesses, multi-faceted measures ofperformance are necessary.∙Both measures require an estimate of the cost of capital, a figure which can be difficult to calculate.EXAMPLE 4PQR plc is considering opening a new division to manage a new investment project. Forecast cashflows of the new project are as follows:Year 0 1 2 3 4 5Forecast net cash flow$m (5.0) 1.4 1.4 1.4 1.4 1.4PQR's cost of capital is 10% pa. Straight line depreciation is used.Required: Calculate the project's net present value and its projected ROI and residual income over its five-year life.NPVYear0 1 2 3 4 5Forecast net cash flow $m (5.0) 1.4 1.4 1.4 1.4 1.4Present value factors at10% 1.00 0.91 0.83 0.75 0.68 0.62NPVPresent value (5.0) 1.27 1.16 1.05 0.95 0.87NPV = $0.30mROIYear 1 2 3 4 51 Opening investment at netbook value 5.0 4.0 3.0 2.0 1.02 Forecast net cash flow $m 1.4 1.4 1.4 1.4 1.43 Straight line depreciation (1.0) (1.0) (1.0) (1.0) (1.0)4 Profit 0.4 0.4 0.4 0.4 0.4ROI (4 ÷ 1 x 100) 8% 10% 13% 20% 40%Residual incomeYear 1 2 3 4 5Profit (as above) 0.4 0.4 0.4 0.4 0.4Imputed capital charge (openinginvestment x 10%) 0.5 0.4 0.3 0.2 0.1Residual income (0.1) 0.0 0.1 0.2 0.3Comment: this example demonstrates two points. Firstly, it illustrates the potential conflict between NPV and the two divisional performance measures. This project has a positive NPV and should increase shareholder wealth. However, the poor ROI and residual income figures in the first year could lead managers to reject the project. Secondly, it shows the tendency for both ROI and residual income to improve over time. Despite constant annual cashflows, both measures improve over time as the net book value of assets falls. This could encourage managers to retain outdated assets. Non-Financial Performance indicatorsIn recent years, the trend in performance measurement has been towards a broader view of performance, covering both financial and non-financial indicators. The most well-known of these approaches is the balanced scorecard proposed by Kaplan andNorton. This approach attempts to overcome the following weaknesses of traditional performance measures:Single factor measures such as ROI and residual income are unlikely to give a full picture of divisional performance.∙Single factor measures are capable of distortion by unscrupulous managers (eg by undertaking proposal 2 in Example 3).∙They can often lead to confusion between measures and objectives. If ROI is used as a performance measure to promote the maximisation of shareholder wealth some managers will see ROI (not shareholder wealth) as the objective anddysfunctional consequences may follow.∙They are of little use as a guide to action. If ROI or residual income fall they simply tell you that performance has worsened, they do not indicate why.The balanced scorecard approach involves measuring performance under four different perspectives, as follows:Perspective QuestionFinancial success How do we look to shareholders?Customer satisfaction How do customers see us?Process efficiency What must we excel at?Growth Can we continue to improve and create value?The term 'balanced' is used because managerial performance is assessed under all four headings. Each organisation has to decide which performance measures to use under each heading. Areas to measure should relate to an organisation's critical success factors. Critical success factors (CSFs) are performance requirements which are fundamental to an organisation's success (for example innovation in a consumer electronics company) and can usually be identified from an organisation's mission statement, objectives and strategy. Key performance indicators (KPIs) are measurements of achievement of the chosen critical success factors. Key performance indicators should be:∙specific (ie measure profitability rather than 'financial performance', a term which could mean different things to different people)∙measurable (ie be capable of having a measure placed upon it, for example, number of customer complaints rather than the 'level of customer satisfaction')∙relevant, in that they measure achievement of a critical success factor.Example 5 demonstrates a balanced scorecard approach to performance measurement in a fictitious private sector college training ACCA students.EXAMPLE 5Perspective CriticalSuccess Factor Key Performance IndicatorsFinancial success ShareholderwealthDividend yield % increase in sharepriceCashflowActual v budgetDebtor daysCustomersatisfaction Exam success College pass rate v national average Premier college statusTutor grading by studentsFlexibility Average number of course variants per subject (eg full-time, day release, evening)Process efficiency Resourceutilisation% room occupancyAverage class sizeAverage tutor teaching load (days)Growth InnovationproductsInformationtechnology% of sales from < 1 year oldNumber of online enrolmentsThe balanced scorecard approach to performance measurement offers several advantages:∙it measures performance in a variety of ways, rather than relying on one figure∙managers are unlikely to be able to distort the performance measure - bad performance is difficult to hide if multiple performance measures are used∙it takes a long-term perspective of business performance∙success in the four key areas should lead to the long-term success of the organisation∙it is flexible - what is measured can be changed over time to reflect changing priorities∙'what gets measured gets done' - if managers know they are being appraised on various aspects of performance they will pay attention to these areas, rather than simply paying 'lip service' to them.The main difficulty with the balanced scorecard approach is setting standards for each of the KPIs. This can prove difficult where the organisation has no previous experience of performance measurement. Benchmarking with other organisations is a possible solution to this problem.Allowing for tradeoffs between KPIs can also be problematic. How should the organisation judge the manager who has improved in every area apart from, say, financial performance? One solution to this problem is to require managers to improve in all areas, and not allow tradeoffs between the different measures.Steve Jay is examiner for CAT Paper 7。


Please do not cite or reproduce without written permission by the authorsChallenges in the Comparative Analysis of LocalGovernment Bureaucracy and PerformanceMeasurement: The Case of Italy and the United StatesByDr. Emaunuele PadovaniUniversity of Bologna – Forlì Campus, Department of Managementmailto:emanuele.padovani@unibo.ithttp://www2.sa.unibo.it/docenti/emanuele.padovani/indexeng.html&Dr. Eric ScorsoneMichigan State University, Department of Agricultural Economicsmailto:scorsone@/faculty/scorsone.htmEuropean Group of Public Administration Annual Conference 2007Madrid, September 19-22Study Group II:Productivity and Quality in the Public Sector European Group on Public AdministrationAbstractAcross the globe, local governments and their brethren regional and national governments, are facing the growing prospect of performance measurement and management (Hatry, 1999, 2006; De Bruijn, 2002; Poister, 2003), performance based budgeting (for example Berman and Wang, 2000), and the general rubric of new public management (OECD, 1990; Hood, 1991, 1995; Osborne and Gaebler, 1992; Pollitt, 1993; Pollitt and Bouckaert, 2000; Guthrie et al. 2005). In essence, these approaches demand greater accountability, in many cases greater data collection and compilation and reporting in order to create a more transparent and more responsive government. Importantly, these new management systems are also critical in facilitating the comparison of governments within and across countries.Extensive research has been conducted over the last two decades on understanding the evolution of performance measurement systems (PMSs), their adoption and, in some cases, their effectiveness, both subjective and objective (see for example Poister, 2003). While some attempt has been made to address cross-national trends in PMSs, very few systemic efforts have been attempted to uncover similarities and differences. This type of analysis may illuminate the importance of different aspects of the adoption and use of performance measurements in local governments across country borders.Progress has been made in understanding challenges in measuring and comparing bureaucracies across countries at the national level (see for example, Van de Walle, 2005, 2006). The next stage or evolution in this area of interest is the comparison of local government performance and bureaucracy. This is particularly important given the continuing push by many international agencies for devolution or decentralization of government functions (for example OECD, 2001).This paper will proceed to address two basic questions. One, an analysis will be undertaken on the methodological challenges of comparing local government bureaucracy across countries. Starting from the existing literature, a methodological framework will be constructed to identify the key variables and options in comparing the local government bureaucracies of countries. Second, the paper will build on this methodological framework and compare the local governments of the United States and Italy. This comparison, that will be carriedPadovani E., Scorsone E. • Challenges in the Comparative Analysis of Local Government… page 2out being aware of the possible pitfalls which can undermine such cross-national research (Eglene and Dawes, 2006), will be facilitated by the joint surveying of local governments in these countries in the spring of 2007.One of the challenges in comparing local governments are the different set of functional responsibilities encompassed by different levels of government. One must find a way to standardize service delivery responsibilities across different countries and systems. A second challenge is the availability of data, even within a single country, to compare or benchmark performance across countries. A third challenge is the differences in expectations among the population and elected officials as to the role of government and bureaucracy in society. As a matter of facts, one major criticism has been the subjective nature of the comparative indicators (Van de Walle, 2005).Our analysis proceeds by addressing the challenge of compiling comparable data and assessing how even nearly identical survey instruments can lead to challenges in assessing the adoption and use of performance measures across two countries. Using a quantitative analysis, the aim is to contribute to Study Group on Productivity and Quality’s theme of comparisons of public sectors across countries. Questions that will be directly addressed include: What are the challenges in comparing local government bureaucracies across countries? Can instruments be designed to facilitate this comparison? What are the conditions under which PMS is established and succeed? What are the enablers of successful PMS? Does PMS bring to deliver all the desired effects claimed by theory?Padovani E., Scorsone E. • Challenges in the Comparative Analysis of Local Government… page 3IntroductionSince the mid 1990’s, there has been growing interest in the comparative analysis of the performance of bureaucracies across countries. This comparative analysis has in particular been stimulated by the interests of international development issues related to economic growth and democracy. There is concern among development and business officials to determine if certain forms of bureaucracy are more attuned to strong economic growth than other types of government bureaucracy.The European Central Bank, the World Bank and the Organization for Economic and Cooperation Development have all been involved in efforts to ascertain differences in government bureaucratic performance across countries. These efforts are generally based on using existing data to ascertain performance. Further, there have been comparative efforts by risk management firms attempting to determine which countries represent the highest risk to foreign direct investment.Prevailing efforts to compare government performance have focused on the aggregate national public sector. Nearly every country in the world has divided its public sector into national, provincial/state and local government (cities/towns) units. This is typically done because some service and regulatory responsibilities are perceived as being better carried out at the regional or local level. Typical service responsibilities that are decentralized include road building repair and maintenance, police patrol, fire service, garbage and waste management, public buildings, public transportation, cultural activities (Norton, 1994)1. In fact, the same agencies that have engaged in the comparative analysis of the public sector, such as the World Bank, have also pushed the agenda of decentralization of government services. No attempt in the current bureaucratic performance literature has been made to dig into the public sector and determine if the stability of comparative bureaucratic performance across levels of government.There is good deal of debate over the efficiency characteristics of decentralized versus centralized public sectors. However, this is not the focus of1 It is interesting to highlight that many of those functions are shared with other level of governments; usually local governments handle only the portion of those activities which are more directly related to their corresponding communities. We will address this issue in the next sections.Padovani E., Scorsone E. • Challenges in the Comparative Analysis of Local Government… page 4this analysis. Our focus is in ascertain and developing a framework to assist researchers and policy makers in determining if the conditions exist for undertaking a comparative analysis of local government sectors across countries. Further, the second part of the analysis considers the methodology through which one would then undertake a comparative analysis.A question may be asked regarding why focus on local government performance. It could be argued that it will be easier to focus on the aggregated government or national government level. This type of analysis will avoid the problems of determining which level of government is responsible for service provision and revenue authority. However, with the growing importance of decentralization, this focus on aggregate analysis could masks potentially important differences among public sectors within a country. Further, local governments provide many of the critical public infrastructure and public safety services that are important to business investment and overall economic growth. Finally, if development agencies are going to continue to promote the agenda of decentralization, there is a critical need to determine and assess the performance of these decentralized public sectors on their own terms as opposed to being part of an aggregate national analysis.Literature Review and Methodological ConsiderationsThe literature review and methodological considerations section will provide a view of the current set of studies that have compared national bureaucracies as well as some perspective on the prevailing performance measurement in government literature. The objective is to summarize the relevant factors that will be important in constructing a comparative framework to assess local government performance across countries.Types of Performance MeasuresOne of the most problematic issue in making cross-country comparisons is the scope of performance measures being used by various local government entities. There is a generally common set of performance measures delineated in the literature including input, output, and the outcome types. As to input measures,Padovani E., Scorsone E. • Challenges in the Comparative Analysis of Local Government… page 5two problems arise. First, the traditional public sector accounting—both at central and local levels of government—provides the information of financial outflows instead of costs. This is problematic because different governments may use different levels of real resources in carrying out services. Also, even if cost information for those countries which have already introduced accrual accounting under the pressure of New Public Financial Management reforms exists (Guthrie et al., 2005), there are at least two separate definitions of costs: full cost accounting and direct accounting. Each of these methods contains inherent choices of categorization that are subjective. Subjectivity can be limited by using standardized principles, but at the local government level even though there is a growing pressure towards the International Public Sector Accounting Standards (IPSAS), accounting principles are not homogeneously applied yet (Farneti and Pozzoli, 2006). The second problem with input information is that it reflects the different approaches to delivering public services instead of differences in resources spent. As a matter of facts, if social support is given through tax discounts this tends to lower expenditure, even if a public service is provided.As to the output and outcome side, the complexity is far greater. This is because the coverage and scope of public sector’ activities are societal-specific, therefore even in presence of the same spending area (e.g. health care, education, social services) the aims, and consequently the output and outcome measures, could not be the same. This factor, combined with different indicators and method of gathering data, has led some authors including Curristine et al. to affirm that “assembling a data set on public service outputs suitable for cross-country comparison is, for many sectors, more an ideal than a possibility.” (2007: 5). Any model designed to assess the comparability of local government performance must address the types of data being collected by the various entities.Current Attempts at Performance Comparisons: Selection, Causality and Dimensionality IssuesMany questions and critiques have been raised with regards to the current set of national ranking systems comparing public bureaucracies. Perhaps the most important criticism is the narrow scope of measures included in such rankings.Padovani E., Scorsone E. • Challenges in the Comparative Analysis of Local Government… page 6Analyzing the most frequently used international comparison studies (by the European Central Bank, the World Bank, the World Economic Forum, and the IMD business school), Van de Walle (2005, 2006) argues that there have been very few attempts to measure the quality or productivity of the entire government sector, but rather attempts at sector or functional comparisons. While the World Bank does present a wide range of variables, there is no clear underlying logic or conceptual framework as to how these measures interact or the total picture that is presented. There is also a clear bias towards development as the primary focus of the variable selection and, quite often, indicators do not adequately assess what they assert to measure.In this direction, Kaufmann et al. (2006) have presented the latest version of the World Bank comparative analysis covering the period 1995 through 2006 and 213 countries. They focus on political voice, political stability, corruption, regulatory quality, and rule of law. These variables all fit into the burgeoning literature on the role and impact of government on the development process. They do not necessarily indicate or measure the overall ability of public administration. There are very few indicators of their actual “performance of bureaucracy”, but rather these are primarily measures of the political system. Further, there is a clear bias towards bureaucracies that perform by interfering minimally in business affairs such as the measures of regulatory quality. It is clear that this type of analysis fits into the World Bank’s overall strategic focus of directing funds to countries that have high capacity to utilize them and achieve development outcomes.One of the few publicly available and comprehensive studies at the local government level on performance comparison carried out across countries is jointly administered by the European Commission and Eurostat (European Communities, 2004). Starting from 1998, the “Urban Audit” project provides a comparative assessment of the quality of life in selected urban areas (258 in total) in Europe (and Candidate Countries as well) using reliable and comparative data coming from national statistical offices, towns/municipalities/cities and other public or private organizations. The final aim is “to allow mayors and other locally elected officials to compare their city directly with other cities in Europe [facilitating] the exchange of experience and improve the quality of local urban policies.”2 The study presents 336 variables divided into 25 domains grouped in 92 See the introduction to .Padovani E., Scorsone E. • Challenges in the Comparative Analysis of Local Government… page 7statistical fields: demography (population, nationality, household structure), social aspects (housing, health, crime), economic aspects (labor market, economic activity, income disparities and poverty), civic involvement (civic involvement, local administration), training and education (education and training provision, educational qualifications), environment (climate/geography, air quality and noise, water, waste management, land use, energy use), travel and transport, information society (users and infrastructure, local e-government, ICT sector), culture and recreation (culture and recreation, tourism).Even if we can say nothing about the selection criteria, the European Communities’s study provides a good example of how to face the problem of performance causality. The spatial observation units are represented by three different levels: (a) the “core city”, i.e. the territory belonging to a specific administrative municipality, (b) the “larger urban zone”, i.e. the functional town/city’s boundary where several jurisdictions are involved, (c) the “sub-city district”, i.e. a subdivision of the same administrative city/town into districts of 5 to 40 thousands inhabitants. Each level fits with specific sets of variables. For example the “core city” is relevant for input indicators (such as municipal expenditures for services) or output measures (quantity and quality of services provided to the jurisdiction’s citizens), while the “larger urban zone” match up better with such societal indicators as GDP per capita or the median disposable annual household income. Several indicators refer to two or three levels of analysis.One of the challenges that several authors and institutions have faced when seeking to empirically compare the performances of public administrations across countries, is summarizing the multidimensional performance into very few indicators or, in some instance, a unique indicator. For example, that is the case of Afonso et al. (2005), who have summarized government’s performance measured by a number of variables into two indicators, namely the “public sector performance” as the outcome of public sector activities, and the “public sector efficiency” as the outcome relative to the resources employed. Other studies come to a single composite indicator whose intention is to offer an overall, comparative assessment of “competitiveness” (European Communities, 2004) or “ability of governance” (World Bank).Yet, this approach has been seriously criticized, not only by academics (Van de Walle, 2005, 2006), but also by international institutions (OECD, 2007).Padovani E., Scorsone E. • Challenges in the Comparative Analysis of Local Government… page 8If different countries use different approaches in this dimension, it becomes difficult to determine the comparability of service performance. However, even if both or all countries under consideration use the same type of measurement aggregation process, there remain significant comparability issues. For example, two countries may not use the same process in aggregating or creating an index of public service performance. One country may use a weighted average approach to combining performance measures whereas another country may simply aggregate with equal weight given to all performance measures. Therefore, since any assessment of a national public sector depending on composite indicators could be highly misleading, international organizations are now explicitly avoiding aggregate public sector performance indicators (OECD, 2007).Finally the public management literature provides some fundamental design principles for performance measurement. Those principles can be summed up in the following: interaction, variety/redundancy, dynamic (De Bruijn, 2002). The first principle asserts that performance measures should result from interaction between management and professionals to avoid unfairness. Since rendering public goods is a multiple activity with different stakes involved at a time and several trade-offs, the multifaceted public sector organizations’ performance needs to be measured using various and redundant measures. Finally, since aims, products and delivery processes vary over time, performance measurement should be “lively”. This three principles turn into a more general principle of “variableness” of performance measures which can be considered as being opposite, in trade-off terms, to a more “stable” perspective when comparing different public sector organizations and national systems (see above).Over the past several decades, there has been a burgeoning literature on performance measurement in government. This literature provides guidance as to the factors that influence the adoption and usage of performance measures. This type of information, similarly to the information on the comparative analysis of national bureaucracies presented above, can provide directions to the construction of a methodological framework for analysts attempting to compare performance of local governments across national borders.Padovani E., Scorsone E. • Challenges in the Comparative Analysis of Local Government… page 9Institutional Setting ConsiderationsThe identification and measurement of the capacity and actual implementation of local governments to undertake performance measurement has been analyzed in many settings. Typically, this type of analysis proceeds by focusing on two or three major characteristics categories depending on the author(s). In many settings, the authors refer to two general categories rational or technical issues and political or acceptance issues (de Lancer Julnes and Holzer, 2001). Under rational or technical issues, the factors that have been considered include ability to develop performance measures and staffing resources. So, it is hypothesized that greater resources and ability to use and assess data will have a positive and in many cases large impact on government performance measurement.A second set of issues refers broadly to politics and law. One factor that almost all studies point to is the acceptance and even willingness to embrace the very nature of performance measurement by political and top managers. This type of acceptance is viewed as having an important and long lasting influence on the adoption and possible use of performance measures. Specific factors that have been mentioned here include political structure or organization, employees and union acceptance and managerial acceptance. Other factors that have been included in analytical approaches were budget process, budget rules and other procedural or legal systems.But when one adds the dimension of national systems, what new factors are introduced into the analysis? Within a given country, the institutional rules and laws will be common to all local governments. One importance difference across countries in this regard will be the authority and institutional capacity of regional, provincial or state governments. For example, in the United States, the federal government has very little power or authority over local governments. The only real authority comes through restrictions and provisions placed on federal monies or in some limited cases regulatory authority. In almost all other circumstances, local government structure and operation are the sole province of state government. In other countries, this factor may vary widely depending on the authority of regional governments. The institutional structure of Italian local governments is decided at the national level by law, while organizational structure and operation are something left to their autonomy, which is guaranteed by the constitution. Yet, the central government (and regions in a few instances)Padovani E., Scorsone E. • Challenges in the Comparative Analysis of Local Government… page 10plays its authority over local governments by setting general rules for public service provisions and, above all, by adopting the budget law, which determines not only the central government grants to local government, but also requirements and restrictions for local taxation.In terms of a comparative framework for local government performance measurement, these factors indicate that the context within which and how performance measurement is undertaken is important to assess. If institutional structures or resources vary widely across countries, this information is likely to be important in determining the ability of analysts to compare local government performance and the robustness of such comparisons.The other dimension that is added and leads to possibly confounding results when comparing local government capacity is culture. Different cultural attitudes towards government systems and operations will have an impact on the adoption and use of performance measures. Thus, a factor such as managerial acceptance may play a very different role in being a factor to determine local government capacity across countries. In one country managerial acceptance may be the most important factor, whereas in another country play only a small role. Thus, even if one can determine a common set of variables that help determine government capacity to measure performance, there remains the question of the weights that should be given to each variable.Given differences in culture, resources and institutional structure, is there a common framework from which one can assess the potential differences in capacity in performance measurement for local governments? Several analysts have proposed that external legal and institutional rules play an important role in differences in the capacity, willingness and adoption of performance measurement by local governments. One of these frameworks is the performance regime system developed by Talbot and co-authors. Wiggan and Talbot (2005) define a performance regime as the “totality of institutional actors, who may set, require or through other mechanisms effectively impose performance measures.” Of course, these institutional actors will vary depending on the national context. Within this framework, they define some of the important institutional actors to include government departments, line ministries, legislatures, audit, inspection and regulatory bodies, judicial bodies, professional institutes and users. Each of these actors may have the power to share the typePadovani E., Scorsone E. • Challenges in the Comparative Analysis of Local Government… page 11and use of performance measures within the entire or only certain functional areas of local government.For example, currently, the state of Michigan performance regime is very loosely defined. Local governments, in Michigan and most parts of the United States, have clearly adopted performance measures of some form in many service areas. It is less clear, and in fact much of the literature points to a gap between adoption and utilization, whether these “adopted” performance measures are being utilized. One could certainly hypothesis that the source and underlying logic behind the performance measurement adoption process would have an impact on the utilization or perceived effectiveness of performance measures.The state government regulates local government activity via the Michigan department of Treasury. The Department of Treasury is responsible for ensuring that financial audits and financial budgets are properly administered and follow certain legal guidelines. At this time, the department does not regulate or require any type of nonfinancial performance reporting from local governments.However, when examines the broader Michigan performance regime in fact there are some pressures on local governments to undertake performance measurement. These pressures typically take the form of state or federal mandates on reporting for certain service areas. For example, county government, and in some cases municipal government, must report all judicial caseload data. This would be characterized as output data in the general performance measurement literature. There are many other cases of output data requirements in local government. Examples include water system testing, human service caseload activity reporting such as foster children and provision of police and fire service activity to state and federal authorities. These are all cases where line ministries, such as the Michigan Department of Community health or Michigan Department of Human Services, via legislative statute have required some type of performance reporting by local governments who are receiving funds and carrying out specified activities and services.Another aspect of the performance regime is the grant funding connection to local governments. For many specific service functions and target problems, foundations, state and federal agencies and other non-profit organizations provide funding to local governments. These targeted resources are often attached with the requirements of developing strategic plans, logic models and inPadovani E., Scorsone E. • Challenges in the Comparative Analysis of Local Government… page 12。
Room 1802, 18/F, 1 Duddell Street, Central, Hong KongTel: (852) 2521 2543 Fax: (852) 2869 4800 E-mail: ************** URL: A MEMBER SOCIETY OF CFA INSTITUTEThe Hong Kong Society of Financial AnalystsPresents Workshops OnPerformance Measurement Attribution Series2014 Training Workshops22nd , 23rd July 2014 – Fundamentals of Performance Measurement24th , 25th July 2014 – Performance Measurement AttributionHKSFA Office,Room 1802, 18th Floor, 1 Duddell Street, Central, Hong Kong.HKSFA is recognized by The Securities and Futures Commission as an institution for providing Continuous Professional Training. Each two-day workshop is also qualified for 13 hours.As the recognized institution approved under SFC’s CPT Program, Each two-day workshop is qualified for 13 CPT hours respectively of each workshop are to receive due recognition from the Mandatory Provident Fund Scheme Authority (MPFA) as non-core CPD hours.Each two-day workshop is also qualified for 13 Continuing Professional Development (CPD) Hours respectively for Registered Business Valuers (RBV) of Business Valuation Forum (BVF).As a participant in the CFA Institute Approved-Provider of Continuing Education Program, the Hong Kong Society has determined that the above event qualifies for credit for the CFA Institute Continuing Education Program. Each two-day workshop is eligible for 13 CE credit hours.Performance Measurement Attribution SeriesHKSFA is proud to present our “Performance Measurement Attribution” workshops held in conjunction with The Spaulding Group. This series of programmes will consist of the following two-day workshops:(A)Fundamentals of Performance Measurement(B)Performance Measurement AttributionHighlights of the Workshops:The workshops are highly interactive and “real world”. Participants are afforded the opportunity to present and discuss issues that they may be wrestling with or have uncovered. Exercises are provided throughout each workshop to give participants the chance to try out the various formulas and techniques to which they’ve been introduced. In addition, the instructor uses case studies and real life examples to enhance the material and make the concepts more relevant.FUNDAMENTALS OF PERFORMANCEMEASUREMENTPERFORMANCE MEASUREMENT ATTRIBUTIONAGENDA DAY 1 (22nd July 2014, Tue) BACKGROUND∙What is performance measurement?∙ A brief history of performanceRATES OF RETURN∙Time-weighting vs. Money-weighting∙Internal Rate of Return∙Mid-point and Modified Dietz∙Unit Value Method∙“True” Daily Returns∙Geometric linking∙AnnualizationBENCHMARKS∙Absolute, market indexes, and peer groups∙Pros and consRISK∙What is Risk?∙ A review of the common measures, including standard deviation, Sharpe Ratio, Treynor Ratio,Information Ratio, Tracking Error, and VAR∙Risk monitoring and managementAGENDA DAY 1 (24th July 2014, Thurs) PERFORMANCE ATTRIBUTION CONCEPTS∙What performance attribution is and how it’s used CONTRIBUTION∙As a form of attribution/alternative formulas EQUITY ATTRIBUTION∙The first two laws of attribution∙ A review of the common equity models: Brinson Hood Beebower and Brinson-FachlerGEOMETRIC VS. ARITHMETIC∙What’s the difference?∙ A review of a geometric implementation of Brinson-FachlerHOLDINGS VS. TRANSACTIONS-BASED∙How do they differ?∙Pros and cons of eachFIXED INCOME ATTRIBUTION∙Fixed income concepts and why equity models don’t work for bonds.∙ A review of various fixed income models BALANCED ATTRIBUTION∙Bringing equity and fixed income togetherAGENDA DAY 2 (23rd July 2014, Wed) ATTRIBUTION∙The Three Laws of Attribution∙ A review of the Brinson Hood Beebower andBrinson-Fachler models∙Currency attribution∙Arithmetic vs. Geometric∙Multi-period Attribution∙Fixed Income AttributionPERFORMANCE PRESENTATION STANDARDS∙Detailed review of the Global Investment∙Performance Standards (GIPS®)∙Composite construction∙Calculations∙Discretion∙Points of confusionMANAGER SELECTION & PERFORMANCE APPRAISAL ∙Manager selection process∙Selection criteria for passive and active managers∙Investment performance appraisal∙Manager scoring models∙The role of investment philosophy in manager hiring THE PERFORMANCE MEASUREMENT PROFESSIONAL/ THE PERFORMANCE MEASUREMENT ORGANIZATION ∙Staff / Organization characteristics / trends∙Overview of the CIPM® ProgramAGENDA DAY 2 (25th July 2014, Fri) CURRENCY ATTRIBUTION∙ A review of two approaches to global attribution,∙including the Karnosky Singer modelMULTI-LEVEL ATTRIBUTION∙ A review of the common approachesOTHER ATTRIBUTION CONCEPTS∙Additional ways to gain insights into the sources of the returnMULTI-PERIOD ATTRIBUTION∙The third law of attribution∙ A review of five approaches to linking effects over time, including the Cariño (Logarithmic) and Menchero(Optimized) approachesPLAN SPONSORS & ATTRIBUTION∙ A review of macro and multi-tier attributionOTHER FACTORS TO CONSIDER∙Daily vs. Monthly/Sector vs. SecurityHEDGE FUND ATTRIBUTION∙Why it’s different and how to provideUSING THE RESULTS∙How to use what the models provideFINDING AN ATTRIBUTION SYSTEM∙The special needs of attributionTHE FUTURE OF ATTRIBUTION∙To what do we look forward?About the Instructor:Dr. David Spaulding, DPS, CIPMDr. David Spaulding, DPS, CIPM, is an internationally recognized authority on investment performance measurement. He’s the Founder and CEO of The Spaulding Group, Inc., and founder and publisher of The Journal of Performance Measurement®.He consults to clients throughout the world on investment performance and risk issues. In addition, he teaches classes on performance measurement and attribution, and regularly conducts GIPS® verifications.Dave is a prolific writer, having written numerous articles for various publications. He's also the author of four books: Measuring Investment Performance (McGraw-Hill, 1997), Investment Performance Attribution (McGraw-Hill, 2003), The Handbook of Investment Performance (TSG Publishing, 2005), and The Handbook's second edition (2011); co-author of The Spaulding Group's Guide to the Performance Presentation Standards: Second Edition (TSG Publishing,2012); contributing author of Performance Measurement in Finance (Butterworth-Heinemann, 2002); and is a co-editor and contributing author of Readings in Fixed Income Attribution (TSG Publishing, 2007) and Classics in Investment Performance Measurement (TSG Publishing, 2009). He has served on numerous industry committees including the USIPC (United States Investment Performance Council, formerly the North American Investment Performance Committee; and prior to that, the AIMR-PPS Implementation Subcommittee), the Investment Performance Council (IPC), the IPC's Interpretations Subcommittee, and the Performance Measurement Forum’s Hedge Fund and IIR Working Groups.Dave served in the United States Army for five years, where he earned the rank of Captain. He held various leadership positions with the Field Artillery while serving with the 25th Infantry Division (Schofield Barracks, HI) and the Field Artillery School (Ft. Sill, OK).He earned a BA in Mathematics from Temple University, an MS in Systems Management from the University of Southern California, an MBA in Finance from the University of Baltimore, and a doctorate in Finance and International Economics from Pace University.Dave spent six years in local politics including a four-year term as Mayor for the Township of North Brunswick (NJ), a community of 38,000 people. As the chief executive officer for the township, he was responsible for over 250 employees and a budget in excess of $30 million.Details of workshops:Date & Time: Name of WorkshopsFundamentals of Performance Measurement Course9:00am - 5:00pmTue, 22nd July 2014Wed, 23rd July 2014Performance Measurement Attribution Course9:00am - 5:00pmThurs, 24th July 2014Fri, 25th July 2014Fee: HKSFA Member(s) at HK$4,400 /person per two-day workshopGuest (s) and Non-member(s) at HK$7,000 /person per two-day workshop(The fee includes participant guide and supporting reference material.)Venue: HKSFA Office, Room 1802, 18th Floor, 1 Duddell Street, Central, Hong Kong.Discount Code for the October 2014 CIPM Program exam: Attendee of any two-day workshop will be eligible for a US$100 discount off the cost of his/her registration for the October 2014 CIPM Program exam. Eligible party shall use the code to register for the exam by 31 July 2014.Registration :1.Interested parties are requested to register online at .2.Registration is only confirmed upon receipt of payment.3.For cheque payment, cheques should be crossed and made payable to“HKSFA” and posted to Room1802, 18th Floor, 1 Duddell Street, Central, Hong Kong.4.After completing the online registration and payment process, registrants will receive emailnotifications with registration details. A reminder will also be sent before the event begins. If you have not received the email notification and reminder from HKSFA,it is the delegate’s responsibility to contact HKSFA to confirm their place.Policy for Substitutions, Cancellations and No Show:1.An administration fee HK$50 will be charged for any cancellation of confirmed enrollment. Allcancellation requests must be made in writing, be confirmed by email from HKSFA.2.Registrations should be paid in full before the commencement of the event. Immediate payment isrequired upon email confirmation. Full amount will still be charged for no show or enrolment made after Tuesday, 15th July 2014. Should the registration fee remains outstanding, HKSFA reserves the right to disallow entrance to the event.3.Refund of the event fee (less an administration fee of HK$50 per person) will be given for cancellationreceived on/before Tuesday, 15th July 2014. For payment made by credit card, refund will be handled through the bank, please allow 4 to 6 weeks for processing. The amount will be refunded to the paid credit card account.4.No refund will be given for cancellation received after Tuesday, 15th July 2014.5.Substitutions are allowed. Please notify us prior to the event. Non-member rate applies if thesubstitute is not an HKSFA member.6.The Society reserves the right to change the venue, date or speaker of the event due to unforeseencircumstances.7.To be awarded CPT/CPD/CE credit hours, full attendance of all parts of the event is required. Nopro-rata credit hours will be awarded.。
Automatically Generating Eye Motion in Virtual Agents∗ABSTRACTEye Motion has a fundamental role in verbal and non-verbal communication among people.It can express emotions and regulate theflow of conversation.For this reason,it is very important that these movements can be realistic in Com-puter Animation’s applications,such as virtual humans in general and game/movies characters.This paper presents a model for producing eye movements in synthetic agents. The main goal is to improve the realism of facial animation of such agents during conversational interactions.The con-tribution of this work is the inclusion of saccade behaviours in eyes motion,correlated with emotional attributes and also dependent of agents’role during interaction,e.g.if agent is listening or talking.We investigate the impact of face an-imations in human-computer interactions by including sac-cade motions,emotional attributes and role’s dependent an-imation.The experimental results indicate that increasing details in eyes animation can significantly improve the real-ism of facial animation.Categories and Subject DescriptorsH.4[Information Systems Applications]:Miscellaneous;D.2.8[Software Engineering]:Metrics—complexity mea-sures,performance measuresGeneral TermsDelphi theoryKeywordsACM proceedings,L A T E X,text tagging1.INTRODUCTIONVirtual humans have been widely used in many applica-tions.One is concerned with the interaction between hu-mans and computers using ECA(Embodied Conversational ∗(Produces the permission block,copyright information and page numbering).For use with ACM PROC ARTICLE-SP.CLS V2.6SP.Supported by ACM.Agents)[2],which are related with specific type of synthetic autonomous agent that aims to establish friendly dialogues with the user,enough to be utilized as system interfaces,en-tertainment applications,teaching tools,among others.In this case,the agents’reactions should help in user immersion as well as to provide a believable interaction.Other kind of application is related with games,movies and simulations, in which it is possible to observe synthetic agents,which interact with others agents,and not necessarily with users. Even in such type of application,the behaviours’realism is very important,to increase the credibility of character.In all these cases,once we are interested in improving the real-ism of agents interaction,the facial animation is a very rel-evant topic.The research in facial animation area has been very intense during many years.Several works have been proposed in order to animate facial muscles with speech or emotion.However,less attention has been paid to eyes an-imation,which poses a challenge for automatic animation systems,that aim to generate eyes animation based on dia-logue or other kinds of input.Indeed,some eyes movements are activated in an unconscious way,for instance while we talk,our mind isflooded by the meaning of the words,which are metaphorically linked with another signs and so on,and we search for information in such senses beyond our intellect to formulate what we want to say.After we have formulated what we wanted to say,the unconscious takes the control of our expressions.Not even an experienced orator has idea of all kinds of gestures or facial expressions one can perform during a speech[2].Even actors,specialists of the artistic representation of human emotions,suffer of this unconscious behaviour.One example of such unconscious eye movement is the saccade motion,which is denoted by a continuous, stepwise manner of movement as opposed to afluent and continuous one[1].The main goal of this paper is to provide a model for au-tomatic eyes animation,including saccade behaviours as-sociated with emotional attributes and also dependent of agents’role during interaction,e.g.if agent is listening or talking.Our model is in some way inspired by two works. First of all,the system ResponsiveFace[7]which provides a parametrized facial animation based on muscular defor-mation.Second,our model is also based on work proposed by Lee et al.[6]which describes a statistical model for sac-cade behaviour in eyes motion.The results presented in this paper aim to evaluate the impact of having saccade behaviour,associated with emotional attributes and roles-dependent animation.To achieve this goal,we used thecriterion of visually appreciation of facial animations gener-ated with our prototype.The remainder of this paper is organized as follows.Some methods for eyes animation are discussed in Section2.Sec-tion3describes our system for automatic eyes animation, while Section4describes our facial animation system that includes emotional state,head motion and character’s role during a performance,Section5discusses some experimental results obtained with our prototype by changing parameters in facial and eyes animation.Finally,our conclusions and final remarks are drawn in Section6.2.RELATED WORKResearch on facial animation has not deeply focused on eyes motion,even if everybody agrees that eyes play an essen-tial role in inter-personal communication.Moreover,several systems have proposed face-to-face conversation with a user. Poggi et al.[8]focused their work on gaze behaviour and propose a meaning-to-face approach,allowing to simulate automatic generation of face expressions based on seman-tic data.Like any communicative signal,gaze includes two different aspects:a signal,which encompasses a set of phys-ical features and the dynamic behaviour of eyes in gaze;and the meaning which is related with a set of beliefs that gazes communicates.Fukayama and collaborators[4]propose a gaze movement model that enables an embodied interface agent to convey different impressions to users.Managing one’s own impres-sion,in order to influence the behaviours of others,plays an important role in human communications.With this pur-pose,they build the gaze movement model based on three parameters selected from psychological studies:amount of gaze,mean duration of gaze and gaze points while averted. In their work,they also present experiments in which sub-jects evaluated their impressions created by gaze patterns produced by altering the gaze parameters.The results in-dicated that reproducible relations exist between the gaze parameters and impressions.Cassel et al.[3]address the problem of designing conversa-tional agents that exhibit appropriate gaze behaviour during dialogues with human users,mainly focused on the relation-ship between information structure and gaze behaviour.A behavioural model used to simulate realistic eye-gaze be-haviour and body animations for avatars in a shared immer-sive virtual environment was proposed by Vinayagamoorthy et al.[9].Their model was based on data and studies carried out on the behaviour of eye-gaze during face-to-face commu-nication.Also,Garau et al.[5]investigate the importance of gaze behaviour in avatars representing people engaged in conversation.They compared responses in four mediated conditions:video,audio-only,and two avatar conditions.In our work,differently from the previous cited papers,the main goal is to evaluate the visual impact of saccadic eye movements in virtual humans,when they are connected with emotional and roles-dependent animations.The saccadic eye movements are related with the rapid motion which ex-ists in both eyes between two gaze positions.Lee et al.[6] present a statistical eye movement model,which is based on both empirical studies of saccades and acquired eye move-ment data.This work is used as basis for our facial anima-tion model in order to provide the saccade behaviour.Our model,which includes the saccade motion,emotional attributes and different roles during the conversational pro-cess,is developed as part of ResponsiveFace[7].Next sec-tions present details of our animation architecture.3.EYES ANIMATION MODELEye motion in our system is based on work proposed by Lee et al.[6]which describes a statistical model for sac-cade behaviour.Indeed,they use eye trackers in order to extract the dynamic characteristics of the eye movements. More specifically,they were interested in extracting saccadic behaviour by obtaining the image(x,y)coordinates of the pupil center.The main components of Lee model are At-tention Monitor,Parameter Generator and Saccade Synthesizer.Thefirst one is responsible for monitoring the system,also detecting aspects such as:subject role in the conversation(talking or listening mode),head rotation, as well as to detect whether the current frame has reached the gaze duration.If the direction of head rotation changed, and its amplitude is bigger than a specified threshold,or if the timer for gaze motion is expired then this component ac-tivates the component Parameter Generator.Such compo-nent,responsible for generation of eyes parameters,is used to determine the saccade magnitude,direction,duration and instantaneous velocity.Then,the Saccade Synthesizer is ac-tivated.In our work,we based the generation of our saccade be-haviours in equations proposed by Lee et al.[6],and also Vinayagamoorthy et al.[9].Firstly,as proposed by Lee,we generate a random number between0and15,which corresponds to percentage of oc-currence of saccadic motion P.Then,magnitude of saccadic motion can be obtained by Equation1,A=−6.9log(P/15.7)(1) where A is saccade magnitude in degrees.Also,Lee defines that the maximum saccade magnitude is limited to27.5de-grees for talking mode,while22.7degrees for listening mode. The saccade direction can follow the head rotation,whether a threshold is attained.On the other hand,the direction is determined based on eight specific directions,as detailed in[6].Concerning saccade duration,Equation2is used with values d=2.4ms/degree and D0=25ms.D=D0+dA(2) Equations1and2are used as proposed by Lee et al.[6]. However,the saccade velocity motion is used as proposed by Vinayagamoorthy et al.[9](Equation3),where authors improve the referred equation,avoiding negative values.V=14e[−(π/4)(X−3)2](3)where V is instantaneous velocity (degrees/frames).X is related with time in frames of a saccadic motion,which hap-pens into an interval of Y as described next.Lee described that in talking mode,the inter-saccadic interval is gener-ated by defining 2classes of gaze,mutual and away.The equations 4and 5,respectively define such situations,Y =2.5524×10−4X 2−0.1763X +32.2815(4)Y =1.8798×10−5X 4−0.0034X 3+0.2262X 2−6.7021X +78.831.(5)In listening mode,the inter-saccadic interval is obtained by choosing a random gaussian number using average and stan-dard deviation proposed in [6].The main contribution of this paper in the context of sac-cade behaviour is the inclusion of such model in the facial animation system,also integrating it in the roles dependent animation and emotional status.In the next section,we give an overview of our facial animation model and show how we integrate the saccadic behaviour into the system.4.FACIAL ANIMATION SYSTEMOur facial animation model is based on the ResponsiveFace developed by Ken Perlin [7].The goal of this system is to create an embodied agent that reacts with responsive facial actions in real-time with convincing emotive expressiveness.One of the main characteristics of the ResponsiveFace is that it promotes a “minimalist approach”for experiments in computer animation.First,the virtual agent has been de-signed with a non-photorealistic look.Second,it defines a minimal number of facial expression elements that can pro-duce a convincing impression of character and personality.In this way,the system emphasizes the essential aspects for depicting emotion in a virtual character.The implementation of the system is summarized as follows:the face geometry is represented by a 3D polygonal mesh and rendered using a cartoon shading style (see Figure1).Figure 1:Polygonal Face Model and Cartoon Style ShadingThe face animation is controlled by pseudo-muscles that acton sets of vertices of the face geometry.Each pseudo-muscle gives control with a low-level degree of freedom for the fa-cial expression.These controls are called Flexors and are parametrized in the interval [−1,1],that is from full con-traction (−1)to relaxed (0),to full extension (1).Expressions are created by combining the action of groups of flexors into higher-level controls or Actions ,that vary in time.The system is designed to allow mixing of these high-level actions using a composition of movements that blend layers of actions in natural ways for a final expression animation.A basic set of emotions can be modeled using these expres-sions.Snapshots are shown in Figure 2,respectively they express emotional states such as:surprised,happy,arro-gant,angry,disappointed,annoyed,and frightened.We have extended the ResponsiveFace system in several ways:1)synchronized audio reproduction;2)lip-sync for speech animation;3)use of multiple procedural motion gen-erators;and 4)input parameters to control animation.The system has as input an audio file in the wave format,and parameter files that are interpreted by motion generators.The output is an animation of the virtual character with layered expressions and synchronized with the audio.The animation pipeline can be divided into two phases:a pre-processing stage and a real-time animation reproduc-tion.In the pre-processing stage,the audio and parameter files are read and validated.Each parameter file defines a different group of transitions (or actions)during the time.We are working with four types of parameter files:emotion transitions,eye gaze movements,head movements and talk-ing/listening status transitions.The parameter file has also a general format and can be customized for different types of parameters (i.e.,binary,scalar,vector,etc.).Furthermore,the format encodes a time varying parameter.The general structure of these files is as follows:a header describing the parameter elements;and a list of time intervals with asso-ciated parameter values.As an example,a head motion file is shown below:header#head motionelement transition 2property int durationproperty double turn_value property double nod_value property double tilt_value end_header 2;1;0.8;03;-1;-1;0.7Once a parameter file has been loaded,each element transi-tion is transformed by the corresponding motion generator in a common data structure for the animation,which we call script animation element .This structure stores important values that will be used during the real time animation re-production stage like initial time,duration,the specific value for each flexor (or muscle)and the listening/talking statusFigure2:Snapshots of possible emotional states defined in ResponsiveFace System.(the character role during the conversational process).Flex-ors that do not belong to the element transition receive a “do not care value”.In the example,when converting the head movement to a script animation element the eyesflex-ors receive the“do not care value”.Motion layering is obtained by the subsequent activation of different motion generators.Currently we are using the motion generators,mostly to control head motion,face ex-pressions and eye motion.The saccade behaviour described in the previous section is implemented as a motion generator for the experiments described in Section5.The output of the preprocessing stage is a temporal ordered list with all script animation elements.In the animation re-production stage,the system plays the audio and displays the animated face,synchronized in real-time.One thread is responsible for playing the audio and another thread syn-thesizes the motion and renders the virtual character’s face based on the script animation specification.We have also implemented an interactive front-end for the system in order to allow the user to perform different exper-iments and format applications,shown in Figure3.The user can interact directly with the virtual character or read in a script with the parameters of an animated perfor-mance.In the interactive mode(see Figure3),the user can select different emotional states,change the associated expressions and apply different visualization controls for the animation.In the batch animation mode(see Figure3),the user speci-fies parameterfiles associated with an animation.The archi-tecture of the system is general enough that various motion generators and parameters can be added into the system.So far,we have included the following parameters that are used for our experiments:1)recorded audio;2)emotion state;3)eye gaze motion;4)head movement;5)speech action.The recorded audio is used for playback.The emotion state is used by the expression generator.The eye gaze motion and head movement are used by the saccade generator.The speech action state is used by both expression and saccade generators.Next section presents some results of using the system to investigate the influence of eye movement in the expressive-ness of a virtual character.5.RESULTSThis section presents experimental results we have obtained by using our facial animation system.We applied a sub-jective test with a group of people1to evaluate the impor-tance of our system eyes movement support for facial ani-mation with speech synchronization.In such experiments, we played the animation using cartoon style rendering and including the features of head movement,different facial ex-pressions based on emotions,and character role during the conversation(i.e.listening or talking).In order to focus on the eyes animation,we decided to dis-play only the upper region of the face(i.e.,the eyes and eyebrows).The animation was played for two specific di-alogs that establish the emotional context.Thefirst dialog was extracted from Shrek2movie where our character acts like the woman(Fiona)talking with Shrek.The second dia-log is a part of Ice Age2film and our actor plays the female mammoth role.Both movie tracks were chosen because they present conversational scenes of known animationfilms and with a great emotion transition during the dialog between the characters.Table1shows the dialogue for thefirst movie to exemplify the input information for generating thefinal facial anima-tion.To realize our experiments,we generated three video ver-sions of our character animation for each movie dialog:a)with no eyes movement;b)with eyes movement based only on Perlin noise;andc)with eyes movement based on saccadic behaviour(blinkmotion is based on Perlin noise).In case(a),the character eyeballs remainfixed.The charac-ter has movements only due to the emotion transitions and head movements during both dialogs.1Supplemental material that accompanies the paper submis-sion is available for revision.Figure3:Interactive front-end for experimental set-up.Table1:Simulated Dialogue:Information noted in XMLfile.Simulated DialogueSpeaker Character Speech Fiona’s role Fiona’s EmotionFiona Very nice,Shrek Speaking Half AngryShrek What?I told you coming here was a bad idea.Listening NaturalFiona You could’ve at least tried to get along with my father.Speaking AngryShrek I don’t think I was going to get Daddy’s blessing,even if I did want it.Listening NaturalFiona Do you think it might be nice if somebody asked me what I wanted?Speaking Half AngryShrek Sure.Do you want me to pack for you?Listening NaturalFiona You’re unbelievable!Speaking SurprisedFiona You’re behaving like a...Speaking Half angryFiona(Silence)Silence Disappointed(2seconds) Shrek Go on!Say it!Listening NaturalFiona Like an ogre!Speaking AngryShrek Here’s a newsflash for you!Whether your parents like it or not...I am anogre!Listening NaturalShrek ARGHHHHHHHHHHHHHHHHHHH!Listening FrightenedShrek And guess what,Princess?That’s not about to change.Listening Half AngryFiona(Silence)Silence Natural(11seconds) Fiona I’ve made changes for you,Shrek.Think about that.Speaking DisappointedIn case(b),we applied the noise function developed by Ken Perlin[7].Indeed,this noise function allowed computer graphics artists to better represent the complexity of natural phenomena in visual effects for the motion picture industry. More focused on generating natural-looking textures,Perlin noise has also been applied in other applications,such as in the development of ResponsiveFace[7].In case(b),we only applied Perlin noise for generating the eyes movement. Figure4on left side,shows the trajectory of pupil center as a function of time.Time increases along thefigure height (the beginning of simulation is located at the bottom of the image,and the last frame is in its top).In case(c)we applied saccadic behaviour for the animation production.Saccadic behaviour was used to generate the pupil movement,however,the blink motion was still gen-erated as a function of Perlin noise.Future investigations will focus on the blink motion more adapted to the saccadic model.For saccadic behaviour we used basically the model proposed by Lee et al.[6],as described in Section3.The right-side of Figure4shows the pupil trajectory generated based on saccadic behaviour during5000frames,similar to the case(b).We can clearly note in such graphics that Perlin noise be-haves as expected,i.e.providing a random motion of pupil center.On the other hand,saccadic motion presents the real motion of pupil center based on statistical data.It describes natural and involuntary eye motion,escaping from the eye center and returning to such position in certain periods of time.For case(a),we did not consider different roles during the conversation,what also happened in the case(b),since Per-lin noise does not deal with such aspect.On the other hand,saccadic behaviour(case c)generates different mo-tions based on the conversational role.Figure5shows some snapshots of the generated animation for thefirst dialog (Shrek2)using the case(c).Figure 4:On left-side:Pupil motion in function of time,using Perlin noise.On right-side:Pupil mo-tion also in function of time,using saccadicmotion.Figure 5:Snapshots of our simulation using cartoon style rendering.The snapshots refer respectively to the second and first speech of Fiona,second speech of Shrek,fourth and seventh speech of Fiona and sixth speech of Shrek,as detailed in Table 1.The subjective test we conducted is similar to the one ap-plied by Lee et al.[6],but we added some questions (Q5and Q6)specifically related with our work.The six questions are described as follows:Q1:Did the character on the screen appear interested in (5)or indifferent (1)to you?Q2:Did the character appear engaged (5)or distracted (1)during the conversation?Q3:Did the personality of the character look friendly (5)or not (1)?Q4:Did the face of the character look lively (5)or dead-pan (1)?Q5:Did the eyes character transmitted emotion (5)or werewithout emotion (5)?Q6:In general,which score do you give to the characterperformance in those dialogs?(5)Good or (1)bad?Eleven people were invited to participate in our test.Each one gave a score,varying from 1to 5,for our six questions.Note that the higher scores correspond to more positive at-tributes in a conversational partner.To answer these questions,the participants saw six different video sequences:the three different cases aforementioned for the two selected animation movies.Figure 6and Figure 7summarize the average score for each one of our six questions applied for Shrek 2and Ice Age 2,respectively.These graphics indicate that the three char-acter eyes movement types have significant different meanscores.Figure 6:Results of subjective evaluations for dia-logue 1(Shrek 2animation).The graphic shows the average score for eachquestion.Figure 7:Results of subjective evaluations for dia-logue 2(Ice Age 2).The graphic shows the average score for each question.Analyzing the graphics,we observe that for all questions and for both movies the mean score for saccadic movementis never worse than the mean score for the other cases.Analysing the answers for question1,we perceive that the absence of eyes movement contributes for a worse character performance evaluation,as expected.For questions2,4and6we identify that applying sac-cadic motion the improvement in the character performance, comparing with the exclusive use of Perlin Noise,has been greater(14.86%,18.31%,14.29%,respectively,of improve-ment).We understand that since questions3and5are more related with emotional aspects of the character,in these cases the pupil movement is more a complement for the facial expression.However,when the evaluation concerns specifi-cally with the emotion transmitted through the eyes(ques-tion3),the pupil movement(whether saccadic or random) enriches the user experience.We conclude with the experimental results that it is nec-essary to combine a noise with the saccadic motion,but not a pure random noise,since it is important to consider the character emotion and other context information like if the character is listening or talking during the conver-sation.The noise incorporation aims at providing a more natural behaviour,influencing in the pupil motion rhythm. Actually,several participants highlighted the performance of case(c)because of the character kept their attentional focus in the conversation but at the same time presented a natural behaviour when deviating its look.Finally,we use a realistic face manually animated based on the motion generated with our model.The goal is to im-prove the visual realism,since we believe that the impact of including saccadic behaviour can be even better if applied to a realistic face.Figure8shows some snapshots of such animation.The main goal of this section was to show(also by analyz-ing the short movies which accompany this paper)that the inclusion of emotion and saccadic behaviours increase the realism of facial animation.Moreover,if the character is to be used to provide inter-communication with users,each visual detail that could be improved in facial animation,cer-tainly contributes to the feeling of immersion,what is very desirable in such type of system.Next section presentsfinal remarks and also future directions we intend to go forward.6.FINAL REMARKSIn this paper we investigated the influence of eye motion in the expressiveness of a virtual character.To this end,we improved the statistical model for saccade behaviour of Lee et al.[6]and combined it with dynamic expressions of the upper face in the eye region.We implemented these mech-anisms as motion generators in a testbed system based on the ResponsiveFace[7].We also produced several experi-ments to determine the impact of natural eye motion and expressive reaction in a conversation with emotional con-tent.The preliminary results from these experiments indi-cate that only through the combination of different mecha-nisms it is possible to achieve a high level of expressiveness in a virtual character.Moreover,the eyes play a leading role for directing the characters face in a conversation and also revealing emotional state.As for future work,we would like to develop an statistical model for eye blink motion,that is integrated with the sac-cadic movement.Another avenue for future research is the use of situated eye gaze behaviour combined with emotional and contextual information from a multi-agent conversation. We wish to thank Marcelo H.Borba for his work on3D mod-eling,animation and video editing.We would also like to thank the people who participated in our evaluation.This work was supported by CNPq and FINEP.7.REFERENCES[1]W.Becker.In The Neurobiology of Saccadic EyeMovements.R H Wurtz and M E Goldberg(eds),1989.[2]J.Cassel,J.Sullivan,S.Prevost,and E.Churchill.Embodied Conversational Agents.MIT Press,NewYork,2000.[3]J.Cassell,O.Torres,and S.Prevost.Modeling GazeBehavior as a Function of Discourse Structure.In First International Workshop on Human-ComputerConversations,Bellagio,Italy,1997.[4]A.Fukayama,T.Ohno,N.Mukawa,M.Sawaki,andN.Hagita.Messages embedded in gaze of interfaceagents—impression management with agent’s gaze.In CHI’02:Proceedings of the SIGCHI conference onHuman factors in computing systems,pages41–48,New York,NY,USA,2002.ACM Press.[5]M.Garau,M.Slater,S.Bee,and M.A.Sasse.Theimpact of eye gaze on communication using humanoid avatars.In CHI’01:Proceedings of the SIGCHIconference on Human factors in computing systems,pages309–316,New York,NY,USA,2001.ACM Press.[6]S.P.Lee,J.B.Badler,and N.I.Badler.Eyes alive.InSIGGRAPH’02:Proceedings of the29th annualconference on Computer graphics and interactivetechniques,pages637–644,New York,NY,USA,2002.ACM Press.[7]yered compositing of facial expression.InACM SIGGRAPH-Technical Sketch,1997.[8]I.Poggi and C.Pelachaud.Signals and meanings ofgaze in animated faces.In Language,Vision and Music, pages133–144.Mc Kevitt,Paul,Sen Nuallin andConn Mulvihill,2002.[9]V.Vinayagamoorthy,M.Garau,A.Steed,andM.Slater.An Eye Gaze Model for Dyadic Interaction in an Immersive Virtual Environment:Practice andExperience.In Computer Graphics Forum,volume23, 2004.。
With increased market competition, Traditional performance management is clearly no longer meeting the needs with the times; new performance evaluation is increasingly becoming an indispensable tool.In today's society, who like every day someone is behind with their assessment, inspection, and supervision? Almost all of the people say: I do not like performance management. Since people do not like the appraisal, then why should the implementation of enterprise evaluation system still alive? The enterprise’s goal is clearly, their aims to get the maximization of business efficiency. Enterprises may also make money before, but not necessarily to maximize, through performance measurement to achieve the goal of maximizing performance. Then the topic was raised up: How to maximize the benefits of the Enterprise?Maximize the Enterprise benefits are generally two paths to take:Firstly, take an action of product innovation, technology updates and equipment modification; According to the principles of economy, achieving technical efficiency is considered as a prerequisite for a producer’s further optimization behaviour and, therefore, as a matter of rationality.()For example, Microsoft, Intel and other multinational companies do that so, of course, maximizing the benefits can be achieved; we call this level the technical level.Secondly, motivate the enthusiasm of every staffs to achieve the maximization of business efficiency, we call the human dimension.Obviously, performance management is mainly to maximize the benefits of the pursuitof its employees by encouraging its stuffs.Assessment of the performance management of human resources for the general decision-making, such as for promotion, transfer, dismissal, etc., should be on the performance-based assessment; and this can be used as a effectiveness standards of recruitment andstaff development program; new staff performance will be clearly show out;Performance evaluation can also provide feedback to staff so that the stuffs can understand the organizat ions’ view on their performance; In addition, the payment of wages also basedon performance evaluation, According to the results of performance evaluation to determine whowill receive higher wages or other reward.Performance measurement emphasized the organizational goals and personal goals consistent; also emphasis on organizations and individuals has grown to form a good situation; in all aspects of the performance management, managers and employees are required to participate.The main factors affect the performance are staff skills, the external environment, internal conditions and incentive effects.Staff skills are staffs’ core competencies which are internal factors, through training and development can be improved; so that is why many companies need the new staffs to take a period of training program.The external environment is an objective factor which we can not control; the demographic environment, economic environment, natural environment, technological environment, political environment and cultural environment.Internal conditions is resources for the organizations and individuals, but also an objective factor, to a certain extent we can change the constraints of internal conditions;Incentive effect is the initiative, enthusiasm that the organizations and individuals to achieve their goals, this is a subjective factor.Performance Management results in:1. clear the Enterprise desired results. [Develop clear objectives]2. Pool staff goals and corporate objectives. [Find a way and plan]3, learn and grow in the process of study progress. [Evaluation and Review]4 to create a shared value. [Motivation and Punishment] (Investors, employees, thecompany competitive).In consideration of the financial accounting and management accounting, they perform a fundamental role in the measurement of performance within an organisation, if the performance measurement system is reasonable, it can achieve the maximum of accounting profits, fully elaborate the function of accounting, management and supervision functions.Financial performance evaluation based on financial statements, but financial statements are the product of traditional financial accounting model. Overall, the traditional financial accounting model is based on accrual basis, historical cost, and double-entry bookkeeping method of the accounting model. This accounting model will lead to financial statements as the main body of financial accounting.Financial accounting is only limited to the traditional "balance sheet" concept. Thus, some of the businesses activities are treat as "off-balance sheet business." These “off-balance sheet” businesses are more important for future sustainable development. Therefore, under this accounting model, the financial statements use as "accounting-specific language" to summary of the financial consequences of business activities.A corporate financial statement is difficult to fully reflect the business activities.Based on the historical cost principle, financial accounting and financial statements with "the accounting-specific language" to describe business activities and their results can only show "How the business in the past."Financial accounting and financial statements do not guarantee or commitment to people for "tomorrow would be better.”Because o f the financial accounting and corporate financial statements is just talk about the story in the past!This determines the "story" of the logical starting point is the result oriented. Separate "results" not to show cause and effect of "why produce such a result".People only "know without knowing why."For example, a company created an annual profit of £5,000 million, who knows in which environment created these profits and based on what strategy to achieve it?For example, some of Chinese listed companies, why some listed companies in excellent financial performance before listing, and these listed soon in trouble, or even become the family of PT or ST families? That is only the reason for the financial statements?Even the financial results of listed companies are completely true and reliable before; the company still may get into trouble!That is why?Because of financial accounting and corporate financial statements is just talk about the story of the past!Even without the "false accounts", listed companies, the strategic positioning may be a problem, the original sound financial performance "will never come back”. In this world, many famous companies are no longer adjust in a changing strategic environment, this for a good example.Another reason, the internal organizational structure may changed, and then change the original to create a good financial performance, thereby resulting in poor financial performance. Sometimes, May also the product is still in process of mature, naturally bring a good financial performance to enterprise, but after listed, the production is just entering a recession, poor financial performance, of course.Reasons above can lead the changes of corporate financial performance before and after listing. How can we compare the financial performance of listed companies so simple like this?Financial accounting and financial statements can not reflect this Performance Driver.Only based on "Environment - Strategy - Process - behaviour - the result”, the integration of the logical basis, we can truly understand and appreciate "results."This may be hard for the financial accounting and financial statements who told the "past" story about the business activities.Another aspect, based on monetary measurement, financial accounting and corporate financial statements can only tell the story of tangible assets.Today, intangible assets are becoming an important source of value creation.Intangible assets can enable enterprises to develop customer relationships, customer loyalty, new customers and markets, innovative products and services at low cost in a short time to providepersonalized, high quality products or services, enhance staff skills capacity, improve productivity and quality, shorten response time to customer needs.The new information technologies and global market opening activities changed the basic assumptions of modern businessOnly reliable to the tangible assets, the enterprise has been difficult to maintain a sustainable competitive advantage.The information age calls for a new driving force of competition. Capacity of deal with the development and utilization of intangible assets of an enterprise and create sustainable competitive advantage has become a major deciding factor.However, financial accounting and financial statements do not tell the story of intangible assets adequately.Specifically, due to changes in corporate value creation model, there are some major limitations for the performance measurement based on the financial statements:(A) Not suited to today's business environmentToday's business enterprise value creation is not limited to tangible or fixed assets. On the contrary, the value of people within an organization rooted in the concept of enterprise, customer and supplier relationships, innovation and quality of cultural and other factors.Traditional financial indicators are based on internal performance standards.Value is important, however, the motivation of driving the value is more important.The motivation is to maximize the value of all business organizations to pursue sustainable development.(B)Financial performance evaluation as a management evaluation based on the data of the past, only to get lagging indicators (Lagging Indicators).Even for past actions, performance measurement is only a part of business activities, but not all. Financial performance measurement cannot provide sufficient guidance of the financial performance action for today and tomorrow.(C) Tend to emphasize the functional departmentsFinancial statements are usually prepared with the functional departments. Various departments make the statements separately, and then compiled summary of each other.Now, we see a team variety of functions by the composition, they are together in unprecedented ways to solve problems and create value. Traditional financial performance measurement cannot evaluate the true value or cost of the new relationship.(D) The lack of long-term strategic thinkingChanges in many plans are significantly reducing the cost.This may have a positive impact on the financial statements, but this cost-cutting measure is often long-term value creation for business activities (such as research and development, design and customer relationship management, etc.).The long-term value creation at the expense of the cost of short-term revenue could lead to partly optimization of organizational resources.(E)Financial indicators are not relevant at all levels of the organizationTo its characteristics, the financial statements (in particular the consolidated financial statements) is abstract. Standing on another level, the abstract will cover a lot of features. Our entire organization in the preparation of financial statements is another situation:We accumulate information again and again until they make the most of the decisions of managers and employees to useless position. Company employees at all levels in the organization must have some basis to work due to these performance data. These data must be closely related to their daily work.Management accounting, also known as "internal report accounting ", target on enterprise`s current and the future movement of funds. For the purpose of improving economic efficiency, and provide the scientific basis for the internal manager to do the decision-making. This is playing an increasingly important role in improving corporate governance and the efficient functioning of the company Management accounting is internal accounting which is a combination of management and accounting, it may has some differ with the financial accounting, tax accounting and other external accounting , mainly for corporate managers to provide strategic, tactical, daily business operations decision support services and performance management.For example, management accounting can be used as indicators of analysis or budget management to achieve the following problems: 1, how to design a good corporate cost control systems to achieve the optimal level of industry performance. How to eliminate non-value-added operations (activities), improved marketing, production, services, business processes;2,how to reduce the total cost on a strategic perspective, not just the manufacturing costs, sales and distribution because the cost of distribution phase is also high, there are a variety of management fees, these are also a part of cost need reduce strongly .3, Use numbers; which department is the best performance of the company , and which is the worst, how to improve the performance.Unlike financial accounting, management accounting also has a different set of performance evaluation indicators, input indicators, such as technology innovation and management, production and sales the “three specific items”. Meanwhile, a large number of formulas in management accounting can be accurately analyzing the organizational performance. Such as return on assets(ROA), this is an assessment of how profitable a company is relative to its total assets. Calculated by dividing a company's annual earnings by its total assets, ROA is displayed as a percentage. Sometimes t his is referred to as "return on investment”. Management accounting through a variety of financial information on companies and analyzed by ROA, can be very intuitive to understand the benefits of enterprise, but also a good method to assess internal operational performance. Management accounting methods through a variety of professional and technical analysis tools, the preparation of various management reports, providing effective management and optimal management decisions from financial information and the work for management accounting , not only can reflects the results of internal performance management, but also can clearly find out the management shortcomings that exist within organizations, and even the hidden dangers, and be ableto put forward a good solution. However, we must recognize that close relationship between financial accounting and management accounting, without data and information provided by financial accounting, management accounting it is only on paper. Therefore, management accounting relativeto the financial accounting from the financial information.A typical case of management accounting performance within evaluation, the budget management. The 18th century, the United Kingdom and the United States start took the national budget in national and local government on a trial basis. The early twentieth century, the emergence of cost accounting standards for the implementation of budget management within the enterprise has laid a solid foundation. Budget in real terms, that is, a balance of cash flows. No matter long-term budget, or short-term budget, are good internal relations as the scientific management with investment and financing, and become methods for scientific prediction and effective incentive. The process of budget preparation need for the budget committee and the Ministry of Finance prepared the guiding outline, and raise up the task aim during the preparation of a comprehensive budget system. Then, the top decision-making body give their opinion and reasons for adjustment of the budget system, the other department will based on these opinion and reasons to determine the final budget, the final completion of the final budget and funding program by the finance department. In the conclusion, through the completion of each budget targets level, and processes the performance measurement. Budget management is only part of the management accounting, conducting performance assessments, there are still some limitations. Due to budget management, relaxation may be occurred in a budget issue: in the budget preparation process, underestimating revenue and overestimate the cost. There are many reasons: Target inconsistency, conflict of interest; information asymmetry; avoid risk; pressure on the performance evaluation and so on. This will produce the impact of disruption on the objectivity of performance evaluation.Besides, financial accounting is a part of management; financial accounting is the working only on the paper, the calculation, the balance sheet, and the different reports for profits. However, management accounting does not only include these, a manager in a company can not only do the job of financialaccounting, but also play an important role in the management, the different strategy decisions, whether the customer are satisfied, for which department gain the profits and which is loss. This job is a mainly foundation in performance measurement within business.For example, a company found their new products did not keep up with the plan and undermine the company's marketing plan, many products are under quality problems, and customer satisfaction is declining. Then the company did an internal investigation to dig for the reason. With the data from the HRM, the manager found the question should concern more about the high stuff turnover, with more and more stuff level the company, or with the short time in position. TheWhen management accounting is during the process of performance measurement within the organization, there are several problems that require attention.First, performance evaluation of management accounting through the financial indicators system is based on profit, which does not adequately reflect the creation process of value, but also undermined the sustainable development of enterprises.Second, management accounting is the work within a technical content, not every accountant is competent, and professional and ethical standards of occupational skills and performance evaluation may affect the final result.Third, management accountings itself, there are still large deficiencies, only their management accounting has been improved to better performance within the organization to carry out assessment.。