曼昆宏观经济学英语课后题答案
- 格式:doc
- 大小:923.00 KB
- 文档页数:54

Chapter 28Problems and Applications1. The labor force consists of the number of employed (142,076,000) plus the number of unemployed(7,497,000), which equals 149,573,000.To find the labor-force participation rate, we need to know the size of the adult population. Adding the labor force (149,573,000) to the number of people not in the labor force (76,580,000) gives the adult population of 226,153,000. The labor-force participation rate is the labor force (149,573,000) divided by the adult population (226,153,000) times 100%, which equals 66%.The unemployment rate is the number of unemployed (7,497,000) divided by the labor force(149,573,000) times 100%, which equals 5.0%.2. Many answers are possible.3. Men age 55 and over experienced the greatest decline in labor-force participation. This wasbecause of increased Social Security benefits and retirement income, encouraging retirement at an earlier age.4. Younger women experienced a bigger increase in labor-force participation than older womenbecause more of them have entered the labor force (in part because of social changes), so there are more two-career families. In addition, women have delayed having children until later in life and have reduced the number of children they have, so they are in the labor force for a greater proportion of their lives than was the case previously.5. The fact that employment increased 1.5 million while unemployment declined 0.6 million isconsistent with growth in the labor force of 0.9 million workers. The labor force constantlyincreases as the population grows and as labor-force participation increases, so the increase in the number of people employed may always exceed the reduction in the number unemployed.6. a. A construction worker who is laid off because of bad weather is likely to experienceshort-term unemployment, because the worker will be back to work as soon as theweather clears up.b. A manufacturing worker who loses her job at a plant in an isolated area is likely toexperience long-term unemployment, because there are probably few other employmentopportunities in the area. She may need to move somewhere else to find a suitable job,which means she will be out of work for some time.c. A worker in the stagecoach industry who was laid off because of the growth of railroads islikely to be unemployed for a long time. The worker will have a lot of trouble findinganother job because his entire industry is shrinking. He will probably need to gainadditional training or skills to get a job in a different industry.d. A short-order cook who loses his job when a new restaurant opens is likely to find anotherjob fairly quickly, perhaps even at the new restaurant, and thus will probably have only ashort spell of unemployment.e. An expert welder with little education who loses her job when the company installsautomatic welding machinery is likely to be without a job for a long time, because she lacksthe technological skills to keep up with the latest equipment. To remain in the weldingindustry, she may need to go back to school and learn the newest techniques.12 Chapter 28/Unemployment7. Figure 2 shows a diagram of the labor market with a binding minimum wage. At the initial minimumwage (m1), the quantity of labor supplied L1S is greater than the quantity of labor demanded L1D, and unemployment is equal to L1S−L1D. An increase in the minimum wage to m2 leads to anincrease in the quantity of labor supplied to L2S and a decrease in the quantity of labor demanded to L2D. As a result, unemployment increases as the minimum wage rises.Figure 28. a. Figure 3 illustrates the effect of a union being established in the manufacturing labormarket. In the figure on the left, the wage rises from w1U to w2U and the quantity of labordemanded declines from U1 to U2D. Because the wage is higher, the quantity supplied oflabor increases to U2S, so there are U2S−U2D unemployed workers in the unionizedmanufacturing sector.b. When those workers who become unemployed in the manufacturing sector seekemployment in the service labor market, shown in the figure on the right, the supply oflabor shifts to the right from S1 to S2. The result is a decline in the wage in thenonunionized service sector from w1N to w2N and an increase in employment in thenonunionized service sector from N1 to N2.Chapter 28/Unemployment 3Figure 39. a. When the Japanese developed a strong auto industry, U.S. auto demand became moreelastic as a result of increased competition. With more elastic demand for autos, theelasticity of demand for American autoworkers increased.b. Because the rise in auto imports made the demand for autoworkers more elastic, tomaintain a higher-than-competitive wage rate requires a greater reduction in the quantityof labor demanded. So the union had to choose between allowing the union wage todecline or facing the loss of many jobs.c. Given the trade-off faced by the union, the growth of the Japanese auto industry forcedthe union wage to move closer to the competitive wage.10. a. If a firm was not providing such benefits prior to the legislation, the curve showing thedemand for labor would shift down by exactly $4 at each quantity of labor, because thefirm would not be willing to pay as high a wage given the increased cost of the benefits.b. If employees value the benefit by exactly $4 per hour, they would be willing to work thesame amount for a wage that's $4 less per hour, so the supply curve of labor shifts downby exactly $4.Figure 4c. Figure 4 shows the equilibrium in the labor market. Because the demand and supply curvesof labor both shift down by $4, the equilibrium quantity of labor is unchanged and thewage rate declines by $4. Both employees and employers are just as well off as before.d. If the minimum wage prevents the wage from falling, the result will be increasedunemployment, as Figure 5 shows. Initially, the equilibrium quantity of labor is L1 and theequilibrium wage is w1, which is $3 lower than the minimum wage w m. After the law ispassed, demand falls to D2 and supply rises to S2. Because of the minimum wage, thequantity of labor demanded (L2D) will be smaller than the quantity supplied (L2S). Thus,there will be unemployment equal to L2S–L2D.4 Chapter 28/UnemploymentFigure 5Figure 6e. If the workers do not value the mandated benefit at all, the supply curve of labor does notshift down. As a result, the wage rate will decline by less than $4 and the equilibriumquantity of labor will decline, as shown in Figure 6. Employers are worse off, because they now pay a greater total wage plus benefits for fewer workers. Employees are worse off,because they get a lower wage and fewer are employed.。

曼昆微观经济学课后练习英文答案集团标准化办公室:[VV986T-J682P28-JP266L8-68PNN]the link between buyers’ willingness to pay for a good and the demandcurve.how to define and measure consumer surplus.the link between sellers’ costs of producing a good and the supply curve.how to define and measure producer surplus.that the equilibrium of supply and demand maximizes total surplus in amarket.CONTEXT AND PURPOSE:Chapter 7 is the first chapter in a three-chapter sequence on welfare economics and market efficiency. Chapter 7 employs the supply and demand model to develop consumer surplus and producer surplus as a measure of welfare and market efficiency. These concepts are then utilized in Chapters 8 and 9 to determine the winners and losers from taxation and restrictions on international trade.The purpose of Chapter 7 is to develop welfare economics—the study of how the allocation of resources affects economic well-being. Chapters 4 through 6 employed supply and demand in a positive framework, which focused on the question, “What is the equilibrium price and quantity in a market” This chapter now addresses the normative question, “Is the equilibrium price and quantity in a market the best possible solution to the resource allocation problem, or is it simply the price and quantity that balance supply and demand” Students will discover that under most circumstances the equilibrium price and quantity is also the one that maximizes welfare.KEY POINTS:Consumer surplus equals buyers’ willingness to pay for a good minus the amount they actually pay for it, and it measures the benefit buyers get from participating in a market. Consumer surplus can be computed by finding the area below the demand curve and above the price.Producer surplus equals the amount sellers receive for their goods minus their costs of production, and it measures the benefit sellers get from participating in a market. Producer surplus can be computed by finding the area below the price and above the supply curve.An allocation of resources that maximizes the sum of consumer and producer surplus is said to be efficient. Policymakers are often concerned with the efficiency, as well as the equality, of economic outcomes.The equilibrium of supply and demand maximizes the sum of consumer andproducer surplus. That is, the invisible hand of the marketplace leadsbuyers and sellers to allocate resources efficiently.Markets do not allocate resources efficiently in the presence of market failures such as market power or externalities.CHAPTER OUTLINE:I. Definition of welfare economics: the study of how the allocation of resources affects economic well-being.A. Willingness to Pay1. Definition of willingness to pay: the maximum amount that a buyer will pay for a good.2. Example: You are auctioning a mint-condition recording of Elvis Presley’s first album. Four buyers show up. Their willingness to pay is as follows:If the bidding goes to slightly higher than $80, all buyersdrop out except for John. Because John is willing to paymore than he has to for the album, he derives some benefitfrom participating in the market.3. Definition of consumer surplus: the amount a buyer is willing to payfor a good minus the amount the buyer actually pays for it.4. Note that if you had more than one copy of the album, the price in the auction would end up being lower (a little over $70 in the case of two albums) and both John and Paul would gain consumer surplus.B. Using the Demand Curve to Measure Consumer Surplus1. We can use the information on willingness to pay to derive a demandmarginal buyer . Because the demand curve shows the buyers’ willingness to pay, we can use the demand curve to measure c onsumer surplus.C. How a Lower Price Raises Consumer Surplussurplus because they are paying less for the product than before (area A on the graph).b. Because the price is now lower, some new buyers will enter the market and receive consumer surplus on these additional units of output purchased (area B on the graph).D. What Does Consumer Surplus Measure?1. Remember that consumer surplus is the difference between the amount that buyers are willing to pay for a good and the price that they actually pay.2. Thus, it measures the benefit that consumers receive from the good as the buyers themselves perceive it.III. Producer SurplusA. Cost and the Willingness to Sell1. Definition of cost: the value of everything a seller must give up to produce a good .2. Example: You want to hire someone to paint your house. You accept bidsfor the work from four sellers. Each painter is willing to work if the priceyou will pay exceeds her opportunity cost. (Note that this opportunity costthus represents willingness to sell.) The costs are:sellers will drop out except for Grandma. Because Grandma receives more than she would require to paint the house, she derives some benefit from producing in the market.4. Definition of producer surplus: the amount a seller is paid for a good minus the seller’s cost of providing it.5. Note that if you had more than one house to paint, the price in the auction would end up being higher (a little under $800 in the case of two houses) and both Grandma and Georgia would gain producer surplus.ALTERNATIVE CLASSROOM EXAMPLE:Review the material on price ceilings from Chapter 6. Redraw themarket for two-bedroom apartments in your town. Draw in a priceceiling below the equilibrium price.Then go through:consumer surplus before the price ceiling is put into place. consumer surplus after the price ceiling is put into place. You will need to take some time to explain the relationship between the producers’ willingness to sell and the cost of producing the good. The relationship between cost and the supply curve is not as apparent as the relationship between the It is important to stress that consumer surplus is measured inmonetary terms. Consumer surplus gives us a way to place amonetary cost on inefficient market outcomes (due to governmentB. Using the Supply Curve to Measure Producer Surplus1. We can use the information on cost (willingness to sell) to derive a2.the cost of the marginal seller. Because the supply curve shows the sellers’ cost (willingness to sell), we can use the supply curve to measure producer surplus.C. How a Higher Price Raises Producer Surplussurplus because they are receiving more for the product than before (area C on the graph).b. Because the price is now higher, some new sellers will enter the market and receive producer surplus on these additional units of output sold (area D on the graph).D. Producer surplus is used to measure the economic well-being of producers,ALTERNATIVE CLASSROOM EXAMPLE:Review the material on price floors from Chapter 6. Redraw the marketfor an agricultural product such as corn. Draw in a price supportabove the equilibrium price.Then go through:producer surplus before the price support is put in place.producer surplus after the price support is put in place.Make sure that you discuss the cost of the price support tomuch like consumer surplus is used to measure the economic well-being of consumers.IV. Market EfficiencyA. The Benevolent Social Planner1. The economic well-being of everyone in society can be measured by total surplus, which is the sum of consumer surplus and producer surplus:Total Surplus = Consumer Surplus + Producer SurplusTotal Surplus = (Value to Buyers – Amount Paid byBuyers) +(Amount Received by Sellers – Cost to Sellers)Because the Amount Paid by Buyers = Amount Received bySellers:2. Definition of efficiency: the property of a resource allocation of maximizing the total surplus received by all members of society .3. Definition of equality: the property of distributing economicprosperity uniformly the members of society .a. Buyers who value the product more than the equilibrium price will purchase the product; those who do not, will not purchase the product. Inother words, the free market allocates the supply of a good to the buyers who value it most highly, as measured by their willingness to pay.b. Sellers whose costs are lower than the equilibrium price will produce the product; those whose costs are higher, will not produce the product. Inother words, the free market allocates the demand for goods to the sellers who can produce it at the lowest cost.value of the product to the marginal buyer is greater than the cost to the marginal seller so total surplus would rise if output increases.Pretty Woman, Chapter 6. Vivien (Julia Roberts) and Edward(Richard Gere) negotiate a price. Afterward, Vivien reveals shewould have accepted a lower price, while Edward admits he wouldhave paid more. If you have done a good job of introducingconsumer and producer surplus, you will see the light bulbs gob. At any quantity of output greater than the equilibrium quantity, the value of the product to the marginal buyer is less than the cost to the marginal seller so total surplus would rise if output decreases.3. Note that this is one of the reasons that economists believe Principle #6: Markets are usually a good way to organize economic activity.C. In the News: Ticket Scalping1. Ticket scalping is an example of how markets work to achieve anefficient outcome.2. This article from The Boston Globe describes economist Chip Case’sexperience with ticket scalping.D. Case Study: Should There Be a Market in Organs?1. As a matter of public policy, people are not allowed to sell their organs.a. In essence, this means that there is a price ceiling on organs of $0.b. This has led to a shortage of organs.2. The creation of a market for organs would lead to a more efficientallocation of resources, but critics worry about the equity of a market system for organs.V. Market Efficiency and Market FailureA. To conclude that markets are efficient, we made several assumptions about how markets worked.1. Perfectly competitive markets.2. No externalities.B. When these assumptions do not hold, the market equilibrium may not be efficient.C. When markets fail, public policy can potentially remedy the situation. SOLUTIONS TO TEXT PROBLEMS:Quick Quizzes1. Figure 1 shows the demand curve for turkey. The price of turkey is P 1and the consumer surplus that results from that price is denoted CS. Consumer surplus is the amount a buyer is willing to pay for a good minus the amount the buyer actually pays for it. It measures the benefit to buyers ofparticipating in a market.Figure 1 Figure 22. Figure 2 shows the supply curve for turkey. The price of turkey is P 1and the producer surplus that results from that price is denoted PS. Producer surplus is the amount sellers are paid for a good minus the sellers’ cost of providing it (measured by the supply curve). It measures the benefit to sellers of participating in a market.It would be a good idea to remind students that there are circumstances when the market process does not lead to the most efficient outcome. Examples include situations such as when a firm (or buyer) has market power over price or when there areFigure 33. Figure 3 shows the supply and demand for turkey. The price of turkey is P, consumer surplus is CS, and producer surplus is PS. Producing more turkeys 1than the equilibrium quantity would lower total surplus because the value to the marginal buyer would be lower than the cost to the marginal seller on those additional units.Questions for Review1. The price a buyer is willing to pay, consumer surplus, and the demand curve are all closely related. The height of the demand curve represents the willingness to pay of the buyers. Consumer surplus is the area below the demand curve and above the price, which equals the price that each buyer is willing to pay minus the price actually paid.2. Sellers' costs, producer surplus, and the supply curve are all closely related. The height of the supply curve represents the costs of the sellers. Producer surplus is the area below the price and above the supply curve, which equals the price received minus each seller's costs of producing the good.Figure 43. Figure 4 shows producer and consumer surplus in a supply-and-demand diagram.4. An allocation of resources is efficient if it maximizes total surplus, the sum of consumer surplus and producer surplus. But efficiency may not be the only goal of economic policymakers; they may also be concerned about equitythe fairness of the distribution of well-being.5. The invisible hand of the marketplace guides the self-interest of buyers and sellers into promoting general economic well-being. Despite decentralized decision making and self-interested decision makers, free markets often lead to an efficient outcome.6. Two types of market failure are market power and externalities. Market power may cause market outcomes to be inefficient because firms may cause price and quantity to differ from the levels they would be under perfect competition, which keeps total surplus from being maximized. Externalities are side effects that are not taken into account by buyers and sellers. As a result, the free market does not maximize total surplus.Problems and Applications1. a. Consumer surplus is equal to willingness to pay minus the price paid. Therefore, Melissa’s willingness to pay must be $200 ($120 + $80).b. Her consumer surplus at a price of $90 would be $200 $90 = $110.c. If the price of an iPod was $250, Melissa would not have purchased one because the price is greater than her willingness to pay. Therefore, she would receive no consumer surplus.2. If an early freeze in California sours the lemon crop, the supply curve for lemons shifts to the left, as shown in Figure 5. The result is a rise in the price of lemons and a decline in consumer surplus from A + B + C to just A. So consumer surplus declines by the amount B + C.Figure 5 Figure 6In the market for lemonade, the higher cost of lemons reduces the supply of lemonade, as shown in Figure 6. The result is a rise in the price of lemonade and a decline in consumer surplus from D + E + F to just D, a loss of E + F. Note that an event that affects consumer surplus in one market oftenhas effects on consumer surplus in other markets.3. A rise in the demand for French bread leads to an increase in producer surplus in the market for French bread, as shown in Figure 7. The shift of the demand curve leads to an increased price, which increases producer surplusfrom area A to area A + B + C.Figure 7The increased quantity of French bread being sold increases the demandfor flour, as shown in Figure 8. As a result, the price of flour rises, increasing producer surplus from area D to D + E + F. Note that an event that affects producer surplus in one market leads to effects on producer surplus in related markets.Figure 84. a.Figure 9b. When the price of a bottle of water is $4, Bert buys two bottles of water. His consumer surplus is shown as area A in the figure. He values hisfirst bottle of water at $7, but pays only $4 for it, so has consumer surplus of $3. He values his second bottle of water at $5, but pays only $4 for it, so has consumer surplus of $1. Thus Bert’s total consumer surplus is $3 + $1 = $4, which is the area of A in the figure.c. When the price of a bottle of water falls from $4 to $2, Bert buys three bottles of water, an increase of one. His consumer surplus consists of both areas A and B in the figure, an increase in the amount of area B. He gets consumer surplus of $5 from the first bottle ($7 value minus $2 price), $3from the second bottle ($5 value minus $2 price), and $1 from the third bottle ($3 value minus $2 price), for a total consumer surplus of $9. Thus consumer surplus rises by $5 (which is the size of area B) when the price of a bottle of water falls from $4 to $2.5. a.Figure 10b. When the price of a bottle of water is $4, Ernie sells two bottles of water. His producer surplus is shown as area A in the figure. He receives $4 for his first bottle of water, but it costs only $1 to produce, so Ernie has producer surplus of $3. He also receives $4 for his second bottle of water, which costs $3 to produce, so he has producer surplus of $1. Thus Ernie’s total producer surplus is $3 + $1 = $4, which is the area of A in the figure.c. When the price of a bottle of water rises from $4 to $6, Ernie sells three bottles of water, an increase of one. His producer surplus consists of both areas A and B in the figure, an increase by the amount of area B. He gets producer surplus of $5 from the first bottle ($6 price minus $1 cost), $3 from the second bottle ($6 price minus $3 cost), and $1 from the third bottle ($6 price minus $5 price), for a total producer surplus of $9. Thus producer surplus rises by $5 (which is the size of area B) when the price of a bottle of water rises from $4 to $6.6. a. From Ernie’s supply schedule and Bert’s demand schedule, thean equilibrium quantity of two.b. At a price of $4, consumer surplus is $4 and producer surplus is $4, as shown in Problems 3 and 4 above. Total surplus is $4 + $4 = $8.c. If Ernie produced one less bottle, his producer surplus would decline to $3, as shown in Problem 4 above. If Bert consumed one less bottle, hisconsumer surplus would decline to $3, as shown in Problem 3 above. So total surplus would decline to $3 + $3 = $6.d. If Ernie produced one additional bottle of water, his cost would be $5, but the price is only $4, so his producer surplus would decline by $1. If Bert consumed one additional bottle of water, his value would be $3, but the price is $4, so his consumer surplus would decline by $1. So total surplus declines by $1 + $1 = $2.7. a. The effect of falling production costs in the market for stereos results in a shift to the right in the supply curve, as shown in Figure 11. As a result, the equilibrium price of stereos declines and the equilibriumquantity increases.Figure 11b. The decline in the price of stereos increases consumer surplus from area A to A + B + C + D, an increase in the amount B + C + D. Prior to the shift in supply, producer surplus was areas B + E (the area above the supply curve and below the price). After the shift in supply, producer surplus is areas E + F + G. So producer surplus changes by the amount F + G – B, which may be positive or negative. The increase in quantity increases producer surplus, while the decline in the price reduces producer surplus. Because consumer surplus rises by B + C + D and producer surplus rises by F + G – B, total surplus rises by C + D + F + G.c. If the supply of stereos is very elastic, then the shift of the supply curve benefits consumers most. To take the most dramatic case, suppose the supply curve were horizontal, as shown in Figure 12. Then there is no producer surplus at all. Consumers capture all the benefits of falling production costs, with consumer surplus rising from area A to area A + B.Figure 128. Figure 13 shows supply and demand curves for haircuts. Supply equals demand at a quantity of three haircuts and a price between $4 and $5. Firms A, C, and D should cut the hair of Ellen, Jerry, and Phil. Oprah’s willingnessto pay is too low and firm B’s costs are too high, so they do not participate. The maximum total surplus is the area between the demand and supply curves, which totals $11 ($8 value minus $2 cost for the first haircut, plus $7 value minus $3 cost for the second, plus $5 value minus $4 cost for the third).Figure 139. a. The effect of falling production costs in the market for computers results in a shift to the right in the supply curve, as shown in Figure 14. As a result, the equilibrium price of computers declines and the equilibrium quantity increases. The decline in the price of computers increases consumer surplus from area A to A + B + C + D, an increase in the amount B + C + D.Figure 14 Figure 15Prior to the shift in supply, producer surplus was areas B + E(the area above the supply curve and below the price). After theshift in supply, producer surplus is areas E + F + G. So producersurplus changes by the amount F + G – B, which may be positive ornegative. The increase in quantity increases producer surplus,while the decline in the price reduces producer surplus. Becauseconsumer surplus rises by B + C + D and producer surplus rises byF +G – B, total surplus rises by C + D + F + G.b. Because typewriters are substitutes for computers, the decline in the price of computers means that people substitute computers for typewriters, shifting the demand for typewriters to the left, as shown in Figure 15. The result is a decline in both the equilibrium price and equilibrium quantity of typewriters. Consumer surplus in the typewriter market changes from area A + B to A + C, a net change of C – B. Producer surplus changes from area C + D + E to area E, a net loss of C + D. Typewriter producers are sad about technological advances in computers because their producer surplus declines.c. Because software and computers are complements, the decline in the price and increase in the quantity of computers means that the demand for software increases, shifting the demand for software to the right, as shown in Figure 16. The result is an increase in both the price and quantity of software. Consumer surplus in the software market changes from B + C to A + B, a net change of A – C. Producer surplus changes from E to C + D + E, an increase of C + D, so software producers should be happy about the technological progress in computers.Figure 16d. Yes, this analysis helps explain why Bill Gates is one the world’s richest people, because his company produces a lot of software that is a complement with computers and there has been tremendous technological advance in computers.10. a. With Provider A, the cost of an extra minute is $0. WithProvider B, the cost of an extra minute is $1.b. With Provider A, my friend will purchase 150 minutes [= 150 –(50)(0)]. With Provider B, my friend would purchase 100 minutes [=150 – (50)(1)].c. With Provider A, he would pay $120. The cost would be $100 with Provider B.Figure 17d. Figure 17 shows the friend’s demand. With Provider A, he buys 150minutes and his consumer surplus is equal to (1/2)(3)(150) – 120= 105. With Provider B, his consumer surplus is equal to(1/2)(2)(100) = 100.e. I would recommend Provider A because he receives greater consumer surplus.11. a. Figure 18 illustrates the demand for medical care. If each procedure has a price of $100, quantity demanded will be Q1 procedures.Figure 18b. If consumers pay only $20 per procedure, the quantity demanded will be Qprocedures. Because the cost to society is $100, the number of procedures 2performed is too large to maximize total surplus. The quantity that maximizes total surplus is Q1 procedures, which is less than Q2.c. The use of medical care is excessive in the sense that consumers get procedures whose value is less than the cost of producing them. As a result, the economy’s total surplus is reduced.d. To prevent this excessive use, the consumer must bear the marginal cost of the procedure. But this would require eliminating insurance. Another possibility would be that the insurance company, which pays most of the marginal cost of the procedure ($80, in this case) could decide whether the procedure should be performed. But the insurance company does not get the benefits of the procedure, so its decisions may not reflect the value to the consumer.。

Answers to Textbook Questions and ProblemsCHAPTER 3 National Income: Where It Comes From and Where It GoesQuestions for Review1. The factors of production and the production technologydetermine the amount of output an economy can produce. The factors of production are the inputs used to produce goods and services: the most important factors are capital and labor. The production technology determines how much output can be produced from any given amounts of these inputs. An increase in one of the factors of production or an improvement in technology leads to an increase in the economy’s output.2. When a firm decides how much of a factor of production tohire or demand, it considers how this decision affects profits. For example, hiring an extra unit of labor increases output and therefore increases revenue; the firm compares this additional revenue to the additional cost from the higher wage bill. The additional revenue the firm receives depends on the marginal product of labor (MPL) and the price of the good produced (P). An additional unit of labor produces MPL units of additional output, which sells for P dollars per unit. Therefore, the additional revenue to the firm is P MPL. The cost of hiring the additional unit of labor is the wage W. Thus, this hiring decision hasthe following effect on profits:ΔProfit= ΔRevenue –ΔCost= (P MPL) –W.If the additional revenue, P MPL, exceeds the cost (W) of hiring the additional unit of labor, then profit increases. The firm will hire labor until it is no longer profitable to do so—that is, until the MPL falls to the point where the change in profit is zero. In the equation abov e, the firm hires labor until ΔP rofit = 0, which is when (P MPL) = W.This condition can be rewritten as:MPL = W/P.Therefore, a competitive profit-maximizing firm hires labor until the marginal product of labor equals the real wage.The same logic applies to the firm’s decision regarding how much capital to hire: the firm will hire capital until the marginal product of capital equals the real rental price.3. A production function has constant returns to scale if anequal percentage increase in all factors of production causes an increase in output of the same percentage. For example, if a firm increases its use of capital and labor by 50 percent, and output increases by 50 percent, then the production function has constant returns to scale.If the production function has constant returns to scale,then total income (or equivalently, total output) in an economy of competitive profit-maximizing firms is divided between the return to labor, MPL L, and the return to capital, MPK K. That is, under constant returns to scale, economic profit is zero.4. A Cobb–Douglas production function has the form F(K,L) =AKαL1–α. The text showed that the parameter αgives capital’s share of income. So if capital earns one-fourth of total income, then = . Hence, F(K,L) = Consumption depends positively on disposable income—.the amount of income after all taxes have been paid. Higher disposable income means higher consumption.The quantity of investment goods demanded depends negatively on the real interest rate. For an investment to be profitable, its return must be greater than its cost.Because the real interest rate measures the cost of funds,a higher real interest rate makes it more costly to invest,so the demand for investment goods falls.6. Government purchases are a measure of the value of goodsand services purchased directly by the government. For example, the government buys missiles and tanks, builds roads, and provides services such as air traffic control.All of these activities are part of GDP. Transfer payments are government payments to individuals that are not in exchange for goods or services. They are the opposite of taxes: taxes reduce household disposable income, whereas transfer payments increase it. Examples of transfer payments include Social Security payments to the elderly, unemployment insurance, and veterans’ benefits.7. Consumption, investment, and government purchases determinedemand for the economy’s output, whereas the factors of production and the production function determine the supply of output. The real interest rate adjusts to ensure that the demand for the economy’s goods equals th e supply. At the equilibrium interest rate, the demand for goods and services equals the supply.8. When the government increases taxes, disposable incomefalls, and therefore consumption falls as well. The decrease in consumption equals the amount that taxes increase multiplied by the marginal propensity to consume (MPC). The higher the MPC is, the greater is the negative effect of the tax increase on consumption. Because output is fixed by the factors of production and the production technology, and government purchases have not changed, the decrease in consumption must be offset by an increase in investment. For investment to rise, the real interest rate must fall. Therefore, a tax increase leads to a decrease in consumption, an increase in investment, and a fall in the real interest rate.Problems and Applications1. a. According to the neoclassical theory of distribution,the real wage equals the marginal product of labor.Because of diminishing returns to labor, an increase in the labor force causes the marginal product of labor to fall. Hence, the real wage falls.Given a Cobb–Douglas production function, theincrease in the labor force will increase the marginal product of capital and will increase the real rental price of capital. With more workers, the capital will be used more intensively and will be more productive.b. The real rental price equals the marginal product ofcapital. If an earthquake destroys some of the capital stock (yet miraculously does not kill anyone and lower the labor force), the marginal product of capital rises and, hence, the real rental price rises.Given a Cobb–Douglas production function, the decrease in the capital stock will decrease the marginal product of labor and will decrease the real wage. With less capital, each worker becomes less productive.c. If a technological advance improves the productionfunction, this is likely to increase the marginal products of both capital and labor. Hence, the real wage and the real rental price both increase.d. High inflation that doubles the nominal wage and theprice level will have no impact on the real wage.Similarly, high inflation that doubles the nominal rental price of capital and the price level will have no impact on the real rental price of capital.2. a. To find the amount of output produced, substitute thegiven values for labor and land into the production function:Y = = 100.b. According to the text, the formulas for the marginalproduct of labor and the marginal product of capital (land) are:MPL = (1 –α)AKαL–α.MPK = αAKα–1L1–α.In this problem, αis and A is 1. Substitute in the given values for labor and land to find the marginal product of labor is and marginal product of capital (land) is . We know that the real wage equals the marginal product of labor and the real rental price of land equals the marginal product of capital (land).c. Labor’s share of the output is given by the marginalproduct of labor times the quantity of labor, or 50.d. The new level of output is .e. The new wage is . The new rental price of land is .f. Labor now receives .3. A production function has decreasing returns to scale if anequal percentage increase in all factors of production leads to a smaller percentage increase in output. For example, if we double the amounts of capital and labor output increases by less than double, then the production function has decreasing returns to scale. This may happen if there is a fixed factor such as land in the production function, and this fixed factor becomes scarce as the economy grows larger.A production function has increasing returns to scale ifan equal percentage increase in all factors of production leads to a larger percentage increase in output. For example, if doubling the amount of capital and labor increases the output by more than double, then the production function has increasing returns to scale. This may happen if specialization of labor becomes greater as the population grows. For example, if only one worker builds a car, then it takes him a long time because he has to learn many different skills, and he must constantly change tasks and tools. But if many workers build a car, then each one can specialize in a particular task and become more productive.4. a. A Cobb–Douglas production function has the form Y =AKαL1–α. The text showed that the marginal products for the Cobb–Douglas production function are:MPL = (1 –α)Y/L.MPK = αY/K.Competitive profit-maximizing firms hire labor until its marginal product equals the real wage, and hire capital until its marginal product equals the real rental rate. Using these facts and the above marginal products for the Cobb–Douglas production function, we find:W/P = MPL = (1 –α)Y/L.R/P = MPK = αY/K.Rewriting this:(W/P)L = MPL L = (1 –α)Y.(R/P)K = MPK K = αY.Note that the terms (W/P)L and (R/P)K are the wage bill and total return to capital, respectively. Given that the value of α= , then the above formulas indicate that labor receives 70 percent of total output (or income) and capital receives 30 percent of total output (or income).b. To determine what happens to total output when the laborforce increases by 10 percent, consider the formula for the Cobb–Douglas production function:Y = AKαL1–α.Let Y1equal the initial value of output and Y2equal final output. We know that α = . We also know that labor L increases by 10 percent:Y1 = Y2 = .Note that we multiplied L by to reflect the 10-percent increase in the labor force.To calculate the percentage change in output, divide Y2 by Y1:Y 2 Y 1=AK0.31.1L()0.7AK0.3L0.7 =1.1()0.7=1.069.That is, output increases by percent.To determine how the increase in the labor force affects the rental price of capital, consider the formula for the real rental price of capital R/P:R/P = MPK = αAKα–1L1–α.We know that α= . We also know that labor (L) increases by 10 percent. Let (R/P)1equal the initial value of the rental price of capital, and let (R/P)2 equal the final rental price of capital after the laborforce increases by 10 percent. To find (R/P )2, multiply Lby to reflect the 10-percent increase in the labor force:(R/P )1 = – (R/P )2 = –.The rental price increases by the ratioR /P ()2R /P ()1=0.3AK -0.71.1L ()0.70.3AK -0.7L 0.7=1.1()0.7=1.069So the rental price increases by percent. To determine how the increase in the labor forceaffects the real wage, consider the formula for the real wage W/P :W/P = MPL = (1 – α)AK αL –α.We know that α = . We also know that labor (L )increases by 10 percent. Let (W/P )1 equal the initialvalue of the real wage, and let (W/P )2 equal the finalvalue of the real wage. To find (W/P )2, multiply L by toreflect the 10-percent increase in the labor force:(W/P )1 = (1 – –.(W/P )2 = (1 – –.To calculate the percentage change in the real wage, divide (W/P )2 by (W/P )1:W /P ()2W /P ()1=1-0.3()AK 0.31.1L ()-0.31-0.3()AK 0.3L -0.3=1.1()-0.3=0.972That is, the real wage falls by percent.c. We can use the same logic as in part (b) to setY 1 = Y 2 = A Therefore, we have:Y 2Y 1=A 1.1K ()0.3L 0.7AK 0.3L 0.7=1.1()0.3=1.029This equation shows that output increases by about 3percent. Notice that α < means that proportional increases to capital will increase output by less than the same proportional increase to labor.Again using the same logic as in part (b) for thechange in the real rental price of capital:R /P ()2R /P ()1=0.3A 1.1K ()-0.7L 0.70.3AK -0.7L 0.7=1.1()-0.7=0.935The real rental price of capital falls by percentbecause there are diminishing returns to capital; that is, when capital increases, its marginal product falls. Finally, the change in the real wage is:W /P ()2W /P ()1=0.7A 1.1K ()0.3L -0.30.7AK 0.3L -0.3=1.1()0.3=1.029Hence, real wages increase by percent because the addedcapital increases the marginal productivity of the existing workers. (Notice that the wage and output have both increased by the same amount, leaving the labor share unchanged —a feature of Cobb –Douglas technologies.)d. Using the same formula, we find that the change in output is:Y 2Y 1= 1.1A ()K 0.3L 0.7AK 0.3L 0.7=1.1This equation shows that output increases by 10 percent.Similarly, the rental price of capital and the real wage also increase by 10 percent:R /P ()2R /P ()1=0.31.1A ()K -0.7L 0.70.3AK -0.7L 0.7=1.1W /P ()2W /P ()1=0.71.1A ()K 0.3L -0.30.7AK 0.3L -0.3=1.15. Labor income is defined asW P ´L =WL P Labor’s share of income is defined asWL P æèççöø÷÷/Y =WL PY For example, if this ratio is about constant at a value of ,then the value of W /P = *Y /L . This means that the real wage is roughly proportional to labor productivity. Hence, any trend in labor productivity must be matched by an equal trend in real wages. O therwise, labor’s share would deviate from . Thus, the first fact (a constant labor share) implies the second fact (the trend in real wages closely tracks the trend in labor productivity).6. a. Nominal wages are measured as dollars per hour worked.Prices are measured as dollars per unit produced (either a haircut or a unit of farm output). Marginal productivity is measured as units of output produced per hour worked.b. According to the neoclassical theory, technicalprogress that increases the marginal product of farmers causes their real wage to rise. The real wage for farmers is measured as units of farm output per hour worked. The real wage is W/P F, and this is equal to ($/hour worked)/($/unit of farm output).c. If the marginal productivity of barbers is unchanged,then their real wage is unchanged. The real wage for barbers is measured as haircuts per hour worked. The real wage is W/P B, and this is equal to ($/hour worked)/($/haircut).d. If workers can move freely between being farmers andbeing barbers, then they must be paid the same wage W in each sector.e. If the nominal wage W is the same in both sectors, butthe real wage in terms of farm goods is greater than the real wage in terms of haircuts, then the price of haircuts must have risen relative to the price of farm goods. We know that W/P = MPL so that W = P MPL. This means that P F MPL F= P H MPL B, given that the nominal wages are the same. Since the marginal product of labor for barbers has not changed and the marginal product of labor for farmers has risen, the price of a haircut must have risen relative to the price of the farm output. If we express this in growth rate terms, then the growth of the farm price + the growth of the marginal product of the farm labor = the growth of the haircut price.f. The farmers and the barbers are equally well off after the technological progress in farming, giventhe assumption that labor is freely mobile between the two sectors and both types of people consume the same basket of goods. Given that the nominal wage ends up equal for each type of worker and that they pay the same prices for final goods, they are equally well off in terms of what they can buy with their nominal income.The real wage is a measure of how many units of output are produced per worker. Technological progress in farming increased the units of farm output produced per hour worked. Movement of labor between sectors then equalized the nominal wage.7. a. The marginal product of labor (MPL)is found bydifferentiating the production function with respect to labor:MPL=dY dL=11/3H1/3L-2/3An increase in human capital will increase the marginal product of labor because more human capital makes all the existing labor more productive.b. The marginal product of human capital (MPH)is found bydifferentiating the production function with respect to human capital:MPH=dY dH=13K1/3L1/3H-2/3An increase in human capital will decrease the marginal product of human capital because there are diminishing returns.c. The labor share of output is the proportion of outputthat goes to labor. The total amount of output that goes to labor is the real wage (which, under perfect competition, equals the marginal product of labor) times the quantity of labor. This quantity is divided by the total amount of output to compute the labor share:Labor Share=(13K1/3H1/3L-2/3)LK1/3H1/3L1/3=1 3We can use the same logic to find the human capital share:Human Capital Share=(13K1/3L1/3H-2/3)HK1/3H1/3L1/3=1 3so labor gets one-third of the output, and human capital gets one-third of the output. Since workers own their human capital (we hope!), it will appear that labor gets two-thirds of output.d. The ratio of the skilled wage to the unskilled wage is:Wskilled Wunskilled =MPL+MPHMPL=13K1/3L-2/3H1/3+13K1/3L1/3H-2/313K1/3L-2/3H1/3=1+LHNotice that the ratio is always greater than 1 because skilled workers get paid more than unskilled workers.Also, when H increases this ratio falls because the diminishing returns to human capital lower its return, while at the same time increasing the marginal product of unskilled workers.e. If more colleges provide scholarships, it will increaseH, and it does lead to a more egalitarian society. The policy lowers the returns to education, decreasing the gap between the wages of more and less educated workers.More importantly, the policy even raises the absolute wage of unskilled workers because their marginal product rises when the number of skilled workers rises.8. The effect of a government tax increase of $100 billion on(a) public saving, (b) private saving, and (c) nationalsaving can be analyzed by using the following relationships:National Saving = [Private Saving] + [Public Saving]= [Y –T –C(Y –T)] + [T –G]= Y –C(Y –T) –G.a. Public Saving—The tax increase causes a 1-for-1increase in public saving. T increases by $100 billion and, therefore, public saving increases by $100 billion.b. Private Saving—The increase in taxes decreasesdisposable income, Y –T, by $100 billion. Since the marginal propensity to consume (MPC) is , consumption falls by $100 billion, or $60 billion. Hence,ΔPrivate Saving = –$100b – (–$100b) = –$40b.Private saving falls $40 billion.c. National Saving—Because national saving is the sum ofprivate and public saving, we can conclude that the $100 billion tax increase leads to a $60 billion increase in national saving.Another way to see this is by using the third equation for national saving expressed above, that national saving equals Y –C(Y –T) –G. The $100 billion tax increase reduces disposable income and causes consumption to fall by $60 billion. Since neither G nor Y changes, national saving thus rises by $60 billion.d. Investment—To determine the effect of the tax increaseon investment, recall the national accounts identity:Y = C(Y –T) + I(r) + G.Rearranging, we findY –C(Y –T) –G = I(r).The left side of this equation is national saving, so the equation just says that national saving equals investment. Since national saving increases by $60 billion, investment must also increase by $60 billion.How does this increase in investment take place We know that investment depends on the real interest rate.For investment to rise, the real interest rate must fall.Figure 3-1 illustrates saving and investment as a function of the real interest rate.The tax increase causes national saving to rise, so the supply curve for loanable funds shifts to the right.The equilibrium real interest rate falls, and investment rises.9. If consumers increase the amount that they consume today,then private saving and, therefore, national saving will fall. We know this from the definition of national saving:National Saving = [Private Saving] + [Public Saving]= [Y –T –C(Y –T)] + [T –G].An increase in consumption decreases private saving, so national saving falls.Figure 3-2 illustrates saving and investment as a function of the real interest rate. If national saving decreases, the supply curve for loanable funds shifts tothe left, thereby raising the real interest rate and reducing investment.10. a. Private saving is the amount of disposable income, Y – T, that is not consumed:S private= Y – T – C= 8,000 –2,000 –[1,000 + (2/3)(8,000 – 2,000)]= 1,000.Public saving is the amount of taxes the government has left over after it makes its purchases:S public = T – G= 2,000 – 2,500= –500.National saving is the sum of private saving and public saving:S national=S private+ S public= 1,000 + (500)= 500.b. The equilibrium interest rate is the value of r thatclears the market for loanable funds. We already know that national saving is 500, so we just need to set it equal to investment:S national=I500 = 1,200 – 100rSolving this equation for r, we find:r = or 7%.c. When the government increases its spending, privatesaving remains the same as before (notice that G does not appear in the S private equation above) while government saving decreases. Putting the new G into the equations above:S private= 1,000S public = T – G= 2,000 – 2,000= 0.Thus,S national=S private+ S public= 1,000 + (0)= 1,000.d. Once again the equilibrium interest rate clears the market for loanable funds:S national=I1,000 = 1,200 – 100rSolving this equation for r, we find:r = or 2%.11. To determine the effect on investment of an equalincrease in both taxes and government spending, consider the national income accounts identity for national saving:National Saving = [Private Saving] + [Public Saving]= [Y –T –C(Y –T)] + [T –G].We know that Y is fixed by the factors of production. We also know that the change in consumption equals the marginal propensity to consume (MPC) times the change in disposable income. This tells us thatΔNational Saving= {–ΔT –[MPC (–ΔT)]} + [ΔT –ΔG]= [–ΔT + (MPC ΔT)] + 0= (MPC –1) ΔT.The above expression tells us that the impact on national saving of an equal increase in T and G depends on the size of the marginal propensity to consume. The closer the MPC is to 1, the smaller is the fall in saving. For example, if the MPC equals 1, then the fall in consumption equals the rise in government purchases, so national saving [Y –C(Y –T) –G] is unchanged. The closer the MPC is to 0 (and therefore the larger is the amount saved rather than spent for a one-dollar change in disposable income), the greater is the impact on saving. Because we assume that the MPC is less than 1, we expect that national savingfalls in response to an equal increase in taxes and government spending.The reduction in saving means that the supply of loanable funds curve will shift to the left in Figure 3-3.The real interest rate rises, and investment falls.12. a. The demand curve for business investment shifts outto the right because the subsidy increases the number of profitable investment opportunities for any given interest rate. The demand curve for residential investment remains unchanged.b. The total demand curve for investment in the economyshifts out to the right since it represents the sum of business investment, which shifts out to the right, and residential investment, which is unchanged. As a result the real interest rate rises as in Figure 3-4.c. The total quantity of investment does not change becauseit is constrained by the inelastic supply of savings. The investment tax credit leads to a rise in business investment, but an offsetting fall in residential investment. That is, the higher interest rate means that residential investment falls (a movement along the curve), whereas the rightward shift of the business investment curve leads business investment to rise by an equal amount. Figure 3-5 shows this change. Note thatI 1B +I 1R +I 2B +I 2R =S .13. In this chapter, we concluded that an increase ingovernment expenditures reduces national saving and raises the interest rate. The increase in government expenditure therefore crowds out investment by the full amount of the increase. Similarly, a tax cut increases disposable income and hence consumption. This increase in consumptiontranslates into a fall in national saving, and the increase in consumption crowds out investment by the full amount of the increase.If consumption depends on the interest rate, then saving will also depend on it. The higher the interest rate, the greater the return to saving. Hence, it seems reasonable to think that an increase in the interest rate might increase saving and reduce consumption. Figure 3-6 shows saving as an increasing function of the interest rate.Consider what happens when government purchases increase. At any given level of the interest rate, national saving falls by the change in government purchases, as shown in Figure 3-7. The figure shows that if the saving function slopes upward, investment falls by less than the amount that government purchases rises by. This happens because consumption falls and saving increases in response to the higher interest rate. Hence, the more responsive consumption is to the interest rate, the less investment is crowded out by government purchases.14. a. Figure 3-8 shows the case where the demand forloanable funds is stable but the supply of funds (the saving schedule) fluctuates perhaps reflecting temporary shocks to income, changes in government spending, or changes in consumer confidence. In this case, when interest rates fall, investment rises; when interest rates rise, investment falls. We would expect a negative correlation between investment and interest rates.b. Figure 3-9 shows the case where the supply of loanablefunds (saving) is stable, whereas the demand for loanable funds fluctuates, perhaps reflecting changes in firms’ expectations about the marginal product of capital. We would now find a positive correlation between investment and the interest rate—when demand for funds rises, it pushes up the interest rate, so weobserve that investment and the real interest rate increase at the same time.c. If both curves shift, we might generate a scatter plotas in Figure 3-10, where the economy fluctuates among points A, B, C, and D. Depending on how often the economy is at each of these points, we might find little clear relationship between investment and interest rates.d. Situation (c) seems fairly reasonable—as both thesupply of and demand for loanable funds fluctuate over time in response to changes in the economy.。
A n s w e r s t o T e x t b o o k Q u e s t i o n s a n d P r o b l e m s CHAPTER 7?Unemployment and the Labor MarketQuestions for Review1. The rates of job separation and job finding determine the natural rate of unemployment. The rate of jobseparation is the fraction of people who lose their job each month. The higher the rate of job separation, the higher the natural rate of unemployment. The rate of job finding is the fraction of unemployed people who find a job each month. The higher the rate of job finding, the lower the natural rate ofunemployment.2. Frictional unemployment is the unemployment caused by the time it takes to match workers and jobs.Finding an appropriate job takes time because the flow of information about job candidates and job vacancies is not instantaneous. Because different jobs require different skills and pay different wages, unemployed workers may not accept the first job offer they receive.In contrast, structural unemployment is the unemployment resulting from wage rigidity and job rationing. These workers are unemployed not because they are actively searching for a job that best suits their skills (as in the case of frictional unemployment), but because at the prevailing real wage the quantity of labor supplied exceeds the quantity of labor demanded. If the wage does not adjust to clear the labor market, then these workers must wait for jobs to become available. Structural unemployment thus arises because firms fail to reduce wages despite an excess supply of labor.3. The real wage may remain above the level that equilibrates labor supply and labor demand because ofminimum wage laws, the monopoly power of unions, and efficiency wages.Minimum-wage laws cause wage rigidity when they prevent wages from falling to equilibrium levels. Although most workers are paid a wage above the minimum level, for some workers, especially the unskilled and inexperienced, the minimum wage raises their wage above the equilibrium level. It therefore reduces the quantity of their labor that firms demand, and creates an excess supply ofworkers, which increases unemployment.The monopoly power of unions causes wage rigidity because the wages of unionized workers are determined not by the equilibrium of supply and demand but by collective bargaining between union leaders and firm management. The wage agreement often raises the wage above the equilibrium level and allows the firm to decide how many workers to employ. These high wages cause firms to hire fewer workers than at the market-clearing wage, so structural unemployment increases.Efficiency-wage theories suggest that high wages make workers more productive. The influence of wages on worker efficiency may explain why firms do not cut wages despite an excess supply of labor. Even though a wage reduction decreases th e firm’s wage bill, it may also lower workerproductivity and therefore the firm’s profits.4. Depending on how one looks at the data, most unemployment can appear to be either short term orlong term. Most spells of unemployment are short; that is, most of those who became unemployed find jobs quickly. On the other hand, most weeks of unemployment are attributable to the small number of long-term unemployed. By definition, the long-term unemployed do not find jobs quickly, so they appear on unemployment rolls for many weeks or months.5. Europeans work fewer hours than Americans. One explanation is that the higher income tax rates inEurope reduce the incentive to work. A second explanation is a larger underground economy in Europe as a result of more people attempting to evade the high tax rates. A third explanation is the greater importance of unions in Europe and their ability to bargain for reduced work hours. A final explanation is based on preferences, whereby Europeans value leisure more than Americans do, and therefore elect to work fewer hours.Problems and Applications1. a. In the example that follows, we assume that during the school year you look for a part-time job,and that, on average, it takes 2 weeks to find one. We also assume that the typical job lasts 1semester, or 12 weeks.b. If it takes 2 weeks to find a job, then the rate of job finding in weeks isf = (1 job/2 weeks) = 0.5 jobs/week.If the job lasts for 12 weeks, then the rate of job separation in weeks iss = (1 job/12 weeks) = 0.083 jobs/week.c. From the text, we know that the formula for the natural rate of unemployment is(U/L) = [s/(s + f )],where U is the number of people unemployed, and L is the number of people in the labor force.Plugging in the values for f and s that were calculated in part (b), we find(U/L) = [0.083/(0.083 + 0.5)] = 0.14.Thus, if on average it takes 2 weeks to find a job that lasts 12 weeks, the natural rate ofunemployment for this population of college students seeking part-time employment is 14 percent.2. Call the number of residents of the dorm who are involved I, the number who are uninvolved U, and thetotal number of students T = I + U. In steady state the total number of involved students is constant.For this to happen we need the number of newly uninvolved students, (0.10)I, to be equal to thenumber of students who just became involved, (0.05)U. Following a few substitutions:(0.05)U = (0.10)I= (0.10)(T – U),soWe find that two-thirds of the students are uninvolved.3. To show that the unemployment rate evolves over time to the steady-state rate, let’s begin by defininghow the number of people unemployed changes over time. The change in the number of unemployed equals the number of people losing jobs (sE) minus the number finding jobs (fU). In equation form, we can express this as:U t + 1–U t= ΔU t + 1 = sE t–fU t.Recall from the text that L = E t + U t, or E t = L –U t, where L is the total labor force (we will assume that L is constant). Substituting for E t in the above equation, we findΔU t + 1 = s(L –U t) –fU t.Dividing by L, we get an expression for the change in the unemployment rate from t to t + 1:ΔU t + 1/L = (U t + 1/L) – (U t/L) = Δ[U/L]t + 1 = s(1 –U t/L) –fU t/L.Rearranging terms on the right side of the equation above, we end up with line 1 below. Now take line1 below, multiply the right side by (s + f)/(s + f) and rearrange terms to end up with line2 below:Δ[U/L]t + 1= s – (s + f)U t/L= (s + f)[s/(s + f) – U t/L].The first point to note about this equation is that in steady state, when the unemployment rate equals its natural rate, the left-hand side of this expression equals zero. This tells us that, as we found in the text, the natural rate of unemployment (U/L)n equals s/(s + f). We can now rewrite the above expression, substituting (U/L)n for s/(s + f), to get an equation that is easier to interpret:Δ[U/L]t + 1 = (s + f)[(U/L)n–U t/L].This expression shows the following:? If U t/L > (U/L)n (that is, the unemployment rate is above its natural rate), then Δ[U/L]t + 1 is negative: the unemployment rate falls.? If U t/L < (U/L)n (that is, the unemployment rate is below its natural rate), then Δ[U/L]t + 1 is positive: the unemployment rate rises.This process continues until the unemployment rate U/L reaches the steady-state rate (U/L)n.4. Consider the formula for the natural rate of unemployment,If the new law lowers the chance of separation s, but has no effect on the rate of job finding f, then the natural rate of unemployment falls.For several reasons, however, the new law might tend to reduce f. First, raising the cost of firing might make firms more careful about hiring workers, since firms have a harder time firing workers who turn out to be a poor match. Second, if job searchers think that the new legislation will lead them to spend a longer period of time on a particular job, then they might weigh more carefully whether or not to take that job. If the reduction in f is large enough, then the new policy may even increase the natural rate of unemployment.5. a. The demand for labor is determined by the amount of labor that a profit-maximizing firm wants tohire at a given real wage. The profit-maximizing condition is that the firm hire labor until themarginal product of labor equals the real wage,The marginal product of labor is found by differentiating the production function with respect tolabor (see Chapter 3 for more discussion),In order to solve for labor demand, we set the MPL equal to the real wage and solve for L:Notice that this expression has the intuitively desirable feature that increases in the real wagereduce the demand for labor.b. We assume that the 27,000 units of capital and the 1,000 units of labor are supplied inelastically (i.e., they will work at any price). In this case we know that all 1,000 units of labor and 27,000 units of capital will be used in equilibrium, so we can substitute these values into the above labor demand function and solve for W P .In equilibrium, employment will be 1,000, and multiplying this by 10 we find that the workers earn 10,000 units of output. The total output is given by the production function: Y =5K 13L 23Y =5(27,00013)(1,00023)Y =15,000.Notice that workers get two-thirds of output, which is consistent with what we know about theCobb –Douglas production function from Chapter 3.c. The real wage is now equal to 11 (10% above the equilibrium level of 10).Firms will use their labor demand function to decide how many workers to hire at the given realwage of 11 and capital stock of 27,000:So 751 workers will be hired for a total compensation of 8,261 units of output. To find the newlevel of output, plug the new value for labor and the value for capital into the production function and you will find Y = 12,393.d. The policy redistributes output from the 249 workers who become involuntarily unemployed tothe 751 workers who get paid more than before. The lucky workers benefit less than the losers lose as the total compensation to the working class falls from 10,000 to 8,261 units of output.e. This problem does focus on the analysis of two effects of the minimum-wage laws: they raise thewage for some workers while downward-sloping labor demand reduces the total number of jobs. Note, however, that if labor demand is less elastic than in this example, then the loss ofemployment may be smaller, and the change in worker income might be positive.6. a. The labor demand curve is given by the marginal product of labor schedule faced by firms. If acountry experiences a reduction in productivity, then the labor demand curve shifts to the left as in Figure 7-1. If labor becomes less productive, then at any given real wage, firms demand less labor. b. If the labor market is always in equilibrium, then, assuming a fixed labor supply, an adverseproductivity shock causes a decrease in the real wage but has no effect on employment orunemployment, as in Figure 7-2.c. If unions constrain real wages to remain unaltered, then as illustrated in Figure 7-3, employment falls to L 1 and unemployment equals L – L 1.This example shows that the effect of a productivity shock on an economy depends on the role ofunions and the response of collective bargaining to such a change.7. a. If workers are free to move between sectors, then the wage in each sector will be equal. If the wages were not equal then workers would have an incentive to move to the sector with the higher wage and this would cause the higher wage to fall, and the lower wage to rise until they were equal.b. Since there are 100 workers in total, L S = 100 – L M . We can substitute this expression into thelabor demand for services equation, and call the wage w since it is the same in both sectors:L S = 100 – L M = 100 – 4wL M = 4w.Now set this equal to the labor demand for manufacturing equation and solve for w:4w = 200 – 6ww = $20.Substitute the wage into the two labor demand equations to find L M is 80 and L S is 20.c. If the wage in manufacturing is equal to $25 then L M is equal to 50.d. There are now 50 workers employed in the service sector and the wage w S is equal to $12.50.e. The wage in manufacturing will remain at $25 and employment will remain at 50. If thereservation wage for the service sector is $15 then employment in the service sector will be 40. Therefore, 10 people are unemployed and the unemployment rate is 10 percent.8. Real wages have risen over time in both the United States and Europe, increasing the reward forworking (the substitution effect) but also making people richer, so they want to “buy” more leisure (the income effect). If the income effect dominates, then people want to work less as real wages go up. This could explain the European experience, in which hours worked per employed person have fallen over time. If the income and substitution effects approximately cancel, then this could explain the U.S.experience, in which hours worked per person have stayed about constant. Economists do not have good theories for why tastes might differ, so they disagree on whether it is reasonable to think that Europeans have a larger income effect than do Americans.9. The vacant office space problem is similar to the unemployment problem; we can apply the sameconcepts we used in analyzing unemployed labor to analyze why vacant office space exists. There is a rate of office separation: firms that occupy offices leave, either to move to different offices or because they go out of business. There is a rate of office finding: firms that need office space (either to start up or expand) find empty offices. It takes time to match firms with available space. Different types of firms require spaces with different attributes depending on what their specific needs are. Also, because demand for different goods fluctuates, there are “sectoral shifts”—changes in the composition ofdemand among industries and regions that affect the profitability and office needs of different firms.。

曼昆宏观经济经济学第九版英文原版答案3(总13页)--本页仅作为文档封面,使用时请直接删除即可----内页可以根据需求调整合适字体及大小--Answers to Textbook Questions and ProblemsCHAPTER3?National Income: Where It Comes From and Where It Goes Questions for Review1. The factors of production and the production technology determine theamount of output an economy can produce. The factors of production are the inputs used to produce goods and services: the most important factors are capital and labor. The production technology determines how much output can be produced from any given amounts of theseinputs. An increase in one of the factors of production or animprovement in technology leads to an increase in the economy’soutput.2. When a firm decides how much of a factor of production to hire ordemand, it considers how this decision affects profits. For example, hiring an extra unit of labor increases output and thereforeincreases revenue; the firm compares this additional revenue to the additional cost from the higher wage bill. The additional revenue the firm receives depends on the marginal product of labor (MPL) and the price of the good produced (P). An additional unit of labor produces MPL units of additional output, which sells for P dollars per unit.Therefore, the additional revenue to the firm is P ? MPL. The cost of hiring the additional unit of labor is the wage W. Thus, this hiring decision has the following effect on profits:ΔProfit= ΔRevenue –ΔCost= (P ? MPL) –W.If the additional revenue, P ? MPL, exceeds the cost (W) of hiring the additional unit of labor, then profit increases. The firm will hire labor until it is no longer profitable to do so—that is, until the MPL falls to the point where the change in profit is zero. In the equation abov e, the firm hires labor until ΔP rofit = 0, which is when (P ? MPL) = W.This condition can be rewritten as:MPL = W/P.Therefore, a competitive profit-maximizing firm hires labor until the marginal product of labor equals the real wage. The same logicapplies to the firm’s decision regarding how much capital to hire:the firm will hire capital until the marginal product of capitalequals the real rental price.3. A production function has constant returns to scale if an equalpercentage increase in all factors of production causes an increase in output of the same percentage. For example, if a firm increases its use of capital and labor by 50 percent, and output increases by50 percent, then the production function has constant returns toscale.If the production function has constant returns to scale, then total income (or equivalently, total output) in an economy ofcompetitive profit-maximizing firms is divided between the return to labor, MPL ? L, and the return to capital, MPK ? K. That is, under constant returns to scale, economic profit is zero.4. A Cobb–Douglas production function has the form F(K,L) = AKαL1–α.The text showed that the parameter αgives capital’s share ofincome. So if capital earns one-fourth of total income, then ? = .Hence, F(K,L) = Consumption depends positively on disposable income—. the amount of income after all taxes have been paid. Higher disposable income means higher consumption.The quantity of investment goods demanded depends negatively on the real interest rate. For an investment to be profitable, itsreturn must be greater than its cost. Because the real interest rate measures the cost of funds, a higher real interest rate makes it more costly to invest, so the demand for investment goods falls.6. Government purchases are a measure of the value of goods and servicespurchased directly by the government. For example, the government buys missiles and tanks, builds roads, and provides services such as air traffic control. All of these activities are part of GDP.Transfer payments are government payments to individuals that are not in exchange for goods or services. They are the opposite of taxes: taxes reduce household disposable income, whereas transfer payments increase it. Examples of transfer payments include Social Security payments to the elderly, unemployment insurance, and veterans’benefits.7. Consumption, investment, and government purchases determine demandfor the economy’s output, whereas the factors of production and the production function determine the supply of output. The real interest rate adjusts to ensure that the deman d for the economy’s goodsequals the supply. At the equilibrium interest rate, the demand for goods and services equals the supply.8. When the government increases taxes, disposable income falls, andtherefore consumption falls as well. The decrease in consumptionequals the amount that taxes increase multiplied by the marginalpropensity to consume (MPC). The higher the MPC is, the greater is the negative effect of the tax increase on consumption. Becauseoutput is fixed by the factors of production and the productiontechnology, and government purchases have not changed, the decrease in consumption must be offset by an increase in investment. Forinvestment to rise, the real interest rate must fall. Therefore, a tax increase leads to a decrease in consumption, an increase ininvestment, and a fall in the real interest rate.Problems and Applications1. a. According to the neoclassical theory of distribution, the realwage equals the marginal product of labor. Because of diminishing returns to labor, an increase in the labor force causes themarginal product of labor to fall. Hence, the real wage falls.Given a Cobb–Douglas production function, the increase in the labor force will increase the marginal product of capital and will increase the real rental price of capital. With more workers, the capital will be used more intensively and will be more productive.b. The real rental price equals the marginal product of capital. Ifan earthquake destroys some of the capital stock (yet miraculously does not kill anyone and lower the labor force), the marginalproduct of capital rises and, hence, the real rental price rises.Given a Cobb–Douglas production function, the decrease in the capital stock will decrease the marginal product of labor and will decrease the real wage. With less capital, each worker becomesless productive.c. If a technological advance improves the production function, thisis likely to increase the marginal products of both capital andlabor. Hence, the real wage and the real rental price bothincrease.d. High inflation that doubles the nominal wage and the price levelwill have no impact on the real wage. Similarly, high inflationthat doubles the nominal rental price of capital and the pricelevel will have no impact on the real rental price of capital.2. a. To find the amount of output produced, substitute the given valuesfor labor and land into the production function:Y = = 100.b. According to the text, the formulas for the marginal product oflabor and the marginal product of capital (land) are:MPL = (1 –α)AKαL–α.MPK = αAKα–1L1–α.In this problem, α is and A is 1. Substitute in the given values for labor and land to find the marginal product of labor is andmarginal product of capital (land) is . We know that the real wage equals the marginal product of labor and the real rental price of land equals the marginal product of capital (land).c. Labor’s share of the output is given by the marginal product oflabor times the quantity of labor, or 50.d. The new level of output is .e. The new wage is . The new rental price of land is .f. Labor now receives .3. A production function has decreasing returns to scale if an equalpercentage increase in all factors of production leads to a smaller percentage increase in output. For example, if we double the amounts of capital and labor output increases by less than double, then the production function has decreasing returns to scale. This may happen if there is a fixed factor such as land in the production function, and this fixed factor becomes scarce as the economy grows larger.A production function has increasing returns to scale if an equalpercentage increase in all factors of production leads to a larger percentage increase in output. For example, if doubling the amount of capital and labor increases the output by more than double, then the production function has increasing returns to scale. This may happen if specialization of labor becomes greater as the population grows.For example, if only one worker builds a car, then it takes him a long time because he has to learn many different skills, and he must constantly change tasks and tools. But if many workers build a car, then each one can specialize in a particular task and become more productive.4. a. A Cobb–Douglas production function has the form Y = AKαL1–α. Thetext showed that the marginal products for the Cobb–Douglasproduction function are:MPL = (1 –α)Y/L.MPK = αY/K.Competitive profit-maximizing firms hire labor until its marginal product equals the real wage, and hire capital until its marginal product equals the real rental rate. Using these factsand the above marginal products for the Cobb–Douglas productionfunction, we find:W/P = MPL = (1 –α)Y/L.R/P = MPK = αY/K.Rewriting this:(W/P)L = MPL ? L = (1 –α)Y.(R/P)K = MPK ? K = αY.Note that the terms (W/P)L and (R/P)K are the wage bill and total return to capital, respectively. Given that the value of α = ,then the above formulas indicate that labor receives 70 percent of total output (or income) and capital receives 30 percent of total output (or income).b. To determine what happens to total output when the labor forceincreases by 10 percent, consider the formula for the Cobb–Douglas production function:Y = AKαL1–α.Let Y1 equal the initial value of output and Y2 equal final output.We know that α = . We also know that labor L increases by 10percent:Y 1 = Y 2 = .Note that we multiplied L by to reflect the 10-percent increase in the labor force.To calculate the percentage change in output, divide Y 2 by Y 1:Y 2Y 1=AK 0.31.1L ()0.7AK 0.3L 0.7=1.1()0.7=1.069.That is, output increases by percent. To determine how the increase in the labor force affects therental price of capital, consider the formula for the real rental price of capital R/P :R/P = MPK = αAK α–1L 1–α.We know that α = . We also know that labor (L ) increases by 10percent. Let (R/P )1 equal the initial value of the rental price ofcapital, and let (R/P )2 equal the final rental price of capitalafter the labor force increases by 10 percent. To find (R/P )2,multiply L by to reflect the 10-percent increase in the laborforce:(R/P )1 = – (R/P )2 = –.The rental price increases by the ratioR /P ()2R /P ()1=0.3AK -0.71.1L ()0.70.3AK -0.7L 0.7=1.1()0.7=1.069So the rental price increases by percent. To determine how the increase in the labor forceaffects the real wage, consider the formula for the real wage W/P :W/P = MPL = (1 – α)AK αL –α.We know that α = . We also know that labor (L ) increases by 10percent. Let (W/P )1 equal the initial value of the real wage, andlet (W/P )2 equal the final value of the real wage. To find (W/P )2, multiply L by to reflect the 10-percent increase in the laborforce:(W/P )1 = (1 – –. (W/P )2 = (1 – –.To calculate the percentage change in the real wage, divide (W/P )2 by (W/P )1:W /P ()2W /P ()1=1-0.3()AK 0.31.1L ()-0.31-0.3()AK 0.3L -0.3=1.1()-0.3=0.972That is, the real wage falls by percent.c. We can use the same logic as in part (b) to setY 1 = Y 2 = A Therefore, we have:Y 2Y 1=A 1.1K ()0.3L 0.7AK 0.3L 0.7=1.1()0.3=1.029This equation shows that output increases by about 3 percent. Notice that α < means that proportional increases to capital will increase output by less than the same proportional increase to labor.Again using the same logic as in part (b) for the change in the real rental price of capital:R /P ()2R /P ()1=0.3A 1.1K ()-0.7L 0.70.3AK -0.7L 0.7=1.1()-0.7=0.935The real rental price of capital falls by percent because there are diminishing returns to capital; that is, when capital increases, its marginal product falls.Finally, the change in the real wage is:W /P ()2W /P ()1=0.7A 1.1K ()0.3L -0.30.7AK 0.3L -0.3=1.1()0.3=1.029Hence, real wages increase by percent because the added capitalincreases the marginal productivity of the existing workers.(Notice that the wage and output have both increased by the same amount, leaving the labor share unchanged —a feature of Cobb –Douglas technologies.)d. Using the same formula, we find that the change in output is:Y 2Y 1= 1.1A ()K 0.3L 0.7AK 0.3L 0.7=1.1This equation shows that output increases by 10 percent. Similarly,the rental price of capital and the real wage also increase by 10 percent:R /P ()2R /P ()1=0.31.1A ()K -0.7L 0.70.3AK -0.7L 0.7=1.1W /P ()2W /P ()1=0.71.1A ()K 0.3L -0.30.7AK 0.3L -0.3=1.15. Labor income is defined asW P ´L =WL PLabor’s share of income is defined asWL P æèççöø÷÷/Y =WL PYFor example, if this ratio is about constant at a value of , then the value of W/P = *Y/L. This means that the real wage is roughlyproportional to labor productivity. Hence, any trend in laborproductivity must be matched by an equal trend in real wages.O therwise, labor’s share would deviate from . T hus, the first fact(a constant labor share) implies the second fact (the trend in realwages closely tracks the trend in labor productivity).6. a. Nominal wages are measured as dollars per hour worked. Prices aremeasured as dollars per unit produced (either a haircut or a unit of farm output). Marginal productivity is measured as units ofoutput produced per hour worked.b. According to the neoclassical theory, technical progress thatincreases the marginal product of farmers causes their real wageto rise. The real wage for farmers is measured as units of farmoutput per hour worked. The real wage is W/P F, and this is equalto ($/hour worked)/($/unit of farm output).c. If the marginal productivity of barbers is unchanged, then theirreal wage is unchanged. The real wage for barbers is measured ashaircuts per hour worked. The real wage is W/P B, and this is equal to ($/hour worked)/($/haircut).d.If workers can move freely between being farmers and being barbers,then they must be paid the same wage W in each sector.e. If the nominal wage W is the same in both sectors, but the realwage in terms of farm goods is greater than the real wage in terms of haircuts, then the price of haircuts must have risen relativeto the price of farm goods. We know that W/P = MPL so that W = P ?MPL. This means that PF MPLF= P H MPL B, given that the nominal wagesare the same. Since the marginal product of labor for barbers has not changed and the marginal product of labor for farmers hasrisen, the price of a haircut must have risen relative to theprice of the farm output. If we express this in growth rate terms, then the growth of the farm price + the growth of the marginalproduct of the farm labor = the growth of the haircut price.f. The farmers and the barbers are equally well off after the technological progress in farming, giventhe assumption that labor is freely mobile between the two sectorsand both types of people consume the same basket of goods. Given that the nominal wage ends up equal for each type of worker andthat they pay the same prices for final goods, they are equallywell off in terms of what they can buy with their nominal income.The real wage is a measure of how many units of output areproduced per worker. Technological progress in farming increased the units of farm output produced per hour worked. Movement oflabor between sectors then equalized the nominal wage.7. a. The marginal product of labor (MPL)is found by differentiatingthe production function with respect to labor:MPL=dY dL=13K1/3H1/3L-2/3An increase in human capital will increase the marginal product of labor because more human capital makes all the existing labor more productive.b. The marginal product of human capital (MPH)is found bydifferentiating the production function with respect to humancapital:MPH=dY dH=13K1/3L1/3H-2/3An increase in human capital will decrease the marginal product of human capital because there are diminishing returns.c. The labor share of output is the proportion of output that goes tolabor. The total amount of output that goes to labor is the real wage (which, under perfect competition, equals the marginalproduct of labor) times the quantity of labor. This quantity is divided by the total amount of output to compute the labor share:Labor Share=(13K1/3H1/3L-2/3)LK1/3H1/3L1/3=1 3We can use the same logic to find the human capital share:Human Capital Share=(13K1/3L1/3H-2/3)HK1/3H1/3L1/3=1 3so labor gets one-third of the output, and human capital gets one-third of the output. Since workers own their human capital (we hope!), it will appear that labor gets two-thirds of output.d. The ratio of the skilled wage to the unskilled wage is:Wskilled Wunskilled =MPL+MPHMPL=13K1/3L-2/3H1/3+13K1/3L1/3H-2/313K1/3L-2/3H1/3=1+LHNotice that the ratio is always greater than 1 because skilledworkers get paid more than unskilled workers. Also, when Hincreases this ratio falls because the diminishing returns tohuman capital lower its return, while at the same time increasing the marginal product of unskilled workers.e. If more colleges provide scholarships, it will increase H, and itdoes lead to a more egalitarian society. The policy lowers thereturns to education, decreasing the gap between the wages of more and less educated workers. More importantly, the policy evenraises the absolute wage of unskilled workers because theirmarginal product rises when the number of skilled workers rises.8. The effect of a government tax increase of $100 billion on (a) publicsaving, (b) private saving, and (c) national saving can be analyzed by using the following relationships:National Saving = [Private Saving] + [Public Saving]= [Y –T –C(Y –T)] + [T –G]= Y –C(Y –T) –G.a. Public Saving—The tax increase causes a 1-for-1 increase inpublic saving. T increases by $100 billion and, therefore, publicsaving increases by $100 billion.b.Private Saving—The increase in taxes decreases disposable income,Y –T, by $100 billion. Since the marginal propensity to consume (MPC) is , consumption falls by ? $100 billion, or $60 billion.Hence,ΔPrivate Saving = –$100b – (–$100b) = –$40b.Private saving falls $40 billion.c. National Saving—Because national saving is the sum of privateand public saving, we can conclude that the $100 billion taxincrease leads to a $60 billion increase in national saving.Another way to see this is by using the third equation for national saving expressed above, that national saving equals Y –C(Y –T) –G. The $100 billion tax increase reduces disposable income and causes consumption to fall by $60 billion. Sinceneither G nor Y changes, national saving thus rises by $60 billion.d. Investment—To determine the effect of the tax increase oninvestment, recall the national accounts identity:Y = C(Y –T) + I(r) + G.Rearranging, we findY –C(Y –T) –G = I(r).The left side of this equation is national saving, so the equation just says that national saving equals investment. Since national saving increases by $60 billion, investment must also increase by $60 billion.How does this increase in investment take place We know that investment depends on the real interest rate. For investment to rise, the real interest rate must fall. Figure 3-1 illustrates saving and investment as a function of the real interest rate.The tax increase causes national saving to rise, so the supply curve for loanable funds shifts to the right. The equilibrium real interest rate falls, and investment rises.9. If consumers increase the amount that they consume today, thenprivate saving and, therefore, national saving will fall. We know this from the definition of national saving:National Saving = [Private Saving] + [Public Saving]= [Y –T –C(Y –T)] + [T –G].An increase in consumption decreases private saving, so national saving falls.Figure 3-2 illustrates saving and investment as a function of the real interest rate. If national saving decreases, the supply curve for loanable funds shifts to the left, thereby raising the realinterest rate and reducing investment.10. a. Private saving is the amount of disposable income, Y – T,that is not consumed:S private= Y – T – C= 8,000 – 2,000 – [1,000 + (2/3)(8,000 –2,000)]= 1,000.Public saving is the amount of taxes the government has left over after it makes its purchases:S public= T – G= 2,000 – 2,500= –500.National saving is the sum of private saving and public saving:S national= S private+ S public= 1,000 + (500)= 500.b. The equilibrium interest rate is the value of r that clears themarket for loanable funds. We already know that national saving is 500, so we just need to set it equal to investment:S national= I500 = 1,200 – 100rSolving this equation for r, we find:r = or 7%.c. When the government increases its spending, private saving remainsthe same as before (notice that G does not appear in the S privateequation above) while government saving decreases. Putting the newG into the equations above:S private= 1,000S public= T – G= 2,000 – 2,000= 0.Thus,S national= S private+ S public= 1,000 + (0)= 1,000.d. Once again the equilibrium interest rate clears the market for loanable funds:S national= I1,000 = 1,200 – 100rSolving this equation for r, we find:r = or 2%.11. To determine the effect on investment of an equal increase in bothtaxes and government spending, consider the national income accounts identity for national saving:National Saving = [Private Saving] + [Public Saving]= [Y –T –C(Y –T)] + [T –G].We know that Y is fixed by the factors of production. We also know that the change in consumption equals the marginal propensity toconsume (MPC) times the change in disposable income. This tells us thatΔNational Saving = {–ΔT – [MPC ? (–ΔT)]} + [ΔT –ΔG]= [–ΔT + (MPC ? ΔT)] + 0= (MPC –1) ΔT.The above expression tells us that the impact on national saving of an equal increase in T and G depends on the size of the marginal propensity to consume. The closer the MPC is to 1, the smaller is the fall in saving. For example, if the MPC equals 1, then the fall in consumption equals the rise in government purchases, so nationalsaving [Y –C(Y –T) –G] is unchanged. The closer the MPC is to 0 (and therefore the larger is the amount saved rather than spent for a one-dollar change in disposable income), the greater is the impact on saving. Because we assume that the MPC is less than 1, we expect that national saving falls in response to an equal increase in taxes and government spending.The reduction in saving means that the supply of loanable funds curve will shift to the left in Figure 3-3. The real interest rate rises, and investment falls.12. a. The demand curve for business investment shifts out to theright because the subsidy increases the number of profitableinvestment opportunities for any given interest rate. The demandcurve for residential investment remains unchanged.b. The total demand curve for investment in the economy shifts out tothe right since it represents the sum of business investment,which shifts out to the right, and residential investment, whichis unchanged. As a result the real interest rate rises as inFigure 3-4.c. The total quantity of investment does not change because it isconstrained by the inelastic supply of savings. The investment tax credit leads to a rise in business investment, but an offsettingfall in residential investment. That is, the higher interest rate means that residential investment falls (a movement along thecurve), whereas the rightward shift of the business investmentcurve leads business investment to rise by an equal amount. Figure3-5 shows this change. Note thatI 1B +I 1R +I 2B +I 2R =S .13. In this chapter, we concluded that an increase in governmentexpenditures reduces national saving and raises the interest rate. The increase in government expenditure therefore crowds outinvestment by the full amount of the increase. Similarly, a tax cut increases disposable income and hence consumption. This increase in consumption translates into a fall in national saving, and theincrease in consumption crowds out investment by the full amount of the increase.If consumption depends on the interest rate, then saving will also depend on it. The higher the interest rate, the greater the return to saving. Hence, it seems reasonable to think that an increase in the interest rate might increase saving and reduce consumption. Figure 3-6 shows saving as an increasing function of the interest rate.Consider what happens when government purchases increase. At anygiven level of the interest rate, national saving falls by the change in government purchases, as shown in Figure 3-7. The figure shows that if the saving function slopes upward, investment falls by less than the amount that government purchases rises by. This happens because consumption falls and saving increases in response to the higher interest rate. Hence, the more responsive consumption is tothe interest rate, the less investment is crowded out by government purchases.14. a. Figure 3-8 shows the case where the demand for loanablefunds is stable but the supply of funds (the saving schedule)fluctuates perhaps reflecting temporary shocks to income, changes in government spending, or changes in consumer confidence. In this case, when interest rates fall, investment rises; when interestrates rise, investment falls. We would expect a negativecorrelation between investment and interest rates.b. Figure 3-9 shows the case where the supply of loanable funds(saving) is stable, whereas the demand for loanable fundsfluctuates, perhaps reflecting changes in firms’ expectationsabout the marginal product of capital. We would now find apositive correlation between investment and the interest rate—when demand for funds rises, it pushes up the interest rate, so we observe that investment and the real interest rate increase at the same time.c. If both curves shift, we might generate a scatter plot as inFigure 3-10, where the economy fluctuates among points A, B, C, and D. Depending on how often the economy is at each of thesepoints, we might find little clear relationship between investment and interest rates.d. Situation (c) seems fairly reasonable—as both the supply of anddemand for loanable funds fluctuate over time in response tochanges in the economy.。
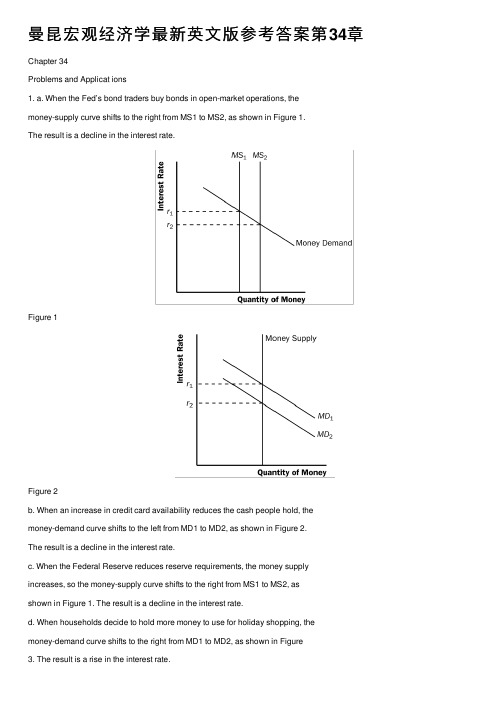
曼昆宏观经济学最新英⽂版参考答案第34章Chapter 34Problems and Applicat ions1. a. When the Fed’s bond traders buy bonds in open-market operations, themoney-supply curve shifts to the right from MS1 to MS2, as shown in Figure 1.The result is a decline in the interest rate.Figure 1Figure 2b. When an increase in credit card availability reduces the cash people hold, themoney-demand curve shifts to the left from MD1 to MD2, as shown in Figure 2.The result is a decline in the interest rate.c. When the Federal Reserve reduces reserve requirements, the money supply increases, so the money-supply curve shifts to the right from MS1 to MS2, asshown in Figure 1. The result is a decline in the interest rate.d. When households decide to hold more money to use for holiday shopping, themoney-demand curve shifts to the right from MD1 to MD2, as shown in Figure3. The result is a rise in the interest rate.Figure 3e. When a wave of optimism boosts business investment and expands aggregatedemand, money demand increases from MD1 to MD2 in Figure 3. The increase in money demand increases the interest rate.Figure 42. a. The increase in the money supply will cause the equilibrium interest rate todecline, as shown in Figure 4. Households will increase spending and willinvest in more new housing. Firms too will increase investment spending. Thiswill cause the aggregate demand curve to shift to the right as shown in Figure5.Figure 5b. As shown in Figure 5, the increase in aggregate demand will cause an increase in both output and the price level in the short run.c. When the economy makes the transition from its short-run equilibrium to its long-run equilibrium, short-run aggregate supply will decline, causing the price level to rise even further.d. The increase in the price level will cause an increase in the demand for money, raising the equilibrium interest rate.e. Yes. While output initially rises because of the increase in aggregate demand, it will fall once short-run aggregate supply declines. Thus, there is no long-run effect of the increase in the money supply on real output.Figure 63. a. When more ATMs are available, money demand is reduced and themoney-demand curve shifts to the left from MD1 to MD2, as shown in Figure 6.If the Fed does not change the money supply, which is at MS1, the interest rate will decline from r1 to r2. The decline in the interest rate shifts theaggregate-demand curve to the right, as consumption and investment increase.b. If the Fed wants to stabilize aggregate demand, it should reduce the money supply to MS2, so the interest rate will remain at r1 and aggregate demand will not change.4. A tax cut that is permanent will have a bigger impact on consumer spending and aggregate demand. If the tax cut is permanent, consumers will view it as addingsubstantially to their financial resources, and they will increase their spendingsubstantially. If the tax cut is temporary, consumers will view it as adding just a little to their financial resources, so they will not increase spending as much.5. a. The current situation is shown in Figure 7.Figure 7b. The Fed will want to stimulate aggregate demand. Thus, it will need to lowerthe interest rate by increasing the money supply. This could be achieved if the Fed purchases government bonds from the public.Figure 8c. As shown in Figure 8, the Fed's purchase of government bonds shifts thesupply of money to the right, lowering the interest rate.d. The Fed's purchase of government bonds will increase aggregate demand asconsumers and firms respond to lower interest rates. Output and the pricelevel will rise as shown in Figure 9.Figure 96. a. Legislation allowing banks to pay interest on checking deposits increases the return to money relative to other financial assets, thus increasing money demand.b. If the money supply remained constant (at MS1), the increase in the demand for money would have raised the interest rate, as shown in Figure 10. The risein the interest rate would have reduced consumption and investment, thus reducing aggregate demand and output.c. To maintain a constant interest rate, the Fed would need to increase the money supply from MS1 to MS2. Then aggregate demand and output would be unaffected.Figure 107. a. If there is no crowding out, then the multiplier equals 1/(1 –MPC). Because the multiplier is 3, then MPC = 2/3.b. If there is crowding out, then the MPC would be larger than 2/3. An MPC that is larger than 2/3 would lead to a larger multiplier than 3, which is then reduced down to 3 by the crowding-out effect.8. a. The initial effect of the tax reduction of $20 billion is to increase aggregatedemand by $20 billion x 3/4 (the MPC) = $15 billion.b. Additional effects follow this initial effect as the added incomes are spent. Thesecond round leads to increased consumption spending of $15 billion x 3/4 =$11.25 billion. The third round gives an increase in consumption of $11.25billion x 3/4 = $8.44 billion. The effects continue indefinitely. Adding them allup gives a total effect that depends on the multiplier. With an MPC of 3/4, themultiplier is 1/(1 – 3/4) = 4. So the total effect is $15 billion x 4 = $60 billion.c. Government purchases have an initial effect of the full $20 billion, becausethey increase aggregate demand directly by that amount. The to tal effect of anincrease in government purchases is thus $20 billion x 4 = $80 billion. Sogovernment purchases lead to a bigger effect on output than a tax cut does.The difference arises because government purchases affect aggregatedemand by the full amount, but a tax cut is partly saved by consumers, andtherefore does not lead to as much of an increase in aggregate demand.9. If government spending increases, aggregate demand rises, so money demand rises.The increase in money demand leads to a rise in the interest rate and thus a decline in aggregate demand if the Fed does not respond. But if the Fed maintains a fixed interest rate, it will increase money supply, so aggregate demand will not decline. Thus, theeffect on aggregate demand from an increase in government spending will be larger if the Fed maintains a fixed interest rate.10. a. Expansionary fiscal policy is more likely to lead to a short-run increase ininvestment if the investment accelerator is large. A large investmentaccelerator means that the increase in output caused by expansionary fiscalpolicy will induce a large increase in investment. Without a large accelerator,investment might decline because the increase in aggregate demand will raisethe interest rate.b. Expansionary fiscal policy is more likely to lead to a short-run increase ininvestment if the interest sensitivity of investment is small. Because fiscalpolicy increases aggregate demand, thus increasing money demand and theinterest rate, the greater the sensitivity of investment to the interest rate thegreater the decline in investment will be, which will offset the positiveaccelerator effect.11. a. Tax revenue declines when the economy goes into a recession because taxesare closely related to economic activity. In a recession, people's incomes andwages fall, as do firms' profits, so taxes on these things decline.b. Government spending rises when the economy goes into a recession becausemore people get unemployment-insurance benefits, welfare benefits, andother forms of income support.c. If the government were to operate under a strict balanced-budget rule, it would have to raise tax rates or cut government spending in a recession. Both would reduce aggregate demand, making the recession more severe.12. a. If there were a contraction in aggregate demand, the Fed would need to increase the money supply to increase aggregate demand and stabilize the price level, as shown in Figure 11. By increasing the money supply, the Fed is able to shift the aggregate-demand curve back to AD1 from AD2. This policy stabilizes output and the price level.Figure 11b. If there were an adverse shift in short-run aggregate supply, the Fed would need to decrease the money supply to stabilize the price level, shifting the aggregate-demand curve to the left from AD1 to AD2, as shown in Figure 12. This worsens the recession caused by the shift in aggregate supply. To stabilize output, the Fed would need to increase the money supply, shifting the aggregate-demand curve from AD1 to AD3. However, this action would raise the price level.。

Chapter 29Problems and Applications1. a. A U.S. penny is money in the U.S. economy because it is used as a medium of exchange tobuy goods or services, it serves as a unit of account because prices in stores are listed interms of dollars and cents, and it serves as a store of value for anyone who holds it overtime.b. A Mexican peso is not money in the U.S. economy, because it is not used as a medium ofexchange, and prices are not given in terms of pesos, so it is not a unit of account. It couldserve as a store of value, though.c. A Picasso painting is not money, because you cannot exchange it for goods or services, andprices are not given in terms of Picasso paintings. It does, however, serve as a store ofvalue.d. A plastic credit card is similar to money, but represents deferred payment rather thanimmediate payment. So credit cards do not fully represent the medium of exchangefunction of money, nor are they really stores of value, because they represent short-termloans rather than being an asset like currency.2. For an asset to be useful as a medium of exchange, it must be widely accepted (so all transactionscan be made in terms of it), recognized easily as money (so people can perform transactions easily and quickly), divisible (so people can provide change), and difficult to counterfeit (so people will not print their own money). That is why nearly all countries use paper money with fancy designs for larger denominations and coins for smaller denominations.For an asset to be useful as a store of value, it must be something that maintains its value over time and something that can be used directly to buy goods and services or sold when money is needed.In addition to currency, financial assets (like stocks and bonds) and physical assets (like real estate and art) make good stores of value.3. a. Currency holdings jumped at the end of 1999. Many individuals were worried about Y2Kand its effect on computers. They withdrew large sums of money from banks to protectthemselves from any possible problems.b. Many answers are possible.4. When your uncle repays a $100 loan from Tenth National Bank (TNB) by writing a check from hisTNB checking account, the result is a change in the assets and liabilities of both your uncle and TNB, as shown in these T-accounts:1Chapter 29/The Monetary System 2By paying off the loan, your uncle simply eliminated the outstanding loan using the assets in his checking account. Your uncle's wealth has not changed; he simply has fewer assets and fewerliabilities.5. a. Here is BSB's T-account:b. When BSB's largest depositor withdraws $10 million in cash and BSB reduces its loansoutstanding to maintain the same reserve ratio, its T-account is now:c. Because BSB is cutting back on its loans, other banks will find themselves short of reservesand they may also cut back on their loans as well.d. BSB may find it difficult to cut back on its loans immediately, because it cannot forcepeople to pay off loans. Instead, it can stop making new loans. But for a time it might finditself with more loans than it wants. It could try to attract additional deposits to getadditional reserves, or borrow from another bank or from the Fed.6. If you take $100 that you held as currency and put it into the banking system, then the totalamount of deposits in the banking system increases by $1,000, because a reserve ratio of 10%means the money multiplier is 1/.10 = 10. Thus, the money supply increases by $900, becausedeposits increase by $1,000 but currency declines by $100.7. With a required reserve ratio of 10%, the money multiplier could be as high as 1/.10 = 10, if bankshold no excess reserves and people do not keep some additional currency. So the maximumincrease in the money supply from a $10 million open-market purchase is $100 million. Thesmallest possible increase is $10 million if all of the money is held by banks as excess reserves.8. a. If the required reserve ratio is 5%, then First National Bank's required reserves are$500,000 x .05 = $25,000. Because the bank’s total reserves are $100,000, it has excessreserves of $75,000.b. With a required reserve ratio of 5%, the money multiplier is 1/.05 = 20. If First Nationallends out its excess reserves of $75,000, the money supply will eventually increase by$75,000 x 20 = $1,500,000.Chapter 29/The Monetary System 39. a. With a required reserve ratio of 10% and no excess reserves, the money multiplier is 1/.10= 10. If the Fed sells $1 million of bonds, reserves will decline by $1 million and the moneysupply will contract by 10 x $1 million = $10 million.b. Banks might wish to hold excess reserves if they need to hold the reserves for theirday-to-day operations, such as paying other banks for customers' transactions, makingchange, cashing paychecks, and so on. If banks increase excess reserves such that there isno overall change in the total reserve ratio, then the money multiplier does not change andthere is no effect on the money supply.10. a. With banks holding only required reserves of 10%, the money multiplier is 1/.10 = 10.Because reserves are $100 billion, the money supply is 10 x $100 billion = $1,000 billion.b. If the required reserve ratio is raised to 20%, the money multiplier declines to 1/.20 = 5.With reserves of $100 billion, the money supply would decline to $500 billion, a decline of$500 billion. Reserves would be unchanged.11. a. If people hold all money as currency, the quantity of money is $2,000.b. If people hold all money as demand deposits at banks with 100% reserves, the quantity ofmoney is $2,000.c. If people have $1,000 in currency and $1,000 in demand deposits, the quantity of money is$2,000.d. If banks have a reserve ratio of 10%, the money multiplier is 1/.10 = 10. So if people holdall money as demand deposits, the quantity of money is 10 x $2,000 = $20,000.e. If people hold equal amounts of currency (C) and demand deposits (D) and the moneymultiplier for reserves is 10, then two equations must be satisfied:(1) C = D, so that people have equal amounts of currency and demand deposits; and (2)10 x ($2,000 –C) = D, so that the money multiplier (10) times the number of dollar billsthat are not being held by people ($2,000 –C) equals the amount of demand deposits (D).Using the first equation in the second gives 10 x ($2,000 –D) = D, or $20,000 – 10D = D,or $20,000 = 11 D, so D = $1,818.18. Then C = $1,818.18. The quantity of money is C +D = $3,636.36.。

Answers to Textbook Questions and ProblemsCHAPTER 9 Economic Growth II: Technology, Empirics, and PolicyQuestions for Review1. In the Solow model, we find that only technological progress can affect the steady-staterate of growth in income per worker. Growth in the capital stock (through high saving) has no effect on the steady-state growth rate of income per worker; neither doespopulation growth. But technological progress can lead to sustained growth.2. In the steady state, output per person in the Solow model grows at the rate oftechnological progress g. Capital per person also grows at rate g. Note that this implies that output and capital per effective worker are constant in steady state. In the U.S. data, output and capital per worker have both grown at about 2 percent per year for the past half-century.3. To decide whether an economy has more or less capital than the Golden Rule, we needto compare the marginal product of capital net of depreciation (MPK –δ) with the growth rate of total output (n + g). The growth rate of GDP is readily available. Estimating the net marginal product of capital requires a little more work but, as shown in the text, can be backed out of available data on the capital stock relative to GDP, the total amount of depreciation relative to GDP, and capital’s share in GDP.4. Economic policy can influence the saving rate by either increasing public saving orproviding incentives to stimulate private saving. Public saving is the difference between government revenue and government spending. If spending exceeds revenue, thegovernment runs a budget deficit, which is negative saving. Policies that decrease the deficit (such as reductions in government purchases or increases in taxes) increase public saving, whereas policies that increase the deficit decrease saving. A variety of government policies affect private saving. The decision by a household to save may depend on the rate of return; the greater the return to saving, the more attractive saving becomes. Tax incentives such as tax-exempt retirement accounts for individuals and investment tax credits for corporations increase the rate of return and encourage private saving.5. The legal system is an example of an institutional difference between countries that mightexplain differences in income per person. Countries that have adopted the English style common law system tend to have better developed capital markets, and this leads to more rapid growth because it is easier for businesses to obtain financing. The quality of government is also important. Countries with more government corruption tend to have lower levels of income per person.6. Endogenous growth theories attempt to explain the rate of technological progress byexplaining the decisions that determine the creation of knowledge through research and development. By contrast, the Solow model simply took this rate as exogenous. In the Solow model, the saving rate affects growth temporarily, but diminishing returns tocapital eventually force the economy to approach a steady state in which growth depends only on exogenous technological progress. By contrast, many endogenous growth models in essence assume that there are constant (rather than diminishing) returns to capital, interpreted to include knowledge. Hence, changes in the saving rate can lead topersistent growth.Problems and Applications1. a. In the Solow model with technological progress, y is defined as output per effectiveworker, and k is defined as capital per effective worker. The number of effectiveworkers is defined as L E (or LE), where L is the number of workers, and E measures the efficiency of each worker. To find output per effective worker y, divide totaloutput by the number of effective workers:Y LE =K12(LE)12LEY LE =K12L12E12LEY LE =K1 L12E12Y LE =KLE æèççöø÷÷12y=k12b. To solve for the steady-state value of y as a function of s, n, g, and δ, we begin withthe equation for the change in the capital stock in the steady state:Δk = sf(k) –(δ + n + g)k = 0.The production function y can also be rewritten as y2 = k. Plugging thisproduction function into the equation for the change in the capital stock, we find that in the steady state:sy –(δ + n + g)y2 = 0.Solving this, we find the steady-state value of y:y* = s/(δ + n + g).c. The question provides us with the following information about each country:Atlantis: s = 0.28 Xanadu: s = 0.10n = 0.01 n = 0.04g = 0.02 g = 0.02δ = 0.04δ = 0.04Using the equation for y* that we derived in part (a), we can calculate the steady-state values of y for each country.Developed country: y* = 0.28/(0.04 + 0.01 + 0.02) = 4Less-developed country: y* = 0.10/(0.04 + 0.04 + 0.02) = 12. a. In the steady state, capital per effective worker is constant, and this leads to a constantlevel of output per effective worker. Given that the growth rate of output per effective worker is zero, this means the growth rate of output is equal to the growth rate ofeffective workers (LE). We know labor grows at the rate of population growth n and the efficiency of labor (E) grows at rate g. Therefore, output grows at rate n+g. Givenoutput grows at rate n+g and labor grows at rate n, output per worker must grow at rate g. This follows from the rule that the growth rate of Y/L is equal to the growth rate of Y minus the growth rate of L.b. First find the output per effective worker production function by dividing both sides ofthe production function by the number of effective workers LE:Y LE =K13(LE)23LEY LE =K13L23E23LEY LE =K13 L13E13Y LE =KLE æèçöø÷13y=k13To solve for capital per effective worker, we start with the steady state condition:Δk = sf(k) –(δ + n + g)k = 0.Now substitute in the given parameter values and solve for capital per effective worker (k):Substitute the value for k back into the per effective worker production function tofind output per effective worker is equal to 2. The marginal product of capital is given bySubstitute the value for capital per effective worker to find the marginal product ofcapital is equal to 1/12.c. According to the Golden Rule, the marginal product of capital is equal to (δ + n + g) or0.06. In the current steady state, the marginal product of capital is equal to 1/12 or0.083. Therefore, we have less capital per effective worker in comparison to the GoldenRule. As the level of capital per effective worker rises, the marginal product of capital will fall until it is equal to 0.06. To increase capital per effective worker, there must be an increase in the saving rate.d. During the transition to the Golden Rule steady state, the growth rate of output perworker will increase. In the steady state, output per worker grows at rate g. The increase in the saving rate will increase output per effective worker, and this will increase output per effective worker. In the new steady state, output per effective worker is constant ata new higher level, and output per worker is growing at rate g. During the transition,the growth rate of output per worker jumps up, and then transitions back down to rateg.3. To solve this problem, it is useful to establish what we know about the U.S. economy:• A Cobb–Douglas production function has the form y = kα, where α is capital’s share of income. The question tells us that α = 0.3, so we know that the productionfunction is y = k0.3.•In the steady state, we know that the growth rate of output equals 3 percent, so we know that (n + g) = 0.03.•The deprec iation rate δ = 0.04.•The capital–output ratio K/Y = 2.5. Because k/y = [K/(LE)]/[Y/(LE)] = K/Y, we also know that k/y = 2.5. (That is, the capital–output ratio is the same in terms of effectiveworkers as it is in levels.)a. Begin with the steady-state condition, sy = (δ + n + g)k. Rewriting this equation leadsto a formula for saving in the steady state:s = (δ + n + g)(k/y).Plugging in the values established above:s = (0.04 + 0.03)(2.5) = 0.175.The initial saving rate is 17.5 percent.b. We know from Chapter 3 that with a Cobb–Douglas production function, capital’sshare of income α = MPK(K/Y). Rewriting, we haveMPK = α/(K/Y).Plugging in the values established above, we findMPK = 0.3/2.5 = 0.12.c. We know that at the Golden Rule steady state:MPK = (n + g + δ).Plugging in the values established above:MPK = (0.03 + 0.04) = 0.07.At the Golden Rule steady state, the marginal product of capital is 7 percent, whereas it is 12 percent in the initial steady state. Hence, from the initial steady state we need to increase k to achieve the Golden Rule steady state.d. We know from Chapter 3 that for a Cobb–Douglas production function, MPK = α(Y/K). Solving this for the capital–output ratio, we findK/Y = α/MPK.We can solve for the Golden Rule capital–output ratio using this equation. If we plug in the value 0.07 for the Golden Rule steady-state marginal product of capital, and the value 0.3 for α, we findK/Y = 0.3/0.07 = 4.29.In the Golden Rule steady state, the capital–output ratio equals 4.29, compared to the current capital–output ratio of 2.5.e. We know from part (a) that in the steady states = (δ + n + g)(k/y),where k/y is the steady-state capital–output ratio. In the introduction to this answer, we showed that k/y = K/Y, and in part (d) we found that the Golden Rule K/Y = 4.29.Plugging in this value and those established above:s = (0.04 + 0.03)(4.29) = 0.30.To reach the Golden Rule steady state, the saving rate must rise from 17.5 to 30percent. This result implies that if we set the saving rate equal to the share going tocapital (30 percent), we will achieve the Golden Rule steady state.4. a. In the steady state, we know that sy = (δ + n + g)k. This implies thatk/y = s/(δ + n + g).Since s, δ, n, and g are constant, this means that the ratio k/y is also constant. Sincek/y = [K/(LE)]/[Y/(LE)] = K/Y, we can conclude that in the steady state, the capital–output ratio is constant.b. We know that capital’s share of income = MPK ⨯ (K/Y). In the steady state, we knowfrom part (a) that the capital–output ratio K/Y is constant. We also know from the hint that the MPK is a function of k, which is constant in the steady state; therefore theMPK itself must be constant. Thus, capital’s share of income is constant. Labor’s share of income is 1 – [C apital’s S hare]. Hence, if capital’s share is constant, we see thatlabor’s share of income is also constant.c. We know that in the steady state, total income grows at n + g, defined as the rate ofpopulation growth plus the rate of technological change. In part (b) we showed thatlabor’s and capital’s share of income is constant. If the shares are constant, and totalincome grows at the rate n + g, then labor income and capital income must alsogrow at the rate n + g.d. Define the real rental price of capital R asR = Total Capital Income/Capital Stock= (MPK ⨯K)/K= MPK.We know that in the steady state, the MPK is constant because capital per effectiveworker k is constant. Therefore, we can conclude that the real rental price of capital is constant in the steady state.To show that the real wage w grows at the rate of technological progress g, defineTLI = Total Labor IncomeL= Labor ForceUsing the hint that the real wage equals total labor income divided by the laborforce:w = TLI/L.Equivalently,wL = TLI.In terms of percentage changes, we can write this asΔw/w + ΔL/L = ΔTLI/TLI.This equation says that the growth rate of the real wage plus the growth rate of the labor force equals the growth rate of total labor income. We know that the labor force grows at rate n , and, from part (c), we know that total labor income grows at rate n + g . We, therefore, conclude that the real wage grows at rate g .5. a. The per worker production function isF (K, L )/L = AK α L 1–α/L = A (K/L )α = Ak αb. In the steady state, Δk = sf (k ) – (δ + n + g )k = 0. Hence, sAk α = (δ + n + g )k , or,after rearranging:k *=sA d +n +g éëêêùûúúa 1-a æèççöø÷÷.Plugging into the per-worker production function from part (a) givesy *=A a 1-a æèççöø÷÷s d +n +g éëêêùûúúa 1-a æèççöø÷÷.Thus, the ratio of steady-state income per worker in Richland to Poorland isy *Richland/y *Poorland ()=s Richland d +n Richland +g /s Poorland d +n Poorland +g éëêêùûúúa1-=0.320.05+0.01+0.02/0.100.05+0.03+0.02éëêêùûúúa1-ac. If α equals 1/3, then Richland should be 41/2, or two times, richer than Poorland.d. If 4a 1-a æèççöø÷÷= 16, then it must be the case thata 1-a æèççöø÷÷, which in turn requires that αequals 2/3. Hence, if the Cobb –Douglas production function puts 2/3 of the weighton capital and only 1/3 on labor, then we can explain a 16-fold difference in levels of income per worker. One way to justify this might be to think about capital more broadly to include human capital —which must also be accumulated through investment, much in the way one accumulates physical capital.6. How do differences in education across countries affect the Solow model? Education isone factor affecting the efficiency of labor , which we denoted by E . (Other factors affecting the efficiency of labor include levels of health, skill, and knowledge.) Since country 1 has a more highly educated labor force than country 2, each worker in country 1 is more efficient. That is, E 1 > E 2. We will assume that both countries are in steady state.a. In the Solow growth model, the rate of growth of total income is equal to n + g ,which is independent of the work force’s level of education. The two countries will, thus, have the same rate of growth of total income because they have the same rate of population growth and the same rate of technological progress.b. Because both countries have the same saving rate, the same population growth rate,and the same rate of technological progress, we know that the two countries will converge to the same steady-state level of capital per effective worker k *. This is shown in Figure 9-1.Hence, output per effective worker in the steady state, which is y* = f(k*), is the same in both countries. But y* = Y/(L E) or Y/L = y*E. We know that y* will be the same in both countries, but that E1 > E2. Therefore, y*E1 > y*E2. This implies that (Y/L)1 > (Y/L)2.Thus, the level of income per worker will be higher in the country with the moreeducated labor force.c. We know that the real rental price of capital R equals the marginal product of capital(MPK). But the MPK depends on the capital stock per efficiency unit of labor. In the steady state, both countries have k*1= k*2= k* because both countries have the same saving rate, the same population growth rate, and the same rate of technological progress. Therefore, it must be true that R1 = R2 = MPK. Thus, the real rental price of capital is identical in both countries.d. Output is divided between capital income and labor income. Therefore, the wage pereffective worker can be expressed asw = f(k) –MPK • k.As discussed in parts (b) and (c), both countries have the same steady-state capital stock k and the same MPK. Therefore, the wage per effective worker in the twocountries is equal.Workers, however, care about the wage per unit of labor, not the wage per effective worker. Also, we can observe the wage per unit of labor but not the wage per effective worker. The wage per unit of labor is related to the wage per effective worker by the equationWage per Unit of L = wE.Thus, the wage per unit of labor is higher in the country with the more educated labor force.7. a. In the two-sector endogenous growth model in the text, the production function formanufactured goods isY = F [K,(1 –u) EL].We assumed in this model that this function has constant returns to scale. As inSection 3-1, constant returns means that for any positive number z, zY = F(zK, z(1 –u) EL). Setting z = 1/EL, we obtainY EL =FKEL,(1-u)æèççöø÷÷.Using our standard definitions of y as output per effective worker and k as capital per effective worker, we can write this asy = F[k,(1 –u)]b. To begin, note that from the production function in research universities, the growthrate of labor efficiency, ΔE/E, equals g(u). We can now follow the logic of Section 9-1, substituting the function g(u) for the constant growth rate g. In order to keep capital per effective worker (K/EL) constant, break-even investment includes three terms: δk is needed to replace depreciating capital, nk is needed to provide capital for newworkers, and g(u) is needed to provide capital for the greater stock of knowledge E created by research universities. That is, break-even investment is [δ +n + g(u)]k.c. Again following the logic of Section 9-1, the growth of capital per effective worker isthe difference between saving per effective worker and break-even investment per effective worker. We now substitute the per-effective-worker production function from part (a) and the function g(u) for the constant growth rate g, to obtainΔk = sF [k,(1 –u)] – [δ + n + g(u)]kIn the steady state, Δk = 0, so we can rewrite the equation above assF [k,(1 –u)] = [δ + n + g(u)]k.As in our analysis of the Solow model, for a given value of u, we can plot the left and right sides of this equationThe steady state is given by the intersection of the two curves.d. The steady state has constant capital per effective worker k as given by Figure 9-2above. We also assume that in the steady state, there is a constant share of time spent in research universities, so u is constant. (After all, if u were not constant, it wouldn’t be a “steady” state!). Hence, output per e ffective worker y is also constant.Output per worker equals yE, and E grows at rate g(u). Therefore, output per worker grows at rate g(u). The saving rate does not affect this growth rate. However, the amount of time spent in research universities does affect this rate: as more time is spent in research universities, the steady-state growth rate rises.e. An increase in u shifts both lines in our figure. Output per effective worker falls forany given level of capital per effective worker, since less of each worker’s time isspent producing manufactured goods. This is the immediate effect of the change, since at the time u rises, the capital stock K and the efficiency of each worker E are constant. Since output per effective worker falls, the curve showing saving pereffective worker shifts down.At the same time, the increase in time spent in research universities increases the growth rate of labor efficiency g(u). Hence, break-even investment [which we foundabove in part (b)] rises at any given level of k, so the line showing breakeveninvestment also shifts up.Figure 9-3 shows these shifts.In the new steady state, capital per effective worker falls from k1 to k2. Output per effective worker also falls.f. In the short run, the increase in u unambiguously decreases consumption. After all,we argued in part (e) that the immediate effect is to decrease output, since workers spend less time producing manufacturing goods and more time in researchuniversities expanding the stock of knowledge. For a given saving rate, the decrease in output implies a decrease in consumption.The long-run steady-state effect is more subtle. We found in part (e) that output per effective worker falls in the steady state. But welfare depends on output (and consumption) per worker, not per effective worker. The increase in time spent inresearch universities implies that E grows faster. That is, output per worker equals yE.Although steady-state y falls, in the long run the faster growth rate of E necessarily dominates. That is, in the long run, consumption unambiguously rises.Nevertheless, because of the initial decline in consumption, the increase in u is not unambiguously a good thing. That is, a policymaker who cares more aboutcurrent generations than about future generations may decide not to pursue a policy of increasing u. (This is analogous to the question considered in Chapter 8 of whethera policymaker should try to reach the Golden Rule level of capital per effective workerif k is currently below the Golden Rule level.)8. On the World Bank Web site (), click on the data tab and then theindicators tab. This brings up a large list of data indicators that allows you to compare the level of growth and development across countries. To explain differences in income per person across countries, you might look at gross saving as a percentage of GDP, gross capital formation as a percentage of GDP, literacy rate, life expectancy, andpopulation growth rate. From the Solow model, we learned that (all else the same) a higher rate of saving will lead to higher income per person, a lower population growth rate will lead to higher income per person, a higher level of capital per worker will lead toa higher level of income per person, and more efficient or productive labor will lead tohigher income per person. The selected data indicators offer explanations as to why one country might have a higher level of income per person. However, although we might speculate about which factor is most responsible for the difference in income per person across countries, it is not possible to say for certain given the large number of othervariables that also affect income per person. For example, some countries may have more developed capital markets, less government corruption, and better access to foreigndirect investment. The Solow model allows us to understand some of the reasons why income per person differs across countries, but given it is a simplified model, it cannot explain all of the reasons why income per person may differ.More Problems and Applications to Chapter 91. a. The growth in total output (Y) depends on the growth rates of labor (L), capital (K),and total factor productivity (A), as summarized by the equationΔY/Y = αΔK/K + (1 –α)ΔL/L + ΔA/A,where α is capital’s share of output. We can look at the effect on output of a 5-percent increase in labor by setting ΔK/K = ΔA/A = 0. Since α = 2/3, this gives usΔY/Y = (1/3)(5%)= 1.67%.A 5-percent increase in labor input increases output by 1.67 percent.Labor productivity is Y/L. We can write the growth rate in labor productivity asD Y Y =D(Y/L)Y/L-D LL.Substituting for the growth in output and the growth in labor, we findΔ(Y/L)/(Y/L) = 1.67% – 5.0%= –3.34%.Labor productivity falls by 3.34 percent.To find the change in total factor productivity, we use the equationΔA/A = ΔY/Y –αΔK/K – (1 –α)ΔL/L.For this problem, we findΔA/A = 1.67% – 0 – (1/3)(5%)= 0.Total factor productivity is the amount of output growth that remains after we have accounted for the determinants of growth that we can measure. In this case,there is no change in technology, so all of the output growth is attributable tomeasured input growth. That is, total factor productivity growth is zero, as expected.b. Between years 1 and 2, the capital stock grows by 1/6, labor input grows by 1/3, andoutput grows by 1/6. We know that the growth in total factor productivity is given byΔA/A = ΔY/Y –αΔK/K – (1 –α)ΔL/L.Substituting the numbers above, and setting α = 2/3, we findΔA/A = (1/6) – (2/3)(1/6) – (1/3)(1/3)= 3/18 – 2/18 – 2/18= – 1/18= –0.056.Total factor productivity falls by 1/18, or approximately 5.6 percent.2. By definition, output Y equals labor productivity Y/L multiplied by the labor force L:Y = (Y/L)L.Using the mathematical trick in the hint, we can rewrite this asD Y Y =D(Y/L)Y/L+D LL.We can rearrange this asD Y Y =D YY-D LL.Substituting for ΔY/Y from the text, we findD(Y/L) Y/L =D AA+aD KK+(1-a)D LL-D LL =D AA+aD KK-aD LL=D AA+aD KK-D LLéëêêùûúúUsing the same trick we used above, we can express the term in brackets asΔK/K –ΔL/L = Δ(K/L)/(K/L)Making this substitution in the equation for labor productivity growth, we conclude thatD(Y/L) Y/L =D AA+aD(K/L)K/L.3. We know the following:ΔY/Y = n + g = 3.6%ΔK/K = n + g = 3.6%ΔL/L = n = 1.8%Capital’s Share = α = 1/3Labor’s Share = 1 –α = 2/3Using these facts, we can easily find the contributions of each of the factors, and then find the contribution of total factor productivity growth, using the following equations:Output = Capital’s+ Labor’s+ Total Factor Growth Contribution Contribution ProductivityD Y Y = aD KK+ (1-a)D LL+ D AA3.6% = (1/3)(3.6%) + (2/3)(1.8%) + ΔA/A.We can easily solve this for ΔA/A, to find that3.6% = 1.2% + 1.2% + 1.2%We conclude that the contribution of capital is 1.2 percent per year, the contribution of labor is 1.2 percent per year, and the contribution of total factor productivity growth is 1.2 percent per year. These numbers match the ones in Table 9-3 in the text for the United States from 1948–2002.。

c.Real GDP falls because with fewer workers on the job, firms produce less. Thisaccurately reflects a fall in economic well-being.d.Real GDP falls because the firms that lay off workers produce less. This decreaseseconomic well-being because workers’ incomes fall (the income side), and there are fewer goods for people to buy (the expenditure side).e.Real GDP is likely to fall, as firms shift toward production methods that producefewer goods but emit less pollution. Economic well-being, however, may rise. The economy now produces less measured output but more clean air; clean air is not traded in markets and, thus, does not show up in measured GDP, but is neverthe-less a good that people value.f.Real GDP rises because the high-school students go from an activity in which theyare not producing market goods and services to one in which they are. Economic well-being, however, may decrease. I n ideal national accounts, attending school would show up as investment because it presumably increases the future produc-tivity of the worker. Actual national accounts do not measure this type of invest-ment. Note also that future GDP may be lower than it would be if the students stayed in school, since the future work force will be less educated.g.Measured real GDP falls because fathers spend less time producing market goodsand services. The actual production of goods and services need not have fallen, however. Measured production (what the fathers are paid to do) falls, but unmea-sured production of child-rearing services rises.9.As Senator Robert Kennedy pointed out, GDP is an imperfect measure of economic per-formance or well-being. In addition to the left-out items that Kennedy cited, GDP also ignores the imputed rent on durable goods such as cars, refrigerators, and lawnmowers;many services and products produced as part of household activity, such as cooking and cleaning; and the value of goods produced and sold in illegal activities, such as the drug trade. These imperfections in the measurement of GDP do not necessarily reduce its usefulness. As long as these measurement problems stay constant over time, then GDP is useful in comparing economic activity from year to year. Moreover, a large GDP allows us to afford better medical care for our children, newer books for their education, and more toys for their play. Finally, countries with higher levels of GDP tend to have higher levels of life expectancy, better access to clean water and sanitation, and higher levels of education. GDP is therefore a useful measure for comparing the level of growth and development across countries.。

Answers to Textbook Questions and ProblemsCHAPTER 1 The Science of MacroeconomicsQuestions for Review1. Microeconomics is the study of how individual firms and households make decisions, andhow they interact with one another. Microeconomic models of firms and households are based on principles of optimization—firms and households do the best they can given the constraints they face. For example, households choose which goods to purchase in order to maximize their utility, whereas firms decide how much to produce in order to maximize profits. In contrast, macroeconomics is the study of the economy as a whole; it focuses on issues such as how total output, total employment, and the overall price level are determined. These economy-wide variables are based on the interaction of many households and many firms; therefore, microeconomics forms the basis for macroeconomics.2. Economists build models as a means of summarizing the relationships among economicvariables. Models are useful because they abstract from the many details in the economy and allow one to focus on the most important economic connections.3. A market-clearing model is one in which prices adjust to equilibrate supply and demand.Market-clearing models are useful in situations where prices are flexible. Yet in many situations, flexible prices may not be a realistic assumption. For example, labor contracts often set wages for up to three years. Or, firms such as magazine publishers change their prices only every three to four years. Most macroeconomists believe that price flexibility is a reasonable assumption for studying long-run issues. Over the long run, prices respond to changes in demand or supply, even though in the short run they may be slow to adjust.Problems and Applications1. Monetary policy in the United States and the European Union has been a big topic ofconversation in early 2015. The EU embarked upon a quantitative easing policy in March 2015 in an attempt to stimulate growth and prevent deflation. There has been some concern that the inflation rate in Europe will turn negative. In the United States, there is continued discussion and speculation concerning when the Federal Reserve might choose to increase the target federal funds rate. Also in the United States, the unemployment rate has declined to about 5.5 percent and this suggests that wages may begin to increase.The Federal Reserve will be watching for wage and price increases as they decide when to increase interest rates.2. Many philosophers of science believe that the defining characteristic of a science is theuse of the scientific method of inquiry to establish stable relationships. Scientists examine data, often provided by controlled experiments, to support or disprove a hypothesis.Economists are more limited in their use of experiments. They cannot conduct controlled experiments on the economy; they must rely on the natural course of developments in the economy to collect data. To the extent that economists use the scientific method of inquiry, that is, developing hypotheses and testing them, economics has the characteristics of a science.3. We can use a simple variant of the supply-and-demand model for pizza to answer thisquestion. Assume that the quantity of ice cream demanded depends not only on the price of ice cream and income, but also on the price of frozen yogurt:Q d = D(P IC, P FY, Y).We expect that demand for ice cream rises when the price of frozen yogurt rises, because ice cream and frozen yogurt are substitutes. That is, when the price of frozen yogurt goes up, I consume less of it and, instead, fulfill more of my frozen dessert urges through the consumption of ice cream.The next part of the model is the supply function for ice cream, Q s = S(P IC). Finally, in equilibrium, supply must equal demand, so that Q s = Q d. Y and P FY are the exogenous variables, and Q and P IC are the endogenous variables. Figure 1-1 uses this model to show that a fall in the price of frozen yogurt results in an inward shift of the demand curve for ice cream. The new equilibrium has a lower price and quantity of ice cream.4. The price of haircuts changes rather infrequently. From casual observation, hairstyliststend to charge the same price over a one- or two-year period irrespective of the demand for haircuts or the supply of cutters. A market-clearing model for analyzing the market for haircuts has the unrealistic assumption of flexible prices. Such an assumption isunrealistic in the short run when we observe that prices are inflexible. Over the long run, however, the price of haircuts does tend to adjust; a market-clearing model is therefore appropriate.Answers to Textbook Questions and ProblemsCHAPTER 2 The Data of MacroeconomicsQuestions for Review1. GDP measures the total income earned from the production of the new final goods and services in theeconomy, and it measures the total expenditures on the new final goods and services produced in the economy. GDP can measure two things at once because the total expenditures on the new final goods and services by the buyers must be equal to the income earned by the sellers of the new final goods and services. As the circular flow diagram in the text illustrates, these are alternative, equivalent ways of measuring the flow of dollars in the economy.2. The four components of GDP are consumption, investment, government purchases, and net exports.The consumption category of GDP consists of household expenditures on new final goods and services, such as the purchase of a new television. The investment category of GDP consists of business fixed investment, residential fixed investment, and inventory investment. When a business buys new equipment this counts as investment. Government purchases consists of purchases of new final goods and services by federal, state, and local governments, such as payments for new military equipment. Net exports measures the value of goods and services sold to other countries minus the value of goods and services foreigners sell us. When the U.S. sells corn to foreign countries, it counts in the net export category of GDP.3. The consumer price index (CPI) measures the overall level of prices in the economy. Ittells us the price of a fixed basket of goods relative to the price of the same basket in the base year. The GDP deflator is the ratio of nominal GDP to real GDP in a given year. The GDP deflator measures the prices of all goods and services produced, whereas the CPI only measures prices of goods and services bought by consumers. The GDP deflator includes only domestically produced goods, whereas the CPI includes domestic and foreign goods bought by consumers. Finally, the CPI is a Laspeyres index that assigns fixed weights to the prices of different goods, whereas the GDP deflator is a Paasche index that assigns changing weights to the prices of different goods. In practice, the two price indices tend to move together and do not often diverge.4. The CPI measures the price of a fixed basket of goods relative to the price of the samebasket in the base year. The PCE deflator is the ratio of nominal consumer spending to real consumer spending. The CPI and the PCE deflator are similar in that they both only include the prices of goods purchased by consumers, and they both include the price of imported goods as well as domestically produced goods. The two measures differ because the CPI measures the change in the price of a fixed basket whereas the goods measured by the PCE deflator change from year to year depending on what consumers are purchasing in that particular year.5. The Bureau of Labor Statistics (BLS) classifies each person into one of the following threecategories: employed, unemployed, or not in the labor force. The unemployment rate, which is the percentage of the labor force that is unemployed, is computed as follows:Unemployment Rate = Number of UnemployedLabor Force´100.Note that the labor force is the number of people employed plus the number of people unemployed.6. Every month, the Bureau of Labor Statistics undertakes two surveys to measureemployment. First, the BLS surveys about 60,000 households and thereby obtains an estimate of the share of people who say they are working. The BLS multiplies this share by an estimate of the population to estimate the number of people working. Second, the BLS surveys about 160,000 business establishments and asks how many people they employ. Each survey is imperfect; so the two measures of employment are not identical. Problems and Applications1. From the main Web page click on the interactive data tab at the top, select GDP,begin using the data, section 1, and then table 1.1.1. Real GDP grew at a rate of 2.2 percent in quarter 4 of 2014. When compared to growth rates of −2.1 percent, 4.6 percent, and 5 percent for the first three quarters of 2014, the rate of 2.2 percent was slightly below average. From the main Web page select the data tools tab, then top picks. Check the box for the unemployment rate and retrieve the data. The unemployment rate in March 2015 was 5.5 percent, which was about equal to the natural rate of unemployment, or the long run average rate. From the main page, select the economic releases tab, then inflation and prices. Access the report for the CPI. In February 2015, the inflation rate for all items was 0 percent, and if food and energy were excluded the rate was 1.7 percent. The inflation rate was below average and below the Federal Reserve’s target of 2 percent.2. Value added by each person is equal to the value of the good produced minus theamount the person paid for the materials needed to make the good. Therefore, the value added by the farmer is $1.00 ($1 – 0 = $1). The value added by the miller is $2: she sells the flour to the baker for $3 but paid $1 for the flour. The value added by the baker is $3: she sells the bread to the engineer for $6 but paid the miller $3 for the flour. GDP is the total value added, or $1 + $2 + $3 = $6. Note that GDP equals the value of the final good (the bread).3. When a woman marrie s her butler, GDP falls by the amount of the butler’s salary. Thishappens because GDP measures total income, and therefore GDP, falls by the amount of the butler’s loss i n salary. If GDP truly measures the value of all goods and services, then the marriage would not affect GDP since the total amount of economic activity is unchanged. Actual GDP, however, is an imperfect measure of economic activity because the value of some goods and services is left out. Once the butler’s work becomes part of his household chores, his services are no longer counted in GDP. As this example illustrates, GDP does not include the value of any output produced in the home.4. a. The airplane sold to the U.S. Air Force counts as government purchases because theAir Force is part of the government.b. The airplane sold to American Airlines counts as investment because it is a capitalgood sold to a private firm.c. The airplane sold to Air France counts as an export because it is sold to a foreigner.d. The airplane sold to Amelia Earhart counts as consumption because it is sold to aprivate individual.e. The airplane built to be sold next year counts as investment. In particular, the airplaneis counted as inventory investment, which is where goods that are produced in one year and sold in another year are counted.5. Data on parts (a) to (f) can be downloaded from the Bureau of Economic Analysis. Go tothe Website, click on the interactive data tab at the top, select GDP, begin using the data, section 1, and then table 1.1.5. Choose the “modify the data” option to select the years you in which you are interested. By dividing each component (a) to (f) by nominal GDP and multiplying by 100, we obtain the following percentages:1950 1980 2014a. Personal consumption expenditures 64.0% 61.3% 68.5%b. Gross private domestic investment 18.8% 18.5% 16.4%c. Government consumption purchases 16.9% 20.6% 18.2%d. Net exports 0.2% –0.5% 3.1%e. National defense purchases 7.6% 6.3% 4.4%f. Imports 3.9% 10.3% 16.5%(Note: The above data was downloaded April 3, 2015, from the BEA Web site.)Among other things, we observe the following trends in the economy over the period 1950–2015:a. Personal consumption expenditures have been around two-thirds of GDP between1980 and 2015.b. The share of GDP going to gross private domestic investment remained fairly steady.c. The share going to government consumption purchases rose sharply from 1950 to1980.d. Net exports, which were positive in 1950, have been negative since that time.e. The share going to national defense purchases has fallen.f. Imports have grown rapidly relative to GDP.6. a. GDP measures the value of the final goods and services produced, or $1,000,000. b. NNP is equal to GNP minus depreciation. In this example, GDP is equal to GNP because there areno foreign transactions. Therefore, NNP is equal to $875,000.c. National income is equal to NNP, or $875,000.d. Employee compensation is equal to $600,000.e. Proprietors’ income measures the income of the owner, and is equal to 150,000.f. Corporate profit is equal to corporate taxes plus dividends plus retained earnings, or $275,000.Retained earnings is calculated as sales minus wages minus dividends minus depreciation minus corporate tax, or $75,000.g. Personal income is equal to employee compensation plus dividends, or $750,000. h. Disposable personal income is personal income minus taxes, or $550,000.7. a. i. Nominal GDP is the total value of goods and services measured at current prices. Therefore,Nominal GDP 2010 = P hotdogs 2010´Q hotdogs 2010()+P burgers 2010´Q burgers 2010()= ($2 ⨯ 200) + ($3 ⨯ 200)= $400 + $600= $1,000.Nominal GDP 2015 = P hotdogs 2015´Q hotdogs 2015()+P burgers 2015´Q burgers 2015()= ($4 ⨯ 250) + ($4 ⨯ 500)= $1,000 + $2,000= $3,000.ii. Real GDP is the total value of goods and services measured at constant prices.Therefore, to calculate real GDP in 2015 (with base year 2010), multiply thequantities purchased in the year 2015 by the 2010 prices:Real GDP 2015 = P 2010hotdogs ´Q 2015hotdogs ()+P 2010burgers ´Q 2015burgers ()= ($2 ⨯ 250) + ($3 ⨯ 500)= $500 + $1,500= $2,000.Real GDP for 2010 is calculated by multiplying the quantities in 2010 by the pricesin 2010. Since the base year is 2010, real GDP 2010 equals nominal GDP 2010, which is$10,00. Hence, real GDP increased between 2010 and 2015.iii. The implicit price deflator for GDP compares the current prices of all goods and services produced to the prices of the same goods and services in a base year. It is calculated as follows:Implicit Price Deflator2015= Nominal GDP2010Real GDP2010= 1Using the values for Nominal GDP2015 and real GDP2015 calculated above:Implicit Price Deflator2015 = $3,000$2,000= 1.50.This calculation reveals that prices of the goods produced in the year 2015 increased by 50 percent compared to the prices that the goods in the economy sold for in 2010. (Because 2010 is the base year, the value for the implicit price deflator for the year 2010 is 1.0 because nominal and real GDP are the same for the base year.)iv. The consumer price index (CPI) measures the level of prices in the economy. The CPI is called a fixed-weight index because it uses a fixed basket of goods over time to weight prices. If the base year is 2010, the CPI in 2015 is measuring the cost of the basket in 2015 relative to the cost in 2010. The CPI2015 is calculated as follows:CPI 2015= (P2015hotdogs´Q2010hotdogs) + (P2015burgers´Q2010burgers)(P2010hotdogs´Q2010hotdogs) + (P2010burgers´Q2010burgers)= $16,000,000 $10,000,000= 1.6.This calculation shows that the price of goods purchased in 2015 increased by 60 percent compared to the prices these goods would have sold for in 2010. The CPI for 2010, the base year, equals 1.0.b. The implicit price deflator is a Paasche index because it is computed with a changingbasket of goods; the CPI is a Laspeyres index because it is computed with a fixed basket of goods. From (7.a.iii), the implicit price deflator for the year 2015 is 1.50, which indicates that prices rose by 50 percent from what they were in the year 2010.From (7.a.iv.), the CPI for the year 2015 is 1.6, which indicates that prices rose by 60percent from what they were in the year 2010.If prices of all goods rose by, for example, 50 percent, then one could say unambiguously that the price level rose by 50 percent. Yet, in our example, relative prices have changed. The price of hot dogs rose by 1020 percent; the price of hamburgers rose by 33.33 percent, making hamburgers relatively less expensive.As the discrepancy between the CPI and the implicit price deflator illustrates, the change in the price level depends on how the goods’ prices are weighted. The CPI weights the price of goods by the quantities purchased in the year 2010. The implicit price deflator weights the price of goods by the quantities purchased in the year 2015.Since the quantity of the two goods was the same in 2010, the CPI is placing equal weight on the two price changes. In 2015, the quantity of hamburgers was twice as large as hot dogs, so there is twice as much weight placed on the hamburger price relative to the hot dog price. For this reason, the CPI shows a larger inflation rate –more weight is placed on the good with the larger price increase.8. a. The consumer price index uses the consumption bundle in year 1 to figure out howmuch weight to put on the price of a given good:CPI2=$2´10()+$1´0() $1´10()+$2´0()=P2red´Q1red()+P2green´Q1green()P1red´Q1red()+P1green´Q1green()= 2.According to the CPI, prices have doubled.b. Nominal spending is the total value of output produced in each year. In year 1 andyear 2, Abby buys 10 apples for $1 each, so her nominal spending remains constant at $10. For example,Nominal Spending2 = P2red ´Q2red()+P2green´Q2green()= ($2 ⨯ 0) + ($1 ⨯ 10)= $10.c. Real spending is the total value of output produced in each year valued at the pricesprevailing in year 1. In year 1, the base year, her real spending equals her nominal spending of $10. In year 2, she consumes 10 green apples that are each valued at their year 1 price of $2, so her real spending is $20. That is,Real Spending2= P1red ´Q2red()+P1green´Q2green()= ($1 ⨯ 0) + ($2 ⨯ 10)= $20.Hence, Abby’s real spending rises from $10 to $20.d. The implicit price deflator is calculated by dividing Abby’s nominal spending in year2 by her real spending that year:Implicit Price Deflator2= Nominal Spending2 Real Spending2= $10 $20= 0.5.Thus, the implicit price deflator suggests that prices have fallen by half. The reason for this is that the deflator estimates how much Abby values her apples using prices prevailing in year 1. From this perspective green apples appear very valuable. In year 2, when Abby consumes 10 green apples, it appears that her consumption has increased because the deflator values green apples more highly than red apples. The only way she could still be spending $10 on a higher consumption bundle is if the price of the good she was consuming fell.e. If Abby thinks of red apples and green apples as perfect substitutes, then the cost ofliving in this economy has not changed—in either year it costs $10 to consume 10 apples. According to the CPI, however, the cost of living has doubled. This is because the CPI only takes into account the fact that the red apple price has doubled; the CPI ignores the fall in the price of green apples because they were not in the consumption bundle in year 1. In contrast to the CPI, the implicit price deflator estimates the cost of living has been cut in half. Thus, the CPI, a Laspeyres index, overstates the increase in the cost of living and the deflator, a Paasche index, understates it.9. a. The labor force includes full time workers, part time workers, those who run their ownbusiness,and those who do not have a job but are looking for a job. The labor force consists of 70 people. The working age population consists of the labor force plus those not in the labor force. The 10 discouraged workers and the 10 retired people are not in the labor force, but assuming they are capable of working, they are part of the adult population. The adult population consists of 90 people, so the labor force participation rate is equal to 70/90 or 77.8 percent.b. The number of unemployed workers is equal to 10, so the unemployment rate is10/70 or 14.3 percent.c. The household survey estimates total employment by asking a sample of householdsabout their employment status. The household survey would report 60 people employed. The establishment survey estimates total employment by asking a sample of businesses to report how many workers they are employing. In this case the establishment survey would report 55 people employed. The 5 people with 2 jobs would be counted twice, and the 10 people who run their own business would not be counted.10. As Senator Robert Kennedy pointed out, GDP is an imperfect measure of economicperformance or well-being. In addition to the left-out items that Kennedy cited, GDP also ignores the imputed rent on durable goods such as cars, refrigerators, and lawnmowers;many services and products produced as part of household activity, such as cooking and cleaning; and the value of goods produced and sold in illegal activities, such as the drug trade. These imperfections in the measurement of GDP do not necessarily reduce its usefulness. As long as these measurement problems stay constant over time, then GDP is useful in comparing economic activity from year to year. Moreover, a large GDP allows us to afford better medical care for our children, newer books for their education, and more toys for their play. Finally, countries with higher levels of GDP tend to have higher levels of life expectancy, better access to clean water and sanitation, and higher levels of education. GDP is therefore a useful measure for comparing the level of growth and development across countries.11. a. Real GDP falls because Disney World does not produce any services while it is closed.This corresponds to a decrease in economic well-being because the income of workers and shareholders of Disney World falls (the income side of the national accounts), and people’s consumption of Disney World falls (the expenditure side of the national accounts).b. Real GDP rises because the original capital and labor in farm production now producemore wheat. This corresponds to an increase in the economic well-being of society, since people can now consume more wheat. (If people do not want to consume more wheat, then farmers and farmland can be shifted to producing other goods that society values.)c. Real GDP falls because with fewer workers on the job, firms produce less. Thisaccurately reflects a fall in economic well-being.d. Real GDP falls because the firms that lay off workers produce less. This decreaseseconomic well-being because workers’ incomes fall (the income side), and there are fewer goods for people to buy (the expenditure side).e. Real GDP is likely to fall, as firms shift toward production methods that produce fewergoods but emit less pollution. Economic well-being, however, may rise. The economynow produces less measured output but more clean air. Clean air is not traded in markets and, thus, does not show up in measured GDP, but is nevertheless a good that people value.f. Real GDP rises because the high school students go from an activity in which they arenot producing market goods and services to one in which they are. Economic well-being, however, may decrease. In ideal national accounts, attending school would show up as investment because it presumably increases the future productivity of the worker. Actual national accounts do not measure this type of investment. Note also that future GDP may be lower than it would be if the students stayed in school, since the future work force will be less educated.g. Measured real GDP falls because fathers spend less time producing market goodsand services. The actual production of goods and services need not have fallen because but unmeasured production of child-rearing services rises. The well-being of the average person may very well rise if we assume the fathers and the children enjoy the extra time they are spending together.Answers to Textbook Questions and ProblemsCHAPTER3 National Income: Where It Comes From and Where It GoesQuestions for Review1. The factors of production and the production technology determine the amount ofoutput an economy can produce. The factors of production are the inputs used to produce goods and services: the most important factors are capital and labor. The production technology determines how much output can be produced from any given amounts of these inputs. An increase in one of the factors of production or an improvement in technology leads to an increase in the economy’s output.2. When a firm decides how much of a factor of production to hire or demand, it considershow this decision affects profits. For example, hiring an extra unit of labor increases output and therefore increases revenue; the firm compares this additional revenue to the additional cost from the higher wage bill. The additional revenue the firm receives depends on the marginal product of labor (MPL) and the price of the good produced (P).An additional unit of labor produces MPL units of additional output, which sells for P dollars per unit. Therefore, the additional revenue to the firm is P ⨯MPL. The cost of hiring the additional unit of labor is the wage W. Thus, this hiring decision has the following effect on profits:ΔProfit= ΔRevenue –ΔCost= (P ⨯MPL) –W.If the additional revenue, P ⨯MPL, exceeds the cost (W) of hiring the additional unit of labor, then profit increases. The firm will hire labor until it is no longer profitable to do so—that is, until the MPL falls to the point where the change in profit is zero. In the equation abov e, the firm hires labor until ΔP rofit = 0, which is when (P ⨯MPL) = W.This condition can be rewritten as:MPL = W/P.Therefore, a competitive profit-maximizing firm hires labor until the marginal product of labor equals the real wage. The same logic applies to the firm’s decision regarding how much capital to hire: the firm will hire capital until the marginal product of capital equals the real rental price.3. A production function has constant returns to scale if an equal percentage increase in allfactors of production causes an increase in output of the same percentage. For example, if a firm increases its use of capital and labor by 50 percent, and output increases by 50 percent, then the production function has constant returns to scale.If the production function has constant returns to scale, then total income (or equivalently, total output) in an economy of competitive profit-maximizing firms is divided between the return to labor, MPL ⨯L, and the return to capital, MPK ⨯K. That is, under constant returns to scale, economic profit is zero.4. A Cobb–Douglas production function has the form F(K,L) = AKαL1–α. The text showed thatthe parameter αgives capital’s share of income. So if capital earns one-fourth of total income, then α= 0.25. Hence, F(K,L) = AK0.25L0.75.5. Consumption depends positively on disposable income—i.e. the amount of income afterall taxes have been paid. Higher disposable income means higher consumption.The quantity of investment goods demanded depends negatively on the real interest rate. For an investment to be profitable, its return must be greater than its cost. Because the real interest rate measures the cost of funds, a higher real interest rate makes it more costly to invest, so the demand for investment goods falls.6. Government purchases are a measure of the value of goods and services purchaseddirectly by the government. For example, the government buys missiles and tanks, builds roads, and provides services such as air traffic control. All of these activities are part of GDP. Transfer payments are government payments to individuals that are not in exchange for goods or services. They are the opposite of taxes: taxes reduce household disposable income, whereas transfer payments increase it. Examples of transfer payments include Social Security payments to the elderly, unemployment insurance, and veterans’ benefits.7. Consumption, investment, and government purchases determine demand for theeconomy’s output, whereas the factors of production and the production function determine the supply of output. The real interest rate adjusts to ensure that the demand for the econo my’s goods equals the supply. At the equilibrium interest rate, the demand。

曼昆宏观经济经济学第九版英文原版答案完整版曼昆宏观经济经济学第九版英文原版答案集团标准化办公室:[VV986T-J682P28-JP266L8-68PNN]A n s w e r s t o T e x t b o o k Q u e s t i o n s a n d P r o b l e m sCHAPTER 7Unemployment and the Labor MarketQuestions for Review1. The rates of job separation and job finding determine the naturalrate of unemployment. The rate of job separation is the fraction of people who lose their job each month. The higher the rate of jobseparation, the higher the natural rate of unemployment. The rate of job finding is the fraction of unemployed people who find a job each month. The higher the rate of job finding, the lower the natural rate of unemployment.2. Frictional unemployment is the unemployment caused by the time ittakes to match workers and jobs. Finding an appropriate job takes time because the flow of information about job candidates and job vacancies is not instantaneous. Because different jobs requiredifferent skills and pay different wages, unemployed workers may not accept the first job offer they receive.In contrast, structural unemployment is the unemployment resulting from wage rigidity and job rationing. These workers are unemployed not because they are actively searching for a job that best suits their skills (as in the case of frictional unemployment), but because at the prevailing real wage thequantity of labor supplied exceeds the quantity of labor demanded. If the wage does not adjust to clear the labor market, then these workers must wait for jobs to become available. Structural unemployment thus arises because firms fail to reduce wages despite an excess supply of labor.3. The real wage may remain above the level that equilibrates laborsupply and labor demand because of minimum wage laws, the monopoly power of unions, and efficiency wages.Minimum-wage laws cause wage rigidity when they prevent wages from falling to equilibrium levels. Although most workers are paid a wage above the minimum level, for some workers, especially the unskilled and inexperienced, the minimum wage raises their wage above theequilibrium level. It therefore reduces the quantity of their labor that firms demand, and creates an excess supply of workers, which increases unemployment.The monopoly power of unions causes wage rigidity because the wages of unionized workers are determined not by the equilibrium of supply and demand but by collective bargaining between union leaders and firm management. The wage agreement often raises the wage abovethe equilibrium level and allows the firm to decide how many workers to employ. These high wages cause firms to hire fewer workers than at the market-clearing wage, so structural unemployment increases.Efficiency-wage theories suggest that high wages make workers more productive. The influence of wages on worker efficiency may explain why firms do not cut wages despite an excess supply of labor. Even though a wage reduction decreasesthe firm’s wage bill, it may also lower worker productivity and therefore the firm’s profits.4. Depending on how one looks at the data, most unemployment can appearto be either short term or long term. Most spells of unemployment are short; that is, most of those who became unemployed find jobs quickly.On the other hand, most weeks of unemployment are attributable to the small number of long-term unemployed. By definition, the long-term unemployed do not find jobs quickly, so they appear on unemployment rolls for many weeks or months.5. Europeans work fewer hours than Americans. One explanation is thatthe higher income tax rates in Europe reduce the incentive to work. A second explanation is a larger underground economy in Europe as aresult of more people attempting to evade the high tax rates.A third explanation is the greater importance of unions in Europe and their ability to bargain for reduced work hours. A final explanation isbased on preferences, whereby Europeans value leisure more thanAmericans do, and therefore elect to work fewer hours.Problems and Applications1. a. In the example that follows, we assume that during the school yearyou look for a part-time job, and that, on average, it takes 2 weeks to find one. We also assume that the typical job lasts 1semester, or 12 weeks.b. If it takes 2 weeks to find a job, then the rate of job finding in weeks isf = (1 job/2 weeks) = 0.5 jobs/week.If the job lasts for 12 weeks, then the rate of job separation in weeks iss = (1 job/12 weeks) = 0.083 jobs/week.c. From the text, we know that the formula for the natural rate of unemployment is(U/L) = [s/(s + f )],where U is the number of people unemployed, and L is the number of people in the labor force.Plugging in the values for f and s that were calculated in part (b), we find(U/L) = [0.083/(0.083 + 0.5)] = 0.14.Thus, if on average it takes 2 weeks to find a job that lasts 12 weeks, the natural rate of unemployment for this population ofcollege students seeking part-time employment is 14 percent.2. Call the number of residents of the dorm who are involved I, thenumber who are uninvolved U, and the total number of students T = I + U. In steady state the total number of involved students is constant.For this to happen we need the number of newly uninvolved students,(0.10)I, to be equal to the number of students who just becameinvolved, (0.05)U. Following a few substitutions:(0.05)U = (0.10)I= (0.10)(T – U),soWe find that two-thirds of the students are uninvolved.3. To show that the unemployment rate evolves over time to thesteady-state rate, let’s begin by defining how the number of people unemployed changes over time. The change in the number of unemployed equals the number of people losing jobs (sE) minus the number finding jobs (fU). In equation form, we can express this as:U–U t= ΔU t + 1 = sE t–fU t.t + 1Recall from the text that L = E t + U t, or E t = L –U t, where L is the total labor force (we will assume that L is constant). Substituting for E t in the above equation, we findΔU t + 1 = s(L –U t) –fU t.Dividing by L, we get an expression for the change in the unemployment rate from t to t + 1:ΔU t + 1/L = (U t + 1/L) –(U t/L) = Δ[U/L]t + 1 = s(1 –U t/L) –fU t/L.Rearranging terms on the right side of the equation above, we end up with line 1 below. Now take line 1 below, multiply the right side by (s + f)/(s + f) and rearrange terms to end up with line 2 below:Δ[U/L]t + 1= s – (s + f)U t/L= (s + f)[s/(s + f) – U/L].tThe first point to note about this equation is that in steady state, when the unemployment rate equals its natural rate, the left-handside of this expression equals zero. This tells us that, as we found in the text, the natural rate of unemployment (U/L)n equals s/(s + f).We can now rewrite the above expression, substituting (U/L)n for s/(s + f), to get an equation that is easier to interpret: Δ[U/L]t + 1 = (s + f)[(U/L)n–U t/L].This expression shows the following:If U t/L > (U/L)n (that is, the unemployment rate is above its natural rate), then Δ[U/L]t + 1 is negative: the unemployment rate falls.If U t/L < (U/L)n (that is, the unemployment rate is below its natural rate), then Δ[U/L]t + 1 is positive: the unemployment raterises.This process continues until the unemployment rate U/L reaches the steady-state rate (U/L)n.4. Consider the formula for the natural rate of unemployment,If the new law lowers the chance of separation s, but has no effect on the rate of job finding f, then the natural rate of unemployment falls.For several reasons, however, the new law might tend to reduce f.First, raising the cost of firing might make firms more careful about hiring workers, since firms have a harder time firing workers who turn out to be a poor match. Second, if job searchers think that the new legislation will lead them to spend a longer period of time on a particular job, then they might weigh morecarefully whether or not to take that job. If the reduction in f is large enough, then the new policy may even increase the natural rate of unemployment.5. a. The demand for labor is determined by the amount of labor that aprofit-maximizing firm wants to hire at a given real wage. The profit-maximizing condition is that the firm hire labor until the marginal product of labor equals the real wage,The marginal product of labor is found by differentiating the production function with respect to labor (see Chapter 3 for more discussion),In order to solve for labor demand, we set the MPL equal to the real wage and solve for L:Notice that this expression has the intuitively desirable feature that increases in the real wage reduce the demand for labor.b. We assume that the 27,000 units of capital and the 1,000 units oflabor are supplied inelastically (i.e., they will work at anyprice). In this case we know that all 1,000 units of labor and 27,000 units of capital will be used in equilibrium, so we can substitute these values into the above labor demand function and.solve for WPIn equilibrium, employment will be 1,000, and multiplying this by10 we find that the workers earn 10,000 units of output. The totaloutput is given by the production function:Y=5Y13Y23Y=5(27,00013)(1,00023)Y=15,000.Notice that workers get two-thirds of output, which is consistent with what we know about the Cobb–Douglas production function from Chapter 3.c. The real wage is now equal to 11 (10% above the equilibrium levelof 10).Firms will use their labor demand function to decide how manyworkers to hire at the given real wage of 11 and capital stock of 27,000:So 751 workers will be hired for a total compensation of 8,261units of output. To find the new level of output, plug the new value for labor and the value for capital into the production function and you will find Y = 12,393.d. The policy redistributes output from the 249 workers who becomeinvoluntarily unemployed to the 751 workers who get paid more than before. The lucky workers benefit less than the losers lose as the total compensation to the working class falls from 10,000 to 8,261 units of output.e. This problem does focus on the analysis of two effects of theminimum-wage laws: they raise the wage for some workers whiledownward-sloping labor demand reduces the total numberof jobs.Note, however, that if labor demand is less elastic than in this example, then the loss of employment may be smaller, and thechange in worker income might be positive.6. a. The labor demand curve is given by the marginal product of laborschedule faced by firms. If a country experiences a reduction inproductivity, then the labor demand curve shifts to the left as in Figure 7-1. If labor becomes less productive, then at any givenreal wage, firms demand less labor.b. If the labor market is always in equilibrium, then, assuming afixed labor supply, an adverse productivity shock causes adecrease in the real wage but has no effect on employment orunemployment, as in Figure 7-2.c. If unions constrain real wages to remain unaltered, then asillustrated in Figure 7-3, employmentfalls to L1 and unemployment equals L –L1.This example shows that the effect of a productivity shock on aneconomy depends on the role of unions and the response of collective bargaining to such a change.7. a. If workers are free to move between sectors, then the wage in each sector will be equal. If thewages were not equal then workers would have an incentive to move to the sector with the higherwage and this would cause the higher wage to fall, and the lower wage to rise until they wereequal.b. Since there are 100 workers in total, L S = 100 – L M. We cansubstitute this expression into the labor demand for services equation, and call the wage w since it is the same in bothsectors:L S = 100 – LM= 100 – 4wLM= 4w.Now set this equal to the labor demand for manufacturing equation and solve for w:4w = 200 – 6ww = $20.Substitute the wage into the two labor demand equations to find L M is 80 and L S is 20.c. If the wage in manufacturing is equal to $25 then L M is equal to 50.d. There are now 50 workers employed in the service sector and the wage w S is equal to $12.50.e. The wage in manufacturing will remain at $25 and employment will remain at 50. If thereservation wage for the service sector is $15 then employment in the service sector will be 40. Therefore, 10 people are unemployed and the unemployment rate is 10 percent.8. Real wages have risen over time in both the United Statesand Europe,increasing the reward for working (the substitution effect) but also making people richer, so they want to “buy” more leisure (theincome effect). If the income effect dominates, then people want to work less as real wages go up. This could explain the Europeanexperience, in which hours worked per employed person have fallen over time. If the income and substitution effects approximatelycancel, then this could explain the U.S. experience, in which hours worked per person have stayed about constant. Economists do not have good theories for why tastes might differ, so they disagree onwhether it is reasonable to think that Europeans have a larger income effect than do Americans.9. The vacant office space problem is similar to the unemploymentproblem; we can apply the same concepts we used in analyzingunemployed labor to analyze why vacant office space exists. There isa rate of office separation: firms that occupy offices leave, eitherto move to different offices or because they go out of business.There is a rate of office finding: firms that need office space (either to start up or expand) find empty offices. It takes time to match firms with available space. Different types of firms require spaces with different attributes depending on what theirspecific needs are. Also, because demand for different goods fluctuates, there are “sectoral shifts”—changes in the composition of demand among industries and regions that affect the profitability and office needs of different firms.。

CHAPTER 23: MEASURING A NATION’S INCOMETrue/FalseIndicate whether the statement is true or false.1. T he circular flow diagram describes all transactions between households and firms in a simpleeconomy and shows the equality of expenditures and income.ANSWER: TPOINTS: 0 / 12. G ross domestic product includes most items produced and sold illicitly.ANSWER: FPOINTS: 0 / 13. N et national product is the total in come of a nation’s residents minus losses from depreciation.ANSWER: TPOINTS: 0 / 14. D isposable personal income is the income that households and unincorporated business haveleft after satisfying all their obligations to the government. It equals personal income minuspersonal taxes and certain non-tax payments to government.ANSWER: TPOINTS: 0 / 15. T he purchase of new houses by households is included in the calculation of personalconsumption expenditures of GDP.ANSWER: FPOINTS: 0 / 1Multiple ChoiceIdentify the choice that best completes the statement or answers the question.1. W hen GDP falls,a. income and expenditure must both fall.b. income and expenditure can both rise.c. income must fall, but expenditure may rise or fall.d. expenditure must fall, but income may rise or fall.ANSWER: APOINTS: 0 / 12. I ncome equals expenditure becausea. firms always pay out all their revenue as income to someone.b. each time a sale is made, there is a buyer and a seller.c. households own the factors of production used to generate incomes.d. All of the above are correct.ANSWER: BPOINTS: 0 / 13. I f a province makes the production and sale of illicit drugs legal, then GDPa. must increase.b. must decrease.c. wouldn't change.d. may increase or decrease.ANSWER: APOINTS: 0 / 14. W hen a government provides subsidies to encourage growth of small businesses, the subsidieswoulda. be included in GDP because they are invested by businesses.b. be included in GDP because they are a form of government spending.c. not be included in GDP because they are transfer payments.d. may or may not be included in GDP, depending on how the funds are used.ANSWER: CPOINTS: 0 / 15. D iesel fuel isa. always considered a final good.b. counted as an intermediate good if a company uses it to provide transportation services.c. counted as a final good if a farmer uses it to run a tractor to grow crops.d. Both b and c are correct.ANSWER: BPOINTS: 0 / 16. G ross domestic producta. is the market value of all final goods and services produced within a country in a givenperiod (usually a year)b. is the income in the hands of individuals after deducting income taxes; income availableto households to spend and savec. is the value of goods and services purchased by all levels of government— federal,provincial, and local—in a given periodd. is the market value of all final goods and services produced by permanent residents of anation in a given time periodANSWER: APOINTS: 0 / 17. M acroeconomics is that branch of economics that studiesa. the conditions of individual marketsb. the influence of governments on individual marketsc. economy-wide phenomenad. only the private sector of the economyANSWER: CPOINTS: 0 / 18. S uppose that nominal GDP is $6,000 billion and real GDP is $3,000. What is the GDP pricedeflator?a. 125b. 150c. 200d. 250ANSWER: CPOINTS: 0 / 19. T he purchase of final goods and services by households is calleda. investmentb. public sector expenditurec. consumptiond. net exportsANSWER: CPOINTS: 0 / 110. I nvestment is the purchase of capital equipment, inventories, anda. structuresb. non-durable goodsc. depreciationd. import investmentANSWER: APOINTS: 0 / 111. T ransfer paymentsa. are included in GDP because they are forms of incomeb. are included in GDP because goods and services have been produced in the transferc. are NOT included in the GDP because goods and services have not been produced inthe transferd. are included in GDP because they represent the production of transfers of goods andservices to foreign countriesANSWER: CPOINTS: 0 / 112. W hich of the following would be considered consumption expenditure?a. The Smiths buy a home built in 1990.b. The federal government pays the salary of a captain in the Armed Forces.c. The Hostlers buy a new car that was manufactured in Germany.d. The government buys food for its armed forces.ANSWER: CPOINTS: 0 / 113. T he method that measures GDP in relationship to the size of the population is calleda. GNPb. worker GDPc. GDP per persond. capital GDPANSWER: CPOINTS: 0 / 114. T he components of GDP area. C + I + Gb. NX + G + Cc. C + G + NXd. C + I + G + NXANSWER: DPOINTS: 0 / 115. S uppose nominal GDP is $7700 and the GDP deflator is 110. Real GDP isa. $7700b. $7000c. $847,000d. $8470ANSWER: BPOINTS: 0 / 1Short Answer1. W hat are the components of gross domestic product (GDP)?RESPONSE:ANSWER: The components of GDP are: (1) consumption spending by households on goods and services, with the exception of purchases of new housing; (2) Investmentspending on capital equipment, inventories, and structures, including householdpurchases of new housing; (3) government purchases or spending on goods andservices by the local, provincial, and federal levels governments; and (4) netexports which is spending on domestically produced goods and services byforeigners (exports) minus spending on foreign goods and services by domesticresident (imports).POINTS: -- / 12. D ifferentiate between gross domestic product (GDP) and gross national product (GNP).RESPONSE:ANSWER: GDP is the value of all final goods and services produced within a country in a given year; while GNP is the total income earned by a nation’s permanent residents ornationals (that is, Canadians). GNP differs from GDP by including income thatcitizens of the nation (Canada) earned aboard, and excluding income thatforeigners earn in the particular country (E.g. in Canada).POINTS: -- / 13. D ifferentiate between real GDP and nominal GDP.RESPONSE:ANSWER: Nominal GDP is the value of all final goods and services produced within a country in a year and valued at current prices; and real GDP is the GDP valued at constantbase year prices. Real GDP is not affected by changes in the level of prices, so itreflects only changes in the amounts being produced.POINTS: -- / 14. E xplain why GDP is not considered a perfect measure of well- being?RESPONSE:ANSWER: GDP is not considered a perfect measure of well-being because some of thefactors that contribute to a good life are omitted. These would include: leisure time,the quality of the environment, the distribution of income, and the production ofgoods and services that did not pas through the market (for example, houseworkdone by the homemaker, and volunteer work)POINTS: -- / 15. H ow do economists measure economic growth?RESPONSE:ANSWER: Economists measure economic growth as the percentage change in real GDP from one period to another. This is because changes in real GDP reflect only changes inthe amounts being produced.POINTS: -- / 1CHAPTER 24: MEASURING THE COST OF LIVINGTrue/FalseIndicate whether the statement is true or false.1. T he GDP deflator reflects the prices of goods and services bought by consumers, and the consumerprice index reflects the price of all final goods and services produced domestically.ANSWER: FPOINTS: 0 / 12. T he consumer price index compares the price of a fixed basket of goods and services to the price ofthe basket in the base year. On the other hand, the GDP deflator compares the price of currently produced goods and services to the price of the same goods and services in the base years.ANSWER: TPOINTS: 0 / 13. I ndexation refers to the automatic correction of a dollar amount for the effects of inflation by law orcontract.ANSWER: TPOINTS: 0 / 14. L ong term contracts between firms and unions will sometimes include partial or complete indexationof the wage to the consumer price index. This is called a cost-of-living allowance clause.ANSWER: TPOINTS: 0 / 15. T he core inflation rate is the consumer price index with the exclusion of the most volatilecomponents such as energy and food.ANSWER: TPOINTS: 0 / 1Multiple ChoiceIdentify the choice that best completes the statement or answers the question.1. I n the CPI, goods and services are weighted according toa. how much a typical consumer buys of each item.b. whether the items are necessities or luxuries.c. how much of each item is produced in the domestic economy.d. how much is spent on them in the national income accounts.ANSWER: APOINTS: 0 / 12. B y not taking into account the possibility of consumer substitution, the CPIa. understates the standard of living.b. overstates the cost of living.c. neither overstates nor understates the cost of living.d. doesn't accurately reflect the cost of living, but it is unclear if it overstates or understates thecost of living.ANSWER: BPOINTS: 0 / 13. I f the prices of Brazilian-made shoes imported into Canada increases, thena. both Canada’s GDP deflator and it’s consumer price index will increase.b. neither Canada’s GDP deflator nor it’s consumer pri ce index will increase.c. Canada’s GDP deflator will increase but its CPI will not increase.d. Canada’s consumer price index will increase, but its GDP deflator won’t change.ANSWER: DPOINTS: 0 / 14. I f increases in the prices of Canadian car insurance causes the CPI to increase by 3 percent, theGDP deflator will likely increase bya. more than 3 percent.b. 3 percent.c. less than 3 percent.d. All of the above are correct.ANSWER: CPOINTS: 0 / 15. T he real interest rate tells youa. how quickly your savings account will grow.b. how quickly the purchasing power of your savings account will grow.c. the size of your savings account.d. the purchasing power of your savings account.ANSWER: BPOINTS: 0 / 16. I nflation refers toa. a temporary increase in the price level due to higher tax ratesb. a large increase in food and gasoline pricesc. a situation in which the economy's overall price level is risingd. an increase in the purchasing power of the dollarANSWER: CPOINTS: 0 / 17. I f nominal interest rates increase from 8 percent to 10 percent while inflation increases from 3percent to 12 percenta. the real interest rate falls from 5 percent to –2 percentb. the real interest rate rises from –2 percent to 5 percentc. the real interest rate falls from 8 percent to 12 percentd. the real interest rate rises from 8 percent to 12 percentANSWER: APOINTS: 0 / 18. I f the nominal rate of interest is 10 percent and the rate of inflation is 3 percent, what is the real rateof interest?a. 13 percentb. 7 percentc. 3 percentd. –7 percentANSWER: BPOINTS: 0 / 19. T he consumer price index:a. measures price changes of raw materialsb. adjusts all prices of goods and services for five-year periodsc. measures the cost of goods and services bought by a typical consumerd. cannot measure price changes of intangible production such as servicesANSWER: CPOINTS: 0 / 110. I f the consumer price index (CPI) at the end of 1996 was 125 and the CPI at the end of 1997 was131, then the rate of inflation during 1997 wasa. zero – prices were stable during 1997b. 4.8 percentc. 6.0 percentd. 125 percentANSWER: BPOINTS: 0 / 111. F rank's nominal income in 1998 is $45,000. Suppose the CPI in 1998 is 150. What is Frank's realincome?a. $51,750b. $45,000c. $38,250d. $30,000ANSWER: DPOINTS: 0 / 112. A change in the price of imports bought by consumers will bea. reflected in the GDP deflatorb. reflected in GDPc. reflected in the CPId. reflected in net national incomeANSWER: CPOINTS: 0 / 113. A ll of the following but one are problems associated with the CPIa. substitution biasb. the introduction of new goods and servicesc. unmeasured quality changesd. The CPI is not based on a fixed basket of goods and servicesANSWER: DPOINTS: 0 / 114. W hich of the following is correct?a. The CPI is not based on a fixed basket of goods and services.b. The GDP deflator reflects the prices of all domestically produced goods and services.c. The GDP deflator is based on a fixed basket of goods and services.d. The GDP deflator is subject to substitution bias.ANSWER: BPOINTS: 0 / 115. T he inflation ratea. is a measure of the cost of a basket of goods and services bought by firmsb. is the absolute change in prices between yearsc. is the percentage change in the price index from the preceding periodd. measures changes in incomes from one year to the nextANSWER: CPOINTS: 0 / 1Short Answer1. W hat is the consumer price index (CPI)? What are the three major items included in the CPI?RESPONSE:ANSWER: The CPI is a measure of the overall cost of the goods and services bought by a typical consumer. The three major items included in the CPI are shelter, transportation andfood.POINTS: -- / 12. H ow is the CPI computed?RESPONSE:ANSWER: First the basket of goods and services must be determined and also the relative importance of the various items to be included in the basket. Then the prices of thevarious items in the basket are determined. The cost of the basket is then determinedusing the data on prices and quantity. The base year is chosen, and the index for thebase year is computed using the quantities in the basket and the base year prices.The index is calculated by taking the price of the basket in the each year and dividingthis by the price of the basket in the base year. This ratio is then multiplied by 100. POINTS: -- / 13. D ifferentiate between the nominal rate of interest and the real rate of interest.RESPONSE:ANSWER: The nominal interest rate is the interest rate as usually reported without a correction for the effects of inflation. The real interest rate is the interest rate corrected for theeffects of inflation. The real interest rate = nominal interest rate minus the inflationrate.POINTS: -- / 14. W hat is meant by the inflation rate? If the CPI in 1996 was 107.6 and in 1995 was 105.9, calculatethe inflation rate for 1996.RESPONSE:ANSWER: The inflation rate is the percentage change in the price index from the preceding period. The inflation rate for 1996 would be:POINTS: -- / 15. W hat are the problems associated with using the consumer price index to measure the cost ofliving?RESPONSE:ANSWER: The problems are: (1) Prices do not change proportionately. Consumers respond by buying less of the goods whose prices have risen by large amounts and by buyingmore of the goods whose price have risen by less, or even fallen. The index iscomputed using a fixed basket of items, so theses changes in quantity would not bereflected in the basket. This is referred to as the substitution bias. (2) The CPI isdeveloped using a fixed basket of goods and services, when new products areintroduced during the time period that a particular fixed basket is being used, thesenew products will not be included in calculation of the index. (3) The CPI does notmeasure quality changes. If the quality of a good deteriorates from one year to thenext, the value of the dollar falls, even if the price of the good stays the same.Likewise, if the quality of the good increases from one year to the next, the value of adollar also rises. Statistics Canada will try to adjust the price of the good to account forthe quality change, but it is very difficult to measure quality.POINTS: -- / 1CHAPTER 25: PRODUCTION AND GROWTHTrue/FalseIndicate whether the statement is true or false.1. O ne way to raise future productivity is to invest less current resources in the production of capital.ANSWER: FPOINTS: 0 / 12. D iminishing returns occur when the benefits from an extra unit of output declines as the quantityof output declines.ANSWER: FPOINTS: 0 / 13. M althusian theory states that an ever-increasing population would continually strain society’sability to provide for itself. This doomed human beings to forever live in poverty.ANSWER: TPOINTS: 0 / 14. P roductivity growth is measured by real output per worker.ANSWER: TPOINTS: 0 / 15. T he primary reason that living standards are higher today than they were a century ago is thattechnological knowledge has advanced.ANSWER: TPOINTS: 0 / 1Multiple ChoiceIdentify the choice that best completes the statement or answers the question.1. O f the following countries, which grew the slowest over the last 100 years?a. Brazil.b. Mexico.c. Singapore.d. United States.ANSWER: DPOINTS: 0 / 12. O n average, each year of schooling raises a person's wage in Canada by abouta. 3 percent.b. 10 percent.c. 15 percent.d. 25 percent.ANSWER: BPOINTS: 0 / 13. T he primary reason that Canadian living standards are higher today than they were a century agois thata. more productive natural resources have been discovered.b. physical capital per worker has increased.c. technological knowledge has increased.d. human capital has increased.ANSWER: CPOINTS: 0 / 14. M any countries in Africa have low growth rates. This is partly due toa. few natural resourcesb. high trade barriers.c. low incomes, making it very difficult for them to grow.d. All of the above are correct.ANSWER: BPOINTS: 0 / 15. A government can encourage growth and, in the long run, raise the economy’s standard of livingby encouraginga. population growth.b. consumption spending.c. saving and investment.d. trade restrictions.ANSWER: CPOINTS: 0 / 16. D iminishing returns is the notion thata. as the stock of capital ages, the extra output produced decreasesb. as the stock of capital is increased, the extra output produced from an additional unit ofcapital fallsc. as resources are used to produce capital goods, fewer additional capital goods can beproducedd. you always get what you pay forANSWER: BPOINTS: 0 / 17. C ompared with richer countries, poorer countries are generally characterized bya. high real GDP per personb. political stabilityc. rapid population growthd. strongly enforced property rightsANSWER: CPOINTS: 0 / 18. W hich one of the following countries would most likely be considered a poorer nation, using realGDP/person?a. Canadab. Germanyc. Japand. IndiaANSWER: DPOINTS: 0 / 19. W hich of the following factors would be most likely to encourage capital formation in a poorernation?a. the expectation of sustained high rates of inflation in the futureb. the expectation that property rights will remain securec. the expectation that a struggle between capitalist and socialist forces will lead to majorstructural change in the economyd. an increase in corporate taxes in order to finance an expanded government welfareprogramANSWER: BPOINTS: 0 / 110. W hich of the following is most likely to cause the productivity of labour to increase?a. higher money wage ratesb. a higher rate of investment in human and physical capitalc. more flexible working hours and improved retirement plansd. none of the aboveANSWER: BPOINTS: 0 / 111. S uppose that factory output rose from 50,000 units to 55,000 units while labour hours rose from1100 to 1200. Which of the following is true?a. Labour productivity remained unchanged.b. Labour productivity increased slightly.c. Labour productivity decreased slightly.d. Labour productivity increased sharply.ANSWER: BPOINTS: 0 / 112. W hich of the following would be most likely to cause the real income per person of poorercountries to rise?a. a more rapid population growthb. a rapid rate of inflationc. an international minimum-wage lawd. an increase in foreign investment that enhanced the productivity of the labour forceANSWER: DPOINTS: 0 / 113. I f a production function has constant returns to scale, then:a. doubling inputs will double output.b. doubling inputs will triple output.c. doubling inputs will cause output to increase, but the increase in output will be less thanthe increase in inputs.d. doubling inputs will decrease output.ANSWER: APOINTS: 0 / 114. T he most important source of rising living standards over time is:a. the increase in the size of the labour force.b. the increase in the labour force participation rate.c. the increase in productivity.d. the increase in human capital—the skills embodied in the work force.ANSWER: CPOINTS: 0 / 1Short Answer1. W hat is productivity and why is it important?RESPONSE:ANSWER: Productivity is the amount of goods and services produced from each hour of a worker’s time. It is the major determinant of the standard of livi ng of a country.POINTS: -- / 12. H ow is productivity determined?RESPONSE:ANSWER: Productivity is determined by a country’s physical capital, human capital, natural resources and technological knowledge.POINTS: -- / 13. W hat is the World Bank and what are its functions?RESPONSE:ANSWER: The World Bank is an international organization that among other thingsencourages the flow of capital to poor countries. It obtains funds from the world’sadvance counties and loans them to less developed countries so that they caninvest in capital infrastructure. The World Bank offers advice to developingcountries on how the funds might best be used.POINTS: -- / 14. W hat are property rights? What role does property rights play in economic growth?RESPONSE:ANSWER: Property rights refer to the ability of people to exercise authority over the resources they own. There must be an economy-wide respect for property rights for the pricesystem or the free market to work. Lack of respect for property rights or theenforcement of property rights would not only cause political instability but wouldalso discourage savings and investment. These are necessary for economicgrowth.POINTS: -- / 15. D ifferentiate between inward-oriented policies and outward-oriented policies.RESPONSE:ANSWER: Inward-oriented policies are aimed at raising productivity and living standards withina county by avoiding interaction with the rest of the world. This approach involvesthe protection of domestic industries to allow them to develop and grow withoutcompetition from foreign firms. Outward-oriented policies are designed to integratecountries into the world economy as international trade is considered to be a factorin generating economic growth.POINTS: -- / 1CHAPTER 26: SAVING, INVESTMENT, AND THE FINANCIAL SYSTEMTrue/FalseIndicate whether the statement is true or false.1. P rivate savings are the tax revenue that the government has left after paying for its spending; andpublic savings is the income that households have left after paying for taxes and consumption.ANSWER: FPOINTS: 0 / 12. A budget deficit is an excess of tax revenue over government spending; and a budget surplus is ashortfall of tax revenue from government spending.ANSWER: FPOINTS: 0 / 13. A budget surplus decreases the supply of loanable funds, increases the interest rate, andstimulates investment.ANSWER: FPOINTS: 0 / 14. T he financial system is the group of institutions in the economy that help to match one person’ssavings with another person’s investment.ANSWER: TPOINTS: 0 / 15. A mutual fund is an institution that sells shares to the public and uses the proceeds to buy aselection, or portfolio, of various types of stocks, bonds, or both stocks and bonds.ANSWER: TPOINTS: 0 / 1Multiple ChoiceIdentify the choice that best completes the statement or answers the question.1. W hich of the following is correct?a. Lenders buy bonds and borrowers sell them.b. Long-term bonds usually pay a lower interest rate than do short-term bonds becauselong-term bonds are riskier.c. Junk bonds refer to bonds that have been resold many times.d. None of the above are correct.ANSWER: APOINTS: 0 / 12. I n a closed economy, national saving equalsa. investment.b. income minus the sum of consumption and government expenditures.c. private saving plus public saving.d. All of the above are correct.ANSWER: DPOINTS: 0 / 13. I f the current market interest rate for loanable funds is below the equilibrium level, then there is aa. shortage of loanable funds and the interest rate will rise.b. surplus of loanable funds and the interest rate will rise.c. shortage of loanable funds and the interest rate will fall.d. surplus of loanable funds and the interest rate will fall.ANSWER: APOINTS: 0 / 14. S uppose that Parliament were to introduce a new investment tax credit. What would happen in themarket for loanable funds?a. The demand for loanable funds would shift left and interest rates fall.b. The demand for loanable funds would shift right and interest rates rise.c. The supply of loanable funds would shift left and interest rates rise.d. The supply of loanable funds would shift right and interest rates fall.ANSWER: BPOINTS: 0 / 15. I f Canada increases its budget deficit, it will reducea. private saving and so shift the supply of loanable funds left.b. investment and so shift the demand for loanable funds left.c. public saving and so shift the supply of loanable funds left.d. None of the above are correct.ANSWER: CPOINTS: 0 / 16. C rowding out refers toa. the increase in national saving that occurs when government runs a deficitb. the decrease in the real interest rates due to government borrowingc. a reduction in investment spending resulting from government borrowingd. a decrease in consumption spending resulting from government borrowingANSWER: CPOINTS: 0 / 17. F or a bank to be profitable, the loans it makes must _____ than the _____ obtaining funds.a. cost more; price ofb. pay less interest; total revenue fromc. make more interest; total cost ofd. be less profitable; total revenue fromANSWER: CPOINTS: 0 / 18. L arge budget deficits will likelya. increase the nation's pool of savingb. decrease the nation's pool of savingc. have no impact on the nation's pool of savingd. improve the nation's trade balanceANSWER: BPOINTS: 0 / 19. T he supply curve of loanable funds isa. upward-sloping, reflecting the fact that savers need a higher rate of interest to coax theminto lending moreb. downward-sloping, reflecting the fact that savers will increase their supply for loanablefunds at lower rates of interestc. upward-sloping, reflecting the fact that savers will increase their saving at lower rates ofinterestd. None of the aboveANSWER: APOINTS: 0 / 1。

Answers to Textbook Questions and ProblemsCHAPTER 9 Economic Growth II: Technology, Empirics, and PolicyQuestions for Review1. In the Solow model, we find that only technological progress can affect the steady-state rate of growthin income per worker. Growth in the capital stock (through high saving) has no effect on the steady-state growth rate of income per worker; neither does population growth. But technological progress can lead to sustained growth.2. In the steady state, output per person in the Solow model grows at the rate of technological progress g.Capital per person also grows at rate g. Note that this implies that output and capital per effectiveworker are constant in steady state. In the U.S. data, output and capital per worker have both grown at about 2 percent per year for the past half-century.3. To decide whether an economy has more or less capital than the Golden Rule, we need to compare themarginal product of capital net of depreciation (MPK –δ) with the growth rate of total output (n + g).The growth rate of GDP is readily available. Estimating the net marginal product of capital requires a little more work but, as shown in the text, can be backed out of available data on the capital stock relative to GDP, the total amount o f depreciation relative to GDP, and capital’s share in GDP.4. Economic policy can influence the saving rate by either increasing public saving or providingincentives to stimulate private saving. Public saving is the difference between government revenue and government spending. If spending exceeds revenue, the government runs a budget deficit, which is negative saving. Policies that decrease the deficit (such as reductions in government purchases or increases in taxes) increase public saving, whereas policies that increase the deficit decrease saving. A variety of government policies affect private saving. The decision by a household to save may depend on the rate of return; the greater the return to saving, the more attractive saving becomes. Taxincentives such as tax-exempt retirement accounts for individuals and investment tax credits forcorporations increase the rate of return and encourage private saving.5. The legal system is an example of an institutional difference between countries that might explaindifferences in income per person. Countries that have adopted the English style common law system tend to have better developed capital markets, and this leads to more rapid growth because it is easier for businesses to obtain financing. The quality of government is also important. Countries with more government corruption tend to have lower levels of income per person.6. Endogenous growth theories attempt to explain the rate of technological progress by explaining thedecisions that determine the creation of knowledge through research and development. By contrast, the Solow model simply took this rate as exogenous. In the Solow model, the saving rate affects growth temporarily, but diminishing returns to capital eventually force the economy to approach a steady state in which growth depends only on exogenous technological progress. By contrast, many endogenous growth models in essence assume that there are constant (rather than diminishing) returns to capital, interpreted to include knowledge. Hence, changes in the saving rate can lead to persistent growth. Problems and Applications1. a. In the Solow model with technological progress, y is defined as output per effective worker, and kis defined as capital per effective worker. The number of effective workers is defined as L E (or LE), where L is the number of workers, and E measures the efficiency of each worker. To findoutput per effective worker y, divide total output by the number of effective workers:Y LE =K12(LE)12LEY LE =K12L12E12LEY LE =K12 L1E1Y LE =KLE æèççöø÷÷12y=k12b. To solve for the steady-state value of y as a function of s, n, g, and δ, we begin with the equationfor the change in the capital stock in the steady state:Δk = sf(k) –(δ + n + g)k = 0.The production function ycan also be rewritten as y2 = k. Plugging this production functioninto the equation for the change in the capital stock, we find that in the steady state:sy –(δ + n + g)y2 = 0.Solving this, we find the steady-state value of y:y* = s/(δ + n + g).c. The question provides us with the following information about each country:Atlantis: s = 0.28 Xanadu: s = 0.10n = 0.01 n = 0.04g = 0.02 g = 0.02δ = 0.04δ = 0.04Using the equation for y* that we derived in part (a), we can calculate the steady-state values of yfor each country.Developed country: y* = 0.28/(0.04 + 0.01 + 0.02) = 4Less-developed country: y* = 0.10/(0.04 + 0.04 + 0.02) = 12. a. In the steady state, capital per effective worker is constant, and this leads to a constant level ofoutput per effective worker. Given that the growth rate of output per effective worker is zero, this means the growth rate of output is equal to the growth rate of effective workers (LE). We know labor grows at the rate of population growth n and the efficiency of labor (E) grows at rate g. Therefore, output grows at rate n+g. Given output grows at rate n+g and labor grows at rate n, output perworker must grow at rate g. This follows from the rule that the growth rate of Y/L is equal to thegrowth rate of Y minus the growth rate of L.b. First find the output per effective worker production function by dividing both sides of theproduction function by the number of effective workers LE:Y LE =K 13(LE )23LE YLE =K 13L 23E 23LEY LE =K 13L 13E 13Y LE =K LE æèçöø÷13y =k 13To solve for capital per effective worker, we start with the steady state condition:Δk = sf (k ) – (δ + n + g )k = 0.Now substitute in the given parameter values and solve for capital per effective worker (k ):Substitute the value for k back into the per effective worker production function to find output per effective worker is equal to 2. The marginal product of capital is given bySubstitute the value for capital per effective worker to find the marginal product of capital is equal to 1/12.c. According to the Golden Rule, the marginal product of capital is equal to (δ + n + g) or 0.06. In the current steady state, the marginal product of capital is equal to 1/12 or 0.083. Therefore, we have less capital per effective worker in comparison to the Golden Rule. As the level of capital per effective worker rises, the marginal product of capital will fall until it is equal to 0.06. To increase capital per effective worker, there must be an increase in the saving rate.d. During the transition to the Golden Rule steady state, the growth rate of output per worker will increase. In the steady state, output per worker grows at rate g . The increase in the saving rate will increase output per effective worker, and this will increase output per effective worker. In the new steady state, output per effective worker is constant at a new higher level, and output per worker is growing at rate g . During the transition, the growth rate of output per worker jumps up, and then transitions back down to rate g .3. To solve this problem, it is useful to establish what we know about the U.S. economy: • A Cobb –Douglas production function has the form y = k α, where α is capital’s share of income.The question tells us that α = 0.3, so we know that the production function is y = k 0.3.• In the steady state, we know that the growth rate of output equals 3 percent, so we know that (n +g ) = 0.03.• The deprec iation rate δ = 0.04. • The capital –output ratio K/Y = 2.5. Because k/y = [K /(LE )]/[Y /(LE )] = K/Y , we also know that k/y =2.5. (That is, the capital –output ratio is the same in terms of effective workers as it is in levels.)a. Begin with the steady-state condition, sy = (δ + n + g)k. Rewriting this equation leads to a formulafor saving in the steady state:s = (δ + n + g)(k/y).Plugging in the values established above:s = (0.04 + 0.03)(2.5) = 0.175.The initial saving rate is 17.5 percent.b. We know from Chapter 3 that with a Cobb–Douglas production function, capital’s share ofincome α = MPK(K/Y). Rewriting, we haveMPK = α/(K/Y).Plugging in the values established above, we findMPK = 0.3/2.5 = 0.12.c. We know that at the Golden Rule steady state:MPK = (n + g + δ).Plugging in the values established above:MPK = (0.03 + 0.04) = 0.07.At the Golden Rule steady state, the marginal product of capital is 7 percent, whereas it is 12 percent in the initial steady state. Hence, from the initial steady state we need to increase k to achieve the Golden Rule steady state.d. We know from Chapter 3 that for a Cobb–Douglas production function, MPK = α (Y/K). Solvingthis for the capital–output ratio, we findK/Y = α/MPK.We can solve for the Golden Rule capital–output ratio using this equation. If we plug in the value0.07 for the Golden Rule steady-state marginal product of capital, and the value 0.3 for α, we findK/Y = 0.3/0.07 = 4.29.In the Golden Rule steady state, the capital–output ratio equals 4.29, compared to the current capital–output ratio of 2.5.e. We know from part (a) that in the steady states = (δ + n + g)(k/y),where k/y is the steady-state capital–output ratio. In the introduction to this answer, we showed that k/y = K/Y, and in part (d) we found that the Golden Rule K/Y = 4.29. Plugging in this value and those established above:s = (0.04 + 0.03)(4.29) = 0.30.To reach the Golden Rule steady state, the saving rate must rise from 17.5 to 30 percent. Thisresult implies that if we set the saving rate equal to the share going to capital (30 percent), we will achieve the Golden Rule steady state.4. a. In the steady state, we know that sy = (δ + n + g)k. This implies thatk/y = s/(δ + n + g).Since s, δ, n, and g are constant, this means that the ratio k/y is also constant. Since k/y =[K/(LE)]/[Y/(LE)] = K/Y, we can conclude that in the steady state, the capital–output ratio isconstant.b. We know that capital’s share of income = MPK ⨯ (K/Y). In the steady state, we know from part (a)that the capital–output ratio K/Y is constant. We also know from the hint that the MPK is afunction of k, which is constant in the steady state; therefore the MPK itself must be constant.Thus, capital’s share of income is constant. Labor’s share of income is 1 – [C apital’s Share].Hence, if capital’s share is constant, we see that labor’s share of income is also constant.c. We know that in the steady state, total income grows at n + g, defined as the rate of populationgrowth plus the rate of technological change. In part (b) we showed that labor’s and capital’s share of income is constant. If the shares are constant, and total income grows at the rate n + g, thenlabor income and capital income must also grow at the rate n + g.d. Define the real rental price of capital R asR = Total Capital Income/Capital Stock= (MPK ⨯K)/K= MPK.We know that in the steady state, the MPK is constant because capital per effective worker k isconstant. Therefore, we can conclude that the real rental price of capital is constant in the steadystate.To show that the real wage w grows at the rate of technological progress g, defineTLI = Total Labor IncomeL = Labor ForceUsing the hint that the real wage equals total labor income divided by the labor force:w = TLI/L.Equivalently,wL = TLI.In terms of percentage changes, we can write this asΔw/w + ΔL/L = ΔTLI/TLI.This equation says that the growth rate of the real wage plus the growth rate of the labor forceequals the growth rate of total labor income. We know that the labor force grows at rate n, and,from part (c), we know that total labor income grows at rate n + g. We, therefore, conclude that the real wage grows at rate g.5. a. The per worker production function is F (K, L )/L = AK α L 1–α/L = A (K/L )α = Ak α b. In the steady state, Δk = sf (k ) – (δ + n + g )k = 0. Hence, sAk α = (δ + n + g )k , or, after rearranging:k *=sA d +n +g éëêêùûúúa 1-a æèççöø÷÷.Plugging into the per-worker production function from part (a) givesy *=A a 1-a æèççöø÷÷s d +n +g éëêêùûúúa 1-a æèççöø÷÷.Thus, the ratio of steady-state income per worker in Richland to Poorland isy *Richland/y *Poorland ()=s Richland d +n Richland +g /s Poorlandd +n Poorland +g éëêêùûúúa1-a =0.320.05+0.01+0.02/0.100.05+0.03+0.02éëêêùûúúa1-c. If α equals 1/3, then Richland should be 41/2, or two times, richer than Poorland.d. If 4a 1-a æèççöø÷÷= 16, then it must be the case that a 1-a æèççöø÷÷, which in turn requires that α equals 2/3.Hence, if the Cobb –Douglas production function puts 2/3 of the weight on capital and only 1/3 on labor, then we can explain a 16-fold difference in levels of income per worker. One way to justify this might be to think about capital more broadly to include human capital —which must also be accumulated through investment, much in the way one accumulates physical capital.6. How do differences in education across countries affect the Solow model? Education is one factoraffecting the efficiency of labor , which we denoted by E . (Other factors affecting the efficiency of labor include levels of health, skill, and knowledge.) Since country 1 has a more highly educated labor force than country 2, each worker in country 1 is more efficient. That is, E 1 > E 2. We will assume that both countries are in steady state. a. In the Solow growth model, the rate of growth of total income is equal to n + g , which isindependent of the work force’s level of education. The two countries will, thus, have the same rate of growth of total income because they have the same rate of population growth and the same rate of technological progress.b. Because both countries have the same saving rate, the same population growth rate, and the samerate of technological progress, we know that the two countries will converge to the same steady-state level of capital per effective worker k *. This is shown in Figure 9-1.Hence, output per effective worker in the steady state, which is y* = f(k*), is the same in bothcountries. But y* = Y/(L E) or Y/L = y*E. We know that y* will be the same in both countries, but that E1 > E2. Therefore, y*E1 > y*E2. This implies that (Y/L)1 > (Y/L)2. Thus, the level of incomeper worker will be higher in the country with the more educated labor force.c. We know that the real rental price of capital R equals the marginal product of capital (MPK). Butthe MPK depends on the capital stock per efficiency unit of labor. In the steady state, bothcountries have k*1= k*2= k* because both countries have the same saving rate, the same population growth rate, and the same rate of technological progress. Therefore, it must be true that R1 = R2 = MPK. Thus, the real rental price of capital is identical in both countries.d. Output is divided between capital income and labor income. Therefore, the wage per effectiveworker can be expressed asw = f(k) –MPK • k.As discussed in parts (b) and (c), both countries have the same steady-state capital stock k and the same MPK. Therefore, the wage per effective worker in the two countries is equal.Workers, however, care about the wage per unit of labor, not the wage per effective worker.Also, we can observe the wage per unit of labor but not the wage per effective worker. The wageper unit of labor is related to the wage per effective worker by the equationWage per Unit of L = wE.Thus, the wage per unit of labor is higher in the country with the more educated labor force.7. a. In the two-sector endogenous growth model in the text, the production function for manufacturedgoods isY = F [K,(1 –u) EL].We assumed in this model that this function has constant returns to scale. As in Section 3-1,constant returns means that for any positive number z, zY = F(zK, z(1 –u) EL). Setting z = 1/EL,we obtainY EL =FKEL,(1-u)æèççöø÷÷.Using our standard definitions of y as output per effective worker and k as capital per effective worker, we can write this asy = F[k,(1 –u)]b. To begin, note that from the production function in research universities, the growth rate of laborefficiency, ΔE/E, equals g(u). We can now follow the logic of Section 9-1, substituting thefunction g(u) for the constant growth rate g. In order to keep capital per effective worker (K/EL) constant, break-even investment includes three terms: δk is needed to replace depreciating capital, nk is needed to provide capital for new workers, and g(u) is needed to provide capital for thegreater stock of knowledge E created by research universities. That is, break-even investment is [δ + n + g(u)]k.c. Again following the logic of Section 9-1, the growth of capital per effective worker is thedifference between saving per effective worker and break-even investment per effective worker.We now substitute the per-effective-worker production function from part (a) and the function g(u) for the constant growth rate g, to obtainΔk = sF [k,(1 –u)] – [δ + n + g(u)]kIn the steady state, Δk = 0, so we can rewrite the equation above assF [k,(1 –u)] = [δ + n + g(u)]k.As in our analysis of the Solow model, for a given value of u, we can plot the left and right sides of this equationThe steady state is given by the intersection of the two curves.d. The steady state has constant capital per effective worker k as given by Figure 9-2 above. We alsoassume that in the steady state, there is a constant share of time spent in research universities, so u is constant. (After all, if u were not constant, it wouldn’t be a ―steady‖ state!). Hence, output per effective worker y is also constant. Output per worker equals yE, and E grows at rate g(u).Therefore, output per worker grows at rate g(u). The saving rate does not affect this growth rate.However, the amount of time spent in research universities does affect this rate: as more time is spent in research universities, the steady-state growth rate rises.e. An increase in u shifts both lines in our figure. Output per effective worker falls for any givenlevel of capital per effective worker, since less of each worker’s time is spent producingmanufactured goods. This is the immediate effect of the change, since at the time u rises, thecapital stock K and the efficiency of each worker E are constant. Since output per effective worker falls, the curve showing saving per effective worker shifts down.At the same time, the increase in time spent in research universities increases the growth rate of labor efficiency g(u). Hence, break-even investment [which we found above in part (b)] rises at any given level of k, so the line showing breakeven investment also shifts up.Figure 9-3 shows these shifts.In the new steady state, capital per effective worker falls from k1 to k2. Output per effective worker also falls.f. In the short run, the increase in u unambiguously decreases consumption. After all, we argued inpart (e) that the immediate effect is to decrease output, since workers spend less time producingmanufacturing goods and more time in research universities expanding the stock of knowledge.For a given saving rate, the decrease in output implies a decrease in consumption.The long-run steady-state effect is more subtle. We found in part (e) that output per effective worker falls in the steady state. But welfare depends on output (and consumption) per worker, not per effective worker. The increase in time spent in research universities implies that E grows faster.That is, output per worker equals yE. Although steady-state y falls, in the long run the fastergrowth rate of E necessarily dominates. That is, in the long run, consumption unambiguously rises.Nevertheless, because of the initial decline in consumption, the increase in u is not unambiguously a good thing. That is, a policymaker who cares more about current generationsthan about future generations may decide not to pursue a policy of increasing u. (This is analogous to the question considered in Chapter 8 of whether a policymaker should try to reach the GoldenRule level of capital per effective worker if k is currently below the Golden Rule level.)8. On the World Bank Web site (), click on the data tab and then the indicators tab.This brings up a large list of data indicators that allows you to compare the level of growth anddevelopment across countries. To explain differences in income per person across countries, you might look at gross saving as a percentage of GDP, gross capital formation as a percentage of GDP, literacy rate, life expectancy, and population growth rate. From the Solow model, we learned that (all else the same) a higher rate of saving will lead to higher income per person, a lower population growth rate will lead to higher income per person, a higher level of capital per worker will lead to a higher level of income per person, and more efficient or productive labor will lead to higher income per person. The selected data indicators offer explanations as to why one country might have a higher level of income per person. However, although we might speculate about which factor is most responsible for thedifference in income per person across countries, it is not possible to say for certain given the largenumber of other variables that also affect income per person. For example, some countries may have more developed capital markets, less government corruption, and better access to foreign directinvestment. The Solow model allows us to understand some of the reasons why income per person differs across countries, but given it is a simplified model, it cannot explain all of the reasons why income per person may differ.More Problems and Applications to Chapter 91. a. The growth in total output (Y) depends on the growth rates of labor (L), capital (K), and totalfactor productivity (A), as summarized by the equationΔY/Y = αΔK/K + (1 –α)ΔL/L + ΔA/A,where α is capital’s share of output. We can look at the effect on output of a 5-percent increase in labor by setting ΔK/K = ΔA/A = 0. Since α = 2/3, this gives usΔY/Y = (1/3)(5%)= 1.67%.A 5-percent increase in labor input increases output by 1.67 percent.Labor productivity is Y/L. We can write the growth rate in labor productivity asD Y Y =D(Y/L)Y/L-D LL.Substituting for the growth in output and the growth in labor, we findΔ(Y/L)/(Y/L) = 1.67% – 5.0%= –3.34%.Labor productivity falls by 3.34 percent.To find the change in total factor productivity, we use the equationΔA/A = ΔY/Y –αΔK/K – (1 –α)ΔL/L.For this problem, we findΔA/A = 1.67% – 0 – (1/3)(5%)= 0.Total factor productivity is the amount of output growth that remains after we have accounted for the determinants of growth that we can measure. In this case, there is no change in technology, so all of the output growth is attributable to measured input growth. That is, total factorproductivity growth is zero, as expected.b. Between years 1 and 2, the capital stock grows by 1/6, labor input grows by 1/3, and output growsby 1/6. We know that the growth in total factor productivity is given byΔA/A = ΔY/Y –αΔK/K – (1 –α)ΔL/L.Substituting the numbers above, and setting α = 2/3, we findΔA/A = (1/6) – (2/3)(1/6) – (1/3)(1/3)= 3/18 – 2/18 – 2/18= – 1/18= –0.056.Total factor productivity falls by 1/18, or approximately 5.6 percent.2. By definition, output Y equals labor productivity Y/L multiplied by the labor force L:Y = (Y/L)L.Using the mathematical trick in the hint, we can rewrite this asD Y Y =D(Y/L)Y/L+D LL.We can rearrange this asD Y Y =D YY-D LL.Substituting for ΔY/Y from the text, we findD(Y/L) Y/L =D AA+aD KK+(1-a)D LL-D LL =D AA+aD KK-aD LL=D AA+aD KK-D LLéëêêùûúúUsing the same trick we used above, we can express the term in brackets asΔK/K –ΔL/L = Δ(K/L)/(K/L)Making this substitution in the equation for labor productivity growth, we conclude thatD(Y/L) Y/L =D AA+aD(K/L)K/L.3. We know the following:ΔY/Y = n + g = 3.6%ΔK/K = n + g = 3.6%ΔL/L = n = 1.8%Capital’s Share = α = 1/3Labor’s Share = 1 –α = 2/3Using these facts, we can easily find the contributions of each of the factors, and then find the contribution of total factor productivity growth, using the following equations:Output = Capital’s+ Labor’s+ Total FactorGrowth Contribution Contribution ProductivityD Y Y =aD KK+(1-a)D LL+D AA3.6% = (1/3)(3.6%) + (2/3)(1.8%) + ΔA/A.We can easily solve this for ΔA/A, to find that3.6% = 1.2% + 1.2% + 1.2%Chapter 9—Economic Growth II: Technology, Empirics, and Policy 81We conclude that the contribution of capital is 1.2 percent per year, the contribution of labor is 1.2 percent per year, and the contribution of total factor productivity growth is 1.2 percent per year. These numbers match the ones in Table 9-3 in the text for the United States from 1948–2002.Chapter 9—Economic Growth II: Technology, Empirics, and Policy 82。

Chapter 26Problems and Applicat ions1. a. The bond of an eastern European government would pay a higher interest ratethan the bond of the U.S. government because there would be a greater risk ofdefault.b. A bond that repays the principal in 2025 would pay a higher interest rate thana bond that repays the principal in 2005 because it has a longer term tomaturity, so there is more risk to the principal.c. A bond from a software compa ny you run in your garage would pay a higherinterest rate than a bond from Coca-Cola because your software company hasmore credit risk.d. A bond issued by the federal government would pay a higher interest rate thana bond issued by New York State because an investor does not have to payfederal income tax on the bond from New York state.2. The stock market does have a social purpose. Firms obtain funds for investment byissuing new stock. People are more likely to buy that stock because there are organized stock markets, so people know that they can sell their stock if they want to.3. When the Russian government defaulted on its debt, investors perceived a higherchance of default (than they had before) on similar bonds sold by other developingcountries. Thus, the supply of loanable funds shifted to the left, as shown in Figure 1.The result was an increase in the interest rate.Figure 14. Companies encourage their employees to hold stock in the company because it givesthe employees the incentive to care about the firm’s profits, not just their own salary.Then, if employees see waste or see areas in which the firm can improve, they will take actions that benefit the company because they know the value of their stock will rise asa result. It also gives employees an additional incentive to work hard, knowing that ifthe firm does well, they will profit.But from an employee’s point of view, owning stock in the company for which she or he works can be risky. The emp loyee’s wages or salary is already tied to how well the firm performs. If the firm has trouble, the employee could be laid off or have her or hissalary reduced. If the employee owns stock in the firm, then there is a doublewhammy−the employee is unemployed or gets a lower salary and the value of thestock falls as well. So owning stock in your own company is a very risky proposition.Most employees would be better off diversifying−owning stock or bonds in othercompanies−so their fortunes would not depend so much on the firm for which theywork.5. To a macroeconomist, saving occurs when a person’s income exceeds his consumption,while investment occurs when a person or firm purchases new capital, such as a house or business equipment.a. When your family takes out a mortgage and buys a new house, that isinvestment because it is a purchase of new capital.b. When you use your $200 paycheck to buy stock in AT&T, that is savingbecause your income of $200 is not being spent on consumption goods.c. When your roommate earns $100 and deposits it in her account at a bank, thatis saving because the money is not spent on consumption goods.d. When you borrow $1,000 from a bank to buy a car to use in your pizza-deliverybusiness, that is investment because the car is a capital good.6. Given that Y = 8, T = 1.5, S priv ate = 0.5 = Y −T − C, S public = 0.2 = T − G.Because S private = Y − T − C, then rearranging gives C = Y − T −S private= 8 − 1.5 − 0.5 = 6.Because S public = T − G, then rearranging gives G = T − S public= 1.5 − 0.2 = 1.3.Because S = national saving = S priv ate + S public = 0.5 + 0.2 = 0.7.Finally, because I = investment = S, I = 0.7.7. a. If interest rates increase, the costs of borrowing money to build the factorybecome higher, so the returns from building the new plant may not besufficient to cover the costs. Thus, higher interest rates make it less likely thatIntel will build the new factory.b. Even if Intel uses its own funds to finance the factory, the rise in interest ratesstill matters. There is an opportunity cost on the use of the funds. Instead ofinvesting in the factory, Intel could invest the money in the bond market toearn the higher interest rate available there. Intel will compare its potentialreturns from building the factory to the potential returns from the bond market.If interest rates rise, so that bond market returns rise, Intel is again less likelyto invest in the factory.Figure 28. a. Figure 2 illustrates the effect of the $20 billion increase in governmentborrowing. Initially, the supply of loanable funds is curve S1, the equilibriumreal interest rate is i1, and the quantity of loanable funds is L1. The increase ingovernment borrowing by $20 billion reduces the supply of loanable funds ateach interest rate by $20 billion, so the new supply curve, S2, is shown by ashift to the left of S1 by exactly $20 billion. As a result of the shift, the newequilibrium real interest rate is i2. The interest rate has increased as a result ofthe increase in government borrowing.b. Because the interest rate has increased, investment and national savingdecline and private saving increases. The increase in government borrowingreduces public saving. From the figure you can see that total loanable funds(and thus both investment and national saving) decline by less than $20 billion,while public saving declines by $20 billion and private saving rises by less than$20 billion.c. The more elastic is the supply of loanable funds, the flatter the supply curvewould be, so the interest rate would rise by less and thus national saving would fall by less, as Figure 3 shows.Figure 3Figure 4d. The more elastic the demand for loanable funds, the flatter the demand curvewould be, so the interest rate would rise by less and thus national saving would fall by more, as Figure 4 shows.e. If households believe that greater government borrowing today implies highertaxes to pay off the government debt in the future, then people will save more so they can pay the higher future taxes. Thus, private saving will increase, aswill the supply of loanable funds. This will offset the reduction in public saving, thus reducing the amount by which the equilibrium quantity of investment andnational saving decline, and reducing the amount that the interest rate rises.If the rise in private saving was exactly equal to the increase in governmentborrowing, there would be no shift in the national saving curve, so investment,national saving, and the interest rate would all be unchanged. This is the caseof Ricardian equivalence.9. Because new computer technology enables firms to reduce inventory investment, thedemand curve for loanable funds shifts to the left, as shown in Figure 5. As a result, the equilibrium quantity of loanable funds declines, as does the interest rate. The decline in the interest rate then increases investment in factories and equipment, but overallinvestment still declines.Figure 510. If world savings declines at the same time world investment rises, the supply curve ofloanable funds shifts to the le ft and the demand curve shifts to the right. Figure 6illustrates the result. The world interest rate will rise, while the overall effect on theequilibrium quantity of loanable funds is ambiguous it depends on the relative sizes of the shifts of the two curves and on their elasticities.Figure 611. a. Investment can be increased by reducing taxes on private saving or byreducing the government budget deficit. But reducing taxes on private savinghas the effect of increasing the government budget deficit, unless some othertaxes are increased or government spending is reduced. So it is difficult toengage in both policies at the same time.b. To know which of these policies would be a more effective way to raiseinvestment, you would need to know: (1) what the elasticity of private savingis with respect to the after-tax real interest rate, because that would determinehow much private saving would increase if you reduced taxes on saving; (2)how private saving responds to changes in the government budget deficit,because, for example, if Ricardian equivalence holds, the decline in thegovernment budget deficit would be matched by an equal decline in privatesaving, so national saving would not increase at all; and (3) how elasticinvestment is with respect to the interest rate, because if investment is quiteinelastic, neither policy will have much of an impact on investment.。

【最新整理,下载后即可编辑】Answers to Textbook Questions and ProblemsCHAPTER 9 Economic Growth II: Technology, Empirics, and Policy Questions for Review1. In the Solow model, we find that only technological progress canaffect the steady-state rate of growth in income per worker. Growth in the capital stock (through high saving) has no effect on the steady-state growth rate of income per worker; neither does population growth.But technological progress can lead to sustained growth.2. In the steady state, output per person in the Solow model grows at the rate of technological progress g. Capital per person also grows at rate g. Note that this implies that output and capital per effective worker are constant in steady state. In the U.S. data, output and capital per worker have both grown at about 2 percent per year for the past half-century.3. To decide whether an economy has more or less capital than theGolden Rule, we need to compare the marginal product of capital net of depreciation (MPK –δ) with the growt h rate of total output (n + g). The growth rate of GDP is readily available. Estimating the netmarginal product of capital requires a little more work but, as shown in the text, can be backed out of available data on the capital stockrelative to GDP, the total amount of depreciation relative to GDP, and capital’s share in GDP.4. Economic policy can influence the saving rate by either increasingpublic saving or providing incentives to stimulate private saving. Public saving is the difference between government revenue and government spending. If spending exceeds revenue, the government runs a budget deficit, which is negative saving. Policies that decrease the deficit (such as reductions in government purchases or increases in taxes) increase public saving, whereas policies that increase the deficit decrease saving.A variety of government policies affect private saving. The decision bya household to save may depend on the rate of return; the greater thereturn to saving, the more attractive saving becomes. Tax incentives such as tax-exempt retirement accounts for individuals and investment tax credits for corporations increase the rate of return and encourage private saving.5. The legal system is an example of an institutional difference betweencountries that might explain differences in income per person.Countries that have adopted the English style common law systemtend to have better developed capital markets, and this leads to more rapid growth because it is easier for businesses to obtain financing. The quality of government is also important. Countries with moregovernment corruption tend to have lower levels of income per person.6. Endogenous growth theories attempt to explain the rate oftechnological progress by explaining the decisions that determine the creation of knowledge through research and development. By contrast, the Solow model simply took this rate as exogenous. In the Solowmodel, the saving rate affects growth temporarily, but diminishingreturns to capital eventually force the economy to approach a steady state in which growth depends only on exogenous technologicalprogress. By contrast, many endogenous growth models in essenceassume that there are constant (rather than diminishing) returns tocapital, interpreted to include knowledge. Hence, changes in the saving rate can lead to persistent growth.Problems and Applications1. a. In the Solow model with technological progress, y is defined asoutput per effective worker, and k is defined as capital per effective worker. The number of effective workers is defined as L E (orLE), where L is the number of workers, and E measures theefficiency of each worker. To find output per effective worker y,divide total output by the number of effective workers:Y LE =K12(LE)12LEY LE =K12L12E12LEY LE =K12 L12E12Y LE =KLE æèççöø÷÷12y=k1b. To solve for the steady-state value of y as a function of s, n, g, andδ, we begin with the equation for the change in the capital stock in the steady state:Δk = sf(k) –(δ + n + g)k = 0.The production function ycan also be rewritten as y2 = k.Plugging this production function into the equation for the changein the capital stock, we find that in the steady state:sy –(δ + n + g)y2 = 0.Solving this, we find the steady-state value of y:y* = s/(δ + n + g).c. The question provides us with the following information about each country:Atlantis: s = 0.28 Xanadu: s = 0.10n = 0.01 n = 0.04g = 0.02 g = 0.02δ = 0.04δ = 0.04Using the equation for y* that we derived in part (a), we cancalculate the steady-state values of y for each country.Developed country: y* = 0.28/(0.04 + 0.01 + 0.02) = 4Less-developed country: y* = 0.10/(0.04 + 0.04 + 0.02) = 1 2. a. In the steady state, capital per effective worker is constant, and thisleads to a constant level of output per effective worker. Given that the growth rate of output per effective worker is zero, this means the growth rate of output is equal to the growth rate of effective workers (LE). We know labor grows at the rate of population growth n and the efficiency of labor (E) grows at rate g. Therefore, output grows at rate n+g. Given output grows at rate n+g and labor grows at rate n,output per worker must grow at rate g. This follows from the rule that the growth rate of Y/L is equal to the growth rate of Y minus the growth rate of L.b. First find the output per effective worker production function by dividing both sides of the production function by the number of effective workers LE:Y LE =K13(LE)23LEYLE=K13L23E23LEYLE=K13L13E13YLE=KLEæèçöø÷13y=k13To solve for capital per effective worker, we start with the steady state condition:Δk = sf(k) –(δ + n + g)k = 0.Now substitute in the given parameter values and solve for capital per effective worker (k):Substitute the value for k back into the per effective workerproduction function to find output per effective worker is equal to2. The marginal product of capital is given bySubstitute the value for capital per effective worker to find themarginal product of capital is equal to 1/12.c. According to the Golden Rule, the marginal product of capital isequal to (δ + n + g) or 0.06. In the current steady state, the marginal product of capital is equal to 1/12 or 0.083. Therefore, we have less capital per effective worker in comparison to the Golden Rule. Asthe level of capital per effective worker rises, the marginal product of capital will fall until it is equal to 0.06. To increase capital pereffective worker, there must be an increase in the saving rate.d. During the transition to the Golden Rule steady state, the growth rateof output per worker will increase. In the steady state, output perworker grows at rate g. The increase in the saving rate will increaseoutput per effective worker, and this will increase output pereffective worker. In the new steady state, output per effective worker is constant at a new higher level, and output per worker is growing at rate g. During the transition, the growth rate of output per workerjumps up, and then transitions back down to rate g.3. To solve this problem, it is useful to establish what we know about the U.S. economy:• A Cobb–Douglas production function has the form y = kα, where α is capital’s share of income. The question tells us that α = 0.3,so we know that the production function is y = k0.3.•In the steady state, we know that the growth rate of output equals 3 percent, so we know that (n + g) = 0.03.•The deprec iation rate δ = 0.04.•The capital–output ratio K/Y = 2.5. Because k/y =[K/(LE)]/[Y/(LE)] = K/Y, we also know that k/y = 2.5. (That is, the capital–output ratio is the same in terms of effective workers as it is in levels.)a. Begin with the steady-state condition, sy = (δ + n + g)k. Rewritingthis equation leads to a formula for saving in the steady state:s = (δ + n + g)(k/y).Plugging in the values established above:s = (0.04 + 0.03)(2.5) = 0.175.The initial saving rate is 17.5 percent.b. We know from Chapter 3 that with a Cobb–Douglas production function, capital’s share of income α = MPK(K/Y). Rewriting, we haveMPK = α/(K/Y).Plugging in the values established above, we findMPK = 0.3/2.5 = 0.12.c. We know that at the Golden Rule steady state:MPK = (n + g + δ).Plugging in the values established above:MPK = (0.03 + 0.04) = 0.07.At the Golden Rule steady state, the marginal product of capital is 7 percent, whereas it is 12 percent in the initial steady state. Hence, from the initial steady state we need to increase k to achieve theGolden Rule steady state.d. We know from Chapter 3 that for a Cobb–Douglas production function, MPK = α (Y/K). Solving this for the capital–outputratio, we findK/Y = α/MPK.We can solve for the Golden Rule capital–output ratio using this equation. If we plug in the value 0.07 for the Golden Rule steady-state marginal product of capital, and the value 0.3 for α, we findK/Y = 0.3/0.07 = 4.29.In the Golden Rule steady state, the capital–output ratio equals4.29, compared to the current capital–output ratio of 2.5.e. We know from part (a) that in the steady states = (δ + n + g)(k/y),where k/y is the steady-state capital–output ratio. In theintroduction to this answer, we showed that k/y = K/Y, and in part(d) we found that the Golden Rule K/Y = 4.29. Plugging in thisvalue and those established above:s = (0.04 + 0.03)(4.29) = 0.30.To reach the Golden Rule steady state, the saving rate must risefrom 17.5 to 30 percent. This result implies that if we set the saving rate equal to the share going to capital (30 percent), we will achieve the Golden Rule steady state.4. a. In the steady state, we know that sy = (δ + n + g)k. This implies thatk/y = s/(δ + n + g).Since s, δ, n, and g are constant, this means that the ratio k/y is also constant. Since k/y = [K/(LE)]/[Y/(LE)] = K/Y, we can conclude that in the steady state, the capital–output ratio is constant.b. We know that capital’s share of income = MPK (K/Y). In thesteady state, we know from part (a) that the capital–output ratioK/Y is constant. We also know from the hint that the MPK is afunction of k, which is constant in the steady state; therefore theMPK itself must be constant. Thus, capital’s share of income isconstant. Labor’s share of income is 1 – [C apital’s Share].Hence, if capital’s share is constant, we see that labor’s share of income is also constant.c. We know that in the steady state, total income grows at n + g,defined as the rate of population growth plus the rate oftechnological change. In part (b) we showed that labor’s andcapital’s share of income is constant. If the shares are constant,and total income grows at the rate n + g, then labor income andcapital income must also grow at the rate n + g.d. Define the real rental price of capital R asR = Total Capital Income/Capital Stock= (MPK K)/K= MPK.We know that in the steady state, the MPK is constant becausecapital per effective worker k is constant. Therefore, we canconclude that the real rental price of capital is constant in the steady state.To show that the real wage w grows at the rate of technological progress g, defineTLI = Total Labor IncomeL = Labor ForceUsing the hint that the real wage equals total labor income divided by the labor force:w = TLI/L.Equivalently,wL = TLI.In terms of percentage changes, we can write this asΔw/w + ΔL/L = ΔTLI/TLI.This equation says that the growth rate of the real wage plus thegrowth rate of the labor force equals the growth rate of total labor income. We know that the labor force grows at rate n, and, frompart (c), we know that total labor income grows at rate n + g. We, therefore, conclude that the real wage grows at rate g.5. a. The per worker production function isF(K, L)/L = AKαL1–α/L = A(K/L)α = Akαb. In the steady state, Δk = sf(k) –(δ + n + g)k = 0. Hence, sAkα = (δ + n + g)k, or, after rearranging:k*=sAd+n+géëêêùûúúa1-aæèççöø÷÷.Plugging into the per-worker production function from part (a) givesy *=A a 1-a æèççöø÷÷s d +n +g éëêêùûúúa 1-a æèççöø÷÷.Thus, the ratio of steady-state income per worker in Richland to Poorland isy *Richland /y *Poorland ()=s Richland d +n Richland +g /s Poorland d +n Poorland +g éëêêùûúúa 1-a=0.320.05+0.01+0.02/0.100.05+0.03+0.02éëêêùûúúa 1-ac. If α equals 1/3, then Richland should be 41/2, or two times, richer than Poorland.d. If 4a 1-æèççöø÷÷= 16, then it must be the case that a 1-a æèççöø÷÷, which in turnrequires that α equals 2/3. Hence, if the Cobb –Douglasproduction function puts 2/3 of the weight on capital and only 1/3 on labor, then we can explain a 16-fold difference in levels ofincome per worker. One way to justify this might be to think about capital more broadly to include human capital —which must also be accumulated through investment, much in the way one accumulates physical capital.6. How do differences in education across countries affect the Solowmodel? Education is one factor affecting the efficiency of labor , which we denoted by E . (Other factors affecting the efficiency of laborinclude levels of health, skill, and knowledge.) Since country 1 has amore highly educated labor force than country 2, each worker in country 1 is more efficient. That is, E1 > E2. We will assume that both countries are in steady state.a. In the Solow growth model, the rate of growth of total income is equal to n + g, which is independent of the work force’s level of education. The two countries will, thus, have the same rate ofgrowth of total income because they have the same rate ofpopulation growth and the same rate of technological progress. b. Because both countries have the same saving rate, the samepopulation growth rate, and the same rate of technological progress, we know that the two countries will converge to the same steady-state level of capital per effective worker k*. This is shown in Figure 9-1.Hence, output per effective worker in the steady state, which is y* = f(k*), is the same in both countries. But y* = Y/(L E) or Y/L = y* E. We know that y* will be the same in both countries, but that E1> E2. Therefore, y*E1 > y*E2. This implies that (Y/L)1 > (Y/L)2.Thus, the level of income per worker will be higher in the countrywith the more educated labor force.c. We know that the real rental price of capital R equals the marginalproduct of capital (MPK). But the MPK depends on the capitalstock per efficiency unit of labor. In the steady state, both countries have k*1= k*2= k* because both countries have the same saving rate, the same population growth rate, and the same rate of technological progress. Therefore, it must be true that R1 = R2 = MPK. Thus, the real rental price of capital is identical in both countries.d. Output is divided between capital income and labor income.Therefore, the wage per effective worker can be expressed asw = f(k) –MPK • k.As discussed in parts (b) and (c), both countries have the samesteady-state capital stock k and the same MPK. Therefore, the wage per effective worker in the two countries is equal.Workers, however, care about the wage per unit of labor, not the wage per effective worker. Also, we can observe the wage per unitof labor but not the wage per effective worker. The wage per unitof labor is related to the wage per effective worker by the equationWage per Unit of L = wE.Thus, the wage per unit of labor is higher in the country with the more educated labor force.7. a. In the two-sector endogenous growth model in the text, theproduction function for manufactured goods isY = F [K,(1 –u) EL].We assumed in this model that this function has constant returns to scale. As in Section 3-1, constant returns means that for anypositive number z, zY = F(zK, z(1 –u) EL). Setting z = 1/EL, we obtainY EL =FKEL,(1-u)æèççöø÷÷.Using our standard definitions of y as output per effective worker and k as capital per effective worker, we can write this asy = F[k,(1 –u)]b. To begin, note that from the production function in research universities, the growth rate of labor efficiency, ΔE/E, equals g(u).We can now follow the logic of Section 9-1, substituting the function g(u) for the constant growth rate g. In order to keep capital per effective worker (K/EL) constant, break-even investment includes three terms: δk is needed to replace depreciating capital, nk is needed to provide capital for new workers, and g(u) is needed to provide capital for the greater stock of knowledge E created by research universities. That is, break-even investment is [δ +n + g(u)]k.c. Again following the logic of Section 9-1, the growth of capital pereffective worker is the difference between saving per effectiveworker and break-even investment per effective worker. We now substitute the per-effective-worker production function from part (a) and the function g(u) for the constant growth rate g, to obtainΔk = sF [k,(1 –u)] – [δ + n + g(u)]kIn the steady state, Δk = 0, so we can rewrite the equation above assF [k,(1 –u)] = [δ + n + g(u)]k.As in our analysis of the Solow model, for a given value of u, we can plot the left and right sides of this equationThe steady state is given by the intersection of the two curves. d. The steady state has constant capital per effective worker k as givenby Figure 9-2 above. We also assume that in the steady state, there is a constant share of time spent in research universities, so u is constant. (After all, if u were not constant, it wouldn’t be a“steady” state!). Hence, output per effective worker y is also constant. Output per worker equals yE, and E grows at rate g(u). Therefore, output per worker grows at rate g(u). The saving ratedoes not affect this growth rate. However, the amount of timespent in research universities does affect this rate: as more time is spent in research universities, the steady-state growth rate rises.e. An increase in u shifts both lines in our figure. Output per effectiveworker falls for any given level of capital per effective worker, since less of each worker’s time is spent producing manufactured goods. This is the immediate effect of the change, since at the time u rises, the capital stock K and the efficiency of each worker E are constant.Since output per effective worker falls, the curve showing savingper effective worker shifts down.At the same time, the increase in time spent in research universities increases the growth rate of labor efficiency g(u). Hence, break-even investment [which we found above in part (b)] rises at any given level of k, so the line showing breakeven investment also shifts up.Figure 9-3 shows these shifts.In the new steady state, capital per effective worker falls from k1 to k2. Output per effective worker also falls.f. In the short run, the increase in u unambiguously decreasesconsumption. After all, we argued in part (e) that the immediateeffect is to decrease output, since workers spend less timeproducing manufacturing goods and more time in researchuniversities expanding the stock of knowledge. For a given saving rate, the decrease in output implies a decrease in consumption.The long-run steady-state effect is more subtle. We found in part(e) that output per effective worker falls in the steady state. But welfare depends on output (and consumption) per worker, not per effective worker. The increase in time spent in research universities implies that E grows faster. That is, output per worker equals yE. Although steady-state y falls, in the long run the faster growth rate of E necessarily dominates. That is, in the long run, consumption unambiguously rises.Nevertheless, because of the initial decline in consumption, theincrease in u is not unambiguously a good thing. That is, apolicymaker who cares more about current generations than aboutfuture generations may decide not to pursue a policy of increasing u.(This is analogous to the question considered in Chapter 8 ofwhether a policymaker should try to reach the Golden Rule level ofcapital per effective worker if k is currently below the Golden Rulelevel.)8. On the World Bank Web site (), click on the datatab and then the indicators tab. This brings up a large list of dataindicators that allows you to compare the level of growth anddevelopment across countries. To explain differences in income per person across countries, you might look at gross saving as a percentage of GDP, gross capital formation as a percentage of GDP, literacy rate, life expectancy, and population growth rate. From the Solow model, we learned that (all else the same) a higher rate of saving will lead to higher income per person, a lower population growth rate will lead to higher income per person, a higher level of capital per worker will lead to a higher level of income per person, and more efficient orproductive labor will lead to higher income per person. The selected data indicators offer explanations as to why one country might have a higher level of income per person. However, although we mightspeculate about which factor is most responsible for the difference in income per person across countries, it is not possible to say for certain given the large number of other variables that also affect income per person. For example, some countries may have more developed capital markets, less government corruption, and better access to foreigndirect investment. The Solow model allows us to understand some of the reasons why income per person differs across countries, but givenit is a simplified model, it cannot explain all of the reasons why income per person may differ.More Problems and Applications to Chapter 91. a. The growth in total output (Y) depends on the growth rates oflabor (L), capital (K), and total factor productivity (A), assummarized by the equationΔY/Y = αΔK/K + (1 –α)ΔL/L + ΔA/A, where α is capital’s share of output. We can look at the effect onoutput of a 5-percent increase in labor by setting ΔK/K = ΔA/A =0. Since α = 2/3, this gives usΔY/Y = (1/3)(5%)= 1.67%.A 5-percent increase in labor input increases output by 1.67 percent.Labor productivity is Y/L. We can write the growth rate in labor productivity asD Y Y =D(Y/L)Y/L-D LL.Substituting for the growth in output and the growth in labor, we findΔ(Y/L)/(Y/L) = 1.67% – 5.0%= –3.34%.Labor productivity falls by 3.34 percent.To find the change in total factor productivity, we use the equationΔA/A = ΔY/Y –αΔK/K – (1 –α)ΔL/L.For this problem, we findΔA/A = 1.67% – 0 – (1/3)(5%)= 0.Total factor productivity is the amount of output growth that remains after we have accounted for the determinants of growththat we can measure. In this case, there is no change in technology, so all of the output growth is attributable to measured input growth.That is, total factor productivity growth is zero, as expected.b. Between years 1 and 2, the capital stock grows by 1/6, labor inputgrows by 1/3, and output grows by 1/6. We know that the growthin total factor productivity is given byΔA/A = ΔY/Y –αΔK/K – (1 –α)ΔL/L.Substituting the numbers above, and setting α = 2/3, we findΔA/A = (1/6) – (2/3)(1/6) – (1/3)(1/3)= 3/18 – 2/18 – 2/18= – 1/18= –0.056.Total factor productivity falls by 1/18, or approximately 5.6 percent.2. By definition, output Y equals labor productivity Y/L multiplied by the labor force L:Y = (Y/L)L.Using the mathematical trick in the hint, we can rewrite this asD Y Y =D(Y/L)Y/L+D LL.We can rearrange this asD Y Y =D YY-D LL.Substituting for ΔY/Y from the text, we findD(Y/L) Y/L =D AA+aD KK+(1-a)D LL-D LL =D AA+aD KK-aD LL=D AA+aD KK-D LLéëêêùûúúUsing the same trick we used above, we can express the term in brackets asΔK/K –ΔL/L = Δ(K/L)/(K/L) Making this substitution in the equation for labor productivity growth, we conclude thatD(Y/L) Y/L =D AA+aD(K/L)K/L.3. We know the following:ΔY/Y = n + g = 3.6%ΔK/K = n + g = 3.6%ΔL/L = n = 1.8%Capital’s Share = α = 1/3Labor’s Share = 1 –α = 2/3Using these facts, we can easily find the contributions of each of the factors, and then find the contribution of total factor productivitygrowth, using the following equations:Output = Capital’s+ Labor’s+ Total FactorGrowth Contribution ContributionProductivityD Y Y = aD KK+ (1-a)D LL+ D AA3.6% = (1/3)(3.6%) + (2/3)(1.8%) +ΔA/A.We can easily solve this for ΔA/A, to find that3.6% = 1.2% + 1.2% + 1.2%We conclude that the contribution of capital is 1.2 percent per year, the contribution of labor is 1.2 percent per year, and the contribution of total factor productivity growth is 1.2 percent per year. These numbers match the ones in Table 9-3 in the text for the United States from 1948–2002.。

Chapter 24Problems and Applicat ions1. a. Find the price of each good in each year:b. If 2006 is the base year, the market basket used to compute the CPI is 100 heads ofcauliflower, 50 bunches of broccoli, and 500 carrots. We must now calculate the cost of themarket basket in each year:2006: (100 x $2) + (50 x $1.50) + (500 x $.10) = $3252007: (100 x $3) + (50 x $1.50) + (500 x $.20) = $475Then, using 2006 as the base year, we can compute the CPI in each year:2006: $325/$325 x 100 = 1002007: $475/$325 x 100 = 146c. We can use the CPI to compute the inflation rate for 2007:(146 − 100)/100 x 100% = 46%2. Many answers are possible.3. a. The percentage change in the price of tennis balls is (2 – 2)/2 × 100% = 0%.The percentage change in the price of golf balls is (6 – 4)/4 × 100% = 50%.The percentage change in the price of Gatorade is (2 – 1)/1 × 100% = 100%.b. The cost of the market basket in 2006 is ($2 × 100) + ($4 × 100) + ($1 × 200) = $200 +$400 + $200 = $800.The cost of the market basket in 2007 is ($2 × 100) + ($6 × 100) + ($2 × 200) = $200 +$600 + $400 = $1,200.The percentage change in the cost of the market basket from 2006 to 2007 is (1,200 –800)/800 × 100% = 50%.c. This would lower my estimation of the inflation rate because the value of a bottle ofGatorade is now greater than before. The comparison should be made o n a per-ouncebasis.d. More flavors enhance consumers’ well-being. Thus, this would be considered a change inquality and would also lower my estimate of the inflation rate.4. a. Because the increase in cost was considered a quality improvement, there was no increaseregistered in the CPI.b. The argument in favor of this is that consumers are getting a better good than before, sothe price increase equals the improvement in quality. The problem is that the increasedcost might exceed the value of the improvement in air quality, so consumers are worse off.In this case, it would be better for the CPI to at least partially reflect the higher cost.5. a. introduction of new goods; b. unmeasured quality change; c. substitution bias; d. unmeasured1Chapter 24/Measuring the Cost of Living 2quality change; e. substitution bias6. a. ($0.75 − $0.15)/$0.15 x 100% = 400%.b. ($14.32 − $3.23)/$3.23 x 100% = 343%.c. In 1970: $0.15/($3.23/60) = 2.8 minutes. In 2000: $0.75/($14.32/60) = 3.1 minutes.d. Workers' purchasing power fell in terms of newspa pers.7. a. If the elderly consume the same market basket as other people, Social Security wouldprovide the elderly with an improvement in their standard of living each year because theCPI overstates inflation and Social Security payments are tied to the CPI.b. Because the elderly consume more health care than younger people do, and becausehealth care costs have risen faster than overall inflation, it is possible that the elderly areworse off. To investigate this, you would need to put together a mar ket basket for theelderly, which would have a higher weight on health care. You would then compare the risein the cost of the "elderly" basket with that of the general basket for CPI.8. When bracket creep occurred, inflation increased people's nominal incomes, pushing them intohigher tax brackets, so they had to pay a higher proportion of their incomes in taxes, even though they were not getting higher real incomes. As a result, real tax revenue rose.9. In deciding how much income to save for retirement, workers should consider the real interest rate,because they care about their purchasing power in the future, not the number of dollars they will have.10. a. When inflation is higher than was expected, the real interest rate is lower than expected.For example, suppose the market equilibrium has an expected real interest rate of 3% andpeople expect inflation to be 4%, so the nominal interest rate is 7%. If inflation turns outto be 5%, the real interest rate is 7% minus 5% equals 2%, which is less than the 3% thatwas expected.b. Because the real interest rate is lower than was expected, the lender loses and theborrower gains. The borrower is repaying the loan with dollars that are worth less than wasexpected.c. Homeowners in the 1970s who had fixed-rate mortgages from the 1960s benefited fromthe unexpected inflation, while the banks that made the mortgage loans were harmed.。

Chapter 30Problems and ApplicationsFigure 61. a. The current state of the economy is shown in Figure 6. The aggregate-demandcurve and short-run aggregate-supply curve intersect at the same point on thelong-run aggregate-supply curve.b. A stock market crash leads to a leftward shift of aggregate demand. Theequilibrium level of output and the price level will fall. Because the quantity ofoutput is less than the natural rate of output, the unemployment rate will riseabove the natural rate of unemployment.c. If nominal wages are unchanged as the price level falls, firms will be forced tocut back on employment and production. Over time as expectations adjust, theshort-run aggregate-supply curve will shift to the right, moving the economyback to the natural rate of output.2. a. When the United States experiences a wave of immigration, the labor forceincreases, so long-run aggregate supply shifts to the right.b. When Congress raises the minimum wage to $10 per hour, the natural rate ofunemployment rises, so the long-run aggregate-supply curve shifts to the left.c. When Intel invents a new and more powerful computer chip, productivityincreases, so long-run aggregate supply increases because more output can beproduced with the same inputs.d. When a severe hurricane damages factories along the East Coast, the capitalstock is smaller, so long-run aggregate supply declines.3. a. The current state of the economy is shown in Figure 7. The aggregate-demandcurve and short-run aggregate-supply curve intersect at the same point on thelong-run aggregate-supply curve.Figure 7b. If the central bank increases the money supply, aggregate demand shifts tothe right (to point B). In the short run, there is an increase in output and theprice level.c. Over time, nominal wages, prices, and perceptions will adjust to this new pricelevel. As a result, the short-run aggregate-supply curve will shift to the left.The economy will return to its natural rate of output (point C).d. According to the sticky-wage theory, nominal wages at points A and B areequal. However, nominal wages at point C are higher.e. According to the sticky-wage theory, real wages at point B are lower than realwages at point A. However, real wages at points A and C are equal.f. Yes, this analysis is consistent with long-run monetary neutrality. In the longrun, an increase in the money supply causes an increase in the nominal wage,but leaves the real wage unchanged.word 文档可自由复制编辑4. The idea of lengthening the shopping period between Thanksgiving and Christmas wasto increase aggregate demand. As Figure 8 shows, this could increase output back to its long-run equilibrium level.Figure 85. a. The statement that "the aggregate-demand curve slopes downward because itis the horizontal sum of the demand curves for individual goods" is false. Theaggregate-demand curve slopes downward because a fall in the price levelraises the overall quantity of goods and services demanded through the wealtheffect, the interest-rate effect, and the exchange-rate effect.b. The statement that "the long-run aggregate-supply curve is vertical becauseeconomic forces do not affect long-run aggregate supply" is false. Economicforces of various kinds (such as population and productivity) do affect long-runaggregate supply. The long-run aggregate-supply curve is vertical because theprice level does not affect long-run aggregate supply.c. The statement that "if firms adjusted their prices every day, then the short-runaggregate-supply curve would be horizontal" is false. If firms adjusted pricesquickly and if sticky prices were the only possible cause for the upward slope ofthe short-run aggregate-supply curve, then the short-run aggregate-supplycurve would be vertical, not horizontal. The short-run aggregate supply curvewould be horizontal only if prices were completely fixed.d. The statement that "whenever the economy enters a recession, its long-runaggregate-supply curve shifts to the left" is false. An economy could enter arecession if either the aggregate-demand curve or the short-runaggregate-supply curve shifts to the left.6. a.According to the sticky-wage theory, the economy is in a recession becausethe price level has declined so that real wages are too high, thus labor demandis too low. Over time, as nominal wages are adjusted so that real wagesdecline, the economy returns to full employment.According to the sticky-price theory, the economy is in a recession because notall prices adjust quickly. Over time, firms are able to adjust their prices morefully, and the economy returns to the long-run aggregate-supply curve.According to the misperceptions theory, the economy is in a recession whenthe price level is below what was expected. Over time, as people observe thelower price level, their expectations adjust, and the economy returns to thelong-run aggregate-supply curve.b. The speed of the recovery in each theory depends on how quickly priceexpectations, wages, and prices adjust.Figure 97. If the Fed increases the money supply and people expect a higher price level, theaggregate-demand curve shifts to the right and the short-run aggregate-supply curve shifts to the left, as shown in Figure 9. The economy moves from point A to point B,with no change in output and a rise in the price level (to P2). If the public does notchange its expectation of the price level, the short-run aggregate-supply curve doesnot shift, the economy ends up at point C, and output increases along with the pricelevel (to P3).8. Figure 10 depicts an economy in a recession. The short-run aggregate-supply curve isAS1 and the economy is at equilibrium at point A, which is to the left of the long-runaggregate-supply curve. If policymakers take no action, the economy will return to the long-run aggregate-supply curve over time as the short-run aggregate-supply curveshifts to the right to AS2. The economy's new equilibrium is at point B.Figure 109. a. People will likely expect that the new chairman will not actively fight inflationso they will expect the price level to rise.b. If people believe that the price level will be higher over the next year, workerswill want higher nominal wages.c. Higher labor costs lead to reduced profitability.d. The short-run aggregate-supply curve will shift to the left as shown in Figure11.word文档可自由复制编辑Figure 11e. A decline in short-run aggregate supply leads to reduced output and a higherprice level.f. No, this choice was probably not wise. The end result is stagflation, whichprovides limited choices in terms of policies to remedy the situation.Figure 1210. a. If households decide to save a larger share of their income, they must spendless on consumer goods, so the aggregate-demand curve shifts to the left, asshown in Figure 12. The equilibrium changes from point A to point B, so theprice level declines and output declines.b. If Florida orange groves suffer a prolonged period of below-freezingtemperatures, the orange harvest will be reduced. This decline in the naturalrate of output is represented in Figure 13 by a shift to the left in both theshort-run and long-run aggregate-supply curves. The equilibrium changesfrom point A to point B, so the price level rises and output declines.Figure 13c. If increased job opportunities cause people to leave the country, the long-runand short-run aggregate-supply curves will shift to the left because there arefewer people producing output. The aggregate-demand curve will shift to theleft because there are fewer people consuming goods and services. The resultis a decline in the quantity of output, as Figure 14 shows. Whether the pricelevel rises or declines depends on the relative sizes of the shifts in theaggregate-demand curve and the aggregate-supply curves.11. a. When the stock market declines sharply, wealth declines, so theaggregate-demand curve shifts to the left, as shown in Figure 15. In the shortrun, the economy moves from point A to point B, as output declines and theprice level declines. In the long run, the short-run aggregate-supply curveshifts to the right to restore equilibrium at point C, with unchanged output andword文档可自由复制编辑a lower price level compared to point A.Figure 15Figure 16b. When the federal government increases spending on national defense, the risein government purchases shifts the aggregate-demand curve to the right, asshown in Figure 16. In the short run, the economy moves from point A to point B, as output and the price level rise. In the long run, the short-runaggregate-supply curve shifts to the left to restore equilibrium at point C, with unchanged output and a higher price level compared to point A.Figure 17c. When a technological improvement raises productivity, the long-run andshort-run aggregate-supply curves shift to the right, as shown in Figure 17.The economy moves from point A to point B, as output rises and the price leveldeclines.Figure 18d. When a recession overseas causes foreigners to buy fewer U.S. goods, netexports decline, so the aggregate-demand curve shifts to the left, as shown inFigure 18. In the short run, the economy moves from point A to point B, asoutput declines and the price level declines. In the long run, the short-runaggregate-supply curve shifts to the right to restore equilibrium at point C, word文档可自由复制编辑with unchanged output and a lower price level compared to point A.12. a. If firms become optimistic about future business conditions and increaseinvestment, the result is shown in Figure 19. The economy begins at point Awith aggregate-demand curve AD1 and short-run aggregate-supply curve AS1.The equilibrium has price level P1 and output level Y1. Increased optimismleads to greater investment, so the aggregate-demand curve shifts to AD2.Now the economy is at point B, with price level P2 and output level Y2. Theaggregate quantity of output supplied rises because the price level has risenand people have misperceptions about the price level, wages are sticky, orprices are sticky, all of which cause output supplied to increase.Figure 19b.Over time, as the misperceptions of the price level disappear, wages adjust, orprices adjust, the short-run aggregate-supply curve shifts up to AS2 and theeconomy gets to equilibrium at point C, with price level P3 and output level Y1.The quantity of output demanded declines as the price level rises.c. The investment boom might increase the long-run aggregate-supply curvebecause higher investment today means a larger capital stock in the future,thus higher productivity and output.13. Economy B would have a more steeply sloped short-run aggregate-supply curve thanwould Economy A, because only half of the wages in Economy B are “sticky.” A 5%increase in the money supply would have a larger effect on output in Economy A and a larger effect on the price level in Economy B.14. a. Many answers are possible.b. Many answers are possible.c. Many answers are possible. word文档可自由复制编辑。
CHAPTER 23: MEASURING A NATION’S INCOMETrue/FalseIndicate whether the statement is true or false.1.T he circular flow diagram describes all transactions between households and firms in a simpleeconomy and shows the equality of expenditures and income.ANSWER:TPOINTS:0 / 12.G ross domestic product includes most items produced and sold illicitly.ANSWER:FPOINTS:0 / 13.N et national product is the total income of a nation’s residents minus losses from depreciation.ANSWER:TPOINTS:0 / 14.D isposable personal income is the income that households and unincorporated business have leftafter satisfying all their obligations to the government. It equals personal income minus personal taxes and certain non-tax payments to government.ANSWER:TPOINTS:0 / 15.T he purchase of new houses by households is included in the calculation of personal consumptionexpenditures of GDP.ANSWER:FPOINTS:0 / 1Multiple ChoiceIdentify the choice that best completes the statement or answers the question.1.W hen GDP falls,a. income and expenditure must both fall.b. income and expenditure can both rise.c. income must fall, but expenditure may rise or fall.d. expenditure must fall, but income may rise or fall.ANSWER:APOINTS:0 / 12.I ncome equals expenditure becausea. firms always pay out all their revenue as income to someone.b. each time a sale is made, there is a buyer and a seller.c. households own the factors of production used to generate incomes.d. All of the above are correct.ANSWER:BPOINTS:0 / 13.I f a province makes the production and sale of illicit drugs legal, then GDPa. must increase.b. must decrease.c. wouldn't change.d. may increase or decrease.ANSWER:APOINTS:0 / 14.W hen a government provides subsidies to encourage growth of small businesses, the subsidieswoulda. be included in GDP because they are invested by businesses.b. be included in GDP because they are a form of government spending.c. not be included in GDP because they are transfer payments.d. may or may not be included in GDP, depending on how the funds are used.ANSWER:CPOINTS:0 / 15.D iesel fuel isa. always considered a final good.b. counted as an intermediate good if a company uses it to provide transportation services.c. counted as a final good if a farmer uses it to run a tractor to grow crops.d. Both b and c are correct.ANSWER:BPOINTS:0 / 16.G ross domestic producta. is the market value of all final goods and services produced within a country in a givenperiod (usually a year)b. is the income in the hands of individuals after deducting income taxes; income available tohouseholds to spend and savec. is the value of goods and services purchased by all levels of government— federal,provincial, and local—in a given periodd. is the market value of all final goods and services produced by permanent residents of anation in a given time periodANSWER:APOINTS:0 / 17.M acroeconomics is that branch of economics that studiesa. the conditions of individual marketsb. the influence of governments on individual marketsc. economy-wide phenomenad. only the private sector of the economyANSWER:CPOINTS:0 / 18.S uppose that nominal GDP is $6,000 billion and real GDP is $3,000. What is the GDP price deflator?a. 125b. 150c. 200d. 250ANSWER:CPOINTS:0 / 19.T he purchase of final goods and services by households is calleda. investmentb. public sector expenditurec. consumptiond. net exportsANSWER:CPOINTS:0 / 110.I nvestment is the purchase of capital equipment, inventories, anda. structuresb. non-durable goodsc. depreciationd. import investmentANSWER:APOINTS:0 / 111.T ransfer paymentsa. are included in GDP because they are forms of incomeb. are included in GDP because goods and services have been produced in the transferc. are NOT included in the GDP because goods and services have not been produced in thetransferd. are included in GDP because they represent the production of transfers of goods andservices to foreign countriesANSWER:CPOINTS:0 / 112.W hich of the following would be considered consumption expenditure?a. The Smiths buy a home built in 1990.b. The federal government pays the salary of a captain in the Armed Forces.c. The Hostlers buy a new car that was manufactured in Germany.d. The government buys food for its armed forces.ANSWER:CPOINTS:0 / 113.T he method that measures GDP in relationship to the size of the population is calleda. GNPb. worker GDPc. GDP per persond. capital GDPANSWER:CPOINTS:0 / 114.T he components of GDP area. C + I + Gb. NX + G + Cc. C + G + NXd. C + I + G + NXANSWER:DPOINTS:0 / 115.S uppose nominal GDP is $7700 and the GDP deflator is 110. Real GDP isa. $7700b. $7000c. $847,000d. $8470ANSWER:BPOINTS:0 / 1Short Answer1.W hat are the components of gross domestic product (GDP)?RESPONSE:ANSWER:The components of GDP are: (1) consumption spending by households on goods and services, with the exception of purchases of new housing; (2) Investment spending oncapital equipment, inventories, and structures, including household purchases of newhousing; (3) government purchases or spending on goods and services by the local,provincial, and federal levels governments; and (4) net exports which is spending ondomestically produced goods and services by foreigners (exports) minus spending onforeign goods and services by domestic resident (imports).POINTS:-- / 12.D ifferentiate between gross domestic product (GDP) and gross national product (GNP).RESPONSE:ANSWER:GDP is the value of all final goods and services produced within a country in a given year; while GNP is the total income earned by a nation’s permanent residents ornationals (that is, Canadians). GNP differs from GDP by including income that citizens ofthe nation (Canada) earned aboard, and excluding income that foreigners earn in theparticular country (E.g. in Canada).POINTS:-- / 13.D ifferentiate between real GDP and nominal GDP.RESPONSE:ANSWER:Nominal GDP is the value of all final goods and services produced within a country in aCHAPTER 24: MEASURING THE COST OF LIVINGyear and valued at current prices; and real GDP is the GDP valued at constant base yearprices. Real GDP is not affected by changes in the level of prices, so it reflects onlychanges in the amounts being produced.POINTS: -- / 14. E xplain why GDP is not considered a perfect measure of well- being?RESPONSE:ANSWER: GDP is not considered a perfect measure of well-being because some of the factors thatcontribute to a good life are omitted. These would include: leisure time, the quality ofthe environment, the distribution of income, and the production of goods and servicesthat did not pas through the market (for example, housework done by the homemaker,and volunteer work) POINTS: -- / 15. H ow do economists measure economic growth?RESPONSE:ANSWER: Economists measure economic growth as the percentage change in real GDP from oneperiod to another. This is because changes in real GDP reflect only changes in theamounts being produced. POINTS: -- / 1True/FalseIndicate whether the statement is true or false.1. T he GDP deflator reflects the prices of goods and services bought by consumers , and the consumerprice index reflects the price of all final goods and services produced domestically.ANSWER:FPOINTS:0 / 12.T he consumer price index compares the price of a fixed basket of goods and services to the price of thebasket in the base year. On the other hand, the GDP deflator compares the price of currently produced goods and services to the price of the same goods and services in the base years.ANSWER:TPOINTS:0 / 13.I ndexation refers to the automatic correction of a dollar amount for the effects of inflation by law orcontract.ANSWER:TPOINTS:0 / 14.L ong term contracts between firms and unions will sometimes include partial or complete indexation ofthe wage to the consumer price index. This is called a cost-of-living allowance clause.ANSWER:TPOINTS:0 / 15.T he core inflation rate is the consumer price index with the exclusion of the most volatile componentssuch as energy and food.ANSWER:TPOINTS:0 / 1Multiple ChoiceIdentify the choice that best completes the statement or answers the question.1.I n the CPI, goods and services are weighted according toa. how much a typical consumer buys of each item.b. whether the items are necessities or luxuries.c. how much of each item is produced in the domestic economy.d. how much is spent on them in the national income accounts.ANSWER:APOINTS:0 / 12.B y not taking into account the possibility of consumer substitution, the CPIa. understates the standard of living.b. overstates the cost of living.c. neither overstates nor understates the cost of living.d. doesn't accurately reflect the cost of living, but it is unclear if it overstates or understates thecost of living.ANSWER:BPOINTS:0 / 13.I f the prices of Brazilian-made shoes imported into Canada increases, thena. both Canada’s GDP deflator and it’s consumer price index will increase.b. neither Canada’s GDP deflator nor it’s consumer price index will increase.c. Canada’s GDP deflator will increase but its CPI will not increase.d. Canada’s consumer price index will increase, but its GDP deflator won’t change.ANSWER:DPOINTS:0 / 14.I f increases in the prices of Canadian car insurance causes the CPI to increase by 3 percent, the GDP deflator will likely increase bya. more than 3 percent.b. 3 percent.c. less than 3 percent.d. All of the above are correct.ANSWER:CPOINTS:0 / 15.T he real interest rate tells youa. how quickly your savings account will grow.b. how quickly the purchasing power of your savings account will grow.c. the size of your savings account.d. the purchasing power of your savings account.ANSWER:BPOINTS:0 / 16.I nflation refers toa. a temporary increase in the price level due to higher tax ratesb. a large increase in food and gasoline pricesc. a situation in which the economy's overall price level is risingd. an increase in the purchasing power of the dollarANSWER:CPOINTS:0 / 17.I f nominal interest rates increase from 8 percent to 10 percent while inflation increases from 3 percent to 12 percenta. the real interest rate falls from 5 percent to –2 percentb. the real interest rate rises from –2 percent to 5 percentc. the real interest rate falls from 8 percent to 12 percentd. the real interest rate rises from 8 percent to 12 percentANSWER:APOINTS:0 / 18.I f the nominal rate of interest is 10 percent and the rate of inflation is 3 percent, what is the real rate of interest?a. 13 percentb. 7 percentc. 3 percentd. –7 percentANSWER:BPOINTS:0 / 19.T he consumer price index:a. measures price changes of raw materialsb. adjusts all prices of goods and services for five-year periodsc. measures the cost of goods and services bought by a typical consumerd. cannot measure price changes of intangible production such as servicesANSWER:CPOINTS:0 / 110.I f the consumer price index (CPI) at the end of 1996 was 125 and the CPI at the end of 1997 was 131,then the rate of inflation during 1997 wasa. zero – prices were stable during 1997b. 4.8 percentc. 6.0 percentd. 125 percentANSWER:BPOINTS:0 / 111.F rank's nominal income in 1998 is $45,000. Suppose the CPI in 1998 is 150. What is Frank's real income?a. $51,750b. $45,000c. $38,250d. $30,000ANSWER:DPOINTS:0 / 112.A change in the price of imports bought by consumers will bea. reflected in the GDP deflatorb. reflected in GDPc. reflected in the CPId. reflected in net national incomeANSWER:CPOINTS:0 / 113.A ll of the following but one are problems associated with the CPIa. substitution biasb. the introduction of new goods and servicesc. unmeasured quality changesd. The CPI is not based on a fixed basket of goods and servicesANSWER:DPOINTS:0 / 114.W hich of the following is correct?a. The CPI is not based on a fixed basket of goods and services.b. The GDP deflator reflects the prices of all domestically produced goods and services.c. The GDP deflator is based on a fixed basket of goods and services.d. The GDP deflator is subject to substitution bias.ANSWER:BPOINTS:0 / 115.T he inflation ratea. is a measure of the cost of a basket of goods and services bought by firmsb. is the absolute change in prices between yearsc. is the percentage change in the price index from the preceding periodd. measures changes in incomes from one year to the nextANSWER:CPOINTS:0 / 1Short Answer1.W hat is the consumer price index (CPI)? What are the three major items included in the CPI?RESPONSE:ANSWER:The CPI is a measure of the overall cost of the goods and services bought by a typicalconsumer. The three major items included in the CPI are shelter, transportation and food. POINTS:-- / 12.H ow is the CPI computed?RESPONSE:ANSWER:First the basket of goods and services must be determined and also the relative importance of the various items to be included in the basket. Then the prices of the variousitems in the basket are determined. The cost of the basket is then determined using thedata on prices and quantity. The base year is chosen, and the index for the base year iscomputed using the quantities in the basket and the base year prices. The index iscalculated by taking the price of the basket in the each year and dividing this by the priceof the basket in the base year. This ratio is then multiplied by 100.POINTS:-- / 13.D ifferentiate between the nominal rate of interest and the real rate of interest.RESPONSE:ANSWER:The nominal interest rate is the interest rate as usually reported without a correction for the effects of inflation. The real interest rate is the interest rate corrected for the effects ofinflation. The real interest rate = nominal interest rate minus the inflation rate.POINTS:-- / 14.W hat is meant by the inflation rate?If the CPI in 1996 was 107.6 and in 1995 was 105.9, calculate the inflation rate for 1996.RESPONSE:ANSWER:The inflation rate is the percentage change in the price index from the preceding period.The inflation rate for 1996 would be:CHAPTER 25: PRODUCTION AND GROWTHPOINTS: -- / 15. W hat are the problems associated with using the consumer price index to measure the cost of living?RESPONSE:ANSWER: The problems are: (1) Prices do not change proportionately. Consumers respond bybuying less of the goods whose prices have risen by large amounts and by buying more ofthe goods whose price have risen by less, or even fallen. The index is computed using afixed basket of items, so theses changes in quantity would not be reflected in the basket.This is referred to as the substitution bias. (2) The CPI is developed using a fixed basket ofgoods and services, when new products are introduced during the time period that aparticular fixed basket is being used, these new products will not be included in calculationof the index. (3) The CPI does not measure quality changes. If the quality of a gooddeteriorates from one year to the next, the value of the dollar falls, even if the price of thegood stays the same. Likewise, if the quality of the good increases from one year to thenext, the value of a dollar also rises. Statistics Canada will try to adjust the price of thegood to account for the quality change, but it is very difficult to measure quality. POINTS: -- / 1True/FalseIndicate whether the statement is true or false.1. O ne way to raise future productivity is to invest less current resources in the production of capital.ANSWER: FPOINTS: 0 / 12.D iminishing returns occur when the benefits from an extra unit of output declines as the quantity ofoutput declines.ANSWER:FPOINTS:0 / 13.M althusian theory states that an ever-increasing population would continually strain society’s abilityto provide for itself. This doomed human beings to forever live in poverty.ANSWER:TPOINTS:0 / 14.P roductivity growth is measured by real output per worker.ANSWER:TPOINTS:0 / 15.T he primary reason that living standards are higher today than they were a century ago is thattechnological knowledge has advanced.ANSWER:TPOINTS:0 / 1Multiple ChoiceIdentify the choice that best completes the statement or answers the question.1.O f the following countries, which grew the slowest over the last 100 years?a. Brazil.b. Mexico.c. Singapore.d. United States.ANSWER:DPOINTS:0 / 12.O n average, each year of schooling raises a person's wage in Canada by abouta. 3 percent.b. 10 percent.c. 15 percent.d. 25 percent.ANSWER:BPOINTS:0 / 13.T he primary reason that Canadian living standards are higher today than they were a century ago is thata. more productive natural resources have been discovered.b. physical capital per worker has increased.c. technological knowledge has increased.d. human capital has increased.ANSWER:CPOINTS:0 / 14.M any countries in Africa have low growth rates. This is partly due toa. few natural resourcesb. high trade barriers.c. low incomes, making it very difficult for them to grow.d. All of the above are correct.ANSWER:BPOINTS:0 / 15.A government can encourage growth and, in the long run, raise the economy’s standard of living by encouraginga. population growth.b. consumption spending.c. saving and investment.d. trade restrictions.ANSWER:CPOINTS:0 / 16.D iminishing returns is the notion thata. as the stock of capital ages, the extra output produced decreasesb. as the stock of capital is increased, the extra output produced from an additional unit ofcapital fallsc. as resources are used to produce capital goods, fewer additional capital goods can beproducedd. you always get what you pay forANSWER:BPOINTS:0 / 17.C ompared with richer countries, poorer countries are generally characterized bya. high real GDP per personb. political stabilityc. rapid population growthd. strongly enforced property rightsANSWER:CPOINTS:0 / 18.W hich one of the following countries would most likely be considered a poorer nation, using real GDP/person?a. Canadab. Germanyc. Japand. IndiaANSWER:DPOINTS:0 / 19.W hich of the following factors would be most likely to encourage capital formation in a poorer nation?a. the expectation of sustained high rates of inflation in the futureb. the expectation that property rights will remain securec. the expectation that a struggle between capitalist and socialist forces will lead to majorstructural change in the economyd. an increase in corporate taxes in order to finance an expanded government welfareprogramANSWER:BPOINTS:0 / 110.W hich of the following is most likely to cause the productivity of labour to increase?a. higher money wage ratesb. a higher rate of investment in human and physical capitalc. more flexible working hours and improved retirement plansd. none of the aboveANSWER:BPOINTS:0 / 111.S uppose that factory output rose from 50,000 units to 55,000 units while labour hours rose from1100 to 1200. Which of the following is true?a. Labour productivity remained unchanged.b. Labour productivity increased slightly.c. Labour productivity decreased slightly.d. Labour productivity increased sharply.ANSWER:BPOINTS:0 / 112.W hich of the following would be most likely to cause the real income per person of poorer countriesto rise?a. a more rapid population growthb. a rapid rate of inflationc. an international minimum-wage lawd. an increase in foreign investment that enhanced the productivity of the labour forceANSWER:DPOINTS:0 / 113.I f a production function has constant returns to scale, then:a. doubling inputs will double output.b. doubling inputs will triple output.c. doubling inputs will cause output to increase, but the increase in output will be less than theincrease in inputs.d. doubling inputs will decrease output.ANSWER:APOINTS:0 / 114.T he most important source of rising living standards over time is:a. the increase in the size of the labour force.b. the increase in the labour force participation rate.c. the increase in productivity.d. the increase in human capital—the skills embodied in the work force.ANSWER:CPOINTS:0 / 1Short Answer1.W hat is productivity and why is it important?RESPONSE:ANSWER:Productivity is the amount of goods and services produced from each hour of a worker’s time. It is the major determinant of the standard of living of a country.POINTS:-- / 12.H ow is productivity determined?RESPONSE:ANSWER:Productivity is determined by a country’s physical capital, human capital, natural resources and technological knowledge.POINTS:-- / 13.W hat is the World Bank and what are its functions?RESPONSE:ANSWER:The World Bank is an international organization that among other things encourages the flow of capital to poor countries. It obtains funds from the world’s advance countiesand loans them to less developed countries so that they can invest in capitalinfrastructure.The World Bank offers advice to developing countries on how the fundsmight best be used.POINTS:-- / 14.W hat are property rights? What role does property rights play in economic growth? RESPONSE:ANSWER:Property rights refer to the ability of people to exercise authority over the resources they own. There must be an economy-wide respect for property rights for the price systemor the free market to work. Lack of respect for property rights or the enforcement ofproperty rights would not only cause political instability but would also discouragesavings and investment. These are necessary for economic growth.POINTS:-- / 15.D ifferentiate between inward-oriented policies and outward-oriented policies.RESPONSE:ANSWER:Inward-oriented policies are aimed at raising productivity and living standards within a county by avoiding interaction with the rest of the world. This approach involves theprotection of domestic industries to allow them to develop and grow withoutcompetition from foreign firms. Outward-oriented policies are designed to integratecountries into the world economy as international trade is considered to be a factor ingenerating economic growth.CHAPTER 26: SAVING, INVESTMENT, AND THE FINANCIAL SYSTEMPOINTS: -- / 1True/FalseIndicate whether the statement is true or false.1. P rivate savings are the tax revenue that the government has left after paying for its spending; andpublic savings is the income that households have left after paying for taxes and consumption.ANSWER: FPOINTS: 0 / 12. A budget deficit is an excess of tax revenue over government spending; and a budget surplus is ashortfall of tax revenue from government spending.ANSWER: FPOINTS: 0 / 13. A budget surplus decreases the supply of loanable funds, increases the interest rate, and stimulatesinvestment.ANSWER: FPOINTS: 0 / 14. T he financial system is the group of institutions in the economy that help to match one person ’ssavings with another person ’s investment.ANSWER: TPOINTS: 0 / 15.A mutual fund is an institution that sells shares to the public and uses the proceeds to buy a selection,or portfolio, of various types of stocks, bonds, or both stocks and bonds.ANSWER:TPOINTS:0 / 1Multiple ChoiceIdentify the choice that best completes the statement or answers the question.1.W hich of the following is correct?a. Lenders buy bonds and borrowers sell them.b. Long-term bonds usually pay a lower interest rate than do short-term bonds becauselong-term bonds are riskier.c. Junk bonds refer to bonds that have been resold many times.d. None of the above are correct.ANSWER:APOINTS:0 / 12.I n a closed economy, national saving equalsa. investment.b. income minus the sum of consumption and government expenditures.c. private saving plus public saving.d. All of the above are correct.ANSWER:DPOINTS:0 / 13.I f the current market interest rate for loanable funds is below the equilibrium level, then there is aa. shortage of loanable funds and the interest rate will rise.b. surplus of loanable funds and the interest rate will rise.c. shortage of loanable funds and the interest rate will fall.d. surplus of loanable funds and the interest rate will fall.ANSWER:APOINTS:0 / 14.S uppose that Parliament were to introduce a new investment tax credit. What would happen in the market for loanable funds?a. The demand for loanable funds would shift left and interest rates fall.b. The demand for loanable funds would shift right and interest rates rise.c. The supply of loanable funds would shift left and interest rates rise.d. The supply of loanable funds would shift right and interest rates fall.ANSWER:BPOINTS:0 / 15.I f Canada increases its budget deficit, it will reducea. private saving and so shift the supply of loanable funds left.b. investment and so shift the demand for loanable funds left.c. public saving and so shift the supply of loanable funds left.d. None of the above are correct.ANSWER:CPOINTS:0 / 16.C rowding out refers toa. the increase in national saving that occurs when government runs a deficitb. the decrease in the real interest rates due to government borrowingc. a reduction in investment spending resulting from government borrowingd. a decrease in consumption spending resulting from government borrowingANSWER:CPOINTS:0 / 17.F or a bank to be profitable, the loans it makes must _____ than the _____ obtaining funds.a. cost more; price ofb. pay less interest; total revenue fromc. make more interest; total cost ofd. be less profitable; total revenue fromANSWER:CPOINTS:0 / 18.L arge budget deficits will likelya. increase the nation's pool of savingb. decrease the nation's pool of savingc. have no impact on the nation's pool of savingd. improve the nation's trade balanceANSWER:BPOINTS:0 / 19.T he supply curve of loanable funds isa. upward-sloping, reflecting the fact that savers need a higher rate of interest to coax theminto lending moreb. downward-sloping, reflecting the fact that savers will increase their supply for loanablefunds at lower rates of interestc. upward-sloping, reflecting the fact that savers will increase their saving at lower rates ofinterestd. None of the aboveANSWER:APOINTS:0 / 110.L oanable funds area. the money in banks and other financial institutionsb. the amount of credit availablec. equal to the total value of capital in the economyd. available only to businessesANSWER:BPOINTS:0 / 111.I f the market for loanable funds is not in equilibrium, which of the following factors must change tobring it to equilibrium?a. outputb. profits。