植物育种全基因组选择
- 格式:ppt
- 大小:4.32 MB
- 文档页数:18
植物物种全基因组的测序与分析随着现代生物技术的不断发展和完善,越来越多的研究者开始将目光放在了植物的基因组测序和分析上。
植物物种的全基因组测序和分析可以帮助我们更好地了解植物的生长和发育规律,发现新的基因和蛋白质,促进植物育种和改良等方面的应用。
本文将从植物基因组测序和分析的意义、方法和应用等方面进行探讨。
一、植物基因组测序的意义植物基因组测序是现代遗传学和分子生物学领域的一项重要研究内容。
通过对植物基因组的测序和分析,可以为植物学、农业和生态学等方向的研究提供重要的基础数据。
首先,全基因组测序能够为我们提供大量的基因序列信息。
通过基因组测序,可以获得植物基因组的完整序列信息,为后续的基因鉴定、新基因发现、基因功能研究等提供基础,为植物学的研究提供了更全面的基础知识。
其次,基因组测序有助于发现新基因。
通过基因组测序,我们可以获取所有基因序列的信息,并进行比对分析,以发现新的、以前未知的基因,这对于数据驱动型的生物学研究具有重要的意义。
此外,基因组测序还可以促进生物信息学领域的发展。
基因组测序技术和生物信息学处理技术的结合,可以更好地研究基因与生态之间的关系,为生态学和植物保护提供更多的数据支撑。
二、植物基因组测序的方法目前,植物基因组测序主要采用Illumina高通量测序技术、 PacBio和Nanopore第三代测序技术、等温测序技术以及荧光原位杂交技术等方法。
其中,Illumina高通量测序技术是全球最为普遍的测序平台之一,其分辨率高、准确率高、数据量大,可以快速、高通量地测序,成为植物基因组测序的主流技术之一。
而PacBio和Nanopore第三代测序技术主要具有长读长和高准确性的特点,能够获得更全面的基因组序列信息,用于高质量的基因组组装。
等温测序和荧光原位杂交技术等方法也可以用于获得植物基因组信息。
在选择测序平台时,需要根据样品的特性、分辨率、数据量、费用等多个方面进行综合评估。
三、植物基因组测序的应用植物基因组测序的应用范围十分广泛,涉及到植物学、种质资源保护、农业种植和育种等多个领域。

四种育种方法随着社会的不断发展,育种技术也在不断进步。
现在,育种方法越来越多样化,其中最常见的四种育种方法是选择育种、杂交育种、基因编辑育种和转基因育种。
一、选择育种选择育种是指通过人为选择种群中某些具有优良性状的个体进行配种,从而获得更优良的后代。
这种方法适用于自然繁殖能力强的动植物,如家禽、家畜、水稻、小麦等。
选择育种需要根据需要的特定性状进行筛选,如生长速度、肉质、耐病性等,选出表现最好的个体进行繁殖。
这种方法需要长期的繁殖和筛选,但是成本相对较低。
二、杂交育种杂交育种是指通过不同品种、不同种属的动植物进行交配,获得具有双亲优点的种群。
这种方法适用于自然繁殖能力较弱的动植物,如玉米、葡萄、牛等。
杂交育种需要选择具有优质优产的亲本进行交配,通过基因的互补作用,获得更好的后代。
这种方法需要耗费大量的时间和精力,但是如果选对了亲本,获得的效果会很显著。
三、基因编辑育种基因编辑育种是指通过基因编辑技术对动植物基因进行修改,获得更好的性状。
这种方法适用于需要特定性状的动植物,如产药植物、耐旱作物等。
基因编辑育种需要通过基因编辑技术对动植物基因进行修改,使其具备更好的性状,如增加产量、提高抗病性等。
这种方法需要高端的技术支持,但是获得的效果也非常显著。
四、转基因育种转基因育种是指将特定基因从一个物种转移到另一个物种的基因组中,从而获得更好的性状。
这种方法适用于需要特定性状的动植物,如抗草害作物、抗虫作物等。
转基因育种需要通过基因工程技术将具有特定性状的基因从一个物种转移到另一个物种的基因组中,使其具备更好的性状。
这种方法需要高端的技术支持和严格的安全监管,但是获得的效果也非常显著。
这四种育种方法各有优劣,适用于不同的动植物。
选择育种和杂交育种相对简单,但是需要较长的时间和精力;基因编辑育种和转基因育种需要高端的技术支持,但是获得的效果非常显著。
在未来,这些育种方法还将不断发展和完善,为人们创造更多的可能性。
全基因组选择育种(GS)简介全基因组选择(Genomic selection, GS)是⼀种利⽤覆盖全基因组的⾼密度标记进⾏选择育种的新⽅法,可通过早期选择缩短世代间隔,提⾼育种值(Genomic Estimated Breeding Value, GEBV)估计准确性等加快遗传进展,尤其对低遗传⼒、难测定的复杂性状具有较好的预测效果,真正实现了基因组技术指导育种实践。
原理常规育种⼿段主要利⽤性状记录值、基于系谱计算的个体间亲缘关系,通过最佳线性⽆偏估计(best linear unbiased predication,BLUP)来估计各性状个体育种值(EBVs),通过加权获得个体综合选择指数,根据综合选择指数⾼低进⾏选留。
标记辅助选择(marker assisted selection, MAS)育种,利⽤遗传标记,将部分功能验证的候选标记联合BLUP计算育种值,这样不仅可以提⾼育种值估计的准确性,⽽且可以在能够获得DNA时进⾏早期选择,缩短世代间隔,加快遗传进展。
⽽GS则通过覆盖全基因组范围内的⾼密度标记进⾏育种值估计,继⽽进⾏排序、选择,简单可以理解为全基因组范围内的标记辅助选择,主要⽅法是通过全基因组中⼤量的遗传标记估计出不同染⾊体⽚段或单个标记效应值,然后将个体全基因组范围内⽚段或标记效应值累加,获得基因组估计育种值(GEBV),其理论假设是在分布于全基因组的⾼密度SNP标记中,⾄少有⼀个SNP能够与影响该⽬标性状的数量遗传位点(quantitative trait loci, QTL)处于连锁不平衡(linkage disequilibrium, LD)状态,这样使得每个QTL的效应都可以通过SNP得到反映。
相⽐BLUP⽅法,全基因组选择可以有效降低计算个体亲缘关系时孟德尔抽样误差的影响;相⽐MAS⽅法,全基因组选择模型中包括了覆盖于全基因组的标记,能更好地解释表型变异。
技术路线植物GS路线动物GS路线GS预期效果:1. 缩短育种周期,实现待选群体的低世代选留2. 提⾼育种值估计准确性3. 降低育种成本,减少表型鉴定的数量4. 预测亲本杂交后代,选择最佳杂交优势组合统计模型统计模型是GS的核⼼,极⼤地影响了基因组预测的准确度和效率。

基因测序技术在植物育种中的应用植物育种是为了改良植物品种,以提高产量、抗性或品质等特性。
传统的植物育种方法需要长时间的观察和多次选择,效率较低。
但是随着基因测序技术的出现,植物育种已经进入了一个新的时代。
基因测序技术,就是通过对生物体的基因组序列进行测序,来研究基因和基因组的结构、功能和演化过程。
这项技术在植物育种中的应用非常广泛,下面我们分析几个具体的方面。
一、基因组测序基因组测序是一种通过测序技术获得一个完整的基因组序列表示的方法。
通过得到植物基因组的序列,可以更好地了解植物的基因组结构和功能。
基因组测序可以揭示植物间的遗传差异,解析植物基因、解释功能以及推断演化,对植物基因改良具有很大帮助。
例如,通过基因组测序,国内科研团队成功筛选到世界上最大的冬枣种质资源库,实现了对冬枣的基因组测序。
这项经典的农业基因组学研究让科研人员深入挖掘到了冬枣基因组信息,并为水果开发提供了技术基础。
二、转基因技术转基因技术是指将外源基因引入到植物体内来改变其遗传特点的技术手段。
使用基因测序技术可以找到植物中的一些特殊的基因,从而把它们转移到其他植物体内,实现育种方法的改良。
例如,在水稻中加入了苏云金膜的基因,提高水稻对干旱、盐碱、低温等压力的适应性,实现了水稻的抗逆能力增强,同时也更加耐热、产量更高。
三、分子标记辅助育种分子标记技术是指在DNA水平上寻找基因型特殊的基因。
通过分析植物DNA中的不同部分的遗传变异性,确定与某个表型(如抗病性、耐性、高产性)有关的特定基因位点,以快速获得所需的新品种。
例如,发现农作物中的簇毛菌根真菌体内有某些基因与耐盐碱能力有关,而在不含这些基因的农作物中,其耐盐碱能力较差。
利用分子标记技术,可以快速筛选出某些植物品种中可能含有相关基因的植物材料,并进行后续的选择、育种。
四、单细胞测序技术单细胞测序技术可以用于检测单个细胞的基因组序列,避免了传统生物组学研究中的混杂效应。
在植物育种中,单细胞测序技术可以帮助科学家寻找基因表达差异大的质体,并通过进一步的研究来深入了解这些基因的功能与调节机制。
植物分子育种新方法与技术植物育种一直是人类的重要任务之一,随着科技的不断更新迭代,植物育种技术手段也在不断发展。
分子育种作为一种新兴的育种技术,正逐步成为植物育种的重要手段之一。
下面就来谈谈植物分子育种的新方法与技术。
一、单倍型选择单倍型选择是指在育种过程中选择最优基因单倍型,以加速育种进程和提高育种效率。
单倍型选择最初是在小麦、玉米等大型单倍型植物上进行的,但现在也已经开始在一些复杂重要的作物上应用。
单倍型选择的原理是在育种过程中产生蒸汽小单倍型植物,然后通过对这些植物的重组进行选择,最终得到优异基因单倍型,进行杂交育种或者直接转基因育种。
二、分子标记辅助选择分子标记技术是指在植物基因组上选择和鉴定不同的DNA序列,以判断该物种植物的基因性状、种类、父系与母系等信息。
这种技术常被用于育种,称为分子标记辅助选择。
分子标记辅助选择的原理是通过标记与目标基因的DNA序列的配对,快速、准确地鉴定某一确定基因型,进而选择“指定”基因型的杂交对象。
这种方法可用于选择抗病、耐旱等种植物。
三、组学和生物信息学组学和生物信息学是新兴的研究方向,在分子育种中也有着广泛的应用。
组学是指对组织中所有基因的表达进行分析,以了解组织基因表达的全貌,从而掌握基因运作的规律,而生物信息学则对所有生物信息进行研究,如分析基因的序列、结构等。
组学分析可研究种植物在不同环境下的变化、不同类型植物基因组的结构和功能等。
生物信息学则可用于全基因组重组、拼接基因组序列和植物基因家族的鉴定等领域。
四、基因编辑技术基因编辑技术是指利用酵素来对目标DNA进行剪切、粘合并插入、删除特定基因的方法,达到改变基因表型的效果。
这种技术被广泛应用于植物育种中。
基因编辑技术的原理是以某些基因为模板,利用DNA合成技术合成一串DNA,再用这串DNA替代原DNA,实现对基因序列的改变。
这种方法可用于植物病害的抵抗、提高产量等。
总之,植物分子育种技术是育种领域中发展最快的前沿技术之一,其应用范围广泛,极大地促进了植物育种的发展。
七种育种方法和原理育种是农业生产中的重要环节,通过育种可以培育出高产、抗病虫害、适应环境的新品种。
在育种过程中,采用不同的方法和原理,可以达到不同的效果。
本文将介绍七种常见的育种方法和原理。
一、选择育种法选择育种法是指通过选择某些具有良好性状的个体进行繁殖,逐步选育出更优良的品种。
这种方法基于遗传变异的原理,通过选择具有优良性状的个体进行繁殖,逐渐提高这些性状在整个种群中的频率。
这是一种常用且有效的育种方法。
二、杂交育种法杂交育种法是指将两个不同的亲本进行杂交,通过杂种优势产生具有更好性状的后代。
这种方法基于杂种优势的原理,通过杂交可以使后代具有更强的适应性、更高的产量等优势。
杂交育种法广泛应用于许多作物的育种中。
三、突变育种法突变育种法是指通过诱变剂或自然突变等手段,产生具有新性状的变异体,再通过选择繁殖,最终培育出具有这种新性状的品种。
这种方法基于突变的原理,通过人工或自然诱导的突变,可以创造出新的遗传变异,为育种提供了新的材料。
四、基因工程育种法基因工程育种法是指通过人工改变植物或动物的基因组,引入具有特定功能的外源基因,从而产生具有特殊性状的品种。
这种方法基于基因工程技术的原理,可以实现对植物或动物基因组的精确编辑和改造,为育种提供了全新的途径。
五、细胞培养育种法细胞培养育种法是指利用细胞培养技术,通过离体培养、植物组织培养等方法,培育出具有特殊性状的新品种。
这种方法基于植物细胞的再生和分化能力,可以在无性繁殖的基础上实现植物品种的改良和创造。
六、分子标记育种法分子标记育种法是指利用分子标记技术,对植物或动物进行基因型鉴定和选择,从而实现精准育种的方法。
这种方法基于分子标记与性状间的关联,通过对候选基因型进行分子鉴定,可以快速筛选出具有目标性状的个体,加速育种进程。
七、遗传改良育种法遗传改良育种法是指通过遗传改良技术,改变植物或动物的遗传组成,从而培育出具有特殊性状的新品种。
这种方法基于遗传改良技术的原理,如基因编辑、基因组选择等,可以实现对植物或动物基因组的精确改良,为育种提供了新的手段。
开展基因组选择育种的主要步骤开展基因组选择育种的主要步骤如下:
1、精准测序技术:这是开展基因组选择育种的基本步骤。
首先,
使用现代精准测序技术,包括单碱基变异(SNP)测序、片段分析、短
片段测序、转录组分析等,对染色体上标记位点进行详细分析,从而
确定位点上的基因及基因型。
2、构建关联图:将经过精准测序技术所获得的SNP位点数据制作
成关联图,即基因组关联图,基于此关联图可以识别出可能关联于某
一特性的基因型,从而可以进行重要特征水平的关联性分析。
3、运用QTL定位技术:在基因组关联分析的基础上,可以使用连
锁映射和QTL定位技术,进一步定位控制某一特性的重要基因的位置,同时也可以确定多个基因组区域中的基因的贡献。
4、分子标记技术:在类群育种中,运用分子标记技术可以快速、
有效地识别出拥有优良基因的株系,进而进行精细育种,从而提高作
物的品质和产量。
5、蛋白质组技术:蛋白质组技术可以有效地定量分析植物体内蛋
白质组织的结构特征,可以检测植物产量、品质、适应能力等农艺性
状特征所牵涉到的重要遗传因子,从而为精准育种提供指导。
6、全基因组测序技术:全基因组测序技术可以精确地定位植物染
色体上的基因组结构,从而有效地挖掘、分析核心基因及基因组的结
构及表达特征,为精准育种提供科学依据。
简述选择育种的程序选择育种是一种通过有意识地选择适应特定目标的个体进行繁殖的方法,以获得更好的品质和性状的后代。
这种程序在农业、畜牧业和园艺等领域中被广泛应用。
本文将简述选择育种的程序,介绍其中的关键步骤和技术手段。
1. 确定育种目标在选择育种的程序中,首先需要明确育种目标。
这可以是提高作物产量、改善品质、提高抗病虫害能力等。
明确育种目标有助于指导后续的选择和筛选工作。
2. 收集遗传资源选择育种的第二个步骤是收集适合育种目标的遗传资源。
这包括采集和保存不同品种的种子或芽苗,以及获取有价值的杂交种。
这些遗传资源将成为后续选择和筛选的基础。
3. 进行杂交在选择育种的程序中,杂交是一个重要的步骤。
通过将具有不同有益性状的个体进行交配,可以获得具有更好品质和性状的后代。
在杂交过程中,需要选择适合的亲本,并进行控制交配和控制杂交的方法。
4. 选择育种选择育种的核心步骤是选择具有理想性状的个体作为亲本。
这可以通过观察和测量不同性状,如产量、品质、抗病性等来实现。
选择的依据可以是育种目标的具体要求,也可以是统计学方法和遗传学原理的应用。
5. 筛选和评估后代在选择育种的程序中,筛选和评估后代是一个重要的步骤。
通过观察和测量后代的性状和表现,可以筛选出具有理想性状的个体,并进一步确定其遗传潜力。
这可以通过田间试验、实验室分析和统计学方法来实现。
6. 重复选择和筛选选择育种的程序是一个持续的过程,需要反复进行选择和筛选。
根据育种目标的要求,可以选择不同的个体进行交配,获得更好的后代。
通过不断重复选择和筛选,可以逐步改良品种,实现育种目标。
7. 应用其他技术手段在选择育种的程序中,还可以应用其他技术手段来辅助育种工作。
例如,基因编辑技术可以用于精确修改个体的基因组,以实现特定的育种目标。
分子标记辅助选择可以帮助鉴定具有理想基因型的个体。
这些技术手段可以提高育种效率和精确度。
总结起来,选择育种是一个复杂的程序,需要明确育种目标、收集遗传资源、进行杂交、选择育种、筛选和评估后代,以及应用其他技术手段。
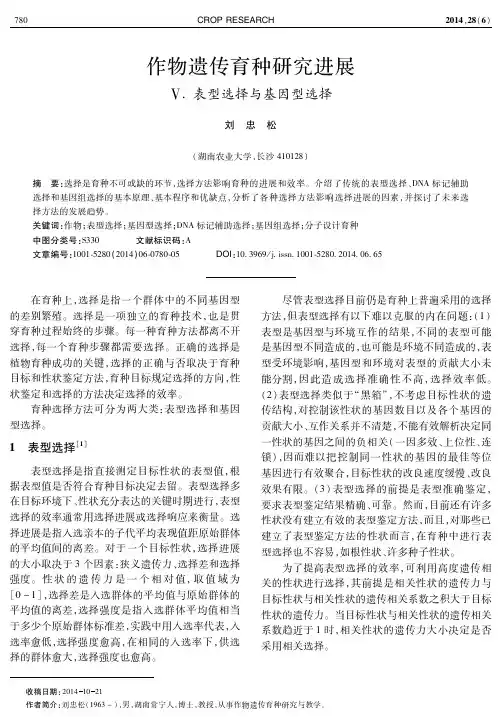
植物全基因组选择技术的研究进展及其在玉米育种上的应用孙琦;李文兰;陈立涛;赵勐;李文才;于彦丽;孟昭东【摘要】全基因组选择技术通过全基因组中大量的单核苷酸多态性标记(SNP)和参照群体的表型数据建立 BLUP模型估计出每一标记的育种值,称为估计育种值(GEBV),然后仅利用同样的分子标记估计出后代个体育种值并进行选择。
该文就近年来国内外有关影响基因组选择效率的主要因素———参考群体的类型与大小、模型的建立方法、标记的类型及其数目、性状遗传力,以及对基因组选择效率的影响等方面的研究进展进行综述,并介绍了全基因组选择技术在玉米育种上应用概况以及对未来的展望。
%Marker-assisted selection (MAS)technology could realize direct genetic selection,but it must base on QTL mapping.Genomic selection (GS),as the newest MAS method,has much advantage com-pared to traditional MAS technology,especially QTL mapping not necessary.Inthis paper,the factors af-fecting prediction accuracy of GS were reviewed,including training population type,prediction model, marker number,population size,population structure,hereditary of traits and so on.The application of GS in maize breeding was also introduced as well as hybrids performance prediction.We then predicated the future research and application of GS in maize breeding.【期刊名称】《西北植物学报》【年(卷),期】2016(036)006【总页数】9页(P1269-1277)【关键词】全基因组选择;玉米;估计育种值【作者】孙琦;李文兰;陈立涛;赵勐;李文才;于彦丽;孟昭东【作者单位】山东省农业科学院玉米研究所,济南 250100;山东省农业科学院玉米研究所,济南 250100;莱阳市种子公司,山东莱阳 265200;山东省农业科学院玉米研究所,济南 250100;山东省农业科学院玉米研究所,济南 250100;山东省农业科学院玉米研究所,济南 250100;山东省农业科学院玉米研究所,济南250100【正文语种】中文【中图分类】Q789With rapid development of the molecular biology and genomics, marker-assisted selection(MAS) emerged as the times require. MAS technology is as a kind of crop genetic improvement method combing the phenotypic and genetic value, which can realize genetic direct selection and effective polymerization[1] . When complex traits controlled by multiple genes need to be improved, MAS has two aspects of flaws. First, selection of the progeny population is established on the quantity traits location (QTL) mapping. But the result of QTL mapping basing on the bi-parental populations has no universality and couldn’t be applied accurately in breeding[2]. Second, the important traits were controlled by lots of small effective genes,lack of appropriate statistic method and breeding technology which will apply quantity genes to complex traits improvement[3]. New MAS technology-genomic selection (GS) emerged asthe times require.Meuwissen first put forward genomic selection (GS) breeding strategy. GS uses a “training population” of individuals that have been genotyped and phenotyped. Best linear unbiased prediction (BLUP) model is established on the basis of the genotyped result of an individual and its breeding value (Mean performance of crosses with same tester) for the training population. The breeding value of “Candidate population” is estimated by BLUP model and genotypic data.without cross to tester and phenotypes record[4]. BLUP model takes genotypic data of untested individuals and produces genomic estimated breeding values (GEBVs). These GEBVs say nothing of the function of the underlying genes as the ideal selection criterion[5] . Genomic selection basis of GEBVs is superior to traditional breeding for increasing gains per unit time even if both models show the same efficiency. In principle, phenotypes value of the candidate individuals is non-essential for the selection, hence shortening the length of the breeding cycle[6].Genomic selection have several merits compared to the traditional MAS. (1) QTL mapping is not necessary for GS. Genomic selection differs from previous strategies such as linkage and association mapping in that it abandons the objective to map the effect of single gene and instead of focusing on the efficient estimation of breeding values on the basis of a large number of molecular markers, ideally covering the full genome[5] . (2) Genomic selection is more precision especially for early selection. Genotyping uses high density molecular markers which can estimate all ofthe QTL effects and explain the genetic variance for most of the traits. But MAS only uses several markers in traits selection. So genomic selection is more accurate than MAS[7] . (3) Genomic selection can shorten generation interval, accelerate genetic progress and reduce production cost. Genetic progress of GS is more than phenotypic selection 4%-25%. Cost of GS is less than traditional breeding 26%-56%[8] . (4) Selection efficiency of low heritability traits is higher for GS than MAS. (5) The criterion of GS is breeding value, sum of all of the allele genetic effects for each individual. It is judged by the mean performance of its cross progeny, not the performance of itself. So GS is more accurate[9].Genomic selection originated from animal breeding during last century. It has been widely used in dairy cattle breeding in America, Australia, New Zealand and so on[10-11] . It was also applied in broiler chickens and pigs breeding[12-13] . GS’ application in plant breeding was developed in recent years, which focused on simulation studies. It is used in maize[14] , wheat[15] , tree[16] , sugar beet[17] , Barley[18] , triticale[19] and so on. Empirical study is performed in larger companies such as Monsanto and Pioneer-Dupond. Mark Sorrells and Jean-Luc Jannink are trying to use GS to increase the speed of variety improvement 3-4 times. The work is carried out with CYMMIT and performed four aspects to improve the yield of maize and wheat[20].Under the above context, the objective of this study is to review the essential factors affecting the GS in plant breeding. Maize is essential for global food security. More research of genomic selection on maize lauchedin recent years[21-23]. The paper will introduce the advance on the application of GS in maize breeding. We than put forward the future research which should be carried out in maize breeding in China. Factors that affect GS prediction accuracy of include the number of markers used for estimating the GEBVs[10] , trait heritability[7] , calibration population size[5] , statistical models[24] , number and type of molecular markers[25-26] , linkage disequilibrium[27] , effective population size[28], relationship between calibration and test set (TS)[29-31] and population structure[32-34] .2.1 Training population of genomic selectionIn animal breeding, we only discussed GS in the context of population-wide linkage disequilibrium, where the population might be defined as an entire breed of cattle, pig, or chicken. The need for high marker densities in GS may be reduced if the candidate population consists of progeny of the training population. In that case, an evenly spaced low-density subset of the markers typed on the training population can be used on the candidates, and scores for the full complement of markers can be inferred by cosegregation[35] . Because plants often produce very large full sibships (an F2 population derived from a single F1 by selfing is an example of such a sibship), however, there is also a tradition of QTL detection, MAS and GS within such sibships[5] . Bernardo compared F2, BC1, and BC2 populations from an adapted×exotic maize cross as training population in the simulation experiment[14]. The result indicates that genomewide selection should start at F2 rather than backcross population,even when the number of favorable alleles is substantially larger in the adapted parent than in the exotic parent. Compared to natural populations, genetic basis of F2 populations is simpler because F2 populations derive from only two inbred lines. So the biparental population size might be smaller than that of natural populations. Simulation studies have previously indicated that for three cycles of genomewide selection in an adapt ed×exotic cross, a population size of NC0 = 144 was generally sufficient[21] . Low density markers are suitable to F2 populations[22] . But two disadvantages of F2 populations exist. Biparental population requires separate model for training within each cross.The BLUP model is only suit for the progenies selection from the two parental lines. The progeny of F2 population must be selected by the phenotypic value of F3 testcrosses. Following progeny selection may be only according to BLUP model afterF3.F2 as training population often be suilt for cross-pollinated plant such as maize. Yusheng Zhao based on experimental data of six segregating populations from a half-diallel mating design with 788 testcross progenies from an elite maize breeding program[23]. In the study of Vannesa etal.[36] , marker effects estimated in 255 diverse maize hybrids were used to predict grain yield, anthesis date, and anthesis-silking interval within the diversity panel and testcross progenies of 30 F2-derived lines from each of five populations.Wegenast et al. suggested that genomic selection was applied in plant breeding, however, not only within a specific bi-parental cross or within adiverse panel of elite lines but also rather within and among crosses[37]. Self-pollination plant often adopt natural population such as wheat or sugar. Würschum et al used 924 sugar beet lines as training population. The results suggest that a training population derived from intensively phenotyped and genotyped diverse lines from a breeding program does hold potential to build up robust calibration models for genomic selection[17]. Hans et al. accessed the accuracy of GEBVs for rust resistance in 206 hexaploid wheat landraces[15].2.2 Prediction model of genomic selectionGenomic selection modeling takes advantage of the increasing abundance of molecular markers through modeling of many genetic loci with small effects[26,35,38] . Over the last decade, simulation and empirical cross-validation studies in plants have shown GS is more effective than traditional MAS strategies that use only a subset of markers with significant effects[5-7,39] .Estimation methods of allelic effects include least squares regression[40], ridge regression BLUP (RR-BLUP), principle component analysis[41-42] and Bayes regression[43]. In essence for least squares, chromosome fragments or markers are selected associated to the traits by genome-wide association studies (GWAS) at the same time and then the effect of the fragments is estimated[44]. RR-BLUP method regards the fragment effects as random effects. The marker effect was estimated by linear mixed models. The sum of fragments effect is breeding value for an individual[43]. Bayes methods combines the prior distribution of marker effect varianceand data collection. Frenquently used Bayes methods conclude Bayes A and Bayes B. Main difference between Bayes A and Bayes B is that Bayes A permits different variance for different markers and Bayes B permits that the variance of some markers is zero[45].Simulation studies show that the prediction accuracy of Bayes method is best and least squares is weakest. The accuracy rate of RR-BLUP is slightly smaller than Bayes A. Even so, RR-BLUP has four aspects superior to Bayesian method. First, Bayesian method is complex and need super computer. But computer requirement is lower and calculation speed is higher for RR-BLUP. Marker effects are estimated by RR-BLUP in SAS PROC IML[46]. Second, prediction within families was more accurate in BLUP than Bayes B. Regression coefficient b of RR-BLUP is nearer to 1 than BayesA[47]. Habier et al. showed that RR-BLUP is more effective at capturing genetic relationships because it fits more markers into the prediction Model[27]. In contrast, Bayes B is more effective at capturing LD between markers and QTL. Third, RR-BLUP is more accurate than other method when the number of QTLs increases or the heredity is higher[18] . Fourth, BLUP led to lower inbreeding and a smaller reduction of genetic variance compared to Bayes and PLS [48]. From above, we can conclud that BLUP methods is better than Bayesian regression for plant models.In addition, machine-learning methods also can be used to predict the marker effect, including support vector machine (SVM) , booting and random forest (RF). Ogutu et al. compared these methods for genomic selection. The result shows that the correlation between the predicted andtrue breeding values is 0.547 for boosting, 0.497 for SVMs,and 0.483 for RF, indicating better performance for boosting than for SVMs and RF[49].2.3 Other factors affecting prediction accuracyIn genome-wide selection methods, prediction accuracy is affected by population size (N), average hereditary of traits (h2) and markernumbers(NM)[50]. Simulation studies showed that the population structure is also crucial for the prediction accuracy in genomicselection[27].Prediction accuracy increases with markers density. Markers number on a certain length genome also directly affects total information of genetic markers. If SSR markers density increases from 0.25 Ne/morgan (Ne, effective population size) to 2 Ne/morgan, prediction accuracy will be improved from 0.63 to 0.83. If SNP markers density increases from 1Ne/morgan to 8 Ne/morgan, prediction accuracy will be improved from 0.69 to 0.86. Even at the highest tested densities of 2 Ne SSR markers per Morgan or 8 Ne SNP markers per Morgan, accuracy had not reached a plateau[5] . Meanwhile, more markers number, more easy to get the Linkage disequilibrium(LD) markers. Emily found that in the biparental populations, there was no consistent gain in genome-wide prediction (rmp) from increasing marker density above one marker per 12.5 cM[22]. Zhao et al. revealed that the accuracy was nearly reaching a plateau at 800 SNPs when the number of markers varied from 100 to 800 [23]. The reason is that genome is sufficiently saturated with markers when the prediction accuracy arrives at a plateau[28,50]. The number of markers needed foraccurate predictions of genotypic values depends on the extent of linkage disequilibrium (LD) between markers and QTL[4] and also on the germplasm under consideration[18] .Different marker type has different polymorphism information content (PIC). Comparing SSR and SNP markers, they found that for similar accuracies, the SNP markers required a density of 2 to 3 times that of the SSR[5].Simulation studies showed that the population size is crucial for the prediction accuracy in genomic selection[27]. The result of Emily et al. indicated that prediction accuracy rmp increased as population size N increased. In the biparental maize population and with the highest markers number NM, (1 213 markers) and hereditary h2 = 0.30, the prediction accuracy for grain yield was rmp = 0.19 with N= 48, rmp = 0.26 with N = 96, and rmp = 0.33 with N = 192[22]. Zhao Yusheng observed a monotonic increase in the prediction accuracy for grain yield with increasing population size without any substantial decrease in the slope [23] . The study of Bernardo also indicated that lager poluation size would get higher prediction precision[14]. But F2 population size of NC0 = 144 was generally sufficient[21].Training population structure is also an important factor affecting prediction accuracy of genomic selection for multi-parental populations. Training population structure set methods conclude random sampling, unidirectional sampling (selecting individuals with highest genotypic values), bidirectional sampling (selecting individuals with highest or lowestgenotypic values)[50-51]. This bidirectional selection showed to be much more powerful than random sampling[52] . Yusheng Zhao observed a substantial loss in the accuracy to predict genomic breeding values in unidirectional selected populations. Bidirectional selection is a valuable approach to efficiently implement genomic selection in applied plant breeding programs[53].For the same trait within the same population, prediction accuracy(rmp) will remain unchanged for different combinations of population size (N) and trait hereditary (h2). Decrease on h2 can be compensated by a proportional increase in N (and vice versa) so that rmp is maintained. On the other hand, traits with initially low h2 can be evaluated with larger N or the h2 for a subset of traits can be increased by the use of additional testing resources. Different traits, however, vary in their prediction accuracy even when N, h2, and NM (markers number) are constant. Yield traits had lower prediction accuracy than other traits despite the constant N, h2, and NM. Simulation results indicated that rmp is also lowest for yield traits even when its h2 is as high as other traits. Plant height and lodging are always predicted most accurately followed by floweringtime[22] . Empirical evidence and experience on the predictability of different traits are necessary in designing training populations.3.1 Origination of GS in maizeThe key technology of GS is the maize hybrid prediction by BLUP model with markers effects or coefficient of parentage. It was used to predict the single-cross performance in maize hybrid breeding at first. The BLUPmodel is established based on the tested hybrids data and the markers information of their parents. The performance of untested hybrids is predicted by the BLUP model and the markers data of the parents[54]. Bernardo devoted himself to hybrids prediction by BLUP model inmaize[55-58]. The coefficient of relative between theory and actual observation was 0.688~0.800 by RFLP markers[54] . BLUP is suitable for hybrid performance prediction since the trait only has moderate heritability. Prediction accuracy of molecular marker effects is higher than phylogenetic relationship[58]. With the development of molecular markers, new molecular marker type emerged. Simple sequence repeats (SSR) and single nucleotide polymorphism (SNP) were widely used. Manje Gowda et al. found that prediction accuracy of flower time and plant height was above 0.8 with SSR markers in maize[19]. Research of Massman et al. indicated that prediction accuracy of grain yield was 0.8, and root logging ratio was 0.87 using SSRmarkers[59]. But the prediction effect of grain yield was only 0.50~0.66, and root logging ratio was only 0.31~0.45 with coefficient of parentage[55] . Then it indicated that molecular markers was more suitable for hybrid performance prediction than coefficient of parentage.Then scientists found that BLUP was not only used to hybrid performance prediction, but also the breeding value of individuals among the maize population. So BLUP was used to individuals selection of F2 population in selection and breeding of inbred lines. Hybrid performance prediction lay the foundation for the genome-wide selection in maize.3.2 Application of genomic selection in maizeBernardo’s laboratory began to study applying GS to maize breeding in Minnesota University of America[21] . They did plenty of simulation and empirical experiments. Piepho in German and Robert in Brazil also tried to study using GS in maize breeding[60-61]. GS utility in maize breeding consist of two sides, hybrids performance prediction and improvement of inbred lines. He devoted to inbred lines improvement using GS. The BLUP model of biparental populations from two inbred lines is only suit for the progeny of the parents. Genomewide selection as proposed in maize involves two steps[21]. First, a segregating maize population is genotyped and evaluated for testcross performance of F3 family. Based on the genotypic and phenotypic data, breeding values associated with a large set of markers (e.g., 256 to 512 markers) are calculated for the traits of interest. Significance tests for markers are not used, and the effects of all markers are fitted as random effects in a linear model by best linear unbiased prediction (BLUP). Second, two or three generations of selection based on all markers are conducted in a year-round nursery (e.g., Hawaii or Puerto Rico) or greenhouse. Trait values are predicted as the sum of an individual plant’s marker values across all markers, and selection is subsequently based on these genomewide prediction. According to the steps, Emily (2013b) introgressed semidwarf germplasm to U.S. Corn belt inbred and found that genomewide selection from Cycle 1 until Cycle 5 either maintained or improved on the gains from phenotypic selection achieved in Cycle 1[62].The results of Bernardo indicated that a useful strategy for the rapid improvement of an adapted×exotic cross involves 7 to 8 cycles of genomewide selection starting in the F2[14]. Benjamin et al. demonstrated that progressive selfing had a significant and positive impact on genomic selection gains. In particular, selfing to the F8 produced a 72% increase over F2 gains[63]. However, most of the gains are realized by the F5 generation (95% of the F8 gains). Also note that the F8 and DH performed similarly, consistent with previous observations[64] .In the research of Bernardo, the training population is the specific bi-parental populations from the two parental lines, so the BLUP model is suit for the progeny of the two inbred lines. Other experiments of GS in maize are about multi-parental populations as training population. Study of Yusheng Zhao was based on experimental data of six segregating populations from a half-diallel mating design. As for maize up to three generations are feasible per year, selection gain per unit time is high and, consequently, genomic selection holds great promise for maize breeding programs[23]. These result of the study might be as genomic prediction model for further breeding elite maize lines between the six populations. In the study of Vanessa et al., marker effects estimated in 255 diverse maize hybrids were used to predict grain yield, anthesis date, and anthesis-silking interval within the diversity panel and testcross progenies of 30 F2-derived lines from each of five populations[36]. Potential uses for genomic prediction in maize hybrid breeding are discussed emphasizing the need of (1) a clear definition of the breeding scenario in which genomicprediction should be applied (i.e., prediction among or within populations), (2) a detailed analysis of the population structure before performing cross validation, and (3) larger training sets with strong genetic relationship to the validation set.GS is just beginning to be implemented, but it will take long time to be used in maize breeding. In previous study, training population was only from several inbred lines, even if two inbred lines. It couldn’t be implemented by other breeding program. Future research should focus on two sides of work. First, we should commit to build a generalized prediction model for some kinds of inbred lines such as yield, quality and so on. But these traits were complex composed of a great deal of genes. Traditional MAS technology couldn’t realize the traits selection in maize breeding. 973 Plan “Basic study on breeding of geno me-wide selection of yield and quality traits in maize” has been carried out in 2014. The plan will systematicly analyze the genetic basis of maize yield and quality, and then build genome-wide selection breeding model. It will afford new technology for maize breeding. Seond,in China, abiotic stress tolerance also reduces the yield seriously in maize especially drought tolerance. Drought is the foremost factor restricting maize production, often resulting in 20-50% maize yield reduction every year in China[65] . If we establish prediction model of drought tolerance, it will afford the theory and technology support of maize breeding. Consequently, our research team will carried out study on the genomic selection program of drought tolerance.References:[1] STUBER C W, POLACCO M, SENIOR M L. Synergy of empirical breeding, marker-assisted selection, and genomics to increase crop yield potential[J]. Crop Science, 1999,39:1 571-1 583.[2] MOOSE S P, MUMM R H. Molecular plant breeding as the foundation for 21st century crop improvement[J]. Plant Physiology, 2008, 147: 969-977.[3] BERNARDO R. Molecular markers and selection for complex traits in plants: learning from the last 20 years[J].Crop Science, 2008, 48:1 649-1 664.[4] MEUWISSENT H, HAYES B J, GODDARD M E. Prediction of total genetic value using genome-wide dense marker maps[J]. Genetics, 2001, 157: 1 819-1 829.[5] JANNINK J L, LORENZ A J, IWATA H. Genomic selection in plant breeding: from theory to practice[J]. Briefings in Functional Genomics, 2010, 9(2):166-177.[6] HEFFNER E L, JANNINK J L, IWATA H, et al. Genomic selection accuracy for grain quality traits in biparental wheat populations[J]. Crop Science, 2011, 51: 2 597-2 606.[7] HEFFNER E L, SORRELLS M E, JANNINK J L. Genomic selection for crop improvement[J]. Crop Science, 2009, 49: 1-12.[8] MAYOR P J , BERNARDO R. Genomewide selection and marker-assisted recurrent selection in doubled haploid versus F2 populations[J]. Crop Science, 2009, 49:1 719-1 725.[9] MASSMAN J M, JUNG H J G, BERNARDO R. Genomewide selectionversus marker-assisted recurrent selection to improve grain yield and stover-quality traits for cellulosic ethanol in maize[J]. Crop Science, 2012, 53(1): 58-66.[10] SCHAEFFER L R. Strategy for applying genome-wide selection in dairy cattle[J]. Journal of Animal Breeding Genetic, 2006, 123: 218-223.[11] GODDARD M E, HAYES B J. Genomic selection[J]. Journal of animal Breeding Genetics, 2007, 124: 323-330.[12] DAETWYLER H D, VILLANUEVA B, BIJMA P. Inbreeding in genome-wide selection[J]. Journal of Animal Breeding Genetic, 2007, 124: 369-376.[13] TU L, WOOLLIAMS J A, SIGBJORN L. The accuracy of genomic selection in norwegian red cattle assessed by cross validation[J]. Genetics, 2009, 183: 1 119-1 126.[14] BERNARDO R. Genomewide selection for rapid introgression of exotic germplasm in maize[J]. Crop Science, 2009, 49: 419-425.[15] HANS D D, BANSAL U K, BARIANA H S, et al. Genomic prediction for rust resistance in diverse wheat landraces[J]. Theory and Applied Genetics, 2014, 127: 1 795-1 803.[16] MARIE D, BOUVET J M. Genomic selection in tree breeding: testing accuracy of prediction models including dominance effect[J]. BMC Proceedings, 2011, 5(Supply7): 1-2.[17] WÜRSCHUM T, REIF J C , KRAFT T, et al. Genomic selection in sugar beet breeding populations[J]. BMC Genetics, 2013, 14: 85-92.[18] ZHONG S Q, DEKKERS J C M, FERNANDO R L, et al. Factors affecting accuracy from genomic selection in populations derived from multipleinbred lines: a barley case study[J]. Genetics, 2009, 182(1): 355-364. [19] GOWDA M, ZHAO Y S , MAURER H P, et al. Best linear unbiased prediction of triticale hybrid performance[J]. Euphytica, 2013, 191: 223-230.[20] 吴永升, 邵俊明, 周瑞阳, 等. 植物数量性状全基因组选择研究进展[J]. 西南农业学报, 2012,25(4): 1 510-1 514.WU Y S, SHAO J M, ZHOU R Y, et al. Reviews of genome- wide selection for quantitative traits in plants[J]. Southwest China Journal of Agricultural Sciences, 2012, 25(4): 1 510-1 514.[21] BERNARDO R, YU J. Prospects for genome-wide selection for quantita-tive traits in maize[J]. Crop Science,2007, 47: 1 082-1 090.[22] EMILY C, BERNARDO R. Accuracy of genomewide selection for different traits with constant population size, heritability, and number of markers[J]. Plant Genome, 2013a, 6(1): 1-7.[23] ZHAO Y S, GOWDA M, LIU W X, et al. Accuracy of genomic selection in European maize elite breeding populations[J].Theoretical and Appllied Genetics, 2012a, 124: 769-776.[24] HESLOT N, YANG H P, SORRELLS M E, et al. Genomic selection in plant breeding: a comparison of models[J]. Crop Science, 2012, 52: 146-160.[25] CHEN X, SULLIVAN P F. Single nucleotide polymorphism genotyping: biochemistry, protocol, cost and throughput[J]. Pharmaco Genetics, 2003, 3: 77-96.[26] POLAND J, RIFE T W. Genotyping-by-sequencing for plant breeding and genetics[J]. Plant Genetics, 2012, 5: 92-102.[27] HABIER D, FERNANDO R L, DEKKERS J C M. The impact of genetic relationship information on genome-assisted breeding values[J]. Genetics, 2007, 177: 2 389-2 397.[28] DAETWYLER H D, VILLANUEVA B, WOOLLIAMS J A. Accuracy of predicting the genetic risk of disease using a genome-wide approach[J]. PLoS One, 2008, 3: 3 395.[29] ALBRECHT T, WIMMER V, AUINGER H J, et al.Genome-based prediction of testcross values in maize[J]. Theoretical and Appllied Genetics, 2011, 123: 339-350[30] CLARK S, HICKEY J, WERF J. Different models of genetic variation and their effect on genomic evaluation[J]. Genetic Selection Evolution, 2011, 43: 18.[31] PSZCZOLA M, STRABEL T, MULDER H A, et al.Reliability of direct genomic values for animals with different relationships within and to the reference population[J]. Journal of Dairy Science, 2012, 95z: 389-400. [32] SAATCHI M, MCCLURE M C, MCKAY S D, et al. Accuracies of genomic breeding values in American Angus beef cattle using k-means clustering for cross-validation[J]. Genetic Selection Evolution, 2011, 43: 40.[33] WINDHAUSEN V S, ATLIN G N, CROSSA J, et al. Effectiveness of genomic prediction of maize hybrid performance in different breeding populations and environments[J]. Genes Genomes Genetic, 2012, 2:1 427-1 436.[34] GUO Z, TUCKER D M, BASTEN C J, et al. The impact of population structure on genomic prediction in stratified populations[J]. Theoretical。

首页 科技服务 测序指南 基因课堂 市场活动与进展 文章成果 关于我们全基因组选择1. Meuwissen T H, Hayes B J, Goddard M E.Prediction of total genetic value using genome-wide dense marker maps[J]. Genetics, 2001, 157(4): 1819 1829. 阅读原文>>2. Haberland A M, Pimentel E C G, Ytournel F, et al. Interplay between heritability, genetic correlation and economic weighting in a selection index with and without genomic information[J]. Journal of Animal Breeding and Genetics, 2013, 130(6): 456-467. 阅读原文>>3. Wu X, Lund M S, Sun D, et al. Impact of relationships between test and training animals and among training animals on reliability of genomic prediction[J]. Journal of Animal Breeding and Genetics, 2015, 132(5): 366-375. 阅读原文>>4. Goddard M E ,Hayes BJ. Genomic selection [J]. Journal of Animal Breeding and Genetics,2007,124:323:330. 阅读原文>>5. Heffner E L, Sorrells M E, Jannink J L. Genomic selection for crop improvement [J]. Crop Science, 2009, 49(1): 1-12. 阅读原文>>参考文献全基因组选择简介Meuwissen等[1]在2001年首次提出了基因组选择理论(Genomic selection , GS),即利用具有表型和基因型的个体来预测只具有基因型不具有表型值动植物的基因组育种值(GEBV)。
植物基因组学技术在作物育种中的应用随着生物技术的迅猛发展,植物基因组学技术已经成为现代作物育种中不可或缺的一部分。
通过对植物基因组的分析和研究,可以了解作物的遗传特性、基因结构和功能等,从而实现作物选育、品种改良和繁育的目的。
本文将从植物基因组学技术的原理、方法和应用等方面来详细探讨植物基因组学技术在作物育种中的应用。
一、植物基因组学技术的原理和方法1.原理:植物基因组是指植物所有的遗传信息,包括DNA序列、基因表达调控、蛋白质结构和功能等。
植物基因组学研究的核心在于对植物基因组信息的分析和解析,通过对植物基因组学分析可以了解植物基因信息的全貌和内在机制。
2.方法:植物基因组学技术包括DNA测序技术、基因芯片技术、基因功能鉴定技术等,其中DNA测序技术是目前最直接、最常用的技术之一。
随着高通量测序技术的发展及其日益普及,基因组学研究可以大规模、快速、准确地进行。
二、1.基因发掘与功能鉴定:通过基因组学技术的应用,可以快速地发掘作物中存在的基因类型和数量,并对基因进行功能鉴定,从而寻找对作物育种有用的基因。
例如可以通过基因表达谱分析,筛选具有逆境耐受性的基因,并进行进一步研究和利用。
2.基因组标记辅助选择:植物基因组学技术可以构建高密度的基因组物理图谱,对基因进行定位和标记,从而实现对植物杂交育种过程中的杂交亲本进行筛选和选择。
同时可以利用基因组学技术鉴定植物中的分子标记如SNP、SSR等,用于杂交育种的基因组标记辅助选择。
3.基因编辑技术:CRISPR-cas9技术在作物基因组编辑中的应用尤为重要,可以创造新的子类和新的具有优异性状的优质作物品种。
该技术以其高效、准确和大规模的优点,有望取代传统育种方法,提高育种效率和质量。
三、不足与展望1.在植物基因编辑技术方面,目前编辑的目标基因点多偏向逆境作物的转录因子或关键酶基因,而其他重要功能基因的编辑仍面临挑战,这对于一些特殊作物而言可能表现得更为明显。
植物遗传改良中的基因组选择与育种技术植物遗传改良是一项关键的农业技术,通过选择合适的基因组以及育种技术,可以显著提高植物的产量、抗性和适应性。
本文将介绍基因组选择和育种技术在植物遗传改良中的应用,并讨论其在农业领域的前景。
一、基因组选择技术在植物遗传改良中的应用基因组选择技术是一种先进的遗传改良方法,它通过筛选和选择个体的基因组中的有益基因,以实现目标的遗传改良。
在植物遗传改良中,基因组选择技术可以应用于以下几个方面:1. 目标基因的筛选:基因组选择技术可以帮助研究人员识别目标基因,并筛选出拥有有益基因组的个体。
例如,在优化作物品质方面,可以通过基因组选择技术确定具有高产量、耐病性和优质特性的个体。
2. 繁殖策略的优化:基因组选择技术可以有效地帮助人们选择出具有良好基因组的个体进行繁殖。
通过选择优质基因组的个体进行杂交交配,可以加速目标基因的积累,并提高下一代的遗传水平。
3. 逆境条件的适应性提高:基因组选择技术可以在植物遗传改良中应用于适应逆境条件的研究。
逆境(如干旱、高温和盐胁迫等)会对植物的生长和发育产生负面影响,通过基因组选择技术筛选具有适应逆境能力的个体,可以提高作物的抗逆性,从而实现在恶劣环境中的正常生长和高产。
二、育种技术在植物遗传改良中的应用育种技术是另一种重要的植物遗传改良手段,它通过人工选择和杂交等方式,快速培育具备优良性状的新品种。
以下是育种技术在植物遗传改良中的应用:1. 杂交育种:杂交育种是育种技术中常用的一种手段,它利用不同品种之间的互补性和优势,通过控制交配的过程,将某些有益基因的组合导入目标品种中,从而培育出更优良的新品种。
2. 突变育种:突变育种是通过诱发植物基因发生突变,然后筛选出具备目标性状的突变体进行培育的一种育种技术。
通过人工诱变,可以扩大遗传变异的范围,寻找到具有优异性状的新品种。
3. 基因编辑技术:近年来,基因编辑技术的快速发展为植物遗传改良带来新的机遇。
林木全基因组选择育种技术林木全基因组选择育种技术,这个名字听起来是不是挺高大上的?一听就有点科学家的感觉吧。
不过说实话,这个技术其实就像是给树木做“基因体检”,然后根据“体检报告”来挑选最合适的“树木明星”,让它们在森林里茁壮成长。
想象一下,我们每天吃的食物、穿的衣服,甚至居住的地方都跟基因息息相关,林木也不例外。
它们的基因决定了它们能不能适应环境,长得快不快,甚至能不能抵抗病虫害。
所以,如果能搞清楚树木的基因特征,选出最“有潜力”的树木,那可就太牛了!什么是全基因组选择育种呢?说白了,就是通过对林木的全基因组进行全面扫描,分析出哪些基因对树木的生长、抗病能力、木材质量等有关键作用。
然后,我们就可以根据这些信息,选择那些基因优秀的树木来进行繁育。
就像挑选运动员或者明星一样,挑选出最强的基因,确保后代更加优秀。
这种方式比传统的选育方法快多了,也更精准,避免了传统育种中可能出现的“试错”现象。
毕竟,不是每个树木都能生出好木材或者抗病能力强的后代,得靠点“智慧”!大家都知道,传统育种就像是“靠天吃饭”,你得看天赋,靠着经验摸索,搞不好就会错过一些潜力股。
就比如你买了个看起来不起眼的小树苗,结果它后来变成了巨无霸。
可是你怎么知道这个苗子好不好?光靠经验?那也太危险了!育种的过程时间长,光是等待就让人焦虑。
全基因组选择育种技术的好处就在于,它能够快速“揭示”每棵树苗的基因优势,避免我们在无数个品种中浪费时间,轻松筛选出最合适的候选者。
举个例子,我们常说“千里马常有,而伯乐不常有”。
这不就是说明,选对了人才(或者说是种苗),就能一飞冲天。
要是伯乐眼光不准,错过了千里马,那就只能看着别人骑上好马远去了。
树木育种也是一样,别看树苗现在不怎么样,未来可不一定。
这时候如果能通过基因组选择,提前看清它未来的潜力,直接给它“扶上一把”,那就能大大提高育种效率,培育出更高质量的树木。
想想看,等到森林里的树木不仅长得快,木材质量又好,还能抗虫害,那可真是赚了!不过,林木基因组选择育种技术的背后,实际上是对技术和数据的高度依赖。
植物基因组学与育种技术的结合在农业领域,植物基因组学与育种技术的结合正引领着一场深刻的变革。
这一结合不仅为提高农作物的产量、品质和抗逆性提供了强大的工具,也为保障全球粮食安全和可持续农业发展开辟了新的途径。
植物基因组学是研究植物基因组的结构、功能和进化的学科。
通过对植物基因组的测序和分析,我们能够深入了解植物基因的组成、调控机制以及它们在生长发育、环境适应等过程中的作用。
随着测序技术的飞速发展和成本的不断降低,越来越多植物物种的基因组图谱被绘制出来,为育种工作提供了丰富的遗传信息。
传统的育种技术主要依赖于对植物表型的观察和选择。
农民和育种家们通过挑选具有优良性状的植株进行杂交和选育,经过多代的努力,逐步培育出符合需求的品种。
然而,这种方法往往需要耗费大量的时间和精力,而且由于基因的复杂性和不确定性,选育的效果并不总是理想的。
植物基因组学的出现为育种技术带来了新的突破。
首先,通过基因组测序,我们可以直接鉴定出与重要农艺性状相关的基因。
例如,对于抗病性这一性状,我们可以在基因组中寻找与抗病机制相关的基因,从而有针对性地进行选育。
其次,基因组学技术使得对植物基因的精准编辑成为可能。
CRISPRCas9 等基因编辑技术能够对特定的基因进行精确修饰,从而快速获得具有期望性状的植株。
在植物育种中,分子标记辅助选择是基因组学应用的一个重要方面。
分子标记是位于基因组中的特定 DNA 序列,它们与特定的性状紧密连锁。
通过检测分子标记,育种家们可以在植物生长的早期阶段就筛选出具有目标性状的个体,大大提高了选育的效率和准确性。
例如,在水稻育种中,利用与产量相关的分子标记,可以在幼苗阶段就筛选出具有高产潜力的植株,从而节省了大量的时间和资源。
此外,基因组选择也是一种基于基因组学的新型育种策略。
它通过对大量个体的基因组数据进行分析,建立性状与基因组的预测模型,从而能够对尚未表现出性状的个体进行准确的选择。
这种方法在动物育种中已经取得了显著的成效,近年来也逐渐应用于植物育种领域。
植物农学中的新品种选育技术植物农学作为农业科学的一个重要分支,致力于从事植物品种的选育、种植、生产等研究。
在现代农业中,选择和培育出适应性强、产量高、抗病性好的新品种,对于提高农作物的产量和质量,满足人们对于食物安全和营养需求具有重要意义。
本文将重点介绍植物农学中的新品种选育技术。
一、遗传学基础遗传学是植物农学中的重要基础科学,研究遗传信息的传递和表达。
通过遗传学的研究,科学家们能够了解植物的遗传变异和基因的功能,从而为新品种的选育提供理论基础。
目前,主要应用的遗传学技术包括基因分型、基因定位、基因编辑等。
二、遗传改良技术1. 杂交育种杂交育种是指通过不同品种间的杂交,将有利的遗传特点固定在一个个体中,以获得更为优良的后代。
杂交育种在植物农学中具有广泛应用,可以显著提高作物的产量、抗病性和适应性等。
2. 育种技术育种技术包括选择育种和突变育种。
选择育种是在自然和人工条件下,通过对植物的观察和筛选,选择具有有利遗传特性的个体作为亲本,通过连续选择和交配,逐步培育出具备优良性状的新品种。
突变育种则是通过诱变剂或特定辐射诱导植物基因发生突变,从而获得具有新特性的植株。
三、分子生物学技术1. 分子标记辅助选择分子标记辅助选择是利用分子生物学技术对植物基因组进行标记,并通过标记检测方法对基因型进行分析,从而快速、准确地选择出具有目标性状的个体。
这一技术能够大大缩短选育周期,提高选育效率。
2. 基因工程技术基因工程技术是指通过改变植物的遗传物质,引入外源基因或调控内源基因的表达,从而使植物获得新的性状或改善现有性状。
例如,通过转基因技术可以培育出具有抗虫、抗病、耐盐碱等性状的植物新品种。
四、组织培养技术组织培养技术是一种基于细胞和组织生物学知识的技术,通过体外培养植物组织或细胞,进行快速繁殖或诱导植物突变。
组织培养技术可以实现植物无性繁殖,大大加快新品种的繁殖速度和选育周期。
综上所述,植物农学中的新品种选育技术不断发展,基于遗传学、分子生物学、组织培养等技术手段,科学家们能够更加准确、快速地选育出优良的新品种,助力农业产业的发展和粮食安全的达成。