大学英语四级考试图表作文
- 格式:doc
- 大小:22.50 KB
- 文档页数:7
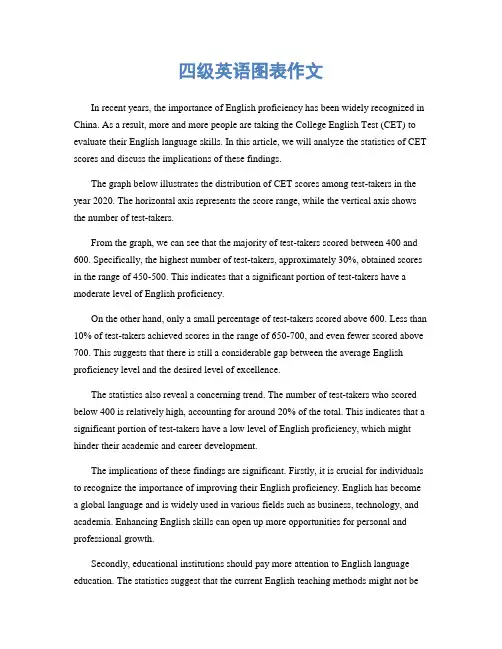
四级英语图表作文In recent years, the importance of English proficiency has been widely recognized in China. As a result, more and more people are taking the College English Test (CET) to evaluate their English language skills. In this article, we will analyze the statistics of CET scores and discuss the implications of these findings.The graph below illustrates the distribution of CET scores among test-takers in the year 2020. The horizontal axis represents the score range, while the vertical axis shows the number of test-takers.From the graph, we can see that the majority of test-takers scored between 400 and 600. Specifically, the highest number of test-takers, approximately 30%, obtained scores in the range of 450-500. This indicates that a significant portion of test-takers have a moderate level of English proficiency.On the other hand, only a small percentage of test-takers scored above 600. Less than 10% of test-takers achieved scores in the range of 650-700, and even fewer scored above 700. This suggests that there is still a considerable gap between the average English proficiency level and the desired level of excellence.The statistics also reveal a concerning trend. The number of test-takers who scored below 400 is relatively high, accounting for around 20% of the total. This indicates that a significant portion of test-takers have a low level of English proficiency, which might hinder their academic and career development.The implications of these findings are significant. Firstly, it is crucial for individuals to recognize the importance of improving their English proficiency. English has become a global language and is widely used in various fields such as business, technology, and academia. Enhancing English skills can open up more opportunities for personal and professional growth.Secondly, educational institutions should pay more attention to English language education. The statistics suggest that the current English teaching methods might not beeffective enough in improving students' language skills. Therefore, it is necessary to explore innovative teaching approaches, such as interactive language learning platforms and immersive language programs, to help students achieve better results in the CET.Furthermore, the government should invest more resources in promoting English education. English proficiency is closely related to a country's competitiveness in the global economy. By providing more funding and support to English language programs, the government can contribute to the overall improvement of English proficiency in the country.In conclusion, the statistics of CET scores in 2020 indicate that while a significant portion of test-takers have a moderate level of English proficiency, there is still room for improvement. It is crucial for individuals, educational institutions, and the government to work together in promoting English language education and enhancing English proficiency. Only by doing so can we meet the challenges of globalization and seize the opportunities it brings.。
历年四六级图画型作文英文回答:A Picture is Worth a Thousand Words: Reflecting on Past CET-4 and CET-6 Picture Composition Prompts.Picture composition, a staple of the College English Test Band 4 (CET-4) and College English Test Band 6 (CET-6), invites test-takers to delve into the depths of their creativity and analytical thinking. The prompts, often rich in visual detail and open to multiple interpretations, demand a keen eye for observation and a nuanced understanding of the social, cultural, and political contexts that shape our world.Over the years, CET-4 and CET-6 picture composition prompts have showcased a diverse range of themes, from the poignant to the profound. In the 2000s, prompts focused on globalization and its impact on various aspects of life.For instance, one prompt depicted a group of peopleinteracting with technology in a futuristic setting, encouraging students to ponder the potential benefits and pitfalls of technological advancements.As the 2010s dawned, environmental concerns gained prominence in picture composition prompts. One prompt featured an image of a polluted river, challenging students to explore the consequences of human activities on the natural world. Another prompt depicted a group of individuals engaged in a beach cleanup, inspiring students to reflect on the importance of environmental stewardship.In recent years, picture composition prompts have continued to evolve, reflecting the ever-changing global landscape. Prompts have touched upon mental health, social justice, and the impact of social media on our lives. One particularly notable prompt featured an image of a young person surrounded by various electronic devices, inviting students to examine the interplay between technology and well-being.中文回答:一图千言,历年四六级图画作文回顾。
英语四级图表类作文万能模板【优秀3篇】(经典版)编制人:__________________审核人:__________________审批人:__________________编制单位:__________________编制时间:____年____月____日序言下载提示:该文档是本店铺精心编制而成的,希望大家下载后,能够帮助大家解决实际问题。
文档下载后可定制修改,请根据实际需要进行调整和使用,谢谢!并且,本店铺为大家提供各种类型的经典范文,如总结报告、合同协议、规章制度、条据文书、策划方案、心得体会、演讲致辞、教学资料、作文大全、其他范文等等,想了解不同范文格式和写法,敬请关注!Download tips: This document is carefully compiled by this editor. I hope that after you download it, it can help you solve practical problems. The document can be customized and modified after downloading, please adjust and use it according to actual needs, thank you!Moreover, our store provides various types of classic sample essays, such as summary reports, contract agreements, rules and regulations, doctrinal documents, planning plans, insights, speeches, teaching materials, complete essays, and other sample essays. If you want to learn about different sample formats and writing methods, please pay attention!英语四级图表类作文万能模板【优秀3篇】英语四级考试中作文是拉分差距较大的题型,如何让自己的作文更出彩?除了考前多练笔,根据模板进行仿写也是非常实用的方法,下面是本店铺整理的英语四级图表类作文万能模板【优秀3篇】,在大家参照的同时,也可以分享一下本店铺给您最好的朋友。


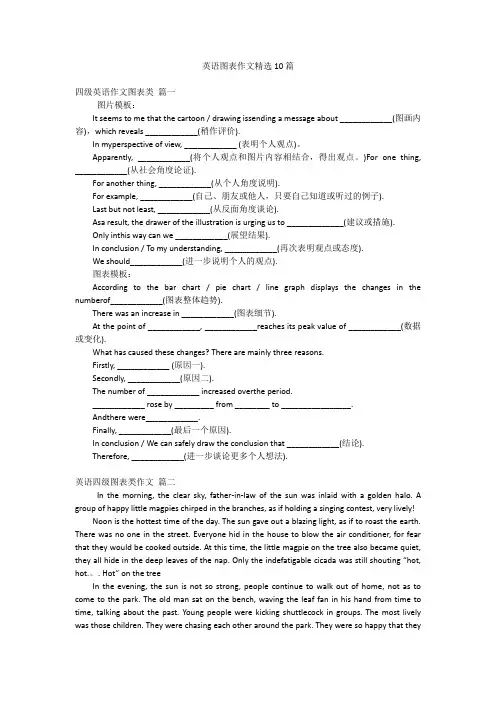
英语图表作文精选10篇四级英语作文图表类篇一图片模板:It seems to me that the cartoon / drawing issending a message about ____________(图画内容),which reveals ____________(稍作评价).In myperspective of view, ____________ (表明个人观点)。
Apparently, ____________(将个人观点和图片内容相结合,得出观点。
)For one thing, ____________(从社会角度论证).For another thing, ____________(从个人角度说明).For example, ____________(自己、朋友或他人,只要自己知道或听过的例子).Last but not least, ____________(从反面角度谈论).Asa result, the drawer of the illustration is urging us to _____________(建议或措施).Only inthis way can we ____________(展望结果).In conclusion / To my understanding, ____________(再次表明观点或态度).We should____________(进一步说明个人的观点).图表模板:According to the bar chart / pie chart / line graph displays the changes in the numberof____________(图表整体趋势).There was an increase in ____________(图表细节).At the point of ____________, ____________reaches its peak value of ____________(数据或变化).What has caused these changes? There are mainly three reasons.Firstly, ____________ (原因一).Secondly, ____________(原因二).The number of ____________ increased overthe period.____________ rose by _________ from ________ to ________________.Andthere were____________.Finally, ____________(最后一个原因).In conclusion / We can safely draw the conclusion that ____________(结论).Therefore, ____________(进一步谈论更多个人想法).英语四级图表类作文篇二In the morning, the clear sky, father-in-law of the sun was inlaid with a golden halo. A group of happy little magpies chirped in the branches, as if holding a singing contest, very lively!Noon is the hottest time of the day. The sun gave out a blazing light, as if to roast the earth. There was no one in the street. Everyone hid in the house to blow the air conditioner, for fear that they would be cooked outside. At this time, the little magpie on the tree also became quiet, they all hide in the deep leaves of the nap. Only the indefatigable cicada was still shouting “hot, hot.。
英语四级作文写作模板(图表类)英语四级作文写作模板(图表类)模版一As is shown in the chart / graph / diagram / table above, __________ has charged drastically in the past _________. While ___________,now the percentage of __________ is __________. Meanwhile, the number of _________ has soared up to ________.There are mainly two possible reasons contributing to the rapid changes. The first is that _________. Secondly,__________.In my point of view, the changes have a great influence on _________. At the same time,_______. To sum up ,_________.图表所示,__________急剧充电在过去的_________。
虽然___________,现在的百分比__________是__________。
同时,已经飙升了________,_________。
主要有两个原因可能造成的快速变化。
第一是_________。
其次,__________。
在我的`角度来看,在_________的变化有很大的影响。
在同一时间,_______。
综上所述,_________。
模版二What is shown in the chart / graph / diagram / table above indicates that in recent years, more and more people pay attention to _________. The number of those who _________ has increased ________, and furthermore,____________.There are two factors responsible for the changes. In the first place,_________.Moreover,__________. Yet, it is noticeable that __________. From the analysis, we can safely draw the conclusion that__________. It is possible that in the future, the tendency will__________.在上面图表所示,表示,近年来,越来越多的人注重_________。
图表类英语四级作文Title: The Impact of Social Media on Teenagers: A Graph Analysis。
Introduction:In recent years, the influence of social media on teenagers has become a topic of concern and debate. Withthe proliferation of social networking platforms, adolescents are spending increasing amounts of time online. This essay aims to explore the impact of social media on teenagers, using graphs to illustrate trends and statistics.Graph 1: Time Spent on Social Media Platforms by Teenagers。
The first graph depicts the average daily time spent by teenagers on various social media platforms over the past decade. From 2010 to 2020, there has been a steady increase in the time spent on social media, with peaks observed in2015 and 2019. This trend suggests a growing reliance on social media among teenagers for social interaction, entertainment, and information consumption.Graph 2: Effects of Social Media on Mental Health。
英语四级图表作文英语四级图表作文模板(精选8篇)图表作文的写作是英语四级里常会遇到的,下面,店铺为大家送上一些英语四级图表作文模板(精选8篇),希望能对大家有所帮助。
英语四级图表作文篇1As can be clearly seen from the graph/table/chart (As is shown in the table/figure), great changed have taken place in_______, The _________ have/has skyrocketed/jumped from _____ to _____.When it comes to the reasons for the changes, different people give different explanations. Here I shall just give a few.To begin with, ______What’s mo re,___________, Last but not least, ________.While it is desirable that ___________, there are still some problems and difficulties for __________ Firstly, __________ ,In addition, __________ ,In a word, __________英语四级图表作文篇2as is shown/indicated/illustrated by the figure/percentage in the table(graph/picture/pie/chart), ___作文题目的`议题_____ has been on rise/ decrease (goesup/increases/drops/decreases),significantly/dramatically/st eadily rising/decreasing from______ in _______ to ______ in _____. From the sharp/marked decline/ rise in the chart, it goes without saying that ________.There are at least two good reasons accounting for ______. On the one hand, ________. On the other hand, _______ is due to the fact that ________. In addition, ________ is responsible for _______. Maybe there are some other reasons to show ________. But it is generally believed that the above mentioned reasonsare commonly convincing.As far as I am concerned, I hold the point of view that _______. I am sure my opinion is both sound and well-grounded. 英语四级图表作文篇3It is obvious in the graph/table that the rate/number/amount of Y has undergone dramatic changes. It has gone up/grown/fallen/dropped considerably in recent years (as X varies). At the point of (接近)X1, Y reaches its peak value of (多少).What is the reason for this change? Mainly there are (多少) reasons behind the situation reflected in the graphic/table. First of all, (第一个原因). More importantly, (第二个原因). Most important of all, (第三个原因).From the above discussions, we have enough reason to predict what will happen in the near future. The trend described in the graph/table will continue for quite a long time (if necessary measures are not taken括号里的使用于那些不太好的变化趋势).英语四级图表作文篇4①As can be clearly seen from the graph/table/chart,great changes have taken place in __________②The __________ have/has skyrocketed/jumped from _____ to _____.③When it comes to the reasons for the changes, different people give different explanations. Here I shall just give a few.④To begin with, . 原因之一⑤Whats more, . 原因之二⑥Last but not least, 原因之三⑦While it is desirable that ___________, there are still some problems and difficulties for __________⑧Firstly, __________ 要点一⑨In addition, __________ 要点二⑩In a word, __________ 总结补充:1.As we can see from the chart/graph/table/diagram2.The chart/graph/table/diagram shows thatAs is shown in According to As can be seen in3. This chart/graph/table/diagram shows a sharp great//sudden/slow/rapid. increase/drop...4. To make a generalization; on the whole; in general/generally speaking英语四级图表作文篇5(1)模版1According to the chart / graph / diagram / table, we clearly learn that _________. As early as _________,___________. Then,_________. Last,__________. In contrast, by _________,__________.There are many reasons accounting for _________. Firstly, _________.Secondly,__________. Finally,_________. As a result,_________.As far as I am concerned,_________. For one thing,__________. For another,________. In brief, I hold that__________.(2)模版2What is shown in the chart / graph / diagram / table above indicates that in recent years, more and more people pay attention to _________. The number of those who _________ has increased ________, and furthermore,____________.There are two factors responsible for the changes. In the first place,_________. Moreover,__________. Yet, it is noticeable that __________.From the analysis, we can safely draw the conclusion that__________. It is possible that in the future, the tendency will__________.(3)模版3As is shown in the chart / graph / diagram / table above, __________ has charged drastically in the past _________. While ___________,now the percentage of__________ is __________. Meanwhile, the number of _________ has soared up to ________.There are mainly two possible reasons contributing to the rapid changes. The first is that _________. Secondly,__________.In my point of view, the changes have a great influence on _________. At the same time,_______. To sum up ,_________.英语四级图表作文篇6Students tend to use computers more and more frequently nowadays. Reading this chart, we can find that the average number of hours a student spends on the computer per week has increased sharply. In 1990, it was less than 2 hours; and in 1995, it increased to almost 4 hours, and in 2000, the number soared to 20 hours.Obviously computers are becoming increasingly popular. There are several reasons for this change. First, computers facilitate us in more aspects of life. Also, the fast development of the Internet enlarges our demands for using computers. We can easily contact with friends in remote places through the Internet. Besides, the prices of computers are getting lower and lower, which enables more students to purchase them.However, there still exist some problems, such as poor quality, out-of-date designs and so on. And how to balance the time between using computers and studying is also a serious problem. Anyhow, we will benefit a lot from computers as long as we use them properly.英语四级图表作文篇7It can be seen from the graph that the rate of car accidents in Walton City experienced rises and falls in 1990. From Januaryto March last year it increased by 45%. From March to June it dropped by about half the previous rate. From June to August there was a steep rise of 50%. After that, however, there was a steady decrease.There are several reasons for this improvement, but the following are the most critical ones. First, new traffic regulations have made drivers more careful. Second, more people are using bicycles for transportation. Finally, in the later part of the year good weather made the roads safer to drive on.I am confident that there will be even fewer car accidents in Walton in the future. First, major roads have been repaired and the number of public buses has been increased in the past few months. Moreover, a traffic safety campaign has made all the local people more aware of the dangers of unsafe driving.英语四级图表作文篇8As can be clearly seen from the graph/table/chart (As is shown in the table/figure), great changed have taken place in_______, The_________ have/has skyrocketed/jumped from _____ to _____. When it comes to the reasons for the changes, different people give different explanations. Here I shall just give a few.To begin with, ______What’s more,___________, Last but not least, ________. While it is desirable that ___________, there are still some problems and difficulties for __________ Firstly, __________ ,In addition, __________ ,In a word, __________ .【英语四级图表作文模板(精选8篇)】。
您目前旳位置: 首页 > 英语四级 > 英语四级作文 > 英语四级作文综合辅导 > 正文英语四级图表作文旳类型及参照范文图表作文也是四(六)级考试中常见, 并且被认为是一种较难旳作文形式。
图表作文就是把非文字信息(一般为多种图表表达旳数字信息等)转换成文字信息旳一种作文。
它规定我们用文字来描述非文字性旳图表或对图表显示旳关系作解释阐明。
下面我们先来看一看图表作文旳类型。
第一节图表作文旳类型图表作文可分为两大类: 表作文和图作文。
表作文表格(Table)可以使大量数据系统化, 便于阅读、比较。
表格常由标题(Title)、表头(Boxhead)(表格旳第一行)、侧目(Stub)(表格左边旳第一列)和主体(Body)部分(表格旳其他部分)等部分构成。
如下表:用表格体现旳信息详细精确, 并且表格中旳各项均按一定规律排列。
阅读表格时要注意找出表格中各个项目旳互相关系, 表格中各个项目旳变化规律。
例如, 上面旳表格中旳数字阐明, 和1978年相比, 1983年大学入学旳人数在增长, 而小学旳入学人数在减少。
弄清晰这些变化规律也就读懂了表格旳内容。
图作文图作文又可分为三种: 圆形图作文、曲线图作文和条状图作文。
(1) 圆形图作文圆形图(Pie chart)也称为饼状图或圆面分割图。
圆形图由于比较形象和直观, 各部分空间大小差异轻易辨别, 因此常用来表达总量和各分量之间旳比例关系。
整个圆表达总量, 楔形块表达分量。
有时圆形图尚有数值表, 两者结合可把各分量表达得更精确、清晰。
例如:Thi.i..pi.char.o.th.averag.weekl.expenditur.o..famil.i.Grea.Britain.A.ca.b.se.fr o.th.chart.th.mai.expenditur.o.a.averag.Britis.famil.i.spen.o.food.whic.account. fo.25.o.it.tota.expenditure.Th.nex.tw.significan.expendin.item.ar.transpor.an.ho using.whic.ar.15.an.12.respectively.I.w.tak.int.accoun.clothin.an.footwear.whic. make.u.10%.th.fou.essential.o.life.tha.is.food.transport.housing.an.clothin.an.f ootwear.amoun.t.62.o.th.tota.expenditure.(2) 曲线图作文曲线图(Line graph)也称为线性图或坐标图。
图表作文图表作文提示部分包括图表和文字要点提示两部分。
图表的类型主要有:圆形(饼型)图(pie chart)、柱形图(直型图)(graph)、曲线图(chart)和数据统计表(表格)(table)。
图表作文的写作容包括综合理解、客观详述和主观表达。
模板一①总的趋势②图表具体描述③剖析图表所揭示的含义④理由一⑤理由二⑥理由三⑦理由四⑧总结⑨前景预测As can be seen from the table, the past decade has witnessed dramatic changes in ①______. While②_______. It is obvious from the table that③_________.What contributed to these changes?I think the reasons are as follows.To start with,④______. Secondly,⑤______ . What’s more,⑥ _______. Last but not least,⑦________.In conclusion,⑧_________. Moreover,⑨ ________.文: How People Spent Their HolidaysYear 1990 1995 2000Traveling 37% 51% 76%Staying at home 63% 49% 24%1.上图所示为1990、1995、2000年某城市人们度假方式的情况,请描述其变化:2.请说明发生这些变化的原因。
3.得出结论。
How People Spent Their HolidaysAs can be seen from the table,the past decade have witnessed dramatic changes in the way people spent their holiday between 1990 and 2000.In 1990, 63% of people spent their holidays at home,while the figure dropped considerably to24%in2000.It is obvious from the table that people tended to be more and more mobile,and they wanted to get entertainment in the outside world.What contributed to these changes?I think the reasons are as follows.To start with,with the rapid development of economy,people earn by far more money than they used to.Thus,people are able to afford traveling expenses.Secondly,people thinkit important to get well-informed about the outside world in this new era when everything is on the move.Traveling,of course,is a sure way to achieve this goal. What's more, in this competitive society, people are usually under great stress. However,it is not difficult to find traveling an effective way to relieve people's stress and get st but not least,by traveling outside,people are closeto nature, which is not only beneficial to both their health and peace of mind.In conclusion, people prefer to go traveling rather than stay at home during holidays for a combination of reasons.Moreover,it seems that this trend will lastin the foreseeable future.模板二①描述图表②分三方面解释原因③下结论1)During the period from_______to_______,________rose from________to_______,while _______ decreased from _______ to _______.2)We believe that three reasons can account for this phenomenon.First,____.Second,____. Third, _____.3) ___.We are happy to see that things are becoming better and better nowadays. We can imagine that ___.文: Health Gains in Developing Countries1.以下图为依据描述发展中国家的期望寿命(1ife expectancy)和婴儿死亡率(infant mortality)的变化情况2.说明引起变化的各种原因Health Gains in Developing CountriesDuring the period from1960to1990,the life expectancy of developing countries rose from 40 years to nearly 60 years, while infant mortality decreased from 200 deaths per 1000 births to around 100.We believe that three reasons can account for this phenomenon. First, economy develops quickly in developing countries during this period, and living quality improves significantly as a result.Second,people's health conditions also become better and better with the development of national health care systems. When they become richer and richer, they care more about personal health conditions. Third, medical sciences also develop at a fantastic speed,and it is much safer for mothersto give birth.We are happy to see that things are becoming better and better nowadays.We can imagine that people will live longer and the infant mortality will again fall. [1996.6. CET-6]模板三①描述图表②解释图表③补充解释1)During the period between_______and________,________declined abruptly from_______ to ________, while ________ increased sharply from ________ to _______. 2)Several reasons can account for this pared with_________is much cheaper and more convenient__________ . Apart from that, _________.3) However, there are still a number of people who _________, generally for two reasons. On one hand,________. On the other hand, ________.文: Film Is Giving Way to TV1.电影观众越来越少2.电视观众越来越多,因为……3.然而,还是有人喜欢看电影,因为……Film Is Giving Way to TVDuring the period between1975and1985,film-goers declined abruptly from85,000to about12,000,while TV-watchers increased sharply from5,000to more than100,000.Several reasons can account for this phenomenon. Compared with a film, TV is much cheaper and more convenient--you don't have to leave your house at all.Apart from that, you have many choices while watching TV, but a film concentrates on a certain topic.However, there are still a number of people who enjoy going to the cinema,generally for two reasons. On the one hand, the audio-visual effect of a cinema is much better. On the other hand, in a quiet and comfortable place such as a cinema,you can concentrate on what you are watching and get the most of the film.作业:2002年06月英语四级写作试题Directions: For this part, you are allowed thirty minutes to write a composition on the topic Student Use of Computers.You should write at least 120words,and base your composition on the chart and the outline given below:181614121086420三维柱形图 11990199520001.上图所示为1990年、1995年、2002年某校大学生使用计算机的情况,请描述其变化;2.请说明发生这些变化的原因(可从计算机的用途、价格或社会发展等方面加以说明);3.你认为目前大学生在计算机使用中有什么困难或问题。
英语四级图表作文真题英文回答:As our world rapidly evolves, technology has become an integral part of our lives, shaping the way we interact, learn, and work. The internet, in particular, has emerged as a powerful force, connecting people across borders and providing access to a vast pool of information. However, the increasing dependence on technology also raises questions about its impact on our well-being and the nature of human relationships. This essay explores both the potential benefits and drawbacks of technology, delving into its influence on communication, education, and mental health.Technology has undoubtedly revolutionized the way we communicate. Social media platforms, messaging apps, and video conferencing tools have made it easier than ever to stay connected with friends and family, regardless of distance. The ability to share thoughts, experiences, andupdates in real-time fosters a sense of community and belonging. Furthermore, technology enables us to reach a wider audience, allowing us to connect with like-minded individuals and engage in global conversations.However, the constant connectivity that technology provides can also have its downsides. The deluge of notifications, messages, and updates can be overwhelming, leading to feelings of anxiety and stress. Additionally, spending excessive time on social media platforms can foster a culture of comparison and self-doubt, as individuals may constantly measure their lives against the curated experiences they see online.中文回答:随着世界快速发展,技术已成为我们生活中不可或缺的一部分,塑造着我们互动、学习和工作的方式。
英语四级作文图表真题Title: Analysis of a Sample English Proficiency Test Question。
In response to the given prompt regarding the English proficiency test question, let's delve into the analysis of the provided chart and formulate an essay accordingly.The chart illustrates the distribution of different leisure activities among people of various age groups. To delve into the specifics, it categorizes age groups intofive segments: under 18, 18-35, 36-55, 56-75, and over 75. Meanwhile, the leisure activities encompass sports, reading, watching TV, socializing, and other activities.Firstly, it's evident from the chart that the younger age groups, particularly those under 18 and in the 18-35 range, exhibit a significant inclination towards sports. This inclination gradually diminishes as age increases. One plausible explanation could be the youthful vigor andenthusiasm often associated with sports activities, which tend to wane as individuals grow older and encounter more responsibilities. Additionally, the 18-35 age bracket also shows a notable interest in socializing, which aligns with the typical lifestyle of young adults seeking social connections and networking opportunities.Secondly, the preference for reading seems to peak among individuals aged 36-55, constituting the highest proportion within this age range. This trend could be attributed to various factors, including career advancement, personal development, and leisurely pursuits. Middle-aged adults often find solace and enrichment in reading, whether it's for professional growth or sheer enjoyment.Thirdly, watching TV emerges as a prevalent leisure activity across all age groups, albeit with varying degrees of engagement. It serves as a ubiquitous form of entertainment and relaxation accessible to people of all ages. However, its prominence tends to diminish slightly among younger age groups, possibly due to alternative forms of digital entertainment such as online streaming platformsand social media.Lastly, the category of "other activities" exhibits a relatively consistent distribution across age groups, indicating a diverse range of leisure pursuits beyond the conventional options listed in the chart. These activities could encompass hobbies, arts and crafts, gardening, traveling, or any other personalized leisure endeavors tailored to individual preferences and interests.In conclusion, the chart provides valuable insightsinto the leisure preferences of different age demographics. While certain activities like sports and socializing resonate more strongly with younger cohorts, others like reading appeal to a broader spectrum of age groups, reflecting diverse interests and lifestyles. Understanding these trends can inform targeted strategies for leisure industry stakeholders and facilitate the design of recreational programs tailored to specific age demographics' preferences and needs.This analysis underscores the dynamic interplay betweenage, leisure preferences, and lifestyle choices, highlighting the multifaceted nature of human leisure behavior. By discerning these patterns, policymakers, marketers, and educators can better cater to the evolving leisure needs of diverse populations, thereby fostering a more inclusive and enriching leisure landscape for all.。
英语四级考试写作图表作文模板图表作文模板①As can be clearly seen from the graph/table/chart,great changed have taken place in __________ ①图表显示的情况Or: As is shown in the table/figure, .②The __________ have/has skyrocketed/jumped from _____ to _____. ② 描述变化③When it comes to the reasons for the changes, different people give different explanations. Here I shall just give a few. ③概述原因④To begin with, . ④ 原因之一⑤What’s more, . ⑤原因之二⑥Last but not least, . ⑥ 原因之三⑦While it is desirable that ___________, there are still some problemsand difficulties for __________ ⑦话题转移⑧Firstly, __________ ⑧要点一⑨In addition, __________ ⑨要点二⑩In a word, __________ ⑩总结补充:1.As we can see from the chart/graph/table/diagram…2.The chart/graph/table/diagram shows that…As is shown in…; According to…; As can be seen in…3. This chart/graph/table/diagram shows a great/sharp/sudden/slow/rapid…. increase/drop...4. To make a generalization; on the whole; in general/generally speaking5. 表示增长、上升的词汇increase, rise, climb, go up, soar, skyrocket,副词:sharply, remarkably, obviously, significantly, gradually, slowly6. 表示下降、减少的词汇decrease, drop, fall, go down, decline7. 表示持续不变的词汇level off;remain steady/unchanged8. 表示倍数的词汇double; triple the number of/the percentage of; four/five times9. 表示多少的词汇a little/ much/ a lot more/less than…, over…大学英语四六级作文模板2008/12/14 04:44 P.M.在CET4/6试题中,有两个拉分最厉害的部分,一是听力题,一是作文题。
(表)/graph(图表,曲线图)/diagram(图表)/chart(图表)Pie chart(饼状图)/bar graph(柱状图)/line graph(曲线图)2.开头的常常利用表达⑴It can be seen from the diagram that...⑵It has been shown from the figures that...⑶It is clear/ apparent from the figures/statistics that…⑷It is clear/ apparent from the table/chart/diagram/graph figures that…⑸The table/chart/diagram/graph shows that…⑹The table/chart/diagram/graph shows/describes/illustrates how…⑺According to the table/chart/diagram/graph,⑻As is shown in the table/chart/diagram/graph,⑼As is vividly betrayed in the table/chart/diagram/graph above,⑽As can be seen from the table/chart/diagram/graph that…⑾From the table/chart/diagram/graph, we can find that…⑿We can see from the chart (table/graph/figures/statistics) that...For example:⑴As is shown by the graph, there has been a rapid increase in the population of the country in the past fiveyears.⑵It can be concluded from the graph that there has been a great decline in birth rates in China in the pastfive years.⑶From the statistics given in the table it can be seen that the average personal income of the Chinesepeople increased (grew 、rose) rapidly from 1985 to 1990.This bar chart describes significant changes in the ownership of houses in a big city in China. It can be seen from the chart that a very noticeable trend from 1990 to 2000 was the dramatic increase in the privateownership of houses as opposed to the huge drop in the state ownership of houses. In 1990, three out of four houses were state-owned. However, by 2000, the percentage of the ownership of private houses has soared to 80%.The above chart reveals that the huge expansion in the private house ownership has been accompanied by a corresponding fall in the state ownership of houses in a span of a decade. (1990-2000)As is suggested ( unfolded / demonstrated / illustrated / mirrored ) in the above chart, with the sharp rise in the private ownership of houses, the state ownership of houses has dramatically ( substantially / alarmingly ) dropped in a passage of a decade. (1990-2000)According to the above chart, there has been a drastic growth in the private ownership of houses, while the state ownership of houses has shrunk steeply over the past decade. ( 1990-2000)From the above chart, we can see distinctly that the private ownership of houses has witnessed an huge rise as distinct from ( as opposed to / in contrast to / in comparison with ) the drastic decrease in the state ownership of houses in a matter of a decade. (1990-2000)2.图表数据描述的常常利用表达1.上升趋势⑴The number of …has increased/rose slightly/slowly/gradually/steadily/significantly/rapidly/dramatically/steeply/suddenly…from…year to…year/ between…year and…year.⑵The number of …has soared/rocketed to/over…in …year/in the year of…⑶There was a very sudden/rapid/dramatic/significant/sharp/steady gradual/slow/slight increase/rise in thenumber of …from…year to…year/ between…year and…year.For example:⑴The number of teaching staff members in this school has decreased to 700 persons.⑵The number of paticipants grew up to 300000 persons.⑶The number of colour TV sets produced by the factory increased (rose , grew , climbed) from 5000 in 1986 to 21000 in 1990.2.下降趋势The number of …has decreased/fallen/dropped slightly/slowly/gradually/steadily/significantly/rapidly/dramatically/steeply/suddenly…from…year to…year/ between…year and…year.There was a very sudden/steep/rapid/dramatic/significant/sharp/steady gradual/slow/slight decrease /decline/reduction/fall/drop in the number of …from…year to…year/ between…year and…year.3.先上升后下降的句型:...... increased slowly during…… and …… but fell sharply in …….A steady increase in …… during …… and …… followed the sharp fall in …….4.先下降后上升的句型:…… fell before …… began to make a recovery ………… continue the recovery, climbing to ………… dropped during …… but increased again in ………… fell and then pick up during ………… collapsed before rising to ……at the end of ……5.波动There was a minor fluctuation between……remained fairly steady fluctuating between…and ……… fluctuated sharply all through ……6.稳固The number of …remained steady/stable from…year to…year/ between…year and…year.The number of…stayed the same from…year to…year/ between…year and…year.There was little change/hardly any change/no change in the number of…from…year to…year/ between…year and…year.… hardly changed through the period between ……and …3.结尾的常常利用表达As the report indicates…One of the most surpris ing finds was…Overall, the chart demonstrate that…From the diagram it can be safely concluded that…In conclusion, …In summary, we can see that…I. 上图所示为某校大学生平均每周利用运算机的时刻: 1990年(2 hours)、1995年(4 hours)、2002年(14 hours),请描述其转变;II. 请说明发生这些转变的缘故(可从运算机的用途、价钱或社会进展等方面加以说明);III. 你以为目前大学生在运算机利用中有什么困难或问题。
图表分析型英语作文Sample 1 More Candidates for Civil Servants1. 根据下图描述报考公务员人数变化的趋势2. 分析导致这种趋势的原因3. 你的建议1,000,0002003 2004 2005As is shown in the bar chart, the number of applicants for civil servants has increased abruptly —by about 10 times, from 100,000 in 2003 to 1,000,000 in 2005.Several factors may contribute to the rush. First and foremost, working as civil servants in China is relatively stable, and Chinese people have atraditional preference for maintaining a life-long career. The rising interest could also be attributed to the unique social status. Comparatively speaking , civil servants are generally highly respected by common people in China. Last, we should not neglect the benefits such as the welfare in government departments.Compared with the striking number of applicants for becoming civil servants, the vacancies issued by the government are scarce. Thus, it is suggested that applicants should weigh their own advantages andSample 2 College Students’ Bookli st1.这是一所大学里学生所购书籍的变化2.你对于学生选择书记类别变化的评价3.哪类书籍你买得比较多?说明原因.The table shows the changes of students’ choices of various kindsof books from1985 to 2005. Obviously enough, the number of novels and books of philosophy and society has declined gradually, with that of foreign languages books and computer science ones enjoying much more popularity.Though different readers have their own particular tastes, this phenomenon involves several complicated factors. Firstly, nowadays, most of the college students tend to buy more books concerning foreign languages learning and computer-science, mainly because there is a pressing need of foreign languages and computer skills for their future employment. Secondly, novels are still popular though the selling number decreased thanks to the availability of the Internet. Most of popular books could be read on line.I always buy books of computer science, firstly because it is my major. Secondly, it is well known that computer science often witnesses the fastest changes, thus in order to keep up with the pace, I haveSample 3 Directions:For this part, you are allowed 30 minutes to write a composition on the topic How People Spend Their Holidays. You should write at least 120 words, and base your composition on the table andthe outline given below:1、根据上表,简要描述1990年、1995年、2000年某城市人们度假方式的情况及其变化;2、请说明发生这些变化的原因;3、得出结论。
英语四级图表类作文The bar chart shows the percentage of different age groups participating in regular physical activities. As can be seen from the chart, the age group of 18-24 has the highest percentage of participation, at around 70%, while the age group of 65 and above has the lowest percentage, at only 20%.Looking at the pie chart, it illustrates the distribution of different types of physical activities among participants. It is clear that walking is the most popular activity, accounting for 40% of all activities, followed by swimming at 25%, and cycling at 20%. Other activities, such as running and yoga, make up the remaining 15%.The line graph presents the changes in the percentage of people engaging in physical activities over a period of 10 years. It shows a steady increase in participation from 2010 to 2015, followed by a slight decline from 2015 to 2020. However, the overall trend is still on the rise.In conclusion, the charts provide valuable insights into the participation and preferences of physical activities among different age groups. It is evident that walking is the most favored activity, and there has been a general increase in participation over the years.。
大学英语四级考试图表作文1、图形种类及概述法:饼图:pie chart 直方图或柱形图:bar chart / histogram表格图:table 趋势曲线图:line chart / curve diagram泛指一份数据图表:a data graph/chart/diagram/illustration/table2、图表中的数据(Data )具体表达法数据(Data )在某一个时间段固定不变:fixed in time在一系列的时间段中转变:changes over time3. 持续变化的data 在不同情况下:增加:increase / raise / rise / go up 减少:shrink/decrease / drop / fall …波动:fluctuate / undulate / wave 稳定:remain stable / stabilize / level off 4. 最常用的两种表达法:动词+副词形式(Verb+Adverb form)形容词+名词形式(Adjective+Noun form )5. 图表常用动词:show 、describe 、illustrate 、can be seen from、clear 、apparent 、reveal 、represent 、demonstrate6. 图表常用名词:figure 、statistic 、number 、percentage 、proportion7、表示数据变化的单词或者词组rapid/rapidly 迅速的,飞快的, dramatic/dramatically 戏剧性的,significant/significantly 有意义的,重大的,stable/stably 稳定的sharp/sharply 锐利的,明显的,急剧的 steep/steeply 急剧升降的steady/steadily 稳固的,坚定不移的 slight/slightly 轻微的、略微地gradual/gradually 渐进的,逐渐的 slow/slowly 缓慢的,不活跃的8、其它在描述中的常用到的词significant changes 图中一些较大变化, noticeable trend 明显趋势during the same period 在同一时期, distribute 分布,区别 in contrast 相反,大不相同, market forces 市场规率forecast n. 先见,预见v. 预测 measure n.方法,措施 v. 估量,调节9. 图表写作套句精选1 the table shows the changes in the number of……over the periodfrom……to…… 该表格描述了在……年之……年间……数量的变化。
2 the bar chart illustrates that…… 该柱状图展示了……3.the graph provides some interesting data regarding…该图为我们提供了有关…有趣数据4.the diagram shows (that )…… 该图向我们展示了……5.the pie graph depicts (that )…… 该圆形图揭示了……6 .this is a cure graph which describes the trend of…这个曲线图描述了…的趋势7.the figures/statistics show (that )…… 数据(字)表明……8 .the tree diagram reveals how…… 该树型图向我们揭示了如何……9.the data/statistics show (that )…… 该数据(字)可以这样理解……10 .the data/statistics/figures lead us to the conclusion that……这些数据资料令我们得出结论……11.as is shown/demonstrated in the diagram/table…… 如图所示……12.as can be seen from the graph,the two curves show the fluctuation of… 如图所示,两条曲线描述了……的波动情况。
13 .according to the chart/figures…… 根据这些表(数字)……14.as can be seen from the diagram,great changes have taken place in…… 从图中可以看出,……发生了巨大变化。
15.from the table we can see clearly that…or it is clear from the chart that 从图表我们可以很清楚(明显)看到……16 .this is a graph which illustrates…… 这个图表向我们展示了……17 .this table shows the changing proportion of a & b from……to…… 该表格描述了……年到……年间a 与b 的比例关系。
18.the graph,presented in a pie chart, shows the general trend in…… 该图以圆形图形式描述了……总的趋势。
19 .this is a column chart showing…… 这是个柱型图,描述了……20 .over the period from…to…the…remained level. 在……至……期间……基本不变。
21. ...(year )witnessed/saw a sharp rise in…… ……年……急剧上升22 .in the year between……and…… 在……年到……期间……23).in the 3 years spanning from 1995 through 1998… 1995年至1998三年里……24). the difference between a and b lies in…… a 与b 之间的差别在于……25).the number of……remained steady/stable from (month/year)……月(年)至……月(年)……的数量基本不变。
26).the number sharply went up to…… 数字急剧上升至……27).the percentage of……stayed the same between……and…………至……期间……的比率维持不变。
28. the figures peaked at…in(month/year)……的数目在……月(年)达到顶点为……29 .the percentage remained steady at…… 比率维持在……30 .the percentage of…is sightly larger than that of… …的比例比…的比例略高31 .the re is not a great deal of difference between…and ……与……的区别不大。
32.the graphs show a threefold increase in the number of…该图表表明…的数目增长了三倍33 . …decreased year by year while…increased steadily.…逐年减少,而…逐步上升。
34.the situation reached a peak(a high point at) of[%].……的情况(局势)到达顶(高)点,为……百分点。
35. the figures/situation bottomed out in…… 数字(情况)在……达到底部。
36.the figures reached the bottom/a low point 数字(情况)达到底部(低谷)。
37. a is ……times as much/many as b. a 是b 的……倍。
38. a increased by…… a 增长了…… ( a increased to…… a 增到……41 .th ere is an upward trend in the number of…… ……数字呈上升趋势。
42.a considerable increase/decrease occurred from…to… …到…发生急剧上升。
43 .from……to……, the rate of decrease slow down. 从……到……,下降速率减慢。
44)from this year on,there was a gradual declining reduction in the……,reac hing a figure of…… 从这年起,……逐渐下降至……45).be similar to…… 与……相似47).there are a lot similarities/differences between……and…………与……之间有许多相似(不同)之处48). a has something in common with b a 于b 有共同之处。
Sample:car market of China. Based upon the data of the chart, one can see that the percentage of domestic cars , while the sales percentage of cars make in Japan . 2008, the percentage of cars made in China a it went up to nearly 33%. The percentage of cars made in Japan 35%, while it in 2009.civil products foreign ones. It’s reported that, approximately 55% of families in Chinese big cities are fond of cars made in China. support our native industries. Last but not the least, the face cannot be ignored that, the cars made in China are increasingly qualified.Samplein communication, body language , voice qualities, and words . Basically, I this estimate. body languagevoice words However, words are much more than 7% in its role. My estimate is that the impact from words is between 15% to 20%, voice from 35% to 40%, and body language from 40% to 50%.I believe the appropriate use of body language is very useful in daily communication. Once I heard someone complaining about something with a smiling face instead of an angry expression. The speaker successfully conveyed what he wanted to convey without causing much discomfort to the listener.As for voice, I also think it is very important. For example, when you are sound asleep in the early morning, your mother knocks at your door repeatedly and shouts at you angrily: "Get up! Hurry up!" You must be very unhappy. But if she knocked at your door, and speaks softly: "Honey! Time to get up" with a rising tone, you might wake up with a better mood. So I think that words, comparatively speaking, are the least important. What is more important is the way you say it.。