无线传感器网络测距技术外文翻译文献
- 格式:doc
- 大小:407.60 KB
- 文档页数:13

中英文资料外文翻译文献外文资料AbstractWireless Sensor Network (WSN) has become a hot research topic recently. Great benefit can be gained through the deployment of the WSN over a wide range ofapplications, covering the domains of commercial, military as well as residential. In this project, we design a counting system which tracks people who pass through a detecting zone as well as the corresponding moving directions. Such a system can be deployed in traffic control, resource management, and human flow control. Our design is based on our self-made cost-effective Infrared Sensing Module board which co-operates with a WSN. The design of our system includes Infrared Sensing Module design, sensor clustering, node communication, system architecture and deployment. We conduct a series of experiments to evaluate the system performance which demonstrates the efficiency of our Moving Object Counting system.Keywords:Infrared radiation,Wireless Sensor Node1.1 Introduction to InfraredInfrared radiation is a part of the electromagnetic radiation with a wavelength lying between visible light and radio waves. Infrared have be widely used nowadaysincluding data communications, night vision, object tracking and so on. People commonly use infrared in data communication, since it is easily generated and only suffers little from electromagnetic interference. Take the TV remote control as an example, which can be found in everyone's home. The infrared remote control systems use infrared light-emitting diodes (LEDs) to send out an IR (infrared) signal when the button is pushed. A different pattern of pulses indicates the corresponding button being pushed. To allow the control of multiple appliances such as a TV, VCR, and cable box, without interference, systems generally have a preamble and an address to synchronize the receiver and identify the source and location of the infrared signal. To encode the data, systems generally vary the width of the pulses (pulse-width modulation) or the width of the spaces between the pulses (pulse space modulation). Another popular system, bi-phase encoding, uses signal transitions to convey information. Each pulse is actually a burst of IR at the carrier frequency.A 'high' means a burst of IR energy at the carrier frequency and a 'low'represents an absence of IR energy. There is no encoding standard. However, while a great many home entertainment devices use their own proprietary encoding schemes, some quasi-standards do exist. These include RC-5, RC-6, and REC-80. In addition, many manufacturers, such as NEC, have also established their own standards.Wireless Sensor Network (WSN) has become a hot research topic recently. Great benefit can be gained through the deployment of the WSN over a wide range ofapplications, covering the domains of commercial, military as well as residential. In this project, we design a counting system which tracks people who pass through a detecting zone as well as the corresponding moving directions. Such a system can be deployed in traffic control, resource management, and human flow control. Our design is based on our self-made cost-effective Infrared Sensing Module board which co-operates with a WSN. The design of our system includes Infrared Sensing Module design, sensor clustering, node communication, system architecture and deployment. We conduct a series of experiments to evaluate the system performance which demonstrates the efficiency of our Moving Object Counting system.1.2 Wireless sensor networkWireless sensor network (WSN) is a wireless network which consists of a vast number of autonomous sensor nodes using sensors tomonitor physical or environmental conditions, such as temperature, acoustics, vibration, pressure, motion or pollutants, at different locations. Each node in a sensor network is typically equipped with a wireless communications device, a small microcontroller, one or more sensors, and an energy source, usually a battery. The size of a single sensor node can be as large as a shoebox and can be as small as the size of a grain of dust, depending on different applications. The cost of sensor nodes is similarly variable, ranging from hundreds of dollars to a few cents, depending on the size of the sensor network and the complexity requirement of the individual sensor nodes. The size and cost are constrained by sensor nodes, therefore, have result in corresponding limitations on available inputs such as energy, memory, computational speed and bandwidth. The development of wireless sensor networks (WSN) was originally motivated by military applications such as battlefield surveillance. Due to the advancement in micro-electronic mechanical system technology (MEMS), embedded microprocessors, and wireless networking, the WSN can be benefited in many civilian application areas, including habitat monitoring, healthcare applications, and home automation.1.3 Types of Wireless Sensor NetworksWireless sensor network nodes are typically less complex than general-purpose operating systems both because of the specialrequirements of sensor network applications and the resource constraints in sensor network hardware platforms. The operating system does not need to include support for user interfaces. Furthermore, the resource constraints in terms of memory and memory mapping hardware support make mechanisms such as virtual memory either unnecessary or impossible to implement. TinyOS [TinyOS] is possibly the first operating system specifically designed for wireless sensor networks. Unlike most other operating systems, TinyOS is based on an event-driven programming model instead of multithreading. TinyOS programs are composed into event handlers and tasks with run to completion-semantics. When an external event occurs, such as an incoming data packet or a sensor reading, TinyOS calls the appropriate event handler to handle the event. The TinyOS system and programs are both written in a special programming language called nesC [nesC] which is an extension to the C programming language. NesC is designed to detect race conditions between tasks and event handlers. There are also operating systems that allow programming in C. Examples of such operating systems include Contiki [Contiki], and MANTIS. Contiki is designed to support loading modules over the network and supports run-time loading of standard ELF files. The Contiki kernel is event-driven, like TinyOS, but the system supports multithreading on a per-application basis. Unlike the event-driven Contiki kernel, the MANTIS kernel is based on preemptivemultithreading. With preemptive multithreading, applications do not need to explicitly yield the microprocessor to other processes.1.4 Introduction to Wireless Sensor NodeA sensor node, also known as a mote, is a node in a wireless sensor network that is capable of performing processing, gathering sensory information and communicating with other connected nodes in the network. Sensor node should be in small size, consuming extremely low energy, autonomous and operate unattended, and adaptive to the environment. As wireless sensor nodes are micro-electronic sensor device, they can only be equipped with a limited power source. The main components of a sensor node include sensors, microcontroller, transceiver, and power source. Sensors are hardware devices that can produce measurable response to a change in a physical condition such as light density and sound density. The continuous analog signal collected by the sensors is digitized by Analog-to-Digital converter. The digitized signal is then passed to controllers for further processing. Most of the theoretical work on WSNs considers Passive and Omni directional sensors. Passive and Omni directional sensors sense the data without actually manipulating the environment with active probing, while no notion of “direction” involved in these measurements. Commonly people deploy sensor for detecting heat (e.g. thermal sensor), light (e.g. infrared sensor), ultra sound (e.g. ultrasonic sensor), or electromagnetism (e.g. magneticsensor). In practice, a sensor node can equip with more than one sensor. Microcontroller performs tasks, processes data and controls the operations of other components in the sensor node. The sensor node is responsible for the signal processing upon the detection of the physical events as needed or on demand. It handles the interruption from the transceiver. In addition, it deals with the internal behavior, such as application-specific computation.The function of both transmitter and receiver are combined into a single device know as transceivers that are used in sensor nodes. Transceivers allow a sensor node to exchange information between the neighboring sensors and the sink node (a central receiver). The operational states of a transceiver are Transmit, Receive, Idle and Sleep. Power is stored either in the batteries or the capacitors. Batteries are the main source of power supply for the sensor nodes. Two types of batteries used are chargeable and non-rechargeable. They are also classified according to electrochemical material used for electrode such as NiCd(nickel-cadmium), NiZn(nickel-zinc), Nimh(nickel metal hydride), and Lithium-Ion. Current sensors are developed which are able to renew their energy from solar to vibration energy. Two major power saving policies used areDynamic Power Management (DPM) and Dynamic V oltage Scaling (DVS). DPM takes care of shutting down parts of sensor node which arenot currently used or active. DVS scheme varies the power levels depending on the non-deterministic workload. By varying the voltage along with the frequency, it is possible to obtain quadratic reduction in power consumption.1.5 ChallengesThe major challenges in the design and implementation of the wireless sensor network are mainly the energy limitation, hardware limitation and the area of coverage. Energy is the scarcest resource of WSN nodes, and it determines the lifetime of WSNs. WSNs are meant to be deployed in large numbers in various environments, including remote and hostile regions, with ad-hoc communications as key. For this reason, algorithms and protocols need to be lifetime maximization, robustness and fault tolerance and self-configuration. The challenge in hardware is to produce low cost and tiny sensor nodes. With respect to these objectives, current sensor nodes usually have limited computational capability and memory space. Consequently, the application software and algorithms in WSN should be well-optimized and condensed. In order to maximize the coverage area with a high stability and robustness of each signal node, multi-hop communication with low power consumption is preferred. Furthermore, to deal with the large network size, the designed protocol for a large scale WSN must be distributed.1.6 Research IssuesResearchers are interested in various areas of wireless sensor network, which include the design, implementation, and operation. These include hardware, software and middleware, which means primitives between the software and the hardware. As the WSNs are generally deployed in the resources-constrained environments with battery operated node, the researchers are mainly focus on the issues of energy optimization, coverage areas improvement, errors reduction, sensor network application, data security, sensor node mobility, and data packet routing algorithm among the sensors. In literature, a large group of researchers devoted a great amount of effort in the WSN. They focused in various areas, including physical property, sensor training, security through intelligent node cooperation, medium access, sensor coverage with random and deterministic placement, object locating and tracking, sensor location determination, addressing, energy efficient broadcasting and active scheduling, energy conserved routing, connectivity, data dissemination and gathering, sensor centric quality of routing, topology control and maintenance, etc.中文译文移动目标点数与红外传感器网络摘要无线传感器网络(WSN)已成为最近的一个研究热点。
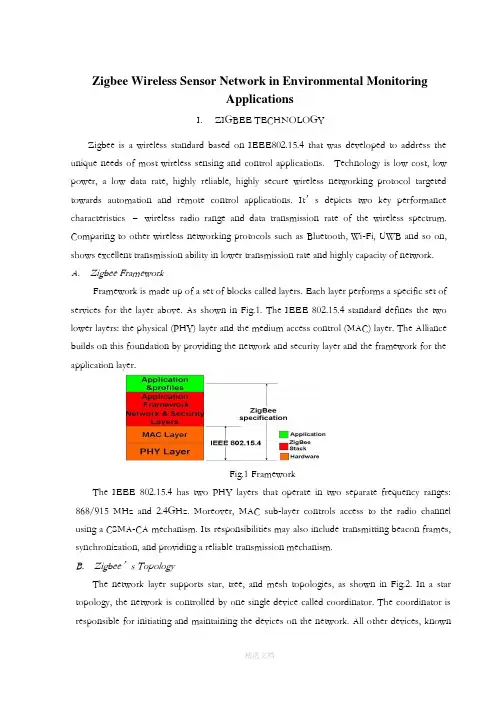
Zigbee Wireless Sensor Network in Environmental MonitoringApplicationsI. ZIGBEE TECHNOLOGYZigbee is a wireless standard based on IEEE802.15.4 that was developed to address the unique needs of most wireless sensing and control applications. Technology is low cost, low power, a low data rate, highly reliable, highly secure wireless networking protocol targeted towards automation and remote control applications. It’s depicts two key performance characteristics –wireless radio range and data transmission rate of the wireless spectrum. Comparing to other wireless networking protocols such as Bluetooth, Wi-Fi, UWB and so on, shows excellent transmission ability in lower transmission rate and highly capacity of network. A. Zigbee FrameworkFramework is made up of a set of blocks called layers.Each layer performs a specific set of services for the layer above. As shown in Fig.1. The IEEE 802.15.4 standard defines the two lower layers: the physical (PHY) layer and the medium access control (MAC) layer. The Alliance builds on this foundation by providing the network and security layer and the framework for the application layer.Fig.1 FrameworkThe IEEE 802.15.4 has two PHY layers that operate in two separate frequency ranges: 868/915 MHz and 2.4GHz. Moreover, MAC sub-layer controls access to the radio channel using a CSMA-CA mechanism. Its responsibilities may also include transmitting beacon frames, synchronization, and providing a reliable transmission mechanism.B. Zigbee’s TopologyThe network layer supports star, tree, and mesh topologies, as shown in Fig.2. In a star topology, the network is controlled by one single device called coordinator. The coordinator is responsible for initiating and maintaining the devices on the network. All other devices, knownas end devices, directly communicate with the coordinator. In mesh and tree topologies, the coordinator is responsible for starting the network and for choosing certain key network parameters, but the network may be extended through the use of routers. In tree networks, routers move data and control messages through the network using a hierarchical routing strategy. Mesh networks allow full peer-to-peer communication.Fig.2 Mesh topologiesFig.3 is a network model, it shows that supports both single-hop star topology constructed with one coordinator in the center and the end devices, and mesh topology. In the network, the intelligent nodes are composed by Full Function Device (FFD) and Reduced Function Device (RFD). Only the FFN defines the full functionality and can become a network coordinator. Coordinator manages the network, it is to say that coordinator can start a network and allow other devices to join or leave it. Moreover, it can provide binding and address-table services, and save messages until they can be delivered.Fig.3 Zigbee network modelII.THE GREENHOUSE ENVIRONMENTAL MONITORINGSYSTEM DESIGNTraditional agriculture only use machinery and equipment which isolating and no communicating ability. And farmers have to monitor crops’ growth by themselves. Even if some people use electrical devices, but most of them were restricted to simple communication between control computer and end devices like sensors instead of wire connection, which couldn’t be strictly defined as wireless sens or network. Therefore, by through using sensor networks and, agriculture could become more automation, more networking and smarter.In this project, we should deploy five kinds of sensors in the greenhouse basement. By through these deployed sensors, the parameters such as temperature in the greenhouse, soil temperature, dew point, humidity and light intensity can be detected real time. It is key to collect different parameters from all kinds of sensors. And in the greenhouse, monitoring the vegetables growing conditions is the top issue. Therefore, longer battery life and lower data rate and less complexity are very important. From the introduction about above, we know that meet the requirements for reliability, security, low costs and low power.A. System OverviewThe overview of Greenhouse environmental monitoring system, which is made up by one sink node (coordinator), many sensor nodes, workstation and database. Mote node and sensor node together composed of each collecting node. When sensors collect parameters real time, such as temperature in the greenhouse, soil temperature, dew point, humidity and light intensity, these data will be offered to A/D converter, then by through quantizing and encoding become the digital signal that is able to transmit by wireless sensor communicating node. Each wireless sensor communicating node has ability of transmitting, receiving function.In this WSN, sensor nodes deployed in the greenhouse, which can collect real time data and transmit data to sink node (Coordinator) by the way of multi-hop. Sink node complete the task of data analysis and data storage. Meanwhile, sink node is connected with GPRS/CDMA can provide remote control and data download service. In the monitoring and controlling room, by running greenhouse management software, the sink node can periodically receives the data from the wireless sensor nodes and displays them on monitors.B. Node Hardware DesignSensor nodes are the basic units of WSN. The hardware platform is made up sensor nodes closely related to the specific application requirements. Therefore, the most important work isthe nodes design which can perfect implement the function of detecting and transmission as a WSN node, and perform its technology characteristics. Fig.4 shows the universal structure of the WSN nodes. Power module provides the necessary energy for the sensor nodes. Data collection module is used to receive and convert signals of sensors. Data processing and control module’s functions are node device control, task sche duling, and energy computing and so on. Communication module is used to send data between nodes and frequency chosen and so on.Fig.4 Universal structure of the wsn nodesIn the data transfer unit, the module is embedded to match the MAC layer and the NET layer of the protocol. We choose CC2430 as the protocol chips, which integrated the CPU, RF transceiver, net protocol and the RAM together. CC2430 uses an 8 bit MCU (8051), and has 128KB programmable flash memory and 8KB RAM. It also includes A/D converter, some Timers, AES128 Coprocessor, Watchdog Timer, 32K crystal Sleep mode Timer, Power on Reset, Brown out Detection and 21 I/Os. Based on the chips, many modules for the protocol are provided. And the transfer unit could be easily designed based on the modules.As an example of a sensor end device integrated temperature, humidity and light, the design is shown in Fig. 5.Fig.5 The hardware design of a sensor nodeThe SHT11 is a single chip relative humidity and temperature multi sensor module comprising a calibrated digital output. It can test the soil temperature and humidity. The DS18B20 is a digital temperature sensor, which has 3 pins and data pin can link MSP430 directly. It can detect temperature in greenhouse. The TCS320 is a digital light sensor. SHT11, DS18B20 and TCS320 are both digital sensors with small size and low power consumption. Other sensor nodes can be obtained by changing the sensors.The sensor nodes are powered from onboard batteries and the coordinator also allows to be powered from an external power supply determined by a jumper.C. Node Software DesignThe application system consists of a coordinator and several end devices. The general structure of the code in each is the same, with an initialization followed by a main loop.The software flow of coordinator, upon the coordinator being started, the first action of the application is the initialization of the hardware, liquid crystal, stack and application variables and opening the interrupt. Then a network will be formatted. If this net has been formatted successfully, some network information, such as physical address, net ID, channel number will be shown on the LCD. Then program will step into application layer and monitor signal. If there is end device or router want to join in this net, LCD will shown this information, and show the physical address of applying node, and the coordinator will allocate a net address to this node. If the node has been joined in this network, the data transmitted by this node will be received by coordinator and shown in the LCD.The software flow of a sensor node, as each sensor node is switched on, it scans all channelsand, after seeing any beacons, checks that the coordinator is the one that it is looking for. It then performs a synchronization and association. Once association is complete, the sensor node enters a regular loop of reading its sensors and putting out a frame containing the sensor data. If sending successfully, end device will step into idle state; by contrast, it will collect data once again and send to coordinator until sending successfully.D. Greenhouse Monitoring Software DesignWe use VB language to build an interface for the test and this greenhouse sensor network software can be installed and launched on any Windows-based operating system. It has 4 dialog box selections: setting controlling conditions, setting Timer, setting relevant parameters and showing current status. By setting some parameters, it can perform the functions of communicating with port, data collection and data viewing。

传感器技术论文中英文对照资料外文翻译文献Development of New Sensor TechnologiesSensors are devices that can convert physical。
chemical。
logical quantities。
etc。
into electrical signals。
The output signals can take different forms。
such as voltage。
current。
frequency。
pulse。
etc。
and can meet the requirements of n n。
processing。
recording。
display。
and control。
They are indispensable components in automatic n systems and automatic control systems。
If computers are compared to brains。
then sensors are like the five senses。
Sensors can correctly sense the measured quantity and convert it into a corresponding output。
playing a decisive role in the quality of the system。
The higher the degree of n。
the higher the requirements for sensors。
In today's n age。
the n industry includes three parts: sensing technology。
n technology。
and computer technology。

Sensor technologyA sensor is a device which produces a signal in response to its detecting or measuring a property ,such as position , force , torque , pressure , temperature , humidity , speed , acceleration , or vibration .Traditionally ,sensors (such as actuators and switches )have been used to set limits on the performance of machines .Common examples are (a) stops on machine tools to restrict work table movements ,(b) pressure and temperature gages with automatics shut-off features , and (c) governors on engines to prevent excessive speed of operation . Sensor technology has become an important aspect of manufacturing processes and systems .It is essential for proper data acquisition and for the monitoring , communication , and computer control of machines and systems .Because they convert one quantity to another , sensors often are referred to as transducers .Analog sensors produce a signal , such as voltage ,which is proportional to the measured quantity .Digital sensors have numeric or digital outputs that can be transferred to computers directly .Analog-to-coverter(ADC) is available for interfacing analog sensors with computers .Classifications of SensorsSensors that are of interest in manufacturing may be classified generally as follows:Machanical sensors measure such as quantities aspositions ,shape ,velocity ,force ,torque , pressure , vibration , strain , and mass .Electrical sensors measure voltage , current , charge , and conductivity .Magnetic sensors measure magnetic field ,flux , and permeablity .Thermal sensors measure temperature , flux ,conductivity , and special heat .Other types are acoustic , ultrasonic , chemical , optical , radiation , laser ,and fiber-optic .Depending on its application , a sensor may consist of metallic , nonmetallic , organic , or inorganic materials , as well as fluids ,gases ,plasmas , or semiconductors .Using the special characteristics of these materials , sensors covert the quantity or property measured to analog or digital output. The operation of an ordinary mercury thermometer , for example , is based on the difference between the thermal expansion of mercury and that of glass.Similarly , a machine part , a physical obstruction , or barrier in a space can be detected by breaking the beam of light when sensed by a photoelectric cell . A proximity sensor ( which senses and measures the distance between it and an object or a moving member of a machine ) can be based on acoustics , magnetism , capacitance , or optics . Other actuators contact the object and take appropriate action ( usually by electromechanical means ) . Sensors are essential to the conduct of intelligent robots , and are being developed with capabilities that resemble those of humans ( smart sensors , see the following ).This is America, the development of such a surgery Lin Bai an example, through the screen, through a remote control operator to control another manipulator, through the realization of the right abdominal surgery A few years ago our country theexhibition, the United States has been successful in achieving the right to the heart valve surgery and bypass surgery. This robot has in the area, caused a great sensation, but also, AESOP's surgical robot, In fact, it through some equipment to some of the lesions inspections, through a manipulator can be achieved on some parts of the operation Also including remotely operated manipulator, and many doctors are able to participate in the robot under surgery Robot doctor to include doctors with pliers, tweezers or a knife to replace the nurses, while lighting automatically to the doctor's movements linked, the doctor hands off, lighting went off, This is very good, a doctor's assistant.Tactile sensing is the continuous of variable contact forces , commonly by an array of sensors . Such a system is capable of performing within an arbitrarythree-dimensional space .has gradually shifted from manufacturing tonon-manufacturing and service industries, we are talking about the car manufacturer belonging to the manufacturing industry, However, the services sector including cleaning, refueling, rescue, rescue, relief, etc. These belong to the non-manufacturing industries and service industries, so here is compared with the industrial robot, it is a very important difference. It is primarily a mobile platform, it can move to sports, there are some arms operate, also installed some as a force sensor and visual sensors, ultrasonic ranging sensors, etc. It’s surrounding environment for the conduct of identification, to determine its campaign to complete some work, this is service robot’s one of the basic characteristicsIn visual sensing (machine vision , computer vision ) , cameral optically sense the presence and shape of the object . A microprocessor then processes the image ( usually in less than one second ) , the image is measured , and the measurements are digitized ( image recognition ) .Machine vision is suitable particularly for inaccessible parts , in hostile manufacturing environments , for measuring a large number of small features , and in situations where physics contact with the part may cause damage .Small sensors have the capability to perform a logic function , to conducttwo-way communication , and to make a decisions and take appropriate actions . The necessary input and the knowledge required to make a decision can be built into a smart sensor . For example , a computer chip with sensors can be programmed to turn a machine tool off when a cutting tool fails . Likewise , a smart sensor can stop a mobile robot or a robot arm from accidentally coming in contact with an object or people by using quantities such as distance , heat , and noise .Sensor fusion . Sensor fusion basically involves the integration of multiple sensors in such a manner where the individual data from each of the sensors ( such as force , vibration , temperature , and dimensions ) are combined to provide a higher level of information and reliability . A common application of sensor fusion occurs when someone drinks a cup of hot coffee . Although we take such a quotidian event for granted ,it readily can be seen that this process involves data input from the person's eyes , lips , tongue , and hands .Through our basic senses of sight , hearing , smell , taste , and touch , there is real-time monitoring of relative movements , positions , and temperatures . Thus if the coffee is too hot , the hand movement of the cup toward the lip is controlled and adjusted accordingly .The earliest applications of sensor fusion were in robot movement control , missile flight tracking , and similar military applications . Primarily because these activities involve movements that mimic human behavior . Another example of sensor fusion is a machine operation in which a set of different but integrated sensors monitors (a) the dimensions and surface finish of workpiece , (b) tool forces , vibrations ,and wear ,(c) the temperature in various regions of the tool-workpiece system , and (d) the spindle power .An important aspect in sensor fusion is sensor validation : the failure of one particular sensor is detected so that the control system maintains high reliability . For this application ,the receiving of redundant data from different sensors is essential . It can be seen that the receiving , integrating of all data from various sensors can be a complex problem .With advances in sensor size , quality , and technology and continued developments in computer-control systems , artificial neural networks , sensor fusion has become practical and available at low cost .Movement is relatively independent of the number of components, the equivalent of our body, waist is a rotary degree of freedom We have to be able to hold his arm, Arm can be bent, then this three degrees of freedom, Meanwhile there is a wrist posture adjustment to the use of the three autonomy, the general robot has six degrees of freedom. We will be able to space the three locations, three postures, the robot fully achieved, and of course we have less than six degrees of freedomFiber-optic sensors are being developed for gas-turbine engines . These sensors will be installed in critical locations and will monitor the conditions inside the engine , such as temperature , pressure , and flow of gas . Continuous monitoring of the signals from thes sensors will help detect possible engine problems and also provide the necessary data for improving the efficiency of the engines .传感器技术传感器一种通过检测某一参数而产生信号的装置。
Wireless sensor network monitoring system designKang yi-mei,Zhao lei,Hu jiang,Yang en-bo(Study on Beijing University of Aeronautics and Astronautics)Summary: A car wireless sensor network monitoring system based on IEEE 802.15.4 and ZigBee standards. With universal wireless sensor networks, expansion of the scope of monitoring and monitoring functions for in-car system, car data acquisition and condition monitoring of equipment status and the necessary equipment control, topology control, topology query functions. Keywords: wireless sensor networks; monitoring systemIntroductionIn order to satisfy the people to car safety, handling and comfort requirements, vehicle integrated with more and more electronic system .At present, car electronic equipment is widely used 16 or 32-bit microprocessor control. Creating in-vehicle monitoring system based on IEEE 802.15.4 and ZigBee standard for wireless sensor networks, designed to achieve a more optimized wireless sensor networks, the progressive realization of the network of automotive systems, intelligent and controllable to provide high-Car System security.System designIn this paper, the existing vehicle system, the data transmission mode is extended to the wireless transmission mode, the realization of a star network data acquisition system. And can place each data acquisition node of the acquired data is transmitted to the gateway, the gateway through the serial port to upload data to the host computer, in the host data real-time waveform display, and method of database to preserve, for the follow-up data processing. The application of system object is composed of a temperature sensor, pressure sensor, speed sensor, speed sensor, a current sensor, pressure sensor, sensor subsystem. The purpose of this design is to use a monitoring host machine end to the detection of multiple target environment, taking into account the access data throughput and software system complexity, using time-division multiplexing way, one by one on the net terminal collecting point of control and data acquisition.As shown in Figure 1, the system is divided into 3 parts: Vehicle Monitoring Center, gateway and mobile sensor node. Gateway is the whole vehicle system core, and all vehicular sensor node communication. Vehicle monitoring center to the gateway sends a control command by the gateway, the control command is converted to an RF signal and sent to the vehicle sensor node. When the vehicle sensor nodes to transmit data, gateway into the data reception state, and upload data to the monitoring center for further processing. In addition, car between sensor nodes cannot communicate with each other. The monitoring center of the monitoring software and gateway in RS232standard interface for communication.Vehicle sensor node life cycle is active and dormant periods. Nodes in the active phase of the completion of data acquisition, data sent to the gateway, receiving andexecuting gateway command; in the dormant period off the wireless RF module in order to save energy, until the next active period. System through this mechanism of dormancy to reduce energy consumption, extend the time span of the system as a whole.The system used PC as the control center, PC machine monitoring software in VB development environment, is a dialog based application software. In order to improve the communication module of the intelligent level, in the design, its function is not limited to the real-time data display, all of the data collection by the monitoring software by sending a request signal to the trigger. Considering the original data for subsequent processing and in-depth analysis of the vehicle system, can accurately judge, software has also added data preservation of the document and data file display function.Generally speaking, the whole network are controlled by the host monitoring software, the working process of every node of the network is the need of human participation.2 hardware system design2.1application chip introductionMC13192with IEEE802.15.4 standard, the operating frequency is2.405~2.480 GHz, data transmission rate of 250kbps, using 0-QPSK debugging mode. This feature-rich two-way 2.4GHz transceiver with a data modem which can be in the ZigBee technology application. It also has an optimized digital core, helps to reduce the MCU processing power, shorten the cycle of execution.The main control MCU choose HCS08series of low power, high performance microprocessor MC9S08GB60. The processor has a 60Application of KB programmable Flash、4 KB RAM,10 ADC,8 channel2 asynchronous serial communication interface ( SCI ),1 synchronous serial interface ( SPI ) and I2C bus module, can fully meet the requirement of vehicle gateway and node processor requirements.2.2 MCl3192and MC9S08GB60hardware connectionMC13192and MC9S08GB60 hardware connection diagram as shown in figure 2. The MC13192control and data transmission on 4 wire serial peripheral interface ( SPI ) is completed, the4interface signals were MOS-I, MISO,, SPICLK. The main control MCU through the control signal exiting sleep mode or hibernation mode, through to reset the transceiver, through the RXTXEN to control the data sending and receiving, or force the transceiver into idle mode. The sensor output analog signal through MCU 8 Channel10 bit ADC conversion input to MCU. MCU via SPI MC13192to read and write operation, and the sensor to collect the signal processed by MC13192launch out. The MC13192 interrupt IRQ interrupt register through the pins and to judge the type of interrupt. MC908GB60 pin to control the MC13192 into a different mode of operation .Control of the sensor signal from the MC13192receiving antenna in, transmitted via SPI to MCU, after MCU judgment after processingthrough the GPIO port is transmitted to the sensor, complete control of the sensor. At the same time, MCU MC13192transceiver control and the MAC layer operation. The 3system software design3.1of overall software designThe software design is the design of the core, the key lies in the overall framework of software and data structure design. An important factor to consider is a efficiency, another is to design the clarity.System software consists of the gateway node and the sensor node is composed of two parts, the two parts are needed to complete the SMAC protocol transplantation, and according to the different needs for the upper communication applications with API interface function. Because the SMAC protocol stack programming model using hierarchical design, only the underlying PHY and MAC program level and related hardware, and network layer and application layer procedures is not affected by hardware effects. SMAC in different hardware platform transplantation only need to modify the PHY and MAC layer, each layer can shield the hardware differences directly run.As shown in Figure 3, the design of the software for system platform layer, protocol layer and application layer 3layer. At the same time, defines 3API interface: system layer interface, protocol layer and application layer interface. System level interface defines a hardware register mapping, so C language to be able to directly access the hardware registers to control hardware. System platform based on real-time operating system μC/II protocol layer, to provide system services Hardware driving module provides the hardware driver, all of the hardware control through the module to provide services. Platform layer protocol layer interface protocol layer to provide services. Protocol layer is based on the IEEE 802.15.4 physical layer and link layer based on the ZigBee network layer protocol. Application layer through the application layer interface to invoke services provided by the protocol layer, network management and data transfer tasks. Application of configuration module can call protocol layer to provide network services, will direct the system configuration and query, it is mainly through the AT commands to achieve, so the module calls the application layer interface and protocol layer interface to provide services.3.2sensor node software designBased on the long-term use of the functional requirements, sensor nodes in the software design is the key to achieve the required functions, and can minimize the energy consumption of the sensor nodes.It was found, ZigBee module and the energy consumption is much larger than the central processor and the energy consumption of sensor module. Therefore, the sensor node design of application software to try to make each module in a dormant state, and minimizing wakes ZigBee module number. Therefore, the sensor nodes, power of each functional module initialization is completed, and joined the network, enter the Sleep state, the central processor cycles to be timed wake-up to send data tothe gateway, and receives the gateway command. Sensor nodes of the workflow are shown in Figure 4.The 3.3 gateway node software designGateway downward management sensor node, to complete and PC monitoring center of interaction, the need for a complicated task management and scheduling, therefore, based on the uC / OS kernel of embedded operating system to manage the gateway, the application task efficiently provide good software support. According to gateway function demand, the μC / OS-II, SMAC protocol organic union, form a network operating environment, the user can conveniently on the basis of its development and application. Based on μC / OS-II extended gateway software platform structure is shown in figure 5. Based on μC / OS-II operating system, were used to build the system task SYS_task ( ), START_task ( SMAC star network task ), gateway and a sensor node interaction task COMM_task ( ), PC monitoring center port monitoring mission ( SER_task ) applications such as a series of tasks, thus realizing the gateway software application function.The 3.4 host monitoring software designThis system is the ultimate goal of the collected vehicle sensor data is transmitted in real-time to the host, and the host of display and preservation. Display is designed to get on-board sensor node monitoring environment of the initial situation, preservation is designed as an in-depth analysis of the data samples. In addition, the system as a whole the main prosecution and the data acquisition request initiator, need to be able to send the data request signal in accordance with the requirements of. According to the above requirements, VB environment in the development of a dialog based application. This application includes a 4 module:①data waveform display module. The role of the module is a form of waveform data of the node to be displayed in real-time, it is the use of MS Chart and Timer control.②topology display module. When the user wants to know the wireless sensor network topology construction situation, you can view the topological information, understanding of network nodes join and loss.The historical data display module. In vehicle network system to a certain period of the past, may need a certain period of time the original data for subsequent processing and in-depth analysis, so that the vehicle system of accurate judgement. With the aid of historical data display module, the control center from the gateway of the data obtained, according to the different attributes of the nodes, address and time are saved to the database of the corresponding field, and may be will displayed by waveform of historical data, for the user analysis.The controlling module :In vehicle during system operation may be concerned about a vehicle sensor value node, or to a sensor threshold settings, for monitoring environmental exceptions can be promptly reported to the system. These are available through the control module of the system are corresponding to the set, the control module can also be on the system in which one does not need to delete the node.In short, through the host monitoring software users can visually and many aspects ofgeneral wireless sensor network systems to understand and use.4 test and verification4.1 testingTesting equipment:4 MCl3192ZigBee chip node,1as a gateway node, the remaining 3as sensor nodes.Test method: the gateway node power,4 LED and light, scanning channel if the search to the idle channel, the LED goes out and join the free channel for. The sensor node power,4 LED scanning in the channel at the same time, polling light. LED1 flashes once when the sensor nodes receive the allocation address of the gateway node, So far, networking process and address binding process is complete.4.2 Zigbee RF communication testTesting equipment: ZigBee node 4, a computer terminal stationTest method: according to the ZigBee transmission frame format, the actual transmission total bytes for ( n 6), namely ( n 6) bytes for a data packet. According to the set parameters of the software, such as packet loss is the loss number plus 1. If the received data packet, receives the data packet number plus 1, and then sends the data were compared with data, if the data is correct, the number of packets plus 1, and error packets number plus 1. The last statistic results, can know the data packet loss and packet error rate. The 4 node to form a ZigBee network,1 of them as the gateway, the remaining 3 nodes for sensor node. Write a program to set:3nodes and gateway communications, computer terminal and the gateway is connected through RS232, terminal equipment software records from the 3node to receive data, nodes work at 2.4 GHz frequencies, transmission of a byte of data, circular send 100 times. To obtain the final3 node test average as a result of the data analysis. Star network radio frequency communication BER test results as shown in table 1.Experimental analysis of: in a star network for data transmission, the test results significantly worse on a single point to single point transmission mode. This is mainly because, in the transmission process node must exist between the frequency interference and other interference.4.3power testSystem status and hibernation, respectively, using a multimeter to test the gateway node and the power consumption of sensor nodes, the test results listed in Table 2.ConclusionThis paper analyzes the IEEE 802.15.4 and ZigBee protocol, combined with the general development principles of communication systems and embedded systems, IEEE802.15.4 protocol on the μC / OS-II operating system, select the appropriate hardware and software platform, focusing on software support for the platform, the software design of the overall structure of the communication protocol stack, andultimately to achieve a compliant with the ZigBee specification car star wireless data acquisition network. The system has the following advantages:①system easy to install. Wireless interconnection makes the equipment installation location is flexible to meet the requirements of the automation system is installed. It is simply that the power can take equipment. The network system can automatically complete the network configuration.②scalability. Equipment within the coverage of the vehicle gateway, turn on the device, the node will automatically join the network.③network self-healing ability. If the network is a device fails, the vehicle gateway can automatically monitor, issue the command the device reset and re-network.车载无线传感器网络监测系统设计康一梅,赵磊,胡江,杨恩博(就读于北京航天航空大学)摘要:基于IEEE 802.15.4和ZigBee标准实现了一个车载无线传感器网络监测系统。
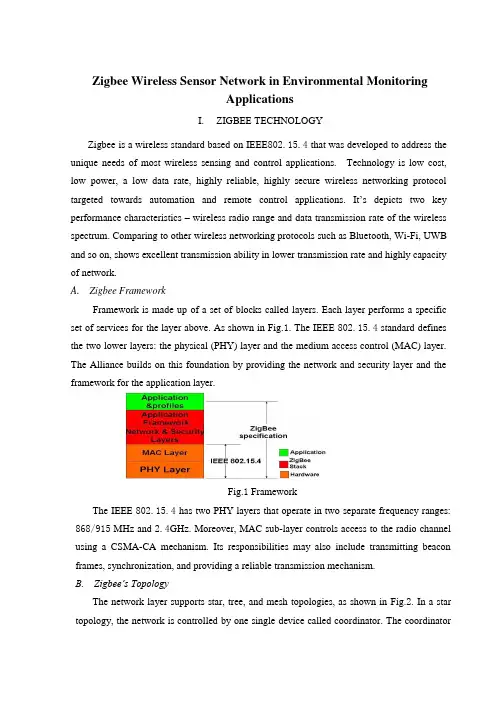
Zigbee Wireless Sensor Network in Environmental MonitoringApplicationsI. ZIGBEE TECHNOLOGYZigbee is a wireless standard based on IEEE802.15.4 that was developed to address the unique needs of most wireless sensing and control applications. Technology is low cost, low power, a low data rate, highly reliable, highly secure wireless networking protocol targeted towards automation and remote control applications. It’s depicts two key performance characteristics – wireless radio range and data transmission rate of the wireless spectrum. Comparing to other wireless networking protocols such as Bluetooth, Wi-Fi, UWB and so on, shows excellent transmission ability in lower transmission rate and highly capacity of network.A. Zigbee FrameworkFramework is made up of a set of blocks called layers.Each layer performs a specific set of services for the layer above. As shown in Fig.1. The IEEE 802.15.4 standard defines the two lower layers: the physical (PHY) layer and the medium access control (MAC) layer. The Alliance builds on this foundation by providing the network and security layer and the framework for the application layer.Fig.1 FrameworkThe IEEE 802.15.4 has two PHY layers that operate in two separate frequency ranges: 868/915 MHz and 2.4GHz. Moreover, MAC sub-layer controls access to the radio channel using a CSMA-CA mechanism. Its responsibilities may also include transmitting beacon frames, synchronization, and providing a reliable transmission mechanism.B. Zigbee’s TopologyThe network layer supports star, tree, and mesh topologies, as shown in Fig.2. In a star topology, the network is controlled by one single device called coordinator. The coordinatoris responsible for initiating and maintaining the devices on the network. All other devices, known as end devices, directly communicate with the coordinator. In mesh and tree topologies, the coordinator is responsible for starting the network and for choosing certain key network parameters, but the network may be extended through the use of routers. In tree networks, routers move data and control messages through the network using a hierarchical routing strategy. Mesh networks allow full peer-to-peer communication.Fig.2 Mesh topologiesFig.3is a network model, it shows that supports both single-hop star topology constructed with one coordinator in the center and the end devices, and mesh topology. In the network, the intelligent nodes are composed by Full Function Device (FFD) and Reduced Function Device (RFD). Only the FFN defines the full functionality and can become a network coordinator. Coordinator manages the network, it is to say that coordinator can start a network and allow other devices to join or leave it. Moreover, it can provide binding and address-table services, and save messages until they can be delivered.Fig.3 Zigbee network modelII.THE GREENHOUSE ENVIRONMENTAL MONITORINGSYSTEM DESIGNTraditional agriculture only use machinery and equipment which isolating and no communicating ability. And farmers have to monitor crops’ growth by themselves. Even if some people use electrical devices, but most of them were restricted to simple communication between control computer and end devices like sensors instead of wire connection, which couldn’t be strictly defined as wireless sens or network. Therefore, by through using sensor networks and, agriculture could become more automation, more networking and smarter.In this project, we should deploy five kinds of sensors in the greenhouse basement. By through these deployed sensors, the parameters such as temperature in the greenhouse, soil temperature, dew point, humidity and light intensity can be detected real time. It is key to collect different parameters from all kinds of sensors. And in the greenhouse, monitoring the vegetables growing conditions is the top issue. Therefore, longer battery life and lower data rate and less complexity are very important. From the introduction about above, we know that meet the requirements for reliability, security, low costs and low power.A. System OverviewThe overview of Greenhouse environmental monitoring system, which is made up by one sink node (coordinator), many sensor nodes, workstation and database. Mote node and sensor node together composed of each collecting node. When sensors collect parameters real time, such as temperature in the greenhouse, soil temperature, dew point, humidity and light intensity, these data will be offered to A/D converter, then by through quantizing and encoding become the digital signal that is able to transmit by wireless sensor communicating node. Each wireless sensor communicating node has ability of transmitting, receiving function.In this WSN, sensor nodes deployed in the greenhouse, which can collect real time data and transmit data to sink node (Coordinator) by the way of multi-hop. Sink node complete the task of data analysis and data storage. Meanwhile, sink node is connected with GPRS/CDMA can provide remote control and data download service. In the monitoring and controlling room, by running greenhouse management software, the sink node can periodically receives the data from the wireless sensor nodes and displays them on monitors.B. Node Hardware DesignSensor nodes are the basic units of WSN. The hardware platform is made up sensor nodes closely related to the specific application requirements. Therefore, the most important work is the nodes design which can perfect implement the function of detecting and transmission as a WSN node, and perform its technology characteristics. Fig.4 shows the universal structure of the WSN nodes. Power module provides the necessary energy for the sensor nodes. Data collection module is used to receive and convert signals of sensors. Data processing and control module’s functions are node device control, task sche duling, and energy computing and so on. Communication module is used to send data between nodes and frequency chosen and so on.Fig.4 Universal structure of the wsn nodesIn the data transfer unit, the module is embedded to match the MAC layer and the NET layer of the protocol. We choose CC2430 as the protocol chips, which integrated the CPU, RF transceiver, net protocol and the RAM together. CC2430 uses an 8 bit MCU (8051), and has 128KB programmable flash memory and 8KB RAM. It also includes A/D converter, some Timers, AES128 Coprocessor, Watchdog Timer, 32K crystal Sleep mode Timer, Power on Reset, Brown out Detection and 21I/Os. Based on the chips, many modules for the protocol are provided. And the transfer unit could be easily designed based on the modules.As an example of a sensor end device integrated temperature, humidity and light, the design is shown in Fig. 5.Fig.5 The hardware design of a sensor nodeThe SHT11is a single chip relative humidity and temperature multi sensor module comprising a calibrated digital output. It can test the soil temperature and humidity. The DS18B20 is a digital temperature sensor, which has 3 pins and data pin can link MSP430 directly. It can detect temperature in greenhouse. The TCS320is a digital light sensor. SHT11, DS18B20and TCS320are both digital sensors with small size and low power consumption. Other sensor nodes can be obtained by changing the sensors.The sensor nodes are powered from onboard batteries and the coordinator also allows to be powered from an external power supply determined by a jumper.C. Node Software DesignThe application system consists of a coordinator and several end devices. The general structure of the code in each is the same, with an initialization followed by a main loop.The software flow of coordinator, upon the coordinator being started, the first action of the application is the initialization of the hardware, liquid crystal, stack and application variables and opening the interrupt. Then a network will be formatted. If this net has been formatted successfully, some network information, such as physical address, net ID, channel number will be shown on the LCD. Then program will step into application layer and monitor signal. If there is end device or router want to join in this net, LCD will shown this information, and show the physical address of applying node, and the coordinator will allocate a net address to this node. If the node has been joined in this network, the data transmitted by this node will be received by coordinator and shown in the LCD.The software flow of a sensor node, as each sensor node is switched on, it scans allchannels and, after seeing any beacons, checks that the coordinator is the one that it is looking for. It then performs a synchronization and association. Once association is complete, the sensor node enters a regular loop of reading its sensors and putting out a frame containing the sensor data. If sending successfully, end device will step into idle state; by contrast, it will collect data once again and send to coordinator until sending successfully.D. Greenhouse Monitoring Software DesignWe use VB language to build an interface for the test and this greenhouse sensor network software can be installed and launched on any Windows-based operating system. It has 4 dialog box selections: setting controlling conditions, setting Timer, setting relevant parameters and showing current status. By setting some parameters, it can perform the functions of communicating with port, data collection and data viewing.Zigbee无线传感器网络在环境监测中的应用I.Zigbee技术Zigbee是一种基于IEEE802.15.4的无线标准上被开发用来满足大多数无线传感和控制应用的独特需求。

(文档含英文原文和中文翻译)中英文对照翻译基于网络共享的无线传感网络设计摘要:无线传感器网络是近年来的一种新兴发展技术,它在环境监测、农业和公众健康等方面有着广泛的应用。
在发展中国家,无线传感器网络技术是一种常用的技术模型。
由于无线传感网络的在线监测和高效率的网络传送,使其具有很大的发展前景,然而无线传感网络的发展仍然面临着很大的挑战。
其主要挑战包括传感器的可携性、快速性。
我们首先讨论了传感器网络的可行性然后描述在解决各种技术性挑战时传感器应产生的便携性。
我们还讨论了关于孟加拉国和加利尼亚州基于无线传感网络的水质的开发和监测。
关键词:无线传感网络、在线监测1.简介无线传感器网络,是计算机设备和传感器之间的桥梁,在公共卫生、环境和农业等领域发挥着巨大的作用。
一个单一的设备应该有一个处理器,一个无线电和多个传感器。
当这些设备在一个领域部署时,传感装置测量这一领域的特殊环境。
然后将监测到的数据通过无线电进行传输,再由计算机进行数据分析。
这样,无线传感器网络可以对环境中各种变化进行详细的观察。
无线传感器网络是能够测量各种现象如在水中的污染物含量,水灌溉流量。
比如,最近发生的污染涌流进中国松花江,而松花江又是饮用水的主要来源。
通过测定水流量和速度,通过传感器对江水进行实时监测,就能够确定污染桶的数量和流动方向。
不幸的是,人们只是在资源相对丰富这个条件下做文章,无线传感器网络的潜力在很大程度上仍未开发,费用对无线传感器网络是几个主要障碍之一,阻止了其更广阔的发展前景。
许多无线传感器网络组件正在趋于便宜化(例如有关计算能力的组件),而传感器本身仍是最昂贵的。
正如在在文献[5]中所指出的,成功的技术依赖于共享技术的原因是个人设备的大量花费。
然而,大多数传感器网络研究是基于一个单一的拥有长期部署的用户,模式不利于分享。
该技术管理的复杂性是另一个障碍。
大多数传感器的应用,有利于这样的共享模型。
我们立足本声明认为传感器可能不需要在一个长时间单一位置的原因包括:(1)一些现象可能出现变化速度缓慢,因此小批量传感器可进行可移动部署,通过测量信号,充分捕捉物理现象(2)可能是过于密集,因此多余的传感器可被删除。

AbstractA1(1)In the recent years, as the rapid development of MEMS, wireless communication network, embedded system, and the interaction of all kinds of new technologies, many new modes of information obtaining and process come into being. A2(2)Wireless sensor network (WSN) is one of them. A2(3)WSN can be used to monitor the environments, the machines and even the people; hence “ubiquitous computing” will come true. A2(4)WSN has wide application fields, so it has been paid high attention by the military, the academes, and the industrial from all over the world. A2(5)Meanwhile, this provides many challenges in the academe foundations and technologies.A3(6)This dissertation introduces the recent researches on WSN, and analyzes its key technologies:the setup of wireless communication network, the design and implementation of network nodes and the design steps of WSN, in an architecture view.A4(7)By analyzing and comparing, ZigBee technology is adopted to setup wireless communication network. A4(8)The topology of the network and hierarchical protocol stacks are designed. A4(9)The embedded network nodes are designed and developed, and the hardware and software are implemented. A4(10)An experimental WSN is deployed and the experimental data is collected and analyzed. A5(11)Finally, a typical example of wireless sensor network, personnelidentification and positioning system in mine, is presented. Keywords: Wireless sensor network, Embedded systems, IEEE802.15.4 protocols, ZigBee摘要近年来,随着微机电系统(MEMS)、无线通信网络和嵌入式系统等技术的飞速发展,各种新技术的融合,出现了许多信息获取和处理的新模式,无线传感器网络就是其中一例。
无线传感器网络应用文章(英文) Wireless Sensor Network ApplicationsIntroduction:Wireless Sensor Networks (WSNs) have gained significant attention in recent years due to their potential for numerous applications in various fields. A WSN consists of a large number of small, low-cost sensor nodes that are wirelessly connected to monitor physical or environmental conditions. These nodes can collect, process, and transmit data to a central base station for further analysis. This article aims to explore some of the most promising applications of WSNs.Environmental Monitoring:One of the most common applications of WSNs is environmental monitoring. These networks can be deployed in remote or hazardous areas to monitor parameters such as temperature, humidity, air pollution, and water quality. For instance, in forest fire detection, sensor nodes can detect abnormal temperature increases and transmit an alert to authorities, enabling timely intervention. In agriculture, WSNs can monitor soil moisture levels and provide farmers with real-time data to optimize irrigation.Healthcare:WSNs have also found applications in the healthcare industry. They can be used to monitor vital signs of patients, such as heart rate, blood pressure, and body temperature. Sensor nodes attached to patients can wirelessly transmit data to healthcare professionals, enabling continuous monitoring and early detection of any abnormalities. WSNs areparticularly useful in remote patient monitoring, allowing patients to receive medical attention from the comfort of their homes.Smart Homes and Buildings:WSNs can play a crucial role in creating smart homes and buildings. By deploying sensor nodes throughout a building, various parameters such as temperature, lighting, occupancy, and energy consumption can be monitored and controlled. This enables energy-efficient operations by optimizing heating, cooling, and lighting systems based on real-time data. Additionally, WSNs can enhance security by detecting unauthorized access or unusual activities within a building.Industrial Automation:WSNs are widely used in industrial automation to monitor and control different processes. For example, in manufacturing plants, sensor nodes can collect data on machine performance, temperature, and vibration levels, allowing for preventive maintenance and reducing downtime. WSNs can also be used for inventory management, tracking the movement of goods within a warehouse, and ensuring timely restocking.Traffic Management:WSNs can significantly contribute to improving traffic management in urban areas. By deploying sensor nodes along roads, real-time traffic data, such as vehicle density and speed, can be collected. This information can be used to optimize traffic signal timings, detect congestion, and provide drivers with alternative routes, reducingoverall travel time and fuel consumption. WSNs also enable the implementation of intelligent transportation systems, enhancing safety and reducing accidents.Conclusion:Wireless Sensor Networks have found numerous applications in various fields, ranging from environmental monitoring to healthcare, smart homes, industrial automation, and traffic management. These networks offer a cost-effective and scalable solution for collecting and analyzing datain real-time. As technology continues to advance, it is expected thatthe applications of WSNs will continue to expand, revolutionizing different industries and improving the quality of life for people around the world.。

无线微传感器中英文对照外文翻译文献(文档含英文原文和中文翻译)A Simple Energy Model for Wireless Microsensor TransceiversAbstract—This paper describes the modelling of shortrange transceivers for microsensor applications. A simple energy model is derived and used to analyze the transceiver battery life. This model takes into account energy dissipation during the start-up, receive, and transmit modes. It shows that there is a significant fixed cost in the transceiver energy consumption and this fixed cost can be driven down by increasing the data rate of the transceiver.I. IntroductionWireless microsensor networks can provide short-range connectivity with significant fault tolerances. These systems find usage in diverse areas such as environmental monitoring, industrial process automation, and field surveillance. As an example, Table I shows a detailed specification for a sensor system used in a factory machine monitoring environment.The major characteristics of a microsensor system are high sensor density, short range transmissions, and low data rate. Depending on the application, there can also be stringent BER and latency requirements. Due to the large density and the random distributed nature of these networks, battery replacement is a difficult task. In fact,a primary issue that prevents these networks to be used in many application areas is the short battery life. Therefore, maximizing the battery life time of the sensor nodes is important. Figure 1 shows the peak current consumption limit when a 950mAh battery is used as the energy source. As seen in the figure, battery life can vary by orders of magnitude depending on the duty cycle of each operation. To allow for higher maximum peak current, it is desirable to have the sensor remain in the off-state for as long as possible.However, the latency requirement of the system dictates how often the sensor needs to be active. For the industrial sensor application described above, the sensor needs to operate every 5ms to satisfy the latency requirement.Assuming that the sensor operates for 100µs every 5ms, the duty cycle is 2%. To achieve a one-year battery life, the peak current consumption must be kept under 5.4mA, which translates to approximately 10mW at 2V supply.This is a difficult target to achieve for sensors that communicate at giga-Hertz carrier frequencies.There has been active research in microsensor networks over the past years. Gupta [1] and Grossglauser [2] established information theoretic bounds on the capacity of ad-hoc networks. Chang [3] and Heinzelman [4] suggested algorithms to increase overall network life-time by spreading work loads evenly among all sensors. Much of the work in this area, especially those that deal with energy consumption of sensor networks, require an energy model [5]. This paper develops a realistic energy model based on the power consumption of a state of the art Bluetoothtransceiver [6]. This model provides insights into how to minimize the power consumption of sensor networks and can be easily incorporated into work that studies energy limited wireless sensor networks. The outline of this paper is as follows. Section II derives the transceiver model. Section III applies this model to analyzing the battery life time of the Bluetooth transceiver.Section IV investigates the dependencies in the model and shows how to modify the design of the Bluetooth transceiver to improve the battery life. Section V shows the battery life improvement realized by applying the results in Section IV. Section VI summarizes the paper.II. Microsensor Transceiver ModellingThis section derives a simple energy model for low power microsensors. Figure 2 shows the model of the sensor node.It includes a sensor/DSP unit for data processing, D/A and A/D for digital-to-analog and analog-to-digital conversion, and a wireless transceiver for data communication. The sensor/DSP, D/A, and A/D operate at low frequency and consume less than 1mW. This is over an order of magnitude less than the power consumption of the transceiver. Therefore, the energy model ignores the contributions from these components. The transceiver has three modes of operation: start-up, receive, and transmit. Each mode will be described and modelled.A. Start-up ModeWhen the transceiver is first turned on, it takes some time for the frequency synthesizer and the VCO to lock to the carrier frequency. The start-up energy can be modelled as follows:where P LO is the power consumption of the synthesizer and the VCO. The term t start is the required settling time. RF building blocks including PA, LNA, and mixer have negligible start-up time and therefore can remain in the off-state during the start-up mode.B. Receive ModeThe active components of the receiver includes the low noise amplifier (LNA), mixer, frequency synthesizer, VCO, intermediate-frequency (IF) amplifier (amp), and demodulator (Demod). The receiver energy consumption can be modelled as follows:where P RX includes the power consumption of the LNA,mixer, IF amplifier, and demodulator. The receiver power consumption is dictated by the carrier frequency and the noise and linearity requirements. Once these parameters are determined, to the first order the power consumption can be approximated as a constant, for data rates up to 10’s of Mb/s. In other words, the power consumption is dominated by the RF building blocks that operate at the carrier frequency. The IF demodulator power varies with data rate, but it can be made small by choosing a low IF.C. Transmit ModeThe transmitter includes the modulator (Mod), frequency synthesizer and VCO (shared with the receiver), and power amplifier (PA). The data modulates the VCO and produces a FSK signal at the desired data rate and carrier frequency. A simple transmitter energy model is shown in Equation (3). The modulator consumes very little energy and therefore can be neglected.P LO can be approximated as a constant. P PA depends on additional factors and needs to be modelled more carefully as follows:where η is the PA efficiency, r is the data rate, d is the transmission distance, and n is the path loss exponent. γPA is a factor that depends on E b /N O , noise factor F of the receiver, link margin L mar , wavelength of the carrier frequency λ, and th e transmit/receive antenna gains G T ,G R :From Equations (3) and (4), the transmitter power consumption can be written as a constant term plus a variable term. The energy model thus becomesIII. Bluetooth TransceiverHere we demonstrate how the above model can be used to calculate the battery life time of a Bluetooth transceiver [6]. This is one of the lowest power Bluetooth transceivers reported in literature. The energy consumption of the transceiver depends on how it operates. Assuming a 100-bit packet is received and a 100-bit packet is transmitted every 5ms, Figure 3 showsthe transceiver activity within one cycle of operation.The transceiver takes 120µs to start up. Operating at 1Mb/s, the receiver takes 100µs to receive the packet. The transceiver then switches to the transmit mode and transmits a same-length packet at the same rate. A 10µs interval, t switch , between the receive and the transmit mode is allowed to switch channel or to absorb any transient behavior. Therefore, the energy dissipated in one cycle of operation is simplyBoth the average power consumption and the duty cycle can be found From Figure 3. Knowing that the transceiver operates at 2V, the life time for a 950mAh battery is calculated to be approximately 2-months.IV. Energy OptimizationThe microsensor system described in Section I requires a battery life of one year or better. Although the Bluetooth transceiver described in the last section falls short of this requirement, it serves as a starting point for making improvements. This section examines E op in detail and suggests ways to increase the battery life by considering both circuit and system improvements. A.Start-up EnergyThe start-up energy can be a significant part of the total energy consumption, especially when the transceiver is used to send short packets in burst mode. For the Bluetooth transceiver, E start accounts for 20% of E op .The start-up energy becomes negligible if the following condition is held true:For the receive/transmit scheme shown in Figure 3, the right hand-side of Equation (8)is evaluated to be approximately 450µs. To keep E start an order of magnitude below E op , it is desirable to have a start-up time of less than 45µs. Cho has demonstrated a 5.8GHz frequency synthesizer im- plementation with a start-up time under 20µs [7].B. Power AmplifierThe PA power consumption is given bywhere η is the power efficiency and P out is the RF output power. P out can be determined by link-budget analysis. For a Bluetooth transceiver, the required P out is 1mW [8].This enables a maximum transmission distance of 10 meters, which is adequate for microsensor applications. Note that P out is small as compared to P LO . The Bluetooth transceiver discussed in Section II has a maximum RF output power of 1.6mW and a PA power consumption of 10mW, sothe efficiency is at 16%. At frequencies around 2GHz, the PA efficiency can vary from 10% [9] to 70% [10] depending on linearity, circuit topology, and technology. Since FSK signal has a constant envelope, nonlinea r PA’s can be used so that better efficiency can be achieved. As will be shown in the next section, PA efficiency has a significant impact on the battery life.C. Data RateAssuming a packet of length L pkt is transmitted at dat rate r, then the transmit time isThe transmitter energy consumption can be re-written asEquation (12) shows that the contribution of the fixed cost P LO can be reduced by increasing the data rate. The energy per bit, E bit , is defined as E op divided by the total number of bits received and sent during one cycle of operation. Assuming a packet of length L pkt is received and a packet of the same length is transmitted, E bit can be found by dividing Equation (7) by 2L pkt . Substituting the appropriate expressions for E start , E rx , and E tx and re-arranging the terms, we getThe first term in Equation (13) is the start-up energy cost. The second term is the PA energy cost. The third term is the cost of the rest of the transceiver electronics during the transmit and receive modes. Note that this term is divided by the data rate r. Figure 4 shows E bit as a function of data rate. The two solid curves have start-up time 120µs and PA efficiencies 10% and 70%, respectively. The two dotted curves have start-up time 20µs and efficiencies 10% and 70%, respectively. At low data rate, E bit is dominated by the fixed cost (the 3rd term in Equation (13)). At high data rate, the start-up energy and the PA energy dominates, so in order to increase battery life, good circuit design techniques need to be applied to minimize the start-up time and to maximize the PA efficiency.Figure 5 shows the impact of PA efficiency on the battery life at a data rate of 10Mb/s. At t start = 120µs, the startup energy is so large that the battery life is limited to 7month even if the PA reaches 100% efficiency. At t start =20µs, the battery life is much improved. The PA efficiency needs to be higher than about 30% to have a 1-year or better battery life. This is certainly achievable as discussed previously in the PA section.V. Performance ImprovementThere are three apparent results from the previous section. First, the data rate should be increased to reduce the fixed cost. Second, the start-up time should be minimized. Third, PA efficiency should be maximized. Figure 6 shows the transceiver activity for a transceiver that has 20µs start-up time and 10Mb/s data rate. The power consumption of the electronics are kept the same as in the Bluetooth transceiver except for the PA. The maximum RF output power is set at 10mW to accommodate the higher data rate, and the PA efficiency is assumed to be 50%. The switching time is kept at 10µs, although this is a conservative since the switching time is likely to be shorter for a faster frequency synthesizer. The E op of this transceiver is 8x lower than that of theBluetooth transceiver. The battery life-time extends from 2-months to approximately1.3 years.VI. ConclusionThis paper describes the modelling of short-range transceivers for wireless sensor applications. This model takes into account energy dissipation during the start-up, transmit, and receive modes. This model is first used to analyze the battery life of a state of the art Bluetooth transceiver, and then it is used to optimize E op . This paper shows that the battery life can be improved significantly by increasing the data rate, reducing the start-up time, and improving the PA efficiency. Increasing the data rate drives down the fixed energy cost of the transceiver. Reducing the start-up time decreases the start-up energy overhead. Improving the PA efficiency lowers the energy per bit cost of the PA.一个简单的能量无线微传感器的接收机模型摘要—本文描述了微传感器的近程的收发器的造型的应用程序。
Model Design of Wireless Sensor Network based on Scale-Free Network TheoryABSTRACTThe key issue of researches on wireless sensor networks is to balance the energy costs across the whole network and to enhance the robustness in order to extend the survival time of the whole sensor network. As a special complex network limited especially by the environment, sensor network is much different from the traditional complex networks, such as Internet network, ecological network, social network and etc. It is necessary to introduce a way of how to study wireless sensor network by complex network theory and analysis methods, the key of which lies in a successful modeling which is able to make complex network theory and analysis methods more suitable for the application of wireless sensor network in order to achieve the optimization of some certain network characteristics of wireless sensor network. Based on generation rules of traditional scale-free networks, this paper added several restrictions to the improved model. The simulation result shows that improvements made in this paper have made the entire network have a better robustness to the random failure and the energy costs are more balanced and reasonable. This improved model which is based on the complex network theory proves more applicable to the research of wireless sensor network.Key-words: Wireless sensor network; Complex network; Scale-free networkI. INTRODUCTIONIn recent years, wireless sensor networks have attracted more and more related researchers for its advantages. Sensor nodes are usually low-power and non-rechargeable. The integrity of the original networks will be destroyed and other nodes will have more business burden for data transmission if the energy of some certain nodes deplete. The key issue of sensor network research is to balance the energy consumption of all sensor nodes and to minimize the impact of random failure of sensor nodes or random attacks to sensor nodes on the entire network [1].Complex network theory has been for some time since first proposed by Barabasi and Albert in 1998, but complex network theory and analysis method applied to wireless sensor networks research is seriously rare and develops in slow progress. As a special complex network limited especially by the environment, sensor network is much different from the traditional complex network, and the existing complex network theory and analysis methods can not be directly applied to analyze sensor networks. Based on scale-free network theory (BA model [2], (1 this paper added a random damage mechanism to each sensor node when deployed in the generation rule; (2 considering the real statement of wireless sensor networks, a minimum and maxinum restriction on sensor communication radius was added to each sensor node; (3 in order to maintain a balanced energy comsuption of the entire network, this paper added a limited degree of saturation value to each sensor node. This improved scale-free model not only has the mentioned improvements above, but also has lots of advantages of traditional scale-free networks, such as the good ability to resist random attacks, so that the existing theory and analysis methods of complex network will be more suitable for the researches of wireless sensor network.II. PROGRESS OF RELATED RESEARCHHailin Zhu and Hong Luo have proposed two complex networks-based models for wireless sensor networks [3], the first of which named Energy-aware evolution model (EAEM can organize the networks in an energy-efficient way, and can produce scale-free networks which can improve the networks reliance against random failure of the sensor nodes. In the second model named Energy-balanced evolution model (EBEM, the maximum number of links for each node is introduced into the algorithm, which can make energy consumption more balanced than the previous model (EAEM.CHEN Lijun and MAO Yingchi have proposed a topology control of wireless sensor networks under an average degree constraint [4]. In the precondition of the topology connectivity of wireless sensor networks, how to solve the sparseness of the networktopology is a very important problem in a large number of sensor nodes deployed randomly. They proved their proposed scheme can decrease working nodes, guarantee network topology sparseness, predigest routing complexity and prolong network survival period.LEI Ming and LI Deshi have proposed a research on self-organization reliability of wireless sensor network[5], which aiming on the two situations: deficiency of WSN nodes and under external attack, analyzes the error tolerance ability of different topologies of WSN, and eventually obtains optimized self—organized topological models of WSN and proposes a refined routing algorithm based on WSN.III. IMPROVED SCALE-FREE MODEL FOR WSNBecause of the limited energy and the evil application environment, wireless sensor networks may easily collapse when some certain sensor nodes are of energy depletion or destruction by the nature, and even some sensor nodes have been damaged when deployed. There is also a restriction on maxinum and mininum communication radius of sensor nodes rather than the other known scale-free networks such as Internet network, which has no restriction on communication radius. To have a balanced energy consumption, it is necessary to set up a saturation value limited degree of each sensor node [6].In response to these points, based on the traditional scale-free model, this paper has made the following improvements in the process of model establishment:(1 A large number of researches have shown that many complex networks in nature are not only the result from internal forces, but also the result from external forces which should not be ignored to form an entire complex network. Node failure may not only occour by node energy depletion or random attacks to them when sensor networks are in the working progress, but also occour by external forces, such as by the nature, whendeployed. In this paper, a mechanism of small probability of random damage has been added to the formation of sensor networks.(2 Unlike Internet network where two nodes are able to connect directly to each other and their connection are never limited by their real location, sensor network, two nodes in which connect to each other by the way of multi-hop, so that each node has a maximum of length restriction on their communication radius. To ensure the sparse of the whole network, there must also be a minimum of length restriction on their communication radius. In this paper, a length restriction on communication radius of sensor nodes has been proposed in the improved model.(3 In sensor network, if there exists a sensor node with a seriously high degree, whose energy consumption is very quickly, it will be seriously bad. The whole sensor network would surely collapse if enough energy were not supported to the certain node. To avoid this situation, this paper has set up a saturation value limited degree of each sensor node. By adding the mentioned restrictions above to the formation of the scale-free model, the new improved model will be more in line with the real statement of sensor network. Complex network theory and analysis methods will be more appropriate when used to research and analyze the sensor network.IV . DESCRIPTION OF THE IMPROVED ALGORITHMThe specific algorithm of the improved model formation are described as follows :(1 A given region (assumed to be square is divided into HS*HSbig squares (named as BS;(2 Each BS (assumed to be square is divided into LS*LS small squares (named as SS, and each SS can have only one node in its coverage region;(3 m0 backbone nodes are initially generated as a random graph, and then a new node will be added to the network to connect the existing m nodes with m edges at each time interval. (m< m0, mis a quantity parameter;(4 The newly generated node v, has a certain probability of Peto be damaged directly so that it will never be connected with any existing nodes;(5 The newly generated node vconnects with the existing node i, which obeyes dependent-preference rule and is surely limited by the degree of the certain saturation value .(6 The distance div between the newly generated node v connects and the existing node i shall be shorter than the maximum dmax of the communication radius of sensor nodes.Above all, the probability that the existing node i will be connected with the newly generated node v can be shown as follows:In order to compute it conveniently, here assumed that few nodes had reached the degree of saturation value kimax . That is, N is very minimal in Eqs.(1 so that it can be ignored here. And in Eqs.iN j 1ak Kjπ=≈∑0N=m 1t +- (2With The varying rate with time of ki, we get:0m 112i i i i t jj k amk amk m t mt m k δπδ+-====-∑ (3When t→∞,condition: k i (t i =m, we get the solution: i 2,i t k t aββ=(t =m ((4 The probabilit y that the degree of node I is smaller than k is:11{k (tk}P{t }i i m t P k ββ<=> (5The time interval when each newly generated node connected into the network is equal, so that probability density of t i is a constant parameter:01(t i P m t=+1/β we rep lace it into Eqs. (5, then we get:11111{k (tk}P{t }1(t i m t k i i i t m t P P k ββββ=<=>=-∑ (61101(t mm t k ββ-+ So we get: 110(k (tk21(k.i P m t P k m t k ββδδ<==+ (7 When t →∞, we get:2(k2m r P k -= (8 In which 12=1+=1+a γβ, and the degree distri bution we get and the degree distribution of traditional scale-free network are similar. Approximately, it has nothing to do with the time parameter t and the quantity of edges m generated at each time interval.max P{d d }iv ≤could be calculated by the ma x in um restriction dmax on communicationradius of each sensor node and the area of the entire coverage region S, thatis max P{d d }iv ≤=2Sd πThen we replace max P{d d }iv ≤=2S d πand a=max P{d d }iv ≤(1-P e into Eqs. and eventually we get:2S 21122(k2m 2e a P km k π----== (1-P d .V. SIMULATIONThis paper used Java GUI mode of BRITE topology generator to generate the topology, and parameter settings were as follows:1 N=5000N means the quantity of the sensor nodes at the end of thetopology generation.2 m=m0 =1M means the quantity of the new generated edges by the new generated node at each time interval.3 HS=500HS means the given region was divided into HS*HS big squares.4 .LS=50 LS means each big square was divided into LS*LS small squares.d=105 mind is the mininum restriction on communication radius of each sensor node.mind=1286 maxd is the maxinum restriction on communication radius of each sensor node.max7 PC=1PC means wether preferential connectivity or not.8 .IG=1IG means wether incremental grouth or not.9 e P=0.01, m=1This means that any newly generated node has 1% chance to be node failure and the newly generated node if normal only connect with one existing node .Then we got each degree of the sensor network nodes from BRITE topology generator.To analyze the degree distribution, we use Matlab to calculate datas and draw graph. As can easily be seen from Fig. 1, the distribution of degree k subjected approximately to Power-Law distribution. However, the value of γ is no longer between 2 and 3, but a very large value, which is caused by the random damage probability P e to new generated nodes when deployed and the max in um of communication radius d max of each sensor node. It can be easily seen that the slope of P(k is very steep and P(k rears up because sensor node has a limited degree of saturation value by 180. The existence of 0 degree nodes is result from the random damage to new generated nodes when deployed.Fig. 1 Degree distribution of Improved ModelCompared with the degree distribution produced by traditional scale-free network as is shown in Fig. 2, the generation rule proposed in this paper has produced a degreedistribution in a relatively low value as is shown in Fig. 1; there are some nodes of 0 degree as is shown in Fig. 1 on the left for the random damage rule; as is shown on the right in Fig. 1, there are no nodes with higher degree than the quantity of 180 while there are some nodes whose degree are of higher degree than the quantity of 180.Fig. 2 Degree distribution of traditional Scale-free ModelVI. CONCLUSIONThis paper has added a random damage to new generated nodes when deployed; considering multi-hop transmission of sensor network, this paper has proposed a maximum restriction on the communication radius of each sensor node; in order to improve the efficiency of energy comsumption and maintain the sparsity of the entire network, this paper has also added a minimum restriction on the communication radius of each sensor node to the improved model; to balance the energy comsuption of the entire network, this paper has proposed a limited degree of saturation value on each sensor node.In this paper, an improved scale-free network model was proposed to introduce the theory of traditional scale-free network and analysis methods into the researches of wireless sensor networks more appropriately, which would be more approximate to the real statement of wireless sensor networks.REFERENCES[1] R. Albert, H. Jeong and A.-L. Barabasi. Error and attack tolerance of complex networks. Nature, 2000; 406: 378-382.[2] Albert R, Barabasi A. Statistical mechanics of complex networks. Rev Mod Phys 2002; 74: 47–97..[3] Zhu HL, Luo H. Complex networks-based energy-efficient evolution model for wireless sensor networks. Chaos, Solitons and Fractals; 2008: 1-4.[4] Chen LJ, Mao YC. Topology Control of Wireless Sensor Networks Under an Average Degree Constraint. Chinese Journal of computers 2007; 30: 1-4.[5] Lei M, Li DS. Research on Self-Organization Reliability of Wireless Sensor Network . Complex system and complexity science ; 2005, 2: 1-4.[6] Chen LJ, Chen DX. Evolution of wireless sensor network . WCNC 2007; 556: 3003–7.[7] Peng J, Li Z. An Improved Evolution Model of Scale-Free Network . Computer application. 2008 , 2; 1: 1-4.基于无范围网络理论的无线传感器网络模型设计张戌源通信工程部通信与信息工程学院上海,中国摘要无线传感器网络的研究的关键问题是是平衡整个网络中的能源成本并且为了延长整个传感器网络的生存时间要增强鲁棒性。
中英文资料对照外文翻译ZigBee:无线技术,低功耗传感器网络技师(工程师)们在发掘无线传感器的潜在应用方面从未感到任何困难。
例如,在家庭安全系统方面,无线传感器相对于有线传感器更易安装。
而在有线传感器的装置通常占无线传感器安装的费用80%的工业环境方面同样正确(适用)。
而且相比于有线传感器的不切实际甚至是不肯能而言,无线传感器更具应用性。
虽然,无线传感器需要消耗更多能量,也就是说所需电池的数量会随之增加或改变过于频繁。
再加上对无线传感器由空气传送的数据可靠性的怀疑论,所以无线传感器看起来并不是那么吸引人。
一个低功率无线技术被称为ZigBee,它是无线传感器方程重写,但是。
一个安全的网络技术,对最近通过的IEEE 802.15.4无线标准(图1)的顶部游戏机,ZigBee的承诺,把无线传感器的一切从工厂自动化系统到家庭安全系统,消费电子产品。
与802.15.4的合作下,ZigBee提供具有电池寿命可比普通小型电池的长几年。
ZigBee设备预计也便宜,有人估计销售价格最终不到3美元每节点,。
由于价格低,他们应该是一个自然适应于在光线如无线交换机,无线自动调温器,烟雾探测器和家用产品。
(图1)虽然还没有正式的规范的ZigBee存在(由ZigBee联盟是一个贸易集团,批准应该在今年年底),但ZigBee的前景似乎一片光明。
技术研究公司In-Stat/MDR 在它所谓的“谨慎进取”的预测中预测,802.15.4节点和芯片销售将从今天基本上为零,增加到2010年的165万台。
不是所有这些单位都将与ZigBee结合,但大多数可能会。
世界研究公司预测的到2010年射频模块无线传感器出货量4.65亿美量,其中77%是ZigBee的相关。
从某种意义上说,ZigBee的光明前途在很大程度上是由于其较低的数据速率20 kbps到250 kbps的,用于取决于频段频率(图2),比标称1 Mbps的蓝牙和54的802.11g Mbps的Wi - Fi的技术。
Zigbee Wireless Sensor Network in Environmental MonitoringApplicationsI. ZIGBEE TECHNOLOGYZigbee is a wireless standard based on IEEE802.15.4 that was developed to address the unique needs of most wireless sensing and control applications. Technology is low cost, low power, a low data rate, highly reliable, highly secure wireless networking protocol targeted towards automation and remote control applications. It’s depicts two key performance characteristics – wireless radio range and data transmission rate of the wireless spectrum. Comparing to other wireless networking protocols such as Bluetooth, Wi-Fi, UWB and so on, shows excellent transmission ability in lower transmission rate and highly capacity of network.A. Zigbee FrameworkFramework is made up of a set of blocks called layers.Each layer performs a specific set of services for the layer above. As shown in Fig.1. The IEEE 802.15.4 standard defines the two lower layers: the physical (PHY) layer and the medium access control (MAC) layer. The Alliance builds on this foundation by providing the network and security layer and the framework for the application layer.Fig.1 FrameworkThe IEEE 802.15.4 has two PHY layers that operate in two separate frequency ranges: 868/915 MHz and 2.4GHz. Moreover, MAC sub-layer controls access to the radio channel using a CSMA-CA mechanism. Its responsibilities may also include transmitting beacon frames, synchronization, and providing a reliable transmission mechanism.B. Zigbee’s TopologyThe network layer supports star, tree, and mesh topologies, as shown in Fig.2. In a star topology, the network is controlled by one single device called coordinator. The coordinatoris responsible for initiating and maintaining the devices on the network. All other devices, known as end devices, directly communicate with the coordinator. In mesh and tree topologies, the coordinator is responsible for starting the network and for choosing certain key network parameters, but the network may be extended through the use of routers. In tree networks, routers move data and control messages through the network using a hierarchical routing strategy. Mesh networks allow full peer-to-peer communication.Fig.2 Mesh topologiesFig.3is a network model, it shows that supports both single-hop star topology constructed with one coordinator in the center and the end devices, and mesh topology. In the network, the intelligent nodes are composed by Full Function Device (FFD) and Reduced Function Device (RFD). Only the FFN defines the full functionality and can become a network coordinator. Coordinator manages the network, it is to say that coordinator can start a network and allow other devices to join or leave it. Moreover, it can provide binding and address-table services, and save messages until they can be delivered.Fig.3 Zigbee network modelII.THE GREENHOUSE ENVIRONMENTAL MONITORINGSYSTEM DESIGNTraditional agriculture only use machinery and equipment which isolating and no communicating ability. And farmers have to monitor crops’ growth by themselves. Even if some people use electrical devices, but most of them were restricted to simple communication between control computer and end devices like sensors instead of wire connection, which couldn’t be strictly defined as wireless sens or network. Therefore, by through using sensor networks and, agriculture could become more automation, more networking and smarter.In this project, we should deploy five kinds of sensors in the greenhouse basement. By through these deployed sensors, the parameters such as temperature in the greenhouse, soil temperature, dew point, humidity and light intensity can be detected real time. It is key to collect different parameters from all kinds of sensors. And in the greenhouse, monitoring the vegetables growing conditions is the top issue. Therefore, longer battery life and lower data rate and less complexity are very important. From the introduction about above, we know that meet the requirements for reliability, security, low costs and low power.A. System OverviewThe overview of Greenhouse environmental monitoring system, which is made up by one sink node (coordinator), many sensor nodes, workstation and database. Mote node and sensor node together composed of each collecting node. When sensors collect parameters real time, such as temperature in the greenhouse, soil temperature, dew point, humidity and light intensity, these data will be offered to A/D converter, then by through quantizing and encoding become the digital signal that is able to transmit by wireless sensor communicating node. Each wireless sensor communicating node has ability of transmitting, receiving function.In this WSN, sensor nodes deployed in the greenhouse, which can collect real time data and transmit data to sink node (Coordinator) by the way of multi-hop. Sink node complete the task of data analysis and data storage. Meanwhile, sink node is connected with GPRS/CDMA can provide remote control and data download service. In the monitoring and controlling room, by running greenhouse management software, the sink node can periodically receives the data from the wireless sensor nodes and displays them on monitors.B. Node Hardware DesignSensor nodes are the basic units of WSN. The hardware platform is made up sensor nodes closely related to the specific application requirements. Therefore, the most important work is the nodes design which can perfect implement the function of detecting and transmission as a WSN node, and perform its technology characteristics. Fig.4 shows the universal structure of the WSN nodes. Power module provides the necessary energy for the sensor nodes. Data collection module is used to receive and convert signals of sensors. Data processing and control module’s functions are node device control, task sche duling, and energy computing and so on. Communication module is used to send data between nodes and frequency chosen and so on.Fig.4 Universal structure of the wsn nodesIn the data transfer unit, the module is embedded to match the MAC layer and the NET layer of the protocol. We choose CC2430 as the protocol chips, which integrated the CPU, RF transceiver, net protocol and the RAM together. CC2430 uses an 8 bit MCU (8051), and has 128KB programmable flash memory and 8KB RAM. It also includes A/D converter, some Timers, AES128 Coprocessor, Watchdog Timer, 32K crystal Sleep mode Timer, Power on Reset, Brown out Detection and 21I/Os. Based on the chips, many modules for the protocol are provided. And the transfer unit could be easily designed based on the modules.As an example of a sensor end device integrated temperature, humidity and light, the design is shown in Fig. 5.Fig.5 The hardware design of a sensor nodeThe SHT11is a single chip relative humidity and temperature multi sensor module comprising a calibrated digital output. It can test the soil temperature and humidity. The DS18B20 is a digital temperature sensor, which has 3 pins and data pin can link MSP430 directly. It can detect temperature in greenhouse. The TCS320is a digital light sensor. SHT11, DS18B20and TCS320are both digital sensors with small size and low power consumption. Other sensor nodes can be obtained by changing the sensors.The sensor nodes are powered from onboard batteries and the coordinator also allows to be powered from an external power supply determined by a jumper.C. Node Software DesignThe application system consists of a coordinator and several end devices. The general structure of the code in each is the same, with an initialization followed by a main loop.The software flow of coordinator, upon the coordinator being started, the first action of the application is the initialization of the hardware, liquid crystal, stack and application variables and opening the interrupt. Then a network will be formatted. If this net has been formatted successfully, some network information, such as physical address, net ID, channel number will be shown on the LCD. Then program will step into application layer and monitor signal. If there is end device or router want to join in this net, LCD will shown this information, and show the physical address of applying node, and the coordinator will allocate a net address to this node. If the node has been joined in this network, the data transmitted by this node will be received by coordinator and shown in the LCD.The software flow of a sensor node, as each sensor node is switched on, it scans allchannels and, after seeing any beacons, checks that the coordinator is the one that it is looking for. It then performs a synchronization and association. Once association is complete, the sensor node enters a regular loop of reading its sensors and putting out a frame containing the sensor data. If sending successfully, end device will step into idle state; by contrast, it will collect data once again and send to coordinator until sending successfully.D. Greenhouse Monitoring Software DesignWe use VB language to build an interface for the test and this greenhouse sensor network software can be installed and launched on any Windows-based operating system. It has 4 dialog box selections: setting controlling conditions, setting Timer, setting relevant parameters and showing current status. By setting some parameters, it can perform the functions of communicating with port, data collection and data viewing.Zigbee无线传感器网络在环境监测中的应用I.Zigbee技术Zigbee是一种基于IEEE802.15.4的无线标准上被开发用来满足大多数无线传感和控制应用的独特需求。
无线传感器网络论文英文版Wireless Sensor Networks: A Research PaperAbstract:Wireless Sensor Networks (WSNs) have emerged as a revolutionary technology in the field of wireless communication. This research paper aims to provide an overview of WSNs, their applications, challenges, and future prospects.1. Introduction:Wireless Sensor Networks are interconnected nodes that can communicate with each other through wireless protocols. These nodes, equipped with sensors, provide real-time data from physical environments. WSNs have gained significant attention due to their applicability in various industries such as healthcare, agriculture, environmental monitoring, and surveillance.2. Architecture of Wireless Sensor Networks:The architecture of WSNs consists of three main components: sensor nodes, sinks or base stations, and a network infrastructure. Sensor nodes gather information from the environment and transmit it to the sink or base station via multi-hopping or direct transmission. The network infrastructure manages the routing and data aggregation processes.3. Applications of Wireless Sensor Networks:3.1 Environmental Monitoring:WSNs play a crucial role in monitoring environmental parameters such as temperature, humidity, air quality, and water quality. This data is essential for environmental research, disaster management, and habitat monitoring.3.2 Healthcare:WSNs have revolutionized the healthcare industry by enabling remote patient monitoring, fall detection, and medication adherence. These networks assist in providing personalized and timely healthcare services.3.3 Agriculture:In the agricultural sector, WSNs are deployed for crop monitoring, irrigation management, and pest control. The data collected by these networks help farmers enhance crop productivity and reduce resource wastage.3.4 Surveillance:WSNs are extensively employed in surveillance systems to monitor public areas, monitor traffic congestion, and ensure public safety. These networks provide real-time data for efficient decision-making and threat detection.4. Challenges in Wireless Sensor Networks:4.1 Energy Efficiency:Sensor nodes in WSNs are usually battery-powered, making energy efficiency a critical challenge. Researchers are focused on developing energy-efficient protocols and algorithms to prolong the network's lifespan.4.2 Security and Privacy:As WSNs collect sensitive data, ensuring the security and privacy of transmitted information is crucial. Encryption techniques, intrusion detection systems, and secure routing protocols are being developed to address these concerns.4.3 Scalability:Scalability is a critical challenge in large-scale deployment of WSNs. Designing scalable architectures and protocols enable efficient communication and management of a large number of sensor nodes.5. Future Prospects of Wireless Sensor Networks:The future of WSNs is promising, with advancements in technologies such as Internet of Things (IoT) and Artificial Intelligence (AI). Integration of WSNs with IoT devices will enable seamless communication and data exchange. AI algorithms can facilitate intelligent data analysis and decision-making.Conclusion:Wireless Sensor Networks have shown tremendous potential in various fields and continue to evolve with advancements in technology. Addressing energy efficiency, security, and scalability challenges will contribute to the widespread adoption of WSNs. As researchers continue to explore new possibilities, WSNs will become an integral part of our daily lives, transforming industries and enhancing our quality of life.。
Model Design of Wireless Sensor Network based on Scale-Free Network TheoryABSTRACTThe key issue of researches on wireless sensor networks is to balance the energy costs across the whole network and to enhance the robustness in order to extend the survival time of the whole sensor network. As a special complex network limited especially by the environment, sensor network is much different from the traditional complex networks, such as Internet network, ecological network, social network and etc. It is necessary to introduce a way of how to study wireless sensor network by complex network theory and analysis methods, the key of which lies in a successful modeling which is able to make complex network theory and analysis methods more suitable for the application of wireless sensor network in order to achieve the optimization of some certain network characteristics of wireless sensor network. Based on generation rules of traditional scale-free networks, this paper added several restrictions to the improved model. The simulation result shows that improvements made in this paper have made the entire network have a better robustness to the random failure and the energy costs are more balanced and reasonable. This improved model which is based on the complex network theory proves more applicable to the research of wireless sensor network.Key-words: Wireless sensor network; Complex network; Scale-free networkI. INTRODUCTIONIn recent years, wireless sensor networks have attracted more and more related researchers for its advantages. Sensor nodes are usually low-power and non-rechargeable. The integrity of the original networks will be destroyed and other nodes will have more business burden for data transmission if the energy of some certain nodes deplete. The key issue of sensor network research is to balance the energy consumption of all sensor nodes and to minimize the impact of random failure of sensor nodes or random attacks to sensor nodes on the entire network [1].Complex network theory has been for some time since first proposed by Barabasi and Albert in 1998, but complex network theory and analysis method applied to wireless sensor networks research is seriously rare and develops in slow progress. As a special complex network limited especially by the environment, sensor network is much different from the traditional complex network, and the existing complex network theory and analysis methods can not be directly applied to analyze sensor networks. Based on scale-free network theory (BA model) [2], (1) this paper added a random damage mechanism to each sensor node when deployed in the generation rule; (2) considering the real statement of wireless sensor networks, a minimum and maxinum restriction on sensor communication radius was added to each sensor node; (3) in order to maintain a balanced energy comsuption of the entire network, this paper added a limited degree of saturation value to each sensor node. This improved scale-free model not only has the mentioned improvements above, but also has lots of advantages of traditional scale-free networks, such as the good ability to resist random attacks, so that the existing theory and analysis methods of complex network will be more suitable for the researches of wireless sensor network.II. PROGRESS OF RELATED RESEARCHHailin Zhu and Hong Luo have proposed two complex networks-based models for wireless sensor networks [3], the first of which named Energy-aware evolution model (EAEM) can organize the networks in an energy-efficient way, and can produce scale-free networks which can improve the networks reliance against random failure of the sensor nodes. In the second model named Energy-balanced evolution model (EBEM), the maximum number of links for each node is introduced into the algorithm, which can make energy consumption more balanced than the previous model (EAEM).CHEN Lijun and MAO Yingchi have proposed a topology control of wireless sensor networks under an average degree constraint [4]. In the precondition of the topology connectivity of wireless sensor networks, how to solve the sparseness of the network topology is a very important problem in a large number of sensor nodes deployed randomly. They proved their proposed scheme can decrease working nodes, guarantee network topology sparseness, predigest routing complexity and prolong network survival period.LEI Ming and LI Deshi have proposed a research on self-organization reliability of wireless sensor network[5], which aiming on the two situations: deficiency of WSN nodes and under external attack, analyzes the error tolerance ability of different topologies of WSN, and eventually obtains optimized self—organized topological models of WSN and proposes a refined routing algorithm based on WSN.III. IMPROVED SCALE-FREE MODEL FOR WSNBecause of the limited energy and the evil application environment, wireless sensor networks may easily collapse when some certain sensor nodes are of energy depletion or destruction by the nature, and even some sensor nodes have been damaged when deployed. There is also a restriction on maxinum and mininum communication radius of sensor nodes rather than the other known scale-free networks such as Internet network, which has no restriction on communication radius. To have a balanced energy consumption, it is necessary to set up a saturation value limited degree of each sensor node [6].In response to these points, based on the traditional scale-free model, this paper has made the following improvements in the process of model establishment:(1) A large number of researches have shown that many complex networks in nature are not only the result from internal forces, but also the result from external forces which should not be ignored to form an entire complex network. Node failure may not only occour by node energy depletion or random attacks to them when sensor networks are in the working progress, but also occour by external forces, such as by the nature, when deployed. In this paper, a mechanism of small probability of random damage has been added to the formation of sensor networks.(2) Unlike Internet network where two nodes are able to connect directly to each other and their connection are never limited by their real location, sensor network, two nodes in which connect to each other by the way of multi-hop, so that each node has a maximum of length restriction on their communication radius. To ensure the sparse of the whole network, there must also be a minimum of length restriction on their communication radius. In this paper, a length restriction on communication radius of sensor nodes has been proposed in the improved model.(3) In sensor network, if there exists a sensor node with a seriously high degree, whose energy consumption is very quickly, it will be seriously bad. The whole sensor network would surely collapse if enough energy were not supported to the certain node. To avoid this situation, this paper has set up a saturation value limited degree of each sensor node. By adding the mentioned restrictions above to the formation of the scale-free model, the new improved model will be more in line with the real statement of sensor network. Complex network theory and analysis methods will be more appropriate when used to research and analyze the sensor network.IV . DESCRIPTION OF THE IMPROVED ALGORITHMThe specific algorithm of the improved model formation are described as follows : (1) A given region (assumed to be square) is divided into HS*HSbig squares (named as BS);(2) Each BS (assumed to be square) is divided into LS*LS small squares (named as SS), and each SS can have only one node in its coverage region;(3) m0 backbone nodes are initially generated as a random graph, and then a new node will be added to the network to connect the existing m nodes with m edges at each time interval. (m< m0, mis a quantity parameter);(4) The newly generated node v, has a certain probability of Peto be damaged directly so that it will never be connected with any existing nodes;(5) The newly generated node vconnects with the existing node i, which obeyes dependent-preference rule and is surely limited by the degree of the certain saturation value .(6) The distance div between the newly generated node v connects and the existing node i shall be shorter than the maximum dmax of the communication radius of sensor nodes.Above all, the probability that the existing node i will be connected with the newly generated node v can be shown as follows:In order to compute it conveniently, here assumed that few nodes had reached the degree of saturation value kimax . That is, N is very minimal in Eqs.(1) so that it can be ignored here. And in Eqs.iNj 1ak Kjπ=≈∑ 0N=m 1t +- (2)With The varying rate with time of ki, we get:m 112i i ii t jj k amk amk m t mt mk δπδ+-====-∑(3)When t→∞,condition: k i (t i )=m, we get the solution: i2,i t k t aββ=(t )=m ()(4) The probability that the degree of node I is smaller than k is:11{k (t)k}P{t }i i m tP kββ<=>(5)The time interval when each newly generated node connected into the network is equal, so that probability density of t i is a constant parameter:01(t )i P m t=+1/β we replace it into Eqs. (5), then we get:11111{k (t)k}P{t }1(t )i m t k i i it m tP P k ββββ=<=>=-∑(6)1101(t m )m tk ββ-+ So we get: 110(k (t)k)21(k).i P m t P k m t k ββδδ<==+ (7)When t →∞, we get:2(k)2m r P k -=(8)In which 12=1+=1+aγβ, and the degree distribution we get and the degree distribution of traditional scale-free network are similar. Approximately, it has nothing to do with the timeparameter t and the quantity of edges m generated at each time interval.max P{d d }iv ≤could be calculated by the max in um restriction dmax on communicationradius of each sensor node and the area of the entire coverage region S, that ismax P{d d }iv ≤=2Sd π Then we replace max P{d d }iv ≤=2S d π and a=max P{d d }iv ≤(1-P )e intoEqs. and eventually we get: 22S21122(k)2m 2e aP km kπ----==(1-P )d .V . SIMULATIONThis paper used Java GUI mode of BRITE topology generator to generate the topology, and parameter settings were as follows:1) N=5000N means the quantity of the sensor nodes at the end of thetopology generation.2) m=m0 =1M means the quantity of the new generated edges by the new generated node at each time interval.3) HS=500HS means the given region was divided into HS*HS big squares.4) .LS=50 LS means each big square was divided into LS*LS small squares.d=105) mind is the mininum restriction on communication radius of each sensor node.mind=1286) maxd is the maxinum restriction on communication radius of each sensor node.max7) PC=1PC means wether preferential connectivity or not.8) .IG=1IG means wether incremental grouth or not.9) e P=0.01, m=1This means that any newly generated node has 1% chance to be node failure and the newly generated node if normal only connect with one existing node .Then we got each degree of the sensor network nodes from BRITE topology generator. To analyze the degree distribution, we use Matlab to calculate datas and draw graph. As can easily be seen from Fig. 1, the distribution of degree k subjected approximately toPower-Law distribution. However, the value of γ is no longer between 2 and 3, but a very large value, which is caused by the random damage probability P e to new generated nodes when deployed and the max in um of communication radius d max of each sensor node. It can be easily seen that the slope of P(k) is very steep and P(k) rears up because sensor node has a limited degree of saturation value by 180. The existence of 0 degree nodes is result from the random damage to new generated nodes when deployed.Fig. 1 Degree distribution of Improved ModelCompared with the degree distribution produced by traditional scale-free network as is shown in Fig. 2, the generation rule proposed in this paper has produced a degree distribution in a relatively low value as is shown in Fig. 1; there are some nodes of 0 degree as is shown in Fig. 1 on the left for the random damage rule; as is shown on the right in Fig. 1, there are no nodes with higher degree than the quantity of 180 while there are some nodes whose degree are of higher degree than the quantity of 180.Fig. 2 Degree distribution of traditional Scale-free ModelVI. CONCLUSIONThis paper has added a random damage to new generated nodes when deployed; considering multi-hop transmission of sensor network, this paper has proposed a maximum restriction on the communication radius of each sensor node; in order to improve the efficiency of energy comsumption and maintain the sparsity of the entire network, this paper has also added a minimum restriction on the communication radius of each sensor node to the improved model; to balance the energy comsuption of the entire network, this paper has proposed a limited degree of saturation value on each sensor node.In this paper, an improved scale-free network model was proposed to introduce the theory of traditional scale-free network and analysis methods into the researches of wireless sensor networks more appropriately, which would be more approximate to the real statement of wireless sensor networks.REFERENCES[1] R. Albert, H. Jeong and A.-L. Barabasi. Error and attack tolerance of complex networks. Nature, 2000; 406: 378-382.[2] Albert R, Barabasi A. Statistical mechanics of complex networks. Rev Mod Phys 2002; 74: 47–97..[3] Zhu HL, Luo H. Complex networks-based energy-efficient evolution model for wireless sensor networks. Chaos, Solitons and Fractals; 2008: 1-4.[4] Chen LJ, Mao YC. Topology Control of Wireless Sensor Networks Under an Average Degree Constraint. Chinese Journal of computers 2007; 30: 1-4.[5] Lei M, Li DS. Research on Self-Organization Reliability of Wireless Sensor Network . Complex system and complexity science ; 2005, 2: 1-4.[6] Chen LJ, Chen DX. Evolution of wireless sensor network . WCNC 2007; 556: 3003–7.[7] Peng J, Li Z. An Improved Evolution Model of Scale-Free Network . Computer application. 2008 , 2; 1: 1-4.基于无范围网络理论的无线传感器网络模型设计张戌源通信工程部通信与信息工程学院上海,中国摘要无线传感器网络的研究的关键问题是是平衡整个网络中的能源成本并且为了延长整个传感器网络的生存时间要增强鲁棒性。
传感器技术外文文献及中文翻译引言传感器是现代检测技术的重要组成部分,它能将物理量、化学量等非电信号转换为电信号,从而实现检测和控制。
传感器广泛应用于工业、医疗、军事等领域中,如温度、湿度、气压、光强度等参数检测。
随着科技的发展,传感器不断新型化、微型化和智能化,已经涵盖了人体所有的感官,开启了大规模的物联网与智能化时代。
本文将介绍几篇与传感器技术相关的外文文献,并对其中较为重要的内容进行中文翻译。
外文文献1标题“Flexible Sensors for Wearable Health: Why Materials Matter”作者Sarah O’Brien, Michal P. Mielczarek, and Fergal J. O’Brien文献概述本文主要介绍了柔性传感器在可穿戴健康监测中的应用,以及传感材料的选择对柔性传感器性能的影响。
文章先介绍了柔性传感器的基本工作原理和常见的柔性传感材料,然后重点探讨了传感材料对柔性传感器灵敏度、稳定性、响应速度等性能的影响。
最后,文章提出未来柔性传感器材料需满足的性能要求,并对可能的研究方向和应用进行了展望。
翻译摘要柔性传感器是可穿戴健康监测中重要的成分,通过将身体状态转化为电信号进行检测。
选择合适的传感材料对柔性传感器产品的成本、性能及标准化有着面向未来的影响。
本文对柔性材料的常见种类 (如: 聚合物、金属、碳复合材料等) 进行了介绍,并重点探讨了传感材料选择的影响因素,如对柔性传感器的灵敏度、特异性和响应时间等。
此外,文章还探讨了柔性传感器的性能要求和建议未来的技术方向。
外文文献2标题“Smart sensing system for precision agriculture”作者Olivier Strauss, Lucas van der Meer, and Benoit Figliuzzi文献概述本文主要介绍智能传感系统在精准农业中的应用。
毕业论文外文文献翻译Sensor-technology传感器技术毕业设计(论文)外文文献翻译文献、资料中文题目:传感器技术文献、资料英文题目:Sensor-technology文献、资料来源:文献、资料发表(出版)日期:院(部):专业:班级:姓名:学号:指导教师:翻译日期: 2017.02.14Sensor technologyA sensor is a device which produces a signal in response to its detecting or measuring a property ,such as position , force , torque , pressure , temperature , humidity , speed , acceleration , or vibration .Traditionally ,sensors (such as actuators and switches )have been used to set limits on the performance of machines .Common examples are (a) stops on machine tools to restrict work table movements ,(b) pressure and temperature gages with automatics shut-off features , and (c) governors on engines to prevent excessive speed of operation . Sensor technology has become an important aspect of manufacturing processes and systems .It is essential for proper data acquisition and for the monitoring , communication , and computer control of machines and systems .Because they convert one quantity to another , sensors often are referred to as transducers .Analog sensors produce a signal ,such as voltage ,which is proportional to the measured quantity .Digital sensors have numeric or digital outputs that can be transferred to computers directly .Analog-to-coverter(ADC) is available for interfacing analog sensors with computers .Classifications of SensorsSensors that are of interest in manufacturing may be classified generally as follows:Machanical sensors measure such as quantities aspositions ,shape ,velocity ,force ,torque , pressure , vibration , strain , and mass .Electrical sensors measure voltage , current , charge , and conductivity .Magnetic sensors measure magnetic field ,flux , and permeablity .Thermal sensors measure temperature , flux ,conductivity , and special heat .Other types are acoustic , ultrasonic , chemical , optical , radiation , laser ,and fiber-optic .Depending on its application , a sensor may consist of metallic , nonmetallic , organic , or inorganic materials , as well as fluids ,gases ,plasmas , or semiconductors .Using the special characteristics of these materials , sensors covert the quantity or property measured to analog or digital output. The operation of an ordinary mercury thermometer , for example , is based on the difference between the thermal expansion of mercury and that of glass.Similarly , a machine part , a physical obstruction , or barrier in a space can be detected by breaking the beam of light when sensed by a photoelectric cell . A proximity sensor ( which senses and measures the distance between it and an object or a movingmember of a machine ) can be based on acoustics , magnetism , capacitance , or optics . Other actuators contact the object and take appropriate action ( usually by electromechanical means ) . Sensors are essential to the conduct of intelligent robots , and are being developed with capabilities that resemble those of humans ( smart sensors , see the following ).This is America, the development of such a surgery Lin Bai an example, through the screen, through a remote control operator to control another manipulator, through the realization of the right abdominal surgery A few years ago our country the exhibition, the United States has been successful in achieving the right to the heart valve surgery and bypass surgery. This robot has in the area, caused a great sensation, but also, AESOP's surgical robot, In fact, it through some equipment to some of the lesions inspections, through a manipulator can be achieved on some parts of the operation Also including remotely operated manipulator, and many doctors are able to participate in the robot under surgery Robot doctor to include doctors with pliers, tweezers or a knife to replace the nurses, while lighting automatically to the doctor's movements linked, the doctor hands off, lighting went off, This is very good, a doctor's assistant.Tactile sensing is the continuous of variable contact forces , commonly by an array of sensors . Such a system is capable of performing within an arbitrarythree-dimensional space .has gradually shifted from manufacturing tonon-manufacturing and service industries, we are talking about the car manufacturer belonging to the manufacturing industry, However, the services sector including cleaning, refueling, rescue, rescue, relief, etc. These belong to the non-manufacturing industries and service industries, so here is compared with the industrial robot, it is a very important difference. It is primarily a mobile platform, it can move to sports, there are some arms operate, also installed some as a force sensor and visual sensors, ultrasonic ranging sensors, etc. It’s surrounding environment for the conduct of identification, to determine its campaign to complete some work, this is service robot’s one of the basic characteristicsIn visual sensing (machine vision , computer vision ) , cameral optically sense the presence and shape of the object . A microprocessor then processes the image ( usually in less than one second ) , the image is measured , and the measurements are digitized ( image recognition ) .Machine vision is suitable particularly for inaccessible parts , in hostile manufacturing environments , for measuring a large number of small features , and in situations where physics contact with the part may cause damage .Small sensors have the capability to perform a logic function , to conducttwo-way communication , and to make a decisions and take appropriate actions . The necessary input and the knowledge required to make a decision can be built into a smart sensor . For example , a computer chip with sensors can be programmed to turn a machine tool off when a cutting tool fails . Likewise , a smart sensor can stop a mobile robot or a robot arm from accidentally coming in contact with an object or people by using quantities such as distance , heat , and noise .Sensor fusion . Sensor fusion basically involves the integration of multiple sensors in such a manner where the individual data from each of the sensors ( such as force , vibration ,temperature , and dimensions ) are combined to provide a higher level of information and reliability . A common application of sensor fusion occurs when someone drinks a cup of hot coffee . Although we take such a quotidian event for granted ,it readily can be seen that this process involves data input from the person's eyes , lips , tongue , and hands .Through our basic senses of sight , hearing , smell , taste , and touch , there is real-time monitoring of relative movements , positions , and temperatures . Thus if the coffee is too hot , the hand movement of the cup toward the lip is controlled and adjusted accordingly .。
无线传感器网络测距技术外文翻译文献(文档含中英文对照即英文原文和中文翻译)原文:RANGING TECHNIQUES FOR WIRELESS SENSOR NETWORKSThe RF location sensors operating in different environments can measure the RSS, AOA, phase of arrival (POA), TOA, and signature of the delay - power profile as location metrics to estimate the ranging distance [4,7] . The deployment environment (i.e., wireless RF channel) will constrain the accuracy and the performance of each technique. In outdoor open areas, these ranging techniques perform very well. However, as the wireless medium becomes more complex, for example, dense urban or indoor environments, the channel suffers from severe multipath propagation and heavy shadow fading conditions. This finding in turn impacts the accuracy and performance in estimating the range between a pair of nodes. For this reason, this chapter will focus its ranging and localization discussion on indoor environments. This is important because many of the WSN applications are envisioned for deployment in rough terrain and cluttered environments and understanding of the impact of the channel on the performance of ranging and localization is important. In addition, range measurements using POA and AOA in indoor and urban areas are unreliable. Therefore, we will focus our discussion on two practical techniques,TOA and RSS.These two ranging techniques, which have been used traditionally in wirelessnetworks, have a great potential for use in WSN localization.The TOA based ranging is suitable for accurate indoor localization because it only needs a few references and no prior training. By using this technique, however, the hardware is complex and the accuracy is sensitive to the multipath condition and the system bandwidth. This technique has been implemented in GPS, PinPoint, WearNet, IEEE 802.15.3, and IEEE 802.15.4 systems. The RSS based ranging, on the other hand, is simple to implement and is insensitive to the multipath condition and the bandwidth of the system. In addition, it does not need any synchronization and can work with any existing wireless system that can measure the RSS. For accurate ranging, however, a high density of anchors or reference points is needed and extensive training and computationally expensive algorithms are required.The RSS ranging has been used for WiFi positioning in systems, for example, Ekahau, Newbury Networks, PanGo, and Skyhook.This section first introduces TOA based ranging and the limitations imposed by the wireless channel. Then it will be compared with the RSS counterpart focusing on the performance as a function of the channel behavior. What is introduced here is important to the understanding of the underlying issues in distance estimation, which is an important fundamental building block in WSN localization.TOA Based RangingIn TOA based ranging, a sensor node measures the distance to another node by estimating the signal propagation delay in free space, where radio signals travel at the constant speed of light. Figure 8.3 shows an example of TOA based ranging between two sensors. The performance of TOA based ranging depends on the availability of the direct path (DP) signal [4,14] . In its presence, for example, short distance line - of - sight (LOS) conditions, accurate estimates are feasible [14] . The challenge, however, is ranging in non - LOS (NLOS) conditions, which can be characterized as site - specific and dense multipath environments [14,22] . These environments introduce several challenges. The first corrupts the TOA estimatesdue to the multipath components (MPCs), which are delayed and attenuated replicas of the original signal, arriving and combining at the receiver shifting the estimate. The second is the propagation delay caused by the signal traveling through obstacles, which adds a positive bias to the TOA estimates. The third is the absence of the DP due to blockage, also known as undetected direct path (UDP) [14] . The bias imposed by this type of error is usually much larger than the first two and has a significant probability of occurrence due to cabinets, elevator shafts, or doors that are usually cluttering the indoor environment.In order to analyze the behavior of the TOA based ranging, it is best to resort to a popular model used to describe the wireless channel. In a typical indoor environment, the transmitted signal will be scattered and the receiver node will receive replicas of the original signal with different amplitudes, phases, and delays. At the receiver, the signals from all these paths combine and this phenomenon is known as multipath. In order to understand the impact of the channel on the TOA accuracy, we resort to a model typically used to characterize multipath arrivals. For multipath channels, the impulse respons 错误!未找到引用源。