考研英语二图表类作文常用描述词汇及表达
- 格式:doc
- 大小:25.04 KB
- 文档页数:5
考研英语(二)图表作文核心单词速记
来源:文都图书
马上就要进行2016年硕士研究生考试了,考生们一定都非常期待自己将在这次考试上有多么完美的表现,而想要接近完美,大家还需在剩余的十几天好好练习考研英语写作题,因为它是考查范围最综合的题型,词汇短语、句型模板、语法思维等等都是其考查的内容,推荐大家看一看谭剑波老师的《考研英语(二)写作考前冲刺万用魔板》,先从速记核心词汇开始!
1.demonstrate v.证明;展示;示威
【单词记忆】de-下,词根monstr-“警告”,来自monster“怪物”;动物园有危险动物都会有警告,用怪物来创造警告也可以理解。
-ate 动词后缀。
人民在下面警告,就是示威。
【同义替换】prove,show
【写作例句】The picture demonstrates that...图画表明……
2.dramatically ad.戏剧性地;引人注目地
【单词记忆】drama“戏剧”,tic+al+ly是复合后缀,整个词表示“戏剧性地”。
【同义替换】remarkably,noticeably
【写作例句】The population in cities increased dramatically because of urbanization.由于城市化,城市人口数量急剧上涨。
这本书中针对考研英语(二)的图表作文展开了讲解:概述、题型讲解、万用模板、范文讲解和命题预测五大方面的内容,帮助考生快速拿下考研英语图表作文。
除此之外,100个核心词汇、低端词汇的高端替换、常用表达等等基本知识也都收录在书中,让大家全方位提高自己的写作能力。
预祝大家考研顺利哦!加油!。
考研英语图表作文考前词汇积累来源:智阅网图表作文是考研英语(二)大作文的唯一考查题型,其重要性考生们可想而知。
而想要在短时间内提升图表作文的写作能力,推荐大家看一看《考研英语写作高分攻略》,书中全方位的介绍了图表作文的情况,除此之外还有核心词汇100词、低端词汇的高端替换、常用表达等等基础知识的补充,今天先来看看常用词汇吧!1.Decline v.下降;衰退 n.下降;下滑【单词记忆】de-“下”,cline看作line“线”,一条线往下,就是下降,下跌,下滑。
【同义替换】decrease,drop【写作例句】The chart above shows the decline of consumption level.以上图表表明消费水平下滑。
The declining consumption level reveals the depression of economic level.下滑的消费水平意味着经济水平的衰退。
2.Decay v.衰退 n.衰退;衰减【单词记忆】de-“向下”,cay“落”(词根-cay,-cad,-cid都表示“落”,如occidental西方的,-oc加强,-cid落,-ent+-al为复合后缀,西方就是日落的地方,因此-cid表示“落”)。
整个词表示向下落,就是下降,衰退之意。
【同义替换】decline,depression【写作例句】The decay of economy is caused by several reasons.经济衰退是由多种原因造成的。
词汇是英语的基础,丰富的词汇量会让考生们的作文更加出彩,所以希望大家利用好这本书,提升自己的写作技能。
最后预祝考生们顺利拿下考研英语!加油!。
考研英语二图表类作文常用描述词汇及表达本文汇总了考研英语二大作文图表类作文写作中描述词汇、词组及句型常用表达的相关内容,帮助大家在考研英语作文中拿到高分。
图表描述词汇、词组及句型常用表达基本要素类型:table, chart, diagram/graph, column chart, pie graph描述:show, describe, illustrate, reveal, represent, can be seen from, clear, apparent内容:figure, statistic, number, percentage, proportion表示数据变化的单词或者词组–动词(1) 起伏、波动rise and fall, fluctuate, wave, undulate, rebound, recover(2) 高、低点值peak, reach a (high) peak/point,reach the bottom, reach a low point(3) 增加、上升、提高increase, grow, rise, climb, expand, ascend, skyrocket, soar(4) 减少、下降decrease, decline, fall, drop, descend, diminish, slide, shrink, collapse 形容词或副词(1)变化巨大迅速的,飞快的,rapid/rapidly戏剧性的,生动的dramatic/dramatically有意义的,重大的significant/significantly锐利的,明显的sharp/sharply急剧升降的steep/steeply(2)变化平缓稳固的,坚定不移的steady/steadily渐进的,逐渐的gradual/gradually缓慢的,不活跃的slow/slowly轻微的、略微地slight/slightly稳定的stable/stably英语图表写作套句推荐图表的总体描述1.The table shows the changes in the number of……over the period from……to……2.The data/statistics/figures lead us to the conclusion that……3.As can be seen from the diagram, great changes have taken place in……/ the two curves show the fluctuation of……4.From the table/chart/diagram/figure, we can see clearly that……or it is clear/apparent from the chart that……5.This is a graph which illustrates……6.The graph, …presented in a pie chart, shows the general trend in……7.This is a column chart showing……时间段表达方式1.over the period from…to…the…remained level.2.in the year between……and……3.in the 3 years spanning from 1995 through 1998……4.from then on/from this time onwards……数据变化表达方式表示上升趋势的句型:1.the number sharply went up to……2.the figures peaked at……in(month/year)3.the situation reached a peak(a high point at) of[%].4.a increased by……5.a increased to……6.there is an upward trend in the number of……7. a considerable increase/decrease occurred from……to……8.……(year)witnessed/saw a sharp rise in……表示下降趋势的句型:1.the figures/situation bottomed out in……2.the figures reached the bottom/a low point/hit a trough.3.from……to……the rate of decrease slow down.4.from this year on,there was a gradual decline/ reduction in the……,reaching a figure of……表示平稳趋势的句型:1.the number of……remained steady/stable from (month/year) to (month/year).2.the percentage of…stayed the same between…and……3.the percentage remained steady at……表示比较的句型:1.the percentage of…is slightly larger/smaller than that of2.there is not a great deal of difference between……and……3.…decreased year by year while……increased steadily.4.there are a lot similarities/differences between……and……5.a has something in common with b6.the difference between a and b lies in……表示倍数的句型:1.the graphs show a threefold increase in the number of……2.a is ……times as much/many as b.。
英语图表类作文常用词汇及句型图表作文是考研英语作文考察的一大形式,店铺整理了图表作文的备考方法,希望对考研的同学有所帮助。
1、主章开头图表类型:table、chart、diagram、graph、column chart、pie graph描述:show、describe、illustrate、can be seen from、clear、apparent、reveal、represent内容:figure、statistic、number、percentage、proportion2、表示数据变化的单词或词组rapid/rapidly 迅速的,飞快的,险峻的dramatic/dramatically 戏剧性的,生动的 significant/significantly有意义的,重大的,重要的sharp/sharply 锐利的,明显的,急剧的steep/steeply 急剧升降的steady/steadily 稳固的,坚定不移的gradual/gradually 渐进的,逐渐的slow/slowly 缓慢的,不活跃的slight/slightly 轻微的、略微地stable/stably 稳定的3、图表中的数据(Data)具体表达法数据(Data)在某一个时间段固定不变:fixed in time 在一系列的时间段中转变:changes over time持续变化的'data在不同情况下:增加:increase / raise / rise / go up ……减少:decrease / grow down / drop / fall ……波动:fluctuate / rebound / undulate / wave ……稳定:remain stable / stabilize / level off ……最常用的两种表达法:动词+副词形式(Verb+Adverb form)形容词+名词形式(Adjective+Noun form)4、其它在描述中的常用到的词significant changes 图中一些较大变化noticeable trend 明显趋势during the same period 在同一时期grow/grew 增长distribute 分布,区别unequally 不相等地in the case of adv. 在……的情况下in terms of / in respect of / regarding 在……方面 in contrast 相反,大不相同government policy 政府政策market forces 市场规率measure n.尺寸,方法,措施v.估量,调节forecast n.先见,预见v.预测英语图表写作套句精选开始句1.the table shows the chang es in the number of……over the period from……to……该表格描述了在……年之……年间……数量的变化。
2020考研英语二:图表写作常识考研英语有许多题目组成,方便大家及时了解,下面由小编为你精心准备了“2020考研英语二:图表写作常识”,持续关注本站将可以持续获取更多的考试资讯!2020考研英语二:图表写作常识图表作文(二)一、图表作文写作常识1、图形种类及概述法:泛指一份数据图表: a data graph/chart/diagram/illustration/table饼图:pie chart直方图或柱形图:bar chart/histogram趋势曲线图:line chart/curve diagram表格图:table流程图或过程图:flow chart/sequence diagram程序图:processing/procedures diagram2、常用的描述用法The table/chart diagram/graph shows(that)According to the table/chart diagram/graphAs(is)shown in the table/chart diagram/graphAs can be seen from the table/chart/diagram/graph/figures,figures/statistics shows(that)……It can be seen from the figures/statisticsWe can see from the figures/statisticsIt is clear from the figures/statisticsIt is apparent from the figures/statisticstable/chart/diagram/graph figures(that)……table/chart/diagram/graph shows/describes/illustrates how……3、图表中的数据(Data)具体表达法数据(Data)在某一个时间段固定不变:fixed in time在一系列的时间段中转变:changes over time持续变化的data在不同情况下:增加:increase/raise/rise/go up……减少:decrease/grow down/drop/fall……波动:fluctuate/rebound/undulate/wave……稳定:remain stable/stabilize/level off……最常用的两种表达法:动词+副词形式(Verb+Adverb form)形容词+名词形式(Adjective+Noun form)2020考研英语二:图表作文的写作要领写好图表作文,关键在于能否读懂图表中所提供的信息,把握各信息间的联系,用准确流畅的语言把这一信息表达出来,并就这一信息发表自己的看法。
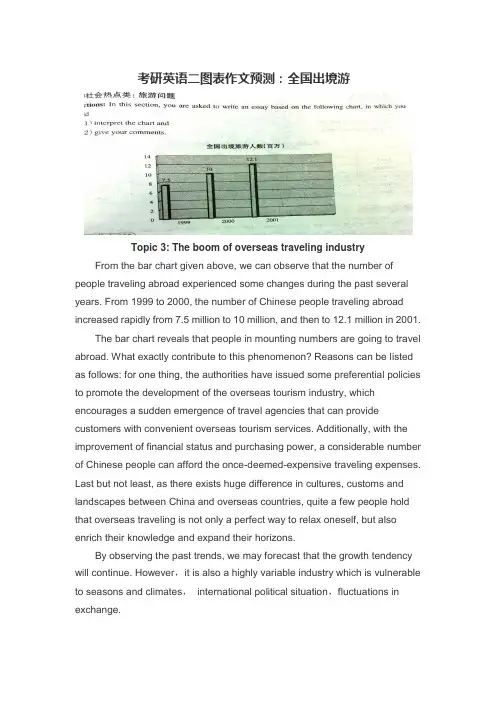
考研英语二图表作文预测:全国出境游Topic 3: The boom of overseas traveling industry From the bar chart given above, we can observe that the number of people traveling abroad experienced some changes during the past several years. From 1999 to 2000, the number of Chinese people traveling abroad increased rapidly from 7.5 million to 10 million, and then to 12.1 million in 2001.The bar chart reveals that people in mounting numbers are going to travel abroad. What exactly contribute to this phenomenon? Reasons can be listed as follows: for one thing, the authorities have issued some preferential policies to promote the development of the overseas tourism industry, which encourages a sudden emergence of travel agencies that can provide customers with convenient overseas tourism services. Additionally, with the improvement of financial status and purchasing power, a considerable number of Chinese people can afford the once-deemed-expensive traveling expenses. Last but not least, as there exists huge difference in cultures, customs and landscapes between China and overseas countries, quite a few people hold that overseas traveling is not only a perfect way to relax oneself, but also enrich their knowledge and expand their horizons.By observing the past trends, we may forecast that the growth tendency will continue. However,it is also a highly variable industry which is vulnerable to seasons and climates,international political situation,fluctuations in exchange.考研英语二图表作文预测:电子商务成交额Global E-commerce turnoverFrom the curve chart given above, we can observe that the turnover of global E-commerce experienced some change during the past several years. From 1997 to 2005, it rose dramatically from 20 billion to 900 billion.The curve chart reveals that the global E-commerce industry enjoys an explosive growth. Quite a few reasons can be listed to account for this phenomenon, and the followings might be the most critical ones: for one thing, the authorities of different countries have issued some preferential policies to protect and encourage the development of E-commerce, thus quite a few online-transaction websites emerge overnight. Moreover, theone-click-payment consumption mode has been widely accepted by the public thanks to the widespread availability of the Internet. Last but not least, people’s decision to purchase on-line can also be put down to the power of so-called “group-dynamics”: when our friends are shopping at network, we will be influenced by them and imitate their behaviors unconsciously.The rapid development of E-commerce signals that new business models contribute largely to the sustainable development of the global economy. However, when enjoying the fruits offered by modern technology, we should also keep an eye on the underlying threat of it. In a world features open boundary, deception and fraud sometime abound. (209 words )考研英语二图表作文预测:职业选择Different job inclination between boys and girls From the bar chart given above, we can find that it reflects the statistics of profession inclination between girls and boys. Most obviously, 40% of boys intend to be a manager, with only 15% of girls choosing this job. When it comes to the profession of teacher, we can observe that 45% of girls prefer to take this job, while the proportion of boys only account for 5%, 40% lower than that of girls.The bar chart informs us of the phenomenon that there exists some difference in profession inclination between boys and girls. What exactly contribute to this phenomenon ? reasons can be listed as follow: for one thing, quite a few boys regard being a manager as a symbol of success. As this profession stands for promising futures, fat pay and competence. Moreover, boys’ decision to be a manager can also be attributed to the power of so-called “group dynamics”: when members of their social network prefer to be a manager after graduation, they are easily influenced and imitate others’ behavior unconsciously or consciously. When it comes to girls, the are more inclined to be a teacher. As this profession features stability and respect. Takesocial and biological factors into account, we know that it is reasonable for girl to choose teacher as their ideal profession goals.Both girls and boys have rights to choose their profession. However, one thing we should bear in mind is that there exists no better or worse, superior or inferior jobs, but suitable and satisfactory ones. (254words)考研英语二作文范文:中国职业的变化The changes of Chinese professionsFrom the pie chart given above, we can observe that the professions structure of Chinese people experienced some changes during the past several years. From 1980 to 1999, the percentage of agricultural professions decreased by 30% from 68% to 38%. During the same period, however, service sectors increased rapidly from 5% to 22%. When it comes to the manufacturing professions, its percentage rose markedly from 27% in 1980 to 40% in 1999.The pie chart reveals the phenomenon that there exists some difference in the development tendency among different professions in China. What exactly contribute to this phenomenon ? reasons can be listed as follows: for one thing, with the rapid process of urbanization, people in mounting numbers, especially youngster, have left their village homes ,moved into big cities and thus been out of agricultural industries. Moreover, quite a few people, especially college graduates hold that it is comparatively easy for them to make more money inthe service industry. When it comes to the manufacturing industry, its transformation might be attributed to the adjustment of industrial structure: the authorities have issued some preferential policies to promote the rapid extension of manufacturing industry, thus, more workforces are required.By observing the change over the past several years, we may forecast that the proportion of professions of service and manufacture will continue to rise. However, a high value should be placed on the development of agricultural industry by the public and the authorities. Otherwise, with the number of people who are engaged in agriculture diminishing, we will one day have nothing to eat! (262words)考研英语二作文范文:快餐和坐下来餐厅发展趋势The development tendency of fast food and sit down restaurantFrom the curve chart given above, we can observe that the number meals of fast food and sitdown restaurant experienced some changes during the past several years. The number of meals of fast food increased slowly from 20 in 1970 to nearly 30 in 1980. From 1980 to 2000, it ascended rapidly from 30 to approximately 90. On the contrary, when observing the statistics of sitdown restaurant meals, we can find that it increased slowly from 20 in 1970 to roughly 50 in 2000.The curve chart informs us of the phenomenon that there exists some difference in the development tendency between fast food and sitdown restaurants. What exactly contribute to this phenomenon? Reasons can be listed as follows: for one thing, with the pace of modern life quickening, people barely have much time to waste in lining up for restaurant meals, on the contrary, fast food meals can do help busy people save a great deal of time. Additionally, the authorities have issued some preferential policies to protect and encourage the rapid extension of fast food industry , thus the public can buy fast food at shops scattering around the city. On the contrary , people in diminishing numbers are willing to eat at sitdown restaurant. They think that eating at restaurant is always time-consuming and inconvenient. Besides, food at restaurant is comparatively expensive than fast food.by observing the trend of the past, we may forecast that the number of fast food meals will continue to rise in the years to come. However, we should also take the detrimental impact of fast food into consideration. Do remember that fast food is one of the main causing factors of diseases such as heart attack, obesity and diabetes.英语二赠送以下资料考研英语作文模板(英语一)大作文考研英语大作文一般是看图写作,从一幅图分析含义及意义,所以只需要几个好的模板,根据题目套上去就行了。
考研英语(二)图表作文经典模板
来源:文都图书
考研英语(二)的大作文图表作文相对考研英语(一)来说是比较简单的,它有一些固定的用语和格式是考生们在考前可以进行速记和运用的。
在此给大家推荐全国知名考研英语辅导老师谭剑波的《考研英语(二)写作考前冲刺万用魔板》,相信会对大家有很大的帮助。
1.Crucial a.关键的;重要的
【单词记忆】词根cruc-来自cross(元音互换,c=s发音相同),-ial 形容词后缀。
Cross本意为“穿过”,也可表示“十字路口”,十字路口是一个很重要的转折点,因此用cross创造出crucial表示“重要”。
【同义替换】critical
【写作例句】doing sth. is crucial to doing sth.如Reading more books is crucial to accumulating knowledge.多读书对知识积累很重要。
2.Significant a.重要的
【单词记忆】sign“记号”,i无意,词根-fic“作”,-ant形容词后缀。
我们在读书的时候,总在重要的地方做记号,因此“做记号”表示“重要的”。
【同义替换】important
【写作例句】sth. is significant 或sth. is of great significance /importance某事想当重要
这本书针对图表作文进行了概述、题型讲解、万用魔板、范文点评和命题预测等五大方面的详细叙述,帮助考生一举拿下图表作文,除此之外,为了在短时间内提高大家的知识储备量,书中还附有图表作文高频核心100词、低端词汇的高端替换和图表作文的常用表达等,非常有用。
最后预祝大家考研顺利,加油!。
考研英语图表作文重点词汇
来源:文都图书
参加考研英语要考英语二的同学们应该知道,由于考研英语二的写作部分考查的有图表作文,所以考生们在备考时最好多多积累一些图标作文常用词汇,图表作文绝大部分比较重数据,所以表示趋势类的词汇是重点。
增加:increase,rise(可作名词),go up,climb,ascend rocket(暴增),grow up,jump up,surge,shoot up,keep an upward tendency 减少:decrease,drop,come down,slide,decline,plunge(暴减),go down,fall down,sink,dip,keep a downward tendency
变化,变动:fluctuate,change,shift
保持稳定:remain the same,stabilize,remain stable,remain constant
百分比:a small percentage of...(X%),a quarter of ...,the minority of...(X%)(小部分),half of...,the majority of...(X%),most of...(X%),one-fifth of...
记住这些单词利于大家在写作文时有更多的表达方式可以选择,分分钟让自己的作文更“亮眼”!推荐大家看看《考研英语写作高分攻略》,这是一本专门针对考研英语写作题编撰的参考书,可以全方位帮助考生们提高自己的应试技能。
先预祝大家考研顺利,在备考时期保持积极向上的心态,规律的饮食起居等,充满信心迎战考试!加油!。
英语二图表作文7类万能句式文章第一段:第一类:图表阐释段图表标题的描述1、短语引出句子:From the above chart, we can see 标题,which successfully arouses our curiosity.2、简单句:: The above chart records +标题,which successfully arouses our curiosity.3、宾语从句: The above chart records that+标题,which successfully arouses our curiosity.4、常用固定搭配法:It goes without saying that/There is no denying that the chart records+标题,which successfully arouses our curiosity.5、主语从句:It is clearly reflected by the chart that+标题,which successfully arouses our curiosity.6、As 引导的从句:As is clearly reflected by the chart, 标题,which successfully arouses our curiosity.第二类:图表阐释段整体表现的描写1、简单句:The chart clearly reflected 全部指数witnessed some changes from 时间to 时间。
2、As is clearly reflected by the chart, 全部指数witnessed some changes from 时间to 时间。
第三类: 图表阐释段最大变化/ 最大差异1、Especially,某指数experienced the most dramatic change, jumping/dropping from 数字to 数字during this time.2、Especially, shows the most obvious tendency that +具体表现。
考研英语(二)图表作文常用单词
来源:文都图书
每种类型作文都有其常用用语,考研英语(二)的图表作文也不例外,其要求考生应能根据所给的提纲、情景或要求完成相应的短文写作。
所以想要图表作文能拿高分的同学,学习一些高频常用单词是绝对必要的。
推荐大家用一用谭剑波老师的《考研英语(二)写作考前冲刺万用魔板》,这是一本非常有口碑的参考书。
1.Slump v.下降;衰落 n.衰退
【单词记忆】对比slip“下跌;滑倒”,和slump是元音互换,slump 仅仅多加了个辅音m。
两个词若是形近,意思往往也相近,如light 和slight形近意思也相近。
【同义替换】slip,fall,drop,decrease,decline,decay
【写作例句】The number of students going abroad has slumped.出国学生数量下降了。
2.reveal v.揭示;揭露;显示
【单词记忆】re-“往回”,veal来自veil“面纱”(a和i是元音字母互换)一个人戴着面纱,把它往回,就是“揭开,揭露,揭示”的意思。
【同义替换】show
【写作例句】The picture above reveals a common phenomenon that...以上图画揭示了一个普遍现象……
书中针对图表作文的概述、题型、模板、范文和命题预测等都进行了详细讲解,让考生们在短时间内迅速拿下图表作文,除此之外,书中还附备了图表作文高频核心词、低端词汇的高端替换以及图表作文的常用表达等等,可以迅速增加考生的知识储备量,十分有用。
最后预祝大家考研顺利!加油!。
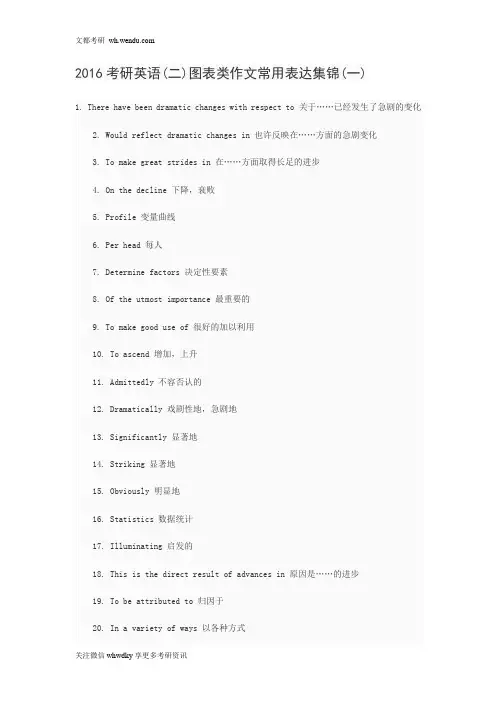
2016考研英语(二)图表类作文常用表达集锦(一)1. There have been dramatic changes with respect to 关于……已经发生了急剧的变化2. Would reflect dramatic changes in 也许反映在……方面的急剧变化3. To make great strides in 在……方面取得长足的进步4. On the decline 下降,衰败5. Profile 变量曲线6. Per head 每人7. Determine factors 决定性要素8. Of the utmost importance 最重要的9. To make good use of 很好的加以利用10. To ascend 增加,上升11. Admittedly 不容否认的12. Dramatically 戏剧性地,急剧地13. Significantly 显著地14. Striking 显著地15. Obviously 明显地16. Statistics 数据统计17. Illuminating 启发的18. This is the direct result of advances in 原因是……的进步19. To be attributed to 归因于20. In a variety of ways 以各种方式21. To acquaint themselves with 了解22. In terms of 在……方面,就……而言23. To attach importance to 更加注重24. It is no surprise that 不足为奇的是25. A mixed blessing 喜忧参半26. To make room for 为……腾出空间27. To take advantage of 利用28. To add more flavor to one’s routine life 给……的日常生活增添更多的乐趣29. To devote to 把……投入到30. To keep a close watch on 密切关注31. Unfavorable effects 不利影响32. To exert a significant effect on 对……施加重要的影响33. To face pressures from all sides 面对各方压力34. To take into account 考虑35. In quick and convenient way 以快捷方便的方式36. To curb the impact of…upon environment 遏制……对环境的影响2016考研英语(二)图表类作文常用表达集锦(二)一、引用图标内容时常用的过渡句型:1. As is revealed in the graph, …2. As the survey results show, …3. As we could find out later in this unit, his plan was not quite as he had expected.4. This table provides several important points of comparison between…二、描写曲线走势的常用句型:曲线的走势有上升、下降、持平和有所波动等来表述。
下载毙考题APP免费领取考试干货资料,还有资料商城等你入驻邀请码:8806 可获得更多福利2018考研英语二作文:图表描述常用词汇词组考研英语作文是考研英语的压轴题,自然受到考生的高度重视,为了方便考生备考,下面为大家整理了2018年考研英语二大作文常用表达,以供考生参考。
2018考研英语二作文:图表描述常用词汇词组■基本要素类型:table, chart, diagram/graph, column chart, pie graph描述:show, describe, illustrate, reveal, represent, can be seen from, clear,apparent内容:figure, statistic, number, percentage, proportion■表示数据变化的单词或者词组–动词(1) 起伏、波动rise and fall, fluctuate, wave, undulate, rebound, recover(2) 高、低点值peak, reach a (high) peak/point,reach the bottom, reach a low point(3) 增加、上升、提高increase, grow, rise, climb, expand, ascend, skyrocket, soar(4) 减少、下降decrease, decline, fall, drop, descend, diminish, slide, shrink,collapse形容词或副词(1)变化巨大迅速的,飞快的,rapid/rapidly戏剧性的,生动的dramatic/dramatically有意义的,重大的significant/significantly锐利的,明显的sharp/sharply急剧升降的steep/steeply(2)变化平缓稳固的,坚定不移的steady/steadily渐进的,逐渐的gradual/gradually缓慢的,不活跃的slow/slowly轻微的、略微地slight/slightly稳定的stable/stably考试使用毙考题,不用再报培训班。
图表作文(一)第一节图表作文的类型图表作文可分为两大类:表作文和图作文。
表作文表格(Table)可以使大量数据系统化,便于阅读、比较。
表格常由标题(Title)、表头(Boxhead)(表格的第一行)、侧目(Stub)(表格左边的第一列)和主体(Body)部分(表格的其余部分)等部分组成。
如下表:用表格表达的信息具体准确,而且表格中的各项均按一定规律排列。
阅读表格时要注意找出表格中各个项目的相互关系,表格中各个项目的变化规律。
例如,上面的表格中的数字说明,和1978年相比,1983年大学入学的人数在增加,而小学的入学人数在减少。
搞清楚这些变化规律也就读懂了表格的内容。
图作文图作文又可分为三种:圆形图作文、曲线图作文和条状图作文。
(1) 圆形图作文圆形图(Pie chart)也称为饼状图或圆面分割图。
圆形图因为比较形象和直观,各部分空间大小差别容易分辨,所以常用来表示总量和各分量之间的百分比关系。
整个圆表示总量,楔形块表示分量。
有时圆形图还有数值表,两者结合可把各分量表示得更准确、清楚。
例如:This is a pie chart of the average weekly expenditure of a family in Great Britain. As can be see from the chart, the main expenditure of an average British family is spent on food, which accounts for 25% of its total expenditure. The next two significant expending items are transport and housing, which are 15% and 12% respectively. If we take into account clothing and footwear, which makes up 10%, the four essentials of life, that is, food, transport, housing, and clothing and footwear, amount to 62% of the total expenditure.(2) 曲线图作文曲线图(Line graph)也称为线性图或坐标图。
英二大作文必备词汇句子,建议收藏图表趋势必备词汇上升趋势climb(过去时:climbed)go up(过去时:wentup)grow(过去时:grew)increase(过去时:increased)jump(过去时:jumped)rise(过去时:rose)下降趋势decline(过去时:decreased)drop(过去时:dropped)fall(过去时:fell)go down(过去时:went down)稳定趋势maintain(过去时:maintained)remain(过去时:remained)stay(过去时:stayed)逻辑连接必备词汇转折关系让步关系总结关系分点表述必备词汇(1)first, second, third, last(2)firstly, secondly, thirdly, finally(3)to begin with, then, further more, finally(4)to start with, next, in addition, finally(5)first and foremost, besides, last but not least(6)on the one hand, on the other hand(7)for one thing, for another thing引入话题句式▶As is shown/ illustrated/ described in the chart/ figure...正如图表所述/描写的那样...▶It can be seen from the graph/ table that...从图表中可看出...▶According to the data of the table...按照图表...▶From the chart we can see that..从表中我们可知...对比句式▶Indeed, A carries more weight than B when sth. Is concerned.▶A maybe…,but it suffers from the disadvantage that…▶A and B have sth. In common.▶The advantages of A are much greater than B.▶Compared with B, A has many advantages.▶Wonderful as A is,however,it has its own disadvantages too.▶Although A enjoys considerable advantage over...,it can not compete with B in…万能理由句子经济发展、科技进步▶For the living standards have improved significantly, many people can afford to buy private cars. 由于生活水平的显著提升,许多人能够买得起私家车。
一、图表作文写作常识1、图形种类及概述法:泛指一份数据图表:a data graph/chart/diagram/illustration/table 饼图:pie chart直方图或柱形图:bar chart / histogram趋势曲线图:line chart / curve diagram表格图:table流程图或过程图:flow chart / sequence diagram程序图:processing/procedures diagram2、常用的描述用法The table/chart diagram/graph shows (that)According to the table/chart diagram/graphAs (is)shown in the table/chart diagram/graphAs can be seen from the table/chart/diagram/graph/figures,figures/statistics shows (that)……It can be seen from the figures/statisticsWe can see from the figures/statisticsIt is clear from the figures/statisticsIt is apparent from the figures/statisticstable/chart/diagram/graph figures (that)……table/chart/diagram/graph shows/describes/illustrates how……3、图表中的数据(Data)具体表达法数据(Data)在某一个时间段固定不变:fixed in time在一系列的时间段中转变:changes over time持续变化的data在不同情况下:增加:increase / raise / rise / go up ……减少:decrease / grow down / drop / fall ……波动:fluctuate / rebound / undulate / wave ……稳定:remain stable / stabilize / level off ……最常用的两种表达法:动词+副词形式(V erb+Adverb form)形容词+名词形式(Adjective+Noun form)二、相关常用词组1、主章开头图表类型:table、chart、diagramgraph、column chart、pie graph描述:show、describe、illustrate、can be seen from、clear、apparent、reveal、represent 内容:figure、statistic、number、percentage、proportion2、表示数据变化的单词或者词组rapid/rapidly迅速的,飞快的,险峻的dramatic/dramatically戏剧性的,生动的significant/significantly有意义的,重大的,重要的sharp/sharply锐利的,明显的,急剧的steep/steeply急剧升降的steady/steadily稳固的,坚定不移的gradual/gradually渐进的,逐渐的slow/slowly缓慢的,不活跃的slight/slightly轻微的、略微地stable/stably稳定的3、其它在描述中的常用到的词significant changes图中一些较大变化noticeable trend明显趋势during the same period在同一时期grow/grew增长distribute分布,区别unequally不相等地in the case of adv.在……的情况下in terms of / in respect of / regarding在……方面in contrast相反,大不相同government policy政府政策market forces市场规率measure n.尺寸,方法,措施v.估量,调节forecast n.先见,预见v.预测三、考研英语图表写作套句精选1.the table shows the changes in the number of……over the period from……to……该表格描述了在……年之……年间……数量的变化。
英语图表作文必背图表作文必背词汇众所周知,考研英语二中的作文有两篇,其中一篇是应用文,这个比较简单,只要好好准备,基本大家都可以拿到6、7分。
第二种就是相对难一些的图表作文了。
在这部分,最新大纲要求考生根据所规定的情景或给出的提纲,写出一篇150字左右的英语说明文或议论文。
提供情景的形式为图画、图表或文字。
对于图表类作文,大家需要掌握大量的专业类的词汇,面对词汇量庞大的要求,大家需要夯实词汇基础,本期小编与大家分享的是考研英语二图表类作文:必背词汇,供大家参考学习。
一 :单词和词组1、增加、上升,提高动词:increase, grow , rise, climb,expand, ascend, escalate, gain名词:increase, rise ,growth, expansion, pickup, gain, upturn, escalation词组:go/ pick up, post/ register/ manage a moderate/ small gain, gain a momentum, continue its upward trend, on the rise/ increase/ ascendance, mount up.2、猛增动词: leap, jump, soar, rocket, skyrocket, surge, proliferate, explode名词: leap, jump, surge, proliferation, explosion词组:shoot up3、减少,下降动词:decrease, decline, fall, reduce, descend, diminish, drop, dip, slide, dwindle, shrink, lessen, sink 名词:decrease, decline, diminution, slowdown, shrinkage, dip ,drop, fall ,slide, reduction, downturn词组:go down, drop/ fall off, take a dip, continue its downward trend, on the decline/ decrease, slow down4、暴跌动词:slump, nosedive, plummet, plunge, collapse, dive名词:slump, nosedive, plunge ,collapse, dive5、剧烈地,显著地副词:dramatically,sharply, considerably, rapidly, greatly, alarmingly, significantly, enormously, steeply, massively, hugely, substantially, tremendously, drastically, precipitously, markedly词组:at an alarming rate, by/ in leaps and bounds. Bya wide./ significant margin6、缓慢地,逐渐地副词:gradually, steadily, slightly, gently, marginally ,slowly, moderately, modestly词组:in a moderate way, by a narrow margin7、波动:动词:fluctuate, vary, wave名词:fluctuation, variation词组:go up and down, ups and downs8、稳定在一个水平上动词:remain, keep, stay ,maintain, stabilize, stagnate形容词:stable, steady, constant, unchanged名词:stagnation, stability, steadiness, plateau词组:level of at ,leave out at , hove at .stabilize at , reach a plateau at9、达到最高点动词:peak, top名词:peak ,top, summit, zenith词组:peak at, reach the highest point at, reach a peakof , reach its zenith, be at its zenith10、达到最低点动词:bottom,名词:bottom, trough词组:bottom out at, reach the bottom at ,reach the lowest point at ,hit a trough11、达到多少数量动词:reach,hit,register词组:arrive at, stand at, amount to12、组成整体包含部分:comprise, consist of , be made up of , be composed of部分组成整体:constitute ,make up, form, occupy, account for, represent13、对将来数字预测的及物动词及物动词:expect, predict, project, forecast使用举例:A is expected/ predicted/ projected/ forecast to reach14、分别的副词副词: respectively15、大约(放在数字之前的)副词:about, around, approximately, roughly, nearly, almost (放在数字之前的)词组:just over, just under, close to, in the region of, in teh vicinity of , in the neighborhood of(放在数字之后的)词组:or so, or thereabouts16、描绘,描述,显示,表明动词:show, depict, describe, illustrate, outline, represent, reveal, delineate二 :长难句1、the chart describes the changes in full time employment rates across a wide range of age groups in Europe between 1969 and 1999.2、the data indicate changes in spending habits during the past forty years in UK.3、the chart describes the world population growth spanning two centuries.4、the chart outlines energy consumption in the UK over a twelve month period.5、the data presented in the chart represent the amount and types of books sold in the US during the period 1980 to 2010.6、the data show a comparison between the amount of red wine that is consumed and the rates of heart disease in certain European cities.7、a glance at the graph provided reveals some striking similarities between the Chinese and U.S.birth rates during the period from 1920 to 2000.8、given is a figure concerning criminality in Britain.9、the graph illustrates changes in the amounts of beef, lamb, chicken and fish consumed in a particular European country between 1979 and 2004.10、according to the chart,……11、As is shown in the table,……12、it is clear obvious/ apparent from the chart that ……13、in comparison with A, B is ……14、the number of ……has increased seven fold from ……to ……in 2000.15、it is interesting to note that there is a certain correlation between ……and ……16、A is three times as much as B17、the number sharply we nt up to……18、the graph shows a threefold increase in number of ……————— / END / —————。
考研英语二图表类作文常用描述词汇及表达本文汇总了考研英语二大作文图表类作文写作中描述词汇、词组及句型常用表达的相关内容,帮助大家在考研英语作文中拿到高分。
图表描述词汇、词组及句型常用表达
基本要素
类型:
table, chart, diagram/graph, column chart, pie graph
描述:
show, describe, illustrate, reveal, represent, can be seen from, clear, apparent
内容:
figure, statistic, number, percentage, proportion
表示数据变化的单词或者词组–动词
(1) 起伏、波动
rise and fall, fluctuate, wave, undulate, rebound, recover
(2) 高、低点值
peak, reach a (high) peak/point,reach the bottom, reach a low point
(3) 增加、上升、提高
increase, grow, rise, climb, expand, ascend, skyrocket, soar
(4) 减少、下降
decrease, decline, fall, drop, descend, diminish, slide, shrink, collapse 形容词或副词
(1)变化巨大
迅速的,飞快的,rapid/rapidly
戏剧性的,生动的dramatic/dramatically
有意义的,重大的significant/significantly
锐利的,明显的sharp/sharply
急剧升降的steep/steeply
(2)变化平缓
稳固的,坚定不移的steady/steadily
渐进的,逐渐的gradual/gradually
缓慢的,不活跃的slow/slowly
轻微的、略微地slight/slightly
稳定的stable/stably
英语图表写作套句推荐
图表的总体描述
1.The table shows the changes in the number of……over the period from……to……
2.The data/statistics/figures lead us to the conclusion that……
3.As can be seen from the diagram, great changes have taken place in……/ the two curves show the fluctuation of……
4.From the table/chart/diagram/figure, we can see clearly that……or it is clear/apparent from the chart that……
5.This is a graph which illustrates……
6.The graph, …presented in a pie chart, shows the general trend in……
7.This is a column chart showing……
时间段表达方式
1.over the period from…to…the…remained level.
2.in the year between……and……
3.in the 3 years spanning from 1995 through 1998……
4.from then on/from this time onwards……
数据变化表达方式
表示上升趋势的句型:
1.the number sharply went up to……
2.the figures peaked at……in(month/year)
3.the situation reached a peak(a high point at) of[%].
4.a increased by……
5.a increased to……
6.there is an upward trend in the number of……
7. a considerable increase/decrease occurred from……to……
8.……(year)witnessed/saw a sharp rise in……
表示下降趋势的句型:
1.the figures/situation bottomed out in……
2.the figures reached the bottom/a low point/hit a trough.
3.from……to……the rate of decrease slow down.
4.from this year on,there was a gradual decline/ reduction in the……,reaching a figure of……
表示平稳趋势的句型:
1.the number of……remained steady/stable from (month/year) to (month/year).
2.the percentage of…stayed the same between…and……
3.the percentage remained steady at……
表示比较的句型:
1.the percentage of…is slightly larger/smaller than that of
2.there is not a great deal of difference between……and……
3.…decreased year by year while……increased steadily.
4.there are a lot similarities/differences between……and……
5.a has something in common with b
6.the difference between a and b lies in……
表示倍数的句型:
1.the graphs show a threefold increase in the number of……
2.a is ……times as much/many as b.。