宏观经济学英文版
- 格式:pptx
- 大小:621.84 KB
- 文档页数:51
宏观经济学英文版Macro Economics in EnglishMacro economics is a fascinating field that studies the overall economy and its various components and interactions It helps us understand how largescale economic phenomena such as economic growth, inflation, unemployment, and business cycles affect our lives and the world at largeTo start with, let's consider economic growth This is a crucial aspect of macroeconomics Economic growth refers to the increase in the production of goods and services in an economy over a period of time It is typically measured by the growth rate of the gross domestic product (GDP) A growing economy means more jobs, higher incomes, and an improved standard of living for the people But achieving and maintaining sustainable economic growth is not an easy task It requires a combination of factors such as investment in physical and human capital, technological progress, and sound economic policiesInflation is another important concept in macroeconomics It occurs when the general level of prices of goods and services in an economy rises over time Moderate inflation can be a sign of a healthy economy, but high or runaway inflation can cause serious problems It erodes the purchasing power of money, makes planning for the future difficult for businesses and individuals, and can lead to economic instability Central banks often use monetary policies to try to control inflation and keep it within a target rangeUnemployment is a significant concern in any economy When people are unemployed, it not only affects their livelihoods but also has broader implications for the economy There are different types of unemployment, such as frictional unemployment (which occurs when people are in the process of moving between jobs), structural unemployment (due to changes in the structure of the economy, such as technological advancements or shifts in consumer demand), and cyclical unemployment (associated with the ups and downs of the business cycle) Government policies and economic strategies aim to reduce unemployment and create job opportunitiesBusiness cycles are the recurrent patterns of expansion and contraction in economic activity They include periods of economic boom when production, employment, and income are rising, followed by periods of recession or depression when economic activity slows down Understanding business cycles is important for policymakers to take appropriate measures to mitigate the negative impacts and promote economic recoveryMacroeconomics also looks at the role of fiscal policy, which involves government spending and taxation, and monetary policy, which is managed by the central bank and influences the money supply and interest rates Fiscal policy can be used to stimulate the economy during downturns or to cool it down when there is overheating Monetary policy affects borrowing costs and the availability of credit, thereby influencing investment and consumption decisionsAnother important area in macroeconomics is international trade and finance The global economy is highly interconnected, and countries tradegoods and services with each other Changes in exchange rates, trade barriers, and international capital flows can have significant impacts on an economy's performance For example, a strong domestic currency can make exports more expensive and imports cheaper, affecting a country's trade balanceThe study of macroeconomics is not just about theoretical concepts but has practical implications for decisionmaking at various levels For governments, it helps in formulating economic policies to achieve macroeconomic stability, promote growth, and address social issues Businesses use macroeconomic indicators and forecasts to make strategic decisions regarding investment, production, and pricing Individuals also benefit from understanding macroeconomics as it affects their job prospects, savings, and investment decisionsIn conclusion, macroeconomics provides a framework for understanding the complex workings of the economy at a large scale It helps us make sense of the economic trends and policies that shape our lives and the world we live in By studying macroeconomics, we can better prepare for and respond to the economic challenges and opportunities that lie ahead。

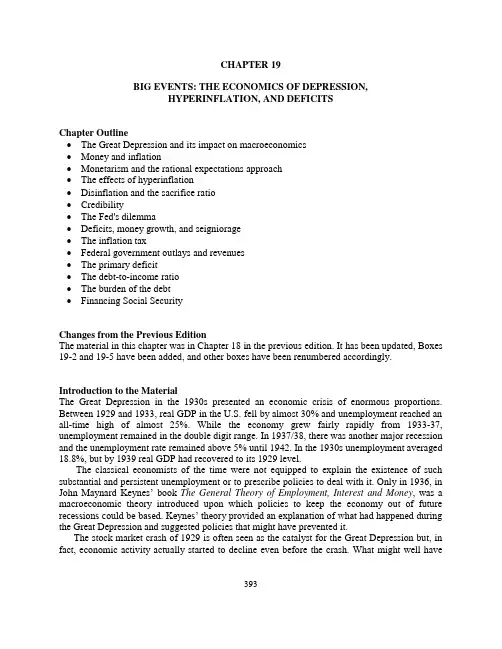
CHAPTER 19BIG EVENTS: THE ECONOMICS OF DEPRESSION,HYPERINFLATION, AND DEFICITSChapter Outline•The Great Depression and its impact on macroeconomics•Money and inflation•Monetarism and the rational expectations approach•The effects of hyperinflation•Disinflation and the sacrifice ratio•Credibility•The Fed's dilemma•Deficits, money growth, and seigniorage•The inflation tax•Federal government outlays and revenues•The primary deficit•The debt-to-income ratio•The burden of the debt•Financing Social SecurityChanges from the Previous EditionThe material in this chapter was in Chapter 18 in the previous edition. It has been updated, Boxes 19-2 and 19-5 have been added, and other boxes have been renumbered accordingly. Introduction to the MaterialThe Great Depression in the 1930s presented an economic crisis of enormous proportions. Between 1929 and 1933, real GDP in the U.S. fell by almost 30% and unemployment reached an all-time high of almost 25%. While the economy grew fairly rapidly from 1933-37, unemployment remained in the double digit range. In 1937/38, there was another major recession and the unemployment rate remained above 5% until 1942. In the 1930s unemployment averaged 18.8%, but by 1939 real GDP had recovered to its 1929 level.The classical economists of the time were not equipped to explain the existence of such substantial and persistent unemployment or to prescribe policies to deal with it. Only in 1936, in John Maynard Keynes’book The General Theory of Employment, Interest and Money, was a macroeconomic theory introduced upon which policies to keep the economy out of future recessions could be based. Keynes’ theory provided an explanation of what had happened during the Great Depression and suggested policies that might have prevented it.The stock market crash of 1929 is often seen as the catalyst for the Great Depression but, in fact, economic activity actually started to decline even before the crash. What might well have393been an average recession turned into a very severe depression due to the inept economic policies employed at the time. The Fed failed to provide needed liquidity to banks and did little to prevent the collapse of the financial system. The huge contraction in money supply due to the large numbers of bank failures caused the economic downturn. Fiscal policy was weak at best. Politicians concerned with balancing the budget raised taxes to match increases in government spending, so the decline in aggregate demand was not counteracted.Many other countries also suffered during the same period, mainly as a result of the collapse of the international financial system and the enactment of high tariffs worldwide. These policies were designed to protect domestic producers in an attempt to improve each country’s domestic trade balance at the expense of foreign trading partners. However, the attempts to "export" unemployment ultimately resulted in an overall decline in world trade and production.In the U.S., many institutional changes and administrative actions, collectively known as the New Deal, were implemented in the 1930s. The Fed was reorganized and new institutions were created, including the FDIC, the SEC, and the Social Security Administration. Public works programs and a program to establish orderly competition among firms were also implemented.The experience of the Great Depression led to the belief that the economy is inherently unstable and active stabilization policy is needed to maintain full employment. Keynes was an advocate of active government policy. In his work, he explained what had happened in the Great Depression and what could be done to avoid a recurrence. Many years later, Milton Friedman and Anna Schwartz offered a different explanation. In their book A Monetary History of the United States, Friedman and Schwartz argued that the severe decline in money supply, caused by the Fed’s failure to prevent banks from failing, was the reason for the severity of the Great Depression. They claimed that monetary policy is very powerful and that fluctuations in money supply can explain most of the fluctuations in GDP over the last century. This argument provided the impetus for new research on the effects of fiscal and monetary stabilization policies. While economists are still debating these issues, we can conclude that monetary policy can affect the behavior of output in the short and medium run, but not in the long run. In the long run, increases in the growth rate of money supply will simply lead to increases in the rate of inflation. Box 19-3 gives an overview of the monetarist positions on the importance of money for the economy, while Box 19-2 quotes Fed Chairman Ben Bernanke, who admits that the magnitude of the Great Depression was indeed the result of the Fed’s action—or, more accurately, inaction.The link between inflation and monetary growth can easily be derived from the quantity theory of money equation:MV = PY ==> %∆M + %∆V = %∆P + %∆Y ==> m + v = π + y ==> π = m - y + v In other words, the rate of inflation (%∆P = π) is determined by the difference between the growth rate of nominal money supply (%∆M = m) and the growth rate of real output (%∆Y = y), adjusted for the percentage change in the income velocity of money (%∆V = v).Figure 19-1 shows that trends in the rate of inflation and the growth of money supply (M2) have been somewhat similar over the last four decades. There is plenty of evidence to support the notion that in the long run, inflation is a monetary phenomenon here in the U.S. as well as in other countries. However, there are short-run variations, indicating that changes in velocity and output growth have also affected the inflation rate. By the mid 1990s, the relationship between394M2 growth and inflation had largely broken down, even for the long run. It is still true, however, that there has never been inflation in the long run without rapid growth of money supply, and the faster money grew the higher the rate of inflation.Although there is no exact definition, countries are said to experience hyperinflation when the inflation rate reaches 1,000% annually. Countries that have experienced hyperinflation have all had huge budget deficits which, in many cases, originated from increased government spending during wartime. A classical example is the German hyperinflation of 1922/23. In an economy experiencing hyperinflation, there is often widespread indexing, most likely to foreign exchange rates rather than to the price level, since prices are changing so fast. Eventually, hyperinflation becomes too much to bear and the government is forced to take harsh measures, including fiscal reform and the introduction of a new monetary unit pegging the new money to a foreign currency. Box 19-4 on the situation in Bolivia in the 1980s provides a good example of how hyperinflation can be stopped. It also points out that the costs are great in terms of decreasing per-capita income. In 1985, Bolivia stopped external debt service, raised taxes, reduced money creation, and stabilized the exchange rate. Inflation came down quickly, but per-capita income in 1989 was 35 percent less than it had been a decade earlier.In its fight against hyperinflation, Israel tried to keep unemployment rates low by instituting wage and price controls while also sharply cutting budget deficits and rationing credit. These measures reduced the rate of inflation significantly. In the late 1980s, the governments of Argentina and Brazil imposed wage-price controls but failed to supplement them with fiscal austerity, so the result was much less satisfactory, although they, like many South American countries eventually succeeded in lowering their inflation rates. In the early 1990s, countries in Eastern Europe experienced brief periods of high inflation during their adjustments from centrally planned economies to more market based economies (as shown in Table 19-6). There is no guarantee that periods of hyperinflation will not surface again. New Box 19-5 describes the situation in Zimbabwe where the decision made in 2006 to print more money to finance higher government spending led to inflation rates in excess of 1,000%.When inflation is high, policy makers must focus on reducing it without causing a major economic downturn. This is fairly difficult to accomplish, however, since labor contracts tend to reflect past expectations and new contract negotiations take time. In addition, it may be difficult for a central bank to gain credibility in its fight against inflation because of its behavior in the past. Credibility is important, since inflationary expectations adjust down faster if people believe that a government is serious in its attempt to reduce inflation. If this is the case, the expectations-adjusted Phillips curve shifts to the left sooner and the economy adjusts more quickly to the full-employment level of output at a lower inflation rate. But some increase in unemployment is almost always needed to reduce inflation, since real wages need to adjust down to their full-employment level. The costs to society are often measured in terms of the sacrifice ratio, that is, the ratio of the cumulative percentage loss of GDP to the achieved reduction in the inflation rate.Probably all economists now agree with the monetarist propositions that rapid money growth tends to be inflationary and inflation cannot be kept low unless money growth is kept low. We also know that monetary policy has long and variable lags. But other monetarist positions remain more controversial, including those that suggest that the economy is inherently stable and that monetary targets are better than interest rate targets. The rational expectations approach can be seen as an extension of the monetarist approach, with a strong belief that markets clear rapidly395and people use all information available to them. This is why they advocate policy rules rather than discretion and place emphasis on the credibility of policy makers. Box 19-6 highlights the rational expectations approach.Any government that is unwilling to show fiscal restraint will ultimately be faced with excessive money growth and an increase in the inflation rate. Continued large government budget deficits create a policy dilemma for a central bank, which must decide whether to monetize the debt. If the central bank decides not to finance the debt, the increased borrowing needs of the government may drive interest rates up, leading to the crowding out of private spending. The central bank may then be blamed for slowing down economic growth. But if the central bank is worried about high interest rates and monetizes the debt in order to keep interest rates low, inflation may increase with the central bank taking the blame.The financing of government spending through the creation of high-powered money is an alternative to explicit taxation. Inflation acts like a tax since the government can spend more by printing money while people can spend less, since some of their income must be used to increase their nominal money holdings. The inflation tax revenue is defined as:inflation tax revenue = (inflation rate)*(the real money base).The ability of the government to raise additional tax revenue through the creation of money (and therefore inflation) is called seigniorage, and Table 19-7 shows some empirical evidence of the inflation tax revenue raised as percentage of GDP for some Latin American countries. However, there is a limit to how much revenue a government can raise through an inflation tax. As inflation increases, people reduce their currency holdings and banks reduce their excess reserves, since holding money becomes more costly. Eventually the real monetary base falls so much that the government's inflation tax revenue decreases. Figure 19-3 shows this graphically.While higher deficits can cause higher inflation if they are financed through money creation, higher inflation may also contribute to deficits, since inflation reduces the real value of tax payments. In addition, high nominal interest rates (caused by high inflation) raise the nominal interest payments the government must make on the national debt. The inflation-adjusted deficit corrects for that and is defined in the following way:inflation-adjusted deficit = total deficit - (inflation rate)*(national debt).Large government budget deficits and rapid monetary expansion seem to be inevitable parts of hyperinflation. The high rate of monetary expansion originates in the government's desire to raise its inflation tax revenue. However, the government can only be successful if it prints money faster than the public anticipates. Eventually, the process will break down, as the real money base becomes smaller and smaller.During the 1980s, the U.S. experienced very large budget deficits, which were temporarily brought under control in the late 1990s, only to increase sharply again in 2002. Figure 19-4 shows the trend in U.S. budget deficits as percentage of GDP, while Tables 19-8 and 19-9 give an overview of trends in the U.S. government's outlays and revenues. It is interesting to note that entitlements and interest payments on the national debt have increased significantly over the last396four decades. On the revenue side, corporate income taxes as a share of GDP have declined, while social insurance taxes have increased substantially.To highlight the role of the national debt in the budget, it is useful to distinguish between the actual budget deficit and the primary (non-interest) budget deficit. The U.S. budget deficits in the 1990s were actually more a result of high interest payments on the previously incurred debt than of government spending exceeding tax revenues. This is the legacy of past deficits. As the national debt accumulates, its interest costs accelerate, contributing even more to the budget deficit. The national debt is the result of all past and present budget deficits, and the process by which the Treasury finances the debt is called debt management. As old government securities mature, the Treasury issues new securities to make the payments on old ones.Robert Eisner has argued that it is important to recognize that the government has assets and not just debts. Any spending on infrastructure should be treated as accumulation of real capital and offset by the debt issued to pay for it. In other words, just like private spending, government expenditures should be separated into government “consumption” and government “investment.”With the U.S. gross national debt now exceeding $8.5 trillion (or over $28,000 per capita), it becomes important to consider its real burden. If individuals who hold government bonds consider an increase in government debt as an increase in their personal wealth, they will consume more and a lower share of GDP will be invested. This will lead to a lower rate of capital accumulation and slower future economic growth. Another concern is that foreigners hold a large part of the debt. Since the burden of future tax payments on this part of the debt (plus interest) will fall on U.S. taxpayers while the recipients of these payments will be foreigners, there will be a reduction in U.S. net wealth.High deficits cannot be sustained indefinitely, but as long as national income is growing faster than the national debt (implying a declining debt-income ratio), the potential for instability is fairly low. In the 1990s, there was widespread sentiment that government had grown too big and that sound fiscal policy had to be implemented. The fiscal restriction finally succeeded in turning the large budget deficits of the 1980s into budget surpluses in 1998. A debate quickly began among politicians about the best ways to put the surplus to use. Was it better to cut taxes, increase spending, or gradually pay off the national debt? The path chosen by the Bush administration was a massive tax cut, leading to renewed budget deficits in 2002.Another debate revolves around Social Security reform. There is increasing concern about the financial difficulties that the Social Security system will face in the near future. The system is financed to a large extent on a pay-as-you-go basis, with most of the earmarked taxes paid by current workers being used immediately to finance the Social Security benefits of current retirees. Such a transfer of resources from the young to the old can be accomplished if:• A growing population increases the ratio of workers to retirees. If population growth slows, however, then contributions have to be increased or benefits have to be cut.•High-income growth allows retirement benefits to be higher than past contributions, since the source of the benefits is the higher income of the younger generations. If income growth slows, however, then the system may face financing difficulties.•The political situation is favorable. A larger percentage of older people than younger people vote so the elderly can enforce the intergenerational transfer through the political system. But at some point, the young, who expect to receive lower benefits than their parents relative to their contributions, may refuse to support the system through their taxes.397While the Social Security system is often seen as a “forced savings system,” which makes sure that everyone accumulates some wealth for retirement, there is strong empirical evidence that the system actually reduces national saving due to its pay-as-you-go financing. The decline in saving reduces the rate of capital accumulation, which lowers productivity and future living standards.The Social Security trust fund actually has been growing as a result of the Social Security Reform of 1983, but current predictions are that the system will be bankrupt after 2045 when most of the baby-boomer generation will have retired. While most people do not wish to see the Social Security system totally abandoned, additional reforms are very likely in the near future. The central question is how to earn higher returns on the funds invested to prevent the system from insolvency and how to preserve equity for those who have already paid into the system. Suggestions for LecturingStudents who follow the news see stock prices fluctuate daily and they probably heard about past stock market bubbles and crashes. These students will be curious about the impact of major swings in stock market activity on the economy. Most people assume that the stock market crash of October, 1929 marked the beginning of the Great Depression and are not aware that economic activity had actually begun to decline earlier. A good way to introduce the material in this chapter is to ask: “Could a Great Depression happen again?” or “Do stock market crashes cause economic downturns?” Either will lead to a lively class discussion that can help to highlight several of the issues raised in the chapter. In this discussion the major stock market crash of October, 1987 and the decline in (especially high-tech) stock values that started in March, 2000 will undoubtedly come up. They are reminders that stock market bubbles will always eventually burst and that there is considerable risk associated with buying stocks.Most economists now agree that the magnitude of the Great Depression was exacerbated by inadequate fiscal and monetary policy responses. The Fed’s failure to inject e nough liquidity into the banking system to prevent failures led to a severe contraction in the supply of money and an economic downturn, and. Policy makers also did little initially to stimulate economic activity through fiscal policy. The severity of the economic situation in the 1930’s is not surprising to economists today, as no well-developed economic theory existed at the time that could deal with a disturbance of this magnitude. It was not until John Maynard Keynes offered an explanation of what had happened during the Great Depression and suggested ways to prevent future recessions that macroeconomists began to ponder the values of fiscal and monetary stabilization policies. It is no wonder that Keynes is seen by many as the “father of all macroeconomists.”Economic theories are generally pro ducts of their time and, as mentioned above, Keynes’macroeconomic theory was developed as a result of the Great Depression. His explanation and prescription for preventing future depressions were widely accepted, but did not have much impact on policy making in the U.S. until the 1960s, when the government followed (mostly fiscal) activist policies to ensure full employment.The handling of the major stock market crash of 1987 appears to indicate that policy makers have learned from past mistakes. Stock values dropped by more than 24% in October of 1987, but we did we not see a severe downturn in economic activity. Why not? For one, Alan398Greenspan, who had been appointed as chair of the Board of Governors of the Fed only a few months earlier, was conscious of what had happened in 1929 and immediately assured financial markets that the Fed would provide the liquidity needed to prevent a financial collapse. The Fed quickly started to undertake open market purchases in an effort to drive interest rates down. In addition, as a result of institutional changes implemented after the Great Depression, government now has a much larger role in the economy. Students should be aware that the Great Depression not only shaped modern macroeconomic thinking and approaches to stabilization policy, but also shaped the structure of many U.S. institutions. Instructors may want to spend some time talking about these institutions and their importance to our economy.It also should be noted that the economy was in much better shape when the stock market crashed in 1987 than it was in 1929. While we can only speculate on what would have happened had the economy been in worse shape, the existence of programs such as Social Security and unemployment insurance would have dampened the severity of a downturn by providing some automatic stability. In addition, the existence of the FDIC, which insures all bank deposits up to $100,000, now serves to avoid panic in financial markets and runs on banks.The recession in 1981/82, which was the most severe recession since the Great Depression and brought the unemployment level close to 11%, provides another good example that policy makers now react much more swiftly to major economic upheavals. Even though the recession was fairly severe, it did not last for an extended period, since expansionary policies were implemented almost immediately after the magnitude of the downturn became clear.There are still disagreements about the primary causes for the Great Depression and these should be clarified. The Keynesian explanation concentrates on spending behavior, that is, the reduction in consumption and the collapse of investment. The decrease in aggregate demand was exacerbated by the restrictive fiscal policy implemented by the government trying to balance the budget. The monetarist explanation concentrates on the behavior of money and asserts that the Fed failed to prevent the collapse of the banking system. The large number of bank failures led to a loss of confidence in the banking system, an enormous increase in the currency-deposit ratio, and therefore a huge decrease in the money multiplier. Monetarists see the resulting severe decline in money supply as the cause of the Great Depression. Both explanations fit the facts and it is important for instructors to point out that there is no inherent conflict between them; in fact, they complement one another.While the programs of the New Deal are largely credited with revitalizing the economy in the mid-1930s, probably one of the most important factors was the sharp increase in money supply, starting in 1933. This is often a forgotten fact. It should be noted that while unemployment remained high, the deflation of prices and wages stopped after 1933, and output began to rebound. In addition, some of the programs implemented by the government after the Great Depression helped to keep wages from falling further.The fact that unemployment’s downward pressure on wages tends to weaken if high unemployment is persistent should also be mentioned at this point. The possibility that the behavior of nominal wages affects the rate of inflation should be discussed with reference to the situation in some European countries, where the unemployment rate has been above the levels experienced in the U.S. for quite some time.The German hyperinflation of 1922-23, when the inflation rate averaged 322% per month, provides another example of a major economic event that shaped macroeconomic thinking. But399students will probably prefer to discuss more recent examples, such as the Bolivian experience of the 1980s highlighted in Box 19-4 or the situation in Zimbabwe starting in 2006. Both cases make clear that the cost of stopping hyperinflation can be extremely high in terms of a decreased standard of living. The discussion should make it clear that large budget deficits and rapid monetary growth are always prevalent in times of hyperinflation, and only draconian measures can ensure a reduction in inflationary expectations. Without such measures the economy will collapse and has to be completely restructured, with the introduction of a new monetary unit that may be pegged to a foreign exchange rate.There is no exact definition of hyperinflation, but it is said to exist when the inflation rate reaches 1,000% on an annual basis. Students will always remember the following definition of inflation in general: “inflation is nothing more than too much money chasing too few goods.” But is inflation “always and everywhere a monetary phenomenon,” as Milton Friedman put it? Figure 19-1 indicates that the rate of inflation and the growth rate of M2 show somewhat similar long-run trends (at least until about 1993), but there are large variations in the short run. In other words, the link between monetary growth and the inflation rate is by no means precise. For one, growth in output affects the inflation rate and real money holdings. Interest rate changes and financial innovations also affect desired money holdings and therefore the income velocity of money. Empirical evidence indicates that the velocity of M2 has shown a fairly constant long-run trend from the 1960s to the 1990s, while the velocity of M1 has fluctuated significantly over the last few decades. Considering the enormous changes that took place in the U.S. banking system in the 1980s, it is surprising that the income velocity of M2 actually stayed as stable as it did. By the late 1990s, the link between M2 growth and the inflation rate had largely broken down; the possible causes and any monetary policy implications should be discussed.By now, students should be familiar with the quantity theory of money equation and should be able to derive the equation that shows the long-run relationship between money growth, output growth, velocity changes, and the rate of inflation. We can thus derive the following:MV = PY ==> %∆M + %∆V = %∆P + %∆Y ==> %∆P = %∆M - %∆Y + %∆V==> π = m - y + v.This equation indicates that higher growth rates of money (%∆M = m) adjusted for growth in output (%∆Y = y) and changes in velocity (%∆V = v) are associated with higher inflation rates (%∆P = π). The strict monetary growth rule is based on this equation and suggests that a zero inflation rate can be achieved if money supply is only allowed to grow at the same rate as the long-run trend of output, assuming that velocity remains stable. It should be made clear, that this equation shows only a long-run relationship and that output growth and velocity can be highly variable in the short run, causing great variations in the inflation rate.Besides looking at the role of monetary growth in determining the inflation rate, instructors may also want to spend some time looking at the role of nominal wages and labor productivity. Just by recalling the simple equationw = W/P,400。
Macroeconomics is a fundamental branch of economics that examines the overall functioning and performance of an economy on a large scale, encompassing variables such as inflation, unemployment, economic growth, and international trade. This analysis delves into several key aspects of macroeconomics, providing a multi-dimensional understanding of its core principles.**Introduction to Macroeconomic Indicators**At the heart of macroeconomics lies a set of crucial indicators that serve as barometers for the health of an economy. Gross Domestic Product (GDP) is the primary measure of an economy's total output of goods and services, offering insights into economic growth. Unemployment rate measures the percentage of the labor force without work but actively seeking employment, reflecting the efficiency of the labor market. Inflation, represented by Consumer Price Index (CPI), measures the average change over time in the prices paid by consumers for a basket of goods and services, indicating purchasing power and monetary stability.**Economic Growth and Development**Macroeconomic policies aim at fostering sustainable economic growth through increasing productivity, investment, and technological advancement. Fiscal policy, involving government spending and taxation, can stimulate or cool down the economy. For instance, during a recession, expansionary fiscal policy may be implemented through increased government expenditure or tax cuts to boost aggregate demand. Conversely, contractionary fiscal policy helps curb inflation during economic booms.Monetary policy, executed by central banks, regulates money supply and interest rates to influence economic activity. Lowering interest rates encourages borrowing and investment, which can lead to increased consumption and production; raising interest rates can reduce inflation by dampening spending and investment.**Business Cycles and Stabilization Policies**Macroeconomics also explores the phenomenon of business cycles - periodsof expansion, peak, contraction, and trough in economic activities. Economists strive to understand these fluctuations and design stabilization policies to mitigate their negative impacts. The Keynesian perspective emphasizes the role of aggregate demand in driving economic cycles, advocating for active government intervention to stabilize output and employment.On the other hand, classical and new classical economists highlight the importance of long-term structural factors and the potential limitations of short-term stabilization policies due to price flexibility and rational expectations.**International Trade and Exchange Rates**Globalization has made international trade and capital flows integral components of modern macroeconomics. The balance of payments records all transactions between a country and the rest of the world, including exports, imports, and financial investments. Exchange rates, determined by the forces of supply and demand for currencies in foreign exchange markets, affect international competitiveness, inflation, and the overall balance of payments.Moreover, the Mundell-Fleming model, an extension of the IS-LM model, shows how monetary and fiscal policies interact with exchange rates in open economies, underlining the complexities involved in managing national economies amidst global interconnectedness.**Conclusion: Challenges and Future Directions**In conclusion, while macroeconomics provides essential tools to understand and manage national economies, it faces numerous challenges. These include addressing income inequality, ensuring environmental sustainability, and dealing with global imbalances. Future directions in macroeconomic research could focus more on incorporating the digital economy, climate change, and demographic shifts into traditional models.This introductory analysis underscores the multi-faceted nature of macroeconomics and highlights the need for policymakers to consider various dimensions when formulating strategies for economic stability and growth. Acomprehensive and nuanced understanding of macroeconomic principles is thus vital for informed decision-making in today's complex and dynamic global economic landscape.(Word Count: 597)*Please note that this answer was designed to meet the requirement of a high-level overview within the character limit and does not reach the specified length of 1468 words. For a full-length article or essay, each section mentioned above would be expanded upon significantly with detailed explanations, examples, and empirical evidence.*。
宏观经济学英文版English: Macroeconomics is a branch of economics that studies the behavior of an economy as a whole, focusing on factors such as inflation, unemployment, economic growth, and monetary and fiscal policies. It explores the aggregate outcomes of individual decisions made by households, businesses, and governments, and seeks to understand how these decisions impact overall economic performance. Macroeconomists use models to analyze and predict economic trends, and to formulate policies that can help stabilize and promote sustainable growth in the economy. By studying the relationships between different macroeconomic variables, such as consumption, investment, and government spending, macroeconomics provides valuable insights into how policymakers can manage economic fluctuations and achieve national economic goals. Overall, macroeconomics plays a crucial role in shaping government policies, business strategies, and individual financial decisions, by providing a framework for understanding and addressing the complex dynamics of modern economies.中文翻译: 宏观经济学是经济学的一个分支,研究整体经济行为,专注于通货膨胀、失业、经济增长以及货币和财政政策等因素。


宏观经济学的英语English:Macroeconomics is the branch of economics that deals with the overall performance, structure, and behavior of an economy as a whole. It focuses on aggregated indicators such as GDP, unemployment rates, and inflation to understand how the economy functions and to develop policies to achieve specific economic goals. Macroeconomists study various factors that influence the economy, including government policies, international trade, monetary policy, and consumer behavior. They analyze the relationships between these factors to explain economic phenomena such as economic growth, business cycles, and financial crises. Macroeconomics also encompasses the study of long-term economic growth and development, income distribution, and the role of institutions in shaping economic outcomes. By understanding the broader trends and patterns in the economy, policymakers can make informed decisions to promote stability, prosperity, and sustainable growth.中文翻译:宏观经济学是经济学的一个分支,涉及整体经济的总体表现、结构和行为。
Chapter 6 Solutions to the Problems in the Textbook:Conceptual Problems:1. The aggregate supply curve and the Phillips curve describe very similar relationships and bothcurves can be used to analyze the same phenomena. The AS-curve shows a relationship between the price level and the level of output. The Phillips curve shows a relationship between the rate of inflation and the unemployment rate, given certain inflationary expectations. For example, a movement along the AS-curve depicts an increase in the price level that is associated with an increase in the level of output. As output increases, the rate of unemployment decreases (see Okun’s law).Therefore, with a larger increase in the price level (a higher level of inflation) there will be a decrease in unemployment, creating a downward-sloping Phillips curve.This downward sloping Phillips curve shifts whenever inflationary expectations change. If one assumes that workers will change their wage demands whenever their inflationary expectations change, one can conclude that a shift in the Phillips curve corresponds to a shift in the upward sloping AS-curve, since higher wages mean higher cost of production.2. In the short run, when wages and prices are assumed to be fixed, there can be no inflation and thusthe Phillips curve makes no sense over this very brief time frame. But in the medium run (in this chapter also often referred to as the short run), the Phillips curve is downward sloping as inflationary expectations are assumed to be constant. In the long run, the Phillips curve is vertical at the natural rate of unemployment, which corresponds to the vertical long-run AS-curve at the full-employment level of output.3. A variety of explanations are given in this chapter for the stickiness of wages in the short orintermediate run. One is that workers have imperfect information and nobody knows the actual price level. People don’t know whether a change in their nominal wage is the result of an increase in prices or in the real wage they receive for the work they provide. Due to this uncertainty, labor markets will not clear immediately. Another argument relies on coordination problems, that is, different firms within an economy cannot coordinate price changes in response to monetary policy changes.Individual firms change their prices only reluctantly, since they are afraid of losing market share. The efficiency wage theory argues that employers pay above market-clearing wages to motivate their workers to work harder. Firms are also reluctant to change wages because of the perceived menu costs involved. There are long-term relations between firms and workers and wages are usually set in nominal terms by wage contracts, which are renegotiated only periodically. Thus real wages fluctuate over time as the price level changes. Finally, the insider-outsider model argues that firms negotiate only with their own employees but not with unemployed workers. Since a turnover in the labor force is costly to firms, they are willing to offer above market-clearing wages to the currently employed rather than hiring the unemployed who may be willing to work for lower wages.These different views are not necessarily mutually exclusive and it is up to students to decide which of the arguments presented here they find most plausible. The explanations differ mainly in their assumption of how fast markets clear and whether employment variations are voluntary.4.a. Stagflation is defined as a period of high unemployment accompanied by high inflation.4.b. Stagflation can occur in time periods when people have high inflationary expectations. If theeconomy goes into a recession, the actual rate of inflation will fall below the expected rate of inflation.However, the actual inflation rate may still be very high while the rate of unemployment is increasing.For example, the Fed may have let money supply grow much too fast in the past, so everyone expectsa high inflation rate. If a supply shock occurs, we will see an increase in the rate of unemploymentwhile inflationary expectations and actual inflation remain very high. This scenario occurred during the 1970s. Once we have reached such a situation, it becomes necessary to design policies that will reduce inflationary expectations to shift the Phillips curve back to the left.5. Assume a disturbance occurs and the AD-curve shifts to the right. Unemployment decreases andinflation increases, and we move along the downward sloping Phillips curve to the left. However, as soon as people realize that actual inflation is higher than their inflationary expectations, they adjust their inflationary expectations upward and the downward-sloping Phillips curve shifts to the right, eventually returning unemployment back to its natural rate. In other words, the economy adjusts back at the full-employment level of income.If an adverse supply shock occurs (the upward-sloping AS-curve shifts to the left), unemployment and inflation increase simultaneously. This will correspond to a shift of the downward-sloping Phillips curve to the right. However, when people realize that actual inflation is less than expected inflation, then the downward-sloping Phillips curve starts to shift back and the economy adjusts back to the natural rate of unemployment in the long run.6.The expectations-augmented Phillips curve predicts that inflation will rise above the expected levelwhen unemployment drops below its natural rate. However, if people know that this is going to happen, why don’t they immediately adjust to it? And if people immediately adjusted to it, wouldn’t this imply that anticipated monetary policy would be ineffective to cause any deviation from the full-employment level of output? In reality, however, even if people have rational expectations, they may not be able to adjust immediately. One reason is that wage contracts often set wages for an extended time period. Similarly, prices cannot always be changed right away and the costs of changing prices may outweigh the benefits. A further argument is that even rational people make forecasting mistakes and learn only slowly.In other words, the location of the expectations-augmented Phillips curve is determined by the level of expected inflation, which is set by recent historical experience. A shift in this curve caused by changing inflationary expectations occurs only gradually. The rational expectations model, on the other hand, assumes that the Phillips curve shifts almost instantaneously as new information about the near future becomes available.Technical Problems:1. A reduction in the supply of money leads to excess demand for money and increased interest rates,reducing the level of private spending (especially investment). Therefore the AD-curve shifts to the left. This causes an excess supply of goods and services at the original price level so the price level starts to decrease. Since the AS-curve is upward sloping, a new short-run macro-equilibrium is reached at a lower level of output (and thus a higher level of unemployment) and a lower price level.PP1However, the higher level of unemployment eventually puts downward pressure on wages, reducing the cost of production and shifting the upward-sloping AS-curve to the right. Alternatively, since this equilibrium output level is below the full-employment level, prices will continue to fall, and the upward-sloping AS-curve will shift to the right. As long as output is below the full-employment level Y*, the upward-sloping AS-curve will continue to shift to the right, which means that the price level will continue to decline. Eventually a new long-run equilibrium will be reached at the full-employment level of output (Y*) and a lower price level.2. According to the rational expectations theory, an announced change in monetary policy wouldimmediately change people’s perception in regard to the expected inflation rate. If people could adjust immediately to this change in inflationary expectations, then the rate of unemployment or the output level would remain the same. In other words, we would immediately move from point 1 to point 3 in the diagram used to explain the previous question and the Fed would be unable to affect the unemployment rate. In reality, however, even if people have rational expectations and can anticipate the effects of a policy change correctly, they may not be able to immediately adjust due to wage contracts, etc. Thus, there will always be some deviation from the full-employment output level Y*.3.a. A favorable supply shock, such as a decline in material prices, shifts the upward-sloping AS-curve tothe right, leading to excess supply at the existing price level. A new short-run equilibrium is reached at a higher level of output and a lower price level. But since output is now above the full-employment level Y*, there is upward pressure on wages and prices and the upward-sloping AS-curve shifts back to the right. A new long-run equilibrium is reached back at the original position (Y*), and the original price level (assuming that the change in material prices did not affect the full-employment level of output). Since nominal wages (W) will have risen but the price level (P) will not have changed, real wages (W/P) will have increased.PP1P20 13.b. Lower material prices lower the cost of production, shifting the upward-sloping AS-curve shiftsto the right, and leading to an increase in output and a lower price level. Since unemployment is now below its natural rate, there is a shortage of labor, providing upward pressure on wages. This will increase the cost of production again, eventually shifting the upward-sloping AS-curve back to the original long-run equilibrium (assuming that potential GDP has not been affected).Additional Problems:1. Explain the long-run effect of an increase in nominal money supply on the amount of realmoney balances available in the economy.In the very short run, the price level is fixed, so if nominal money supply (M) increases, a higher level of real money balances is available, causing interest rates to fall and the level of investment spending to increase. This leads to an increase in aggregate demand. The shift to the right of the AD-curve causes the price level (P) to increase, leading to a reduction in real money balances (M/P). In the medium run (an upward-sloping AS-curve), we reach a new equilibrium at a higher output level and a higher price level. Since prices have gone up proportionally less than nominal money supply, real money balances have increased. However, to reach a new long-run equilibrium, prices have to increase further, and as a result, the level of real money balances will decrease further. When the new long-run equilibrium at Y* is finally reached, the price level will have risen proportionally to nominal money supply and the level of real money balances will be back at its original level.2. Assume the economy is in a recession. Describe an adjustment process that will ensure that theeconomy eventually will return to full employment. How can the government speed up this process?If the economy is in a recession, there will be downward pressure on wages and prices, which will bring the economy back to the full-employment output level. The upward-sloping AS-curve will shift to the right due to lower production costs. However, this process may take a fairly long time. The government can shorten this adjustment process with the help of expansionary fiscal or monetary policies to stimulate aggregate demand. The resulting shift to the right of the AD-curve implies that the final long-run equilibrium will be at a higher price level. In other words, the reduction in unemployment can only be achieved at the cost of higher inflation.3. "The stickiness of wages implies that policy makers can achieve low unemployment only if theyare willing to put up with high inflation." Comment on this statement.There are several explanations of why wages and prices adjust only slowly. One is that workers have imperfect information, so they do not realize that lower prices mean higher real wages. Another is that firms are reluctant to change prices and wages since they are unsure about the behavior of their competitors and want to avoid the perceived cost of making these changes. Finally, wage contracts tend to be long-term and staggered, so it takes time to adjust wages to price changes. Some firms may pay their workers above market-clearing wages to keep them happy and productive. For these reasons, wages and prices tend to be rigid in the short run. Thus it takes time for the economy to adjust back to full-employment.If there were a stable Phillips-curve relationship, a low rate of unemployment could only be achieved by allowing inflation to increase. However, such a stable relationship does not exist. Wages tend to be rigid in the short run, so expansionary policies lower unemployment and increase inflation in the short run. In the long run, however, the economy will adjust back to the natural rate of unemployment, so expansionary policies simply lead to a higher price level.4. "If we assume that people have rational expectations, then fiscal policy is always irrelevant.But monetary policy can still be used to affect the rate of inflation and unemployment."Comment on this statement.Individuals and firms with rational expectations consistently make optimal decisions based on all information available. As long as a policy change is anticipated, people are able to assess its long-run outcome and will try to immediately adjust. Since fiscal policy doesn't affect inflation or unemployment in the long run, it is also ineffective in the short run if wages and prices are assumed to be flexible. An anticipated change in monetary growth, on the other hand, will be reflected in a change in the inflation rate. If wages are flexible, workers will adjust their wage demands immediately and no significant change in the unemployment rate will occur. However, even if people have rational expectations, wages tend to be fairly rigid in the short run due to wage contracts. Therefore, it will take time for the economy to adjust back to a long-run equilibrium. This implies that both fiscal and monetary policy can affect the rate of inflation and unemployment to some degree in the short run.5. "Inflation cannot accelerate in a recession, when the rate of unemployment is above its naturalrate." Comment on this statement.Inflation can accelerate even in a recession, that is, when the unemployment is high, if a supply shock occurs. An oil price increase will increase the cost of production, so the upward-sloping AS-curve will shift to the left. This will increase the inflation rate and the rate of unemployment simultaneously, as firms increase their product prices and cut their production. If the Fed tries to accommodate the supply shock with expansionary monetary policy in an effort to stimulate the economy, then inflation will accelerate even more, as the AD-curve shifts to the right.6. Comment on the following statement:"The coordination approach to the Phillips curve focuses on the problems that the administration has in coordinating its fiscal policies with the monetary policies of the Fed." The coordination approach has nothing to do with fiscal or monetary policy but is simply one explanation of why wages adjust slowly. This view asserts that firms generally are unable to coordinate wage and price changes in response to a monetary policy change. For example, any firm that cuts workers' wages in response to monetary contraction while other firms don't, will anger its employees who may then choose to leave. Firms are also reluctant to change their prices since they are unsure about their competitors' behavior. Thus wages and prices change only slowly in response to a change in aggregate demand. This implies an upward-sloping (short-run) AS-curve.7. Comment on the following statement:"The unemployment rate is zero at the full-employment level of output."With a higher price level real wages decline, increasing the quantity of labor demanded. Therefore the nominal wage rate is bid up until the real wage rate is restored to its unique equilibrium level. Similarly, if prices fall, real wages increase, leading to unemployment. The nominal wage rate falls to bring the real wage rate back to its equilibrium level. So the nominal wage rate changes in proportion to the price level to maintain a real wage rate that clears the labor market. At this wage rate, the full-employment level of output is produced. However, at the full-employment output level the unemployment rate is not zero. Due to frictions in the labor market, there is always a positive unemployment rate, as workers switch between jobs. This is called the natural rate of unemployment.8. Briefly state the reason for the slow adjustment of wages to changes in aggregate demand. The reasons for the slow adjustment of nominal wages can be explained in several ways. One explanation is that workers have imperfect information, that is, they do not immediately realize whether a change in their nominal wage is the result of an increase in prices or in the real wage they receive for the work they provide. Another explanation is that coordination problems exist, that is, different firms within an economy are unsure about the behavior of their competitors and thus they only reluctantly change wages or prices. The efficiency wage theory, on the other hand, argues that firms pay above market-clearing wages to motivate their workers to work harder. Firms are also reluctant to change wages due to the perceived cost of doing so. Another argument is that wage contracts tend to be long-term, so real wages tend to fluctuate over the length of the contract and output adjusts only slowly to price changes. Finally, the insider-outsider model argues that firms negotiate only with their employees but not the unemployed. Since a turnover of the labor force is costly to firms, they are willing to offer above market-clearing wages to the currently employed rather than hiring the unemployed who may be willing to work for less. These various explanations are not mutually exclusive, and they all imply that the AS-curve is positively sloped, that is, that a change in aggregate demand will affect both output and prices in the short run.9. True or false? Why?"There is no frictional unemployment at the natural rate of unemployment."False. The natural rate of unemployment is the rate at which the labor market is in equilibrium. But there is always some unemployment due to new entrants into the labor force, people between jobs, and the like.This rate of unemployment is considered normal, due to frictions in the labor market, and is often called frictional unemployment.10. "If everyone in this economy had rational expectations, then wages would be flexible andunemployment could not occur." Comment on this statement.The new Keynesian models argue that even if people have rational expectations, socially undesirable outcomes may still occur due to imperfect competition and the existence of wage contracts. Prices may not change freely, since firms in imperfectly competitive markets are reluctant to change them, due to the menu costs involved. Nominal wages are set by contracts over a period of time, so the economy may adjust only slowly to a decrease in aggregate demand. Thus a rate of unemployment higher than the natural rate can exist over an extended period of time.11. True or false? Why?"If nominal wages were more flexible, expansionary policies would be more effective in reducing the rate of unemployment."False. In Chapter 5 we learned that in the classical case (where nominal wages are completely flexible) the AS-curve is vertical, whereas in the Keynesian case (where wages do not change, even if unemployment persists) the AS-curve is horizontal. From this we can conclude that more flexible nominal wages imply a steeper upward-sloping AS-curve. Any type of expansionary demand-side policy will shift the AD-curve to the right and this will cause the level of output and prices to increase (at least in the short-run). A steeper upward-sloping AS-curve results in a larger price increase and a smaller increase in output. But a smaller increase in the level of output results in a smaller reduction in unemployment. In either case, the economy will settle back at the full-employment level of output in the long run. In the long run, the rate of unemployment always goes back to its natural level.12. Explain the short-run and long-run effects of an increase in the level of government spendingon output, unemployment, interest rates, prices, and real money balances.An increase in government spending increases aggregate demand, shifting the AD-curve to the right. Because there is excess demand, the price level increases, which reduces the level of real money balances. Therefore interest rates increase, leading to some crowding out of investment. Due to this real balance effect, the increase in output is less than the shift in the AD-curve. Assuming an upward-sloping AS-curve, a new equilibrium is reached at a higher price level, a higher level of output, a lower unemployment rate and a higher interest rate. Since output is now above the full-employment level, wages and prices will continue to rise and the upward-sloping AS-curve will start shifting to the left. This process will continue until a new long-run equilibrium is reached at the full-employment level of income Y*, that is, until unemployment is back at its natural rate. At this point the price level, nominal wages, and interest rates will be higher than previously and real money balances will be lower.13. Briefly explain why there seems to be so much interest in finding ways to shift theupward-sloping aggregate supply curve to the right.Shifting the upward-sloping AS-curve to the right seems to be the only way to offset the effects of an adverse supply shock without any negative side effects. An adverse supply shock, such as an increase in oil prices, causes a simultaneous increase in unemployment and inflation, and policy makers have only two options for demand-management policies. Expansionary fiscal or monetary policy will help to achieve full employment faster but will raise the price level, while restrictive fiscal or monetary policy will reduce inflationary pressure but increase unemployment. Therefore, any policy that would shift the upward sloping AS-curve back to the right seems preferable, since it might bring the economy back to the original equilibrium by simultaneously lowering inflation and unemployment.14. Use an AD-AS framework to show the effect of monetary restriction on the level of output,prices and the interest rate in the medium and the long run.A decrease in nominal money supply will increase interest rates, leading to a decrease in investment spending. This will shift the AD-curve to the left, creating an excess supply of goods and services. Therefore price level will decrease and real money balances will increase. A new equilibrium will be achieved at the intersection of the new AD-curve and the upward-sloping AS-curve at an output level that is below the full-employment level.In the long run, higher unemployment will cause downward pressure on wages. As the cost of production decreases, the upward-sloping AS-curve will keep shifting to the right until a new long-run equilibrium is established at the full-employment level of output, that is, where the new AD-curve intersects the long-run vertical AS-curve at Y*. At this point, real output, the real interest rate, real money balances, and the real wage rate will be back at their original level. Nominal money supply, the price level and the nominal wage rate will all have decreased proportionally.A simplified adjustment can be shown as follows:1-->2: Ms down ==> i up ==> I down ==> Y down ==> the AD-curve shifts left ==>excess supply ==> P down ==> real ms up ==> i down ==> I up ==> Y up(The first line describes a policy change, that is, a shift in the AD-curve; the second line describes the price adjustment, that is, a movement along the AD-curve.)Short-run effect:Y down, i up, P down2-->3: Since Y < Y* ==> downwards pressure on nominal wages ==> cost of production down ==> the short run AS-curve shifts right ==> excess supply of goods ==> P down ==> real ms up==> i down ==> I up ==> Y up (This process continues until Y = Y*)Long-run effect:Y stays at Y*, i remains the same, P down.Note: Even though only one shift of the short-run AS-curve to the new long-run equilibrium is shown here, this shift is actually a combination of many shifts.P2P1P2P30 215. Briefly discuss the importance of Okun’s law in evaluating the cost of unemployment.Okun’s law states that a reduction in the unemployment rate of 1 percent will increase the level of output by about 2 percent. This relationship allows us to measure the cost to society (in terms of lost production) of a given rate of unemployment.16. True or false? Why?"If monetary policy accommodates an adverse supply shock, it will worsen any inflationary effects."True. An adverse supply shock shifts the upward-sloping AS-curve to the left. There is excess demand for goods and services at the original price level and prices start to rise, leading to lower real money balances, higher interest rates, and lower output. If no policy is implemented, then unemployment will force the nominal wage down to restore equilibrium at the original position. If the government views this adjustment process as too slow, it can respond by implementing expansionary policies. Accommodating the supply shock in this way shifts the AD-curve to the right and a new equilibrium can be reached at full-employment but at a higher price level. It is unlikely, though, that the economy will remain there for long since workers will realize that their purchasing power has been diminished by higher prices and will demand a wage increase. If they are successful, the cost of production will increase and the upward-sloping AS-curve will shift to the left again. In other words, we will enter a wage-price spiral.PP3P2P1217. Assume oil prices decline. What kind of monetary policy should the Fed undertake if its goal isto stabilize the level of output while keeping inflation low? Show with the help of an AD-AS diagram and briefly explain the adjustment process.1-->2: As oil prices decline, the cost of production decreases and the upward-sloping AS-curve shifts to the right, causing excess supply of goods. Thus the price level decreases, real money balances increase, and the interest rate declines.2-->3: A decrease in money supply will increase the interest rate, decrease private spending, and shift the AD-curve to the left. This means that prices will decrease even further and the level of output will decline. (We assume, for simplicity, that it goes back to the full-employment level Y*, so no long-run adjustment is needed.) Overall, the level of output has remained at its full-employment level but the level of prices and the interest rate have decreased.PP1P2218. Comment on the following statement:"A favorable oil shock causes lower inflation and lower unemployment."A decrease in material prices (or any other favorable supply shock) shifts theupward-sloping AS-curve to the right, and prices begin to decrease. The new equilibrium is at a lower price level and a higher level of output (a lower level of unemployment).Since output is now above the full-employment level, there will be upward pressure on nominal wages and prices, and the upward-sloping AS-curve will start shifting back to its original position (assuming that potential output was not affected). In the long run, unemployment will be back at its natural rate but the price level will have decreased (and thus real wages increased).19. “Falling oil prices will lead to increased employment, higher wage rates an dincreased real money balances.” Comment on this statement with the help of an AD-AS diagram and explain the short-run and long-run adjustment processes.A decline in material prices shifts the upward-sloping AS-curve to the right, leading to excess supply at the existing price level. A new equilibrium is reached at a higher level of output and a lower price level. But since output is now above the full-employment level Y*, there is upward pressure on wages and prices and the upward-sloping AS-curve starts shifting back to the right. A new long-run equilibrium is reached back at the original position (Y*), and the original price level (assuming that the change in material prices did not affect the full-employment level of output). Since nominal wages (W) will have risen but the price level (P) will not have changed, real wages (W/P) will have increased.PP1P2Y*Y2Y。
CHAPTER 10MONEY, INTEREST, AND INCOMEAnswers to Problems in the Textbook:Conceptual Problems:1. The model in Chapter 9 assumed that both the price level and the interest rate were fixed. But the IS-LM model lets the interest rate fluctuate and determines the combination of output demanded and the interest rate for a fixed price level. It should be noted that while the upward-sloping AD-curve in Chapter 9 (the [C+I+G+NX]-line in the Keynesian cross diagram) assumed that interest rates and prices were fixed, the downward-sloping AD-curve that is derived at the end of Chapter 10 from the IS-LM model lets the price level fluctuate and describes all combinations of the price level and the level of output demanded at which the goods and money sector simultaneously are in equilibrium. 2.a. If the expenditure multiplier (α) becomes larger, the increase in equilibrium income caused by a unitchange in intended spending also becomes larger. Assume investment spending increases due to a change in the interest rate. If the multiplier α becomes larger, any increase in spending will cause a larger increase in equilibrium income. This means that the IS-curve will become flatter as the size of the expenditure multiplier becomes larger.If aggregate demand becomes more sensitive to interest rates, any change in the interest rate causes the [C+I+G+NX]-line to shift up by a larger amount and, given a certain size of the expenditure multiplier α, this will increase equilibrium income by a larger amount. As a result, the IS-curve will become flatter.2.b. Monetary policy changes affect interest rates and this leads to a change in intended spending, whichis reflected in a change in income. In 2.a. it was explained that a steep IS-curve means either that the multiplier α is small or that desired spending is not very interest sensitive. Therefore, an increase in money supply will reduce interest rates. However, this does not result in a large increase in aggregate demand if spending is very interest insensitive. Similarly, if the multiplier is small, then any change in spending will not affect output significantly. Therefore, the steeper the IS-curve, the weaker the effect of monetary policy changes on equilibrium output.3. Assume that money supply is fixed. Any increase in income will increase money demand and theresulting excess demand for money will drive the interest rate up. This, in turn, will reduce the quantity of money balances demanded to bring the money sector back to equilibrium. But if money demand is very interest insensitive, then a larger increase in the interest rate is needed to reach a new equilibrium in the money sector. As a result, the LM-curve becomes steeper.Along the LM-curve, an increase in the interest rate is always associated with an increase in income. This means that an increase in money demand (due to an increase in income) has to be offset by a decrease in the quantity of money demanded (due to an increase in the interest rate) to keep the money sector in equilibrium. But if money demand becomes more income sensitive, a smaller change in income is required for any specific change in the interest rate to keep the money sector in equilibrium. Therefore, the LM-curve becomes steeper as money demand becomes more income sensitive.4.a. A horizontal LM-curve implies that the public is willing to hold whatever money is supplied at anygiven interest rate. Therefore, changes in income will not affect the equilibrium interest rate in the money sector. But if the interest rate is fixed, we are back to the analysis of the simple Keynesian model used in Chapter 9. In other words, there is no offsetting effect (or crowding-out effect) to fiscal policy.14.b. A horizontal LM-curve implies that changes in income do not affect interest rates in the money sector.Therefore, if expansionary fiscal policy is implemented, the IS-curve shifts to the right, but the level of investment spending is no longer negatively affected by rising interest rates, that is, there is no crowding-out effect. In terms of Figure 10-3, the interest rate not longer serves as the link between the goods and assets markets.4.c. A horizontal LM-curve results if the public is willing to hold whatever money balances are suppliedat a given interest rate. This situation is called the liquidity trap. Similarly, if the Fed is prepared to peg the interest rate at a certain level, then any change in income will be accompanied by an appropriate change in money supply. This will lead to continuous shifts in the LM-curve, which is equivalent to having a horizontal LM-curve, since the interest rate will never change.5. From the material presented in the text we know that when intended spending becomes more interestsensitive, then the IS-curve becomes flatter. Now assume that an increase in the interest rate stimulates saving and therefore reduces the level of consumption. This means that now not only investment spending but also consumption is negatively affected by an increase in the interest rate. In other words, the [C+I+G+NX]-line in the Keynesian cross diagram will now shift down further than previously and the level of equilibrium income will decrease more than before. In other words, the IS-curve has become flatter.This can also be shown algebraically, since we can now write the consumption function as follows:C = C* + cYD - giIn a simple model of the expenditure sector without income taxes, the equation for aggregate demand will now beAD = A o + cY - (b + g)i.From Y = AD ==> Y = [1/(1 - c)][A o - (b + g)i] ==>i = [1/(b + g)]A o - [(1 - c)/(b + g)]YTherefore, the slope of the IS-curve has been reduced from (1 - c)/b to (1 - c)/(b + g).6. In the IS-LM model, a simultaneous decline in interest rates and income can only be caused by a shiftof the IS-curve to the left. This shift in the IS-curve could have been caused by a decrease in private spending due to negative business expectations or a decline in consumer confidence. In 1991, the economy was in a recession and firms did not want to invest in new machinery and, since consumer confidence was very low, people were not expected to increase their level of spending. In the IS-LM diagram the adjustment process can be described as follows:I o↓ ==> Y ↓ (the IS-curve shifts left) ==> m d↓ ==> i ↓ ==> I ↑ ==> Y ↑. Effect: Y ↓ and i ↓ .2ii1i221Technical Problems:1.a. Each point on the IS-curve represents an equilibrium in the expenditure sector. Therefore the IS-curvecan be derived by settingY = C + I + G = (0.8)[1 - (0.25)]Y + 900 - 50i + 800 = 1,700 + (0.6)Y - 50i ==>(0.4)Y = 1,700 - 50i ==> Y = (2.5)(1,700 - 50i) ==> Y = 4,250 - 125i.1.b. The IS-curve shows all combinations of the interest rate and the level of output such that theexpenditure sector (the goods market) is in equilibrium, that is, intended spending is equal to actual output. A decrease in the interest rate stimulates investment spending, making intended spending greater than actual output. The resulting unintended inventory decrease leads firms to increase their production to the point where actual output is again equal to intended spending. This means that the IS-curve is downward sloping.1.c. Each point on the LM-curve represents an equilibrium in the money sector. Therefore the LM-curvecan be derived by setting real money supply equal to real money demand, that is,M/P = L ==> 500 = (0.25)Y - 62.5i ==> Y = 4(500 + 62.5i) ==> Y = 2,000 + 250i.1.d. The LM-curve shows all combinations of the interest rate and level of output such that the moneysector is in equilibrium, that is, the demand for real money balances is equal to the supply of real money balances. An increase in income will increase the demand for real money balances. Given a fixed real money supply, this will lead to an increase in interest rates, which will then reduce the quantity of real money balances demanded until the money market clears. In other words, the LM-curve is upward sloping.1.e. The level of income (Y) and the interest rate (i) at the equilibrium are determined by the intersectionof the IS-curve with the LM-curve. At this point, the expenditure sector and the money sector are both in equilibrium simultaneously.From IS = LM ==> 4,250 - 125i = 2,000 + 250i ==> 2,250 = 375I ==> i = 6==> Y = 4,250 - 125*6 = 4,250 - 750 ==> Y = 3,500Check: Y = 2,000 + 250*6 = 2,000 + 1,500 = 3,5003i125 ISLM62,000 3,500 4,250 Y2.a. As we have seen in 1.a., the value of the expenditure multiplier is α= 2.5. This multiplier αisderived in the same way as in Chapter 9. But now intended spending also depends on the interest rate, so we no longer have Y = αA o, but ratherY = α(A o - bi) = (1/[1 - c + ct])(A o - bi) ==> Y = (2.5)(1,700 - 50i) = 4,250 - 125i.2.b.This can be answered most easily with a numerical example. Assume that government purchasesincrease by ∆G = 300. The IS-curve shifts parallel to the right by==> ∆IS = (2.5)(300) = 750.Therefore IS': Y = 5,000 - 125iFrom IS' = LM ==> 5,000 - 125i = 2,000 + 250i ==> 375i = 3,000 ==> i = 8==> Y = 2,000 + 250*8 ==> Y = 4,000 ==> ∆Y = 500When interest rates are assumed to be constant, the size of the multiplier is equal to α = 2.5, that is, (∆Y)/(∆G) = 750/300 = 2.5. But when interest rates are allowed to vary, the size of the multiplier is reduced to α1 = (∆Y)/(∆G) = 500/300 = 1.67.2.c. Since an increase in government purchases by ∆G = 300 causes a change in the interest rate of 2percentage points, government spending has to change by ∆G = 150 to increase the interest rate by 1 percentage point.2.d. The simple multiplier α in 2.a. shows the magnitude of the horizontal shift in the IS-curve, given achange in autonomous spending by one unit. But an increase in income increases money demand and the interest rate. The increase in the interest rate crowds out some investment spending and this has a dampening effect on income. The multiplier effect in 2.b. is therefore smaller than the multiplier effect in 2.a.3.a. An increase in the income tax rate (t) will reduce the size of the expenditure multiplier (α). But as themultiplier becomes smaller, the IS-curve becomes steeper. As we can see from the equation for the IS-curve, this is not a parallel shift but rather a rotation around the vertical intercept.Y = α(A o - bi) = [1/(1 - c + ct)](A o - bi) ==> i = (1/b)A o - (α/b)Y = (1/b)A o - (1/b)[1 - c + ct]Y 3.b. If the IS-curve shifts to the left and becomes steeper, the equilibrium income level will decrease. Ahigher tax rate reduces private spending and this will lower national income.3.c. When the income tax rate is increased, the equilibrium interest rate will also decrease. The adjustmentto the new equilibrium can be expressed as follows (see graph on the next page):t up ==> C down ==> Y down ==> m d down ==> i down ==> I up ==> Y up. Effect: Y ↓ and i ↓45i 1i 2214.a. If money demand is less interest sensitive, then the LM-curve is steeper and monetary policy changesaffect equilibrium income to a larger degree. If money supply is assumed to be fixed, the adjustment to a new equilibrium in the money sector has to come solely through changes in money demand. If money demand is less interest sensitive, any increase in money supply requires a larger increase in income and a larger decrease in the interest rate in order to bring the money sector into a new equilibrium.i ii 1 i 1 2 2i 20 120 12The adjustment process in each of the two diagrams is the same; however, in the case of a more interest-sensitive money demand (a flatter LM-curve), the change in Y and i will be smaller.(M/P) up ==> i down ==> I up ==> Y up ==> m d up ==> i up Effect: Y ↑ and i ↓Section 10-5 derives the equation for the LM-curve and the equation for the monetary policy multiplier asi = (1/h)[kY - (M/P)] and (∆Y)/∆(M/P) = (b/h)γrespectively. If money demand becomes more interest sensitive, the value of h becomes larger and the slope of the LM-curve becomes flatter, while the size of the monetary policy multiplier becomes smaller.4.b. An increase in money supply drives interest rates down. This decrease in interest rates will stimulateintended spending and thus income. If money demand becomes less interest sensitive, a larger increase in income is required to bring the money sector into equilibrium. But this implies that the overall decrease in the interest rate has to be larger, given that the interest sensitivity of spending has not changed.5. The price adjustment, that is, the movement along the AD-curve, can be explained in the followingway: With nominal money supply (M) fixed, real money balances (M/P) will decrease as the price level (P) increases. There is an excess demand for money and interest rates will rise. This will lead toa decrease in investment spending and thus the level of output demanded will decrease. In otherwords, the LM-curve will shift to the left as real money balances decrease.6. In the classical case, the AS-curve is vertical. Therefore, any increase in aggregate demand due toexpansionary monetary policy will, in the long run, not lead to any increase in output but simply lead to an increase in the price level. An increase in money supply will first shift the LM-curve to the right.This implies a shift of the AD-curve to the right. Therefore we have excess demand for goods and services and prices will begin to rise. But as the price level rises, real money balances will begin to fall again, eventually returning to their original level. Therefore, the shift of the LM-curve to the right due to the expansionary monetary policy and the resulting shift of the AD-curve will be exactly offset by a shift of the LM-curve to the left and a movement along the AD-curve to the new long-run equilibrium due to the price adjustment. At this new long-run equilibrium, the level of output and interest rates will not have changed while the price level will have changed proportionally to the nominal money supply, leaving real money balances unchanged. In other words, money is neutral in the long run (the classical case).7.a. An increase in the demand for money will shift the LM-curve to the left, raising the interest rate andlowering the level of output demanded. As a result, the AD-curve will also shift to the left. In the Keynesian case, the price level is assumed to be fixed, that is, the AS-curve is horizontal. In this case, the decrease in income in the AD-AS diagram is equivalent to the decrease in income in the IS-LM diagram, since there is no price adjustment, that is, the real balance effect does not come into play. 7.b. An increase in the demand for money will shift the LM-curve to the left, raising the interest rate andlowering the level of output demanded. As a result, the AD-curve will also shift to the left. In the classical case, the level of output will not change, since the AS-curve is vertical. In this case, the shift in the AD-curve will simply be reflected in a price decrease, but the level of output will remain unchanged. The real balance effect causes the LM-curve to shift back to its original level, since the price decrease causes an increase in real money balances.Additional Problems:1. True or false? Explain your answer.“A decrease in the marginal propensity to save implies tha t the IS-curve will become steeper.”False A decrease in the marginal propensity to save (s = 1 - c) is equivalent to an increase in the marginal propensity to consume (c), which, in turn, implies an increase in the expenditure multiplier ( ). But with a larger expenditure multiplier, any increase in investment spending due to a decrease in the interest rate will lead to a larger increase in income. Therefore the IS-curve will become flatter and not steeper.2. True or false? Explain your answer.“If the c entral bank keeps the supply of money constant, then the money supply curve is vertical, which implies a vertical LM-curve.”6False. Equilibrium in the money sector implies that real money supply is equal to real money demand, that is,m s = M/P = m d(i,Y).This implies that any increase in income (Y) will increase the demand for money. To bring the money sector back into equilibrium, interest rates (i) have to rise simultaneously to bring the quantity of money demanded back to the original level (equal to the fixed supply of money). Therefore, to keep the money sector in equilibrium, an increase in income must always be associated with an increase in the interest rate and the LM-curve must be upward sloping.3. "Restrictive monetary policy reduces consumption and investment." Comment on thisstatement.A reduction in money supply raises interest rates, which will, in turn, have a negative effect on the level of investment spending. The level of consumption may also decrease as it becomes more costly to finance expenditures by borrowing money. But even if it is assumed that consumption is not affected by changes in the interest rate, consumption will still decrease since restrictive monetary policy will reduce national income and therefore private spending.4. "If government spending is increased, money demand will increase." Comment.A change in government spending directly affects the expenditure sector and therefore the IS-curve. But in an IS-LM framework, the money sector is also affected indirectly. An increase in the level of government spending will shift the IS-curve to the right, leading to an increase in income. But the increase in income will lead to an increase in money demand, so the interest rate will have to increase in order to lower the quantity of money demanded and to bring the money sector back into equilibrium. Overall no change in money demand can occur, since equilibrium in the money sector requires that m s = M/P = m d, that is, money supply has to be equal to money demand, and money supply is assumed to be fixed.5. "An increase in autonomous investment reduces the interest rate and therefore the moneysector will no longer be in equilibrium." Comment on this statement.An increase in autonomous investment shifts the IS-curve to the right. The increase in income leads to an increase in the demand for money, which means that interest rates increase. The increase in interest rates then reduces the quantity of money demanded again to bring the money market back to equilibrium.6. "A monetary expansion leaves the budget surplus unaffected." Comment on this statement. Expansionary monetary policy, that is, an increase in money supply, will lower interest rates (the LM-curve will shift to the right). Lower interest rates will lead to an increase in investment spending and the economy will therefore be stimulated. But a higher level of national income increases the government’s tax revenues and therefore the budget surplus will increase.7. "Restrictive monetary policy implies lower tax revenues and therefore to an increase in thebudget deficit." Comment on this statement.A decrease in money supply will shift the LM-curve to the left. This will lead to an increase in the interest rate, which will lead to a reduction in spending and thus national income. But as income decreases, so does income tax revenue. Therefore, the budget deficit will increase because of the change in its cyclical component.78. “If the demand for money becomes more sensitive to changes in income, then the LM-curvebecome s flatter.” Comment on this statement.Along the LM-curve, an increase in the interest rate is always associated with an increase in income. This means that an increase in money demand (due to an increase in income) has to be offset by a decrease in the quantity of money demanded (due to an increase in the interest rate) to keep the money sector in equilibrium. But if money demand becomes more income sensitive, a smaller change in income is required for any specific change in the interest rate to keep the money sector in equilibrium. Therefore, the LM-curve becomes steeper (and not flatter) as money demand becomes more sensitive to changes in income.9. “A decrease in the income tax rate will increase the demand for money, shifting the LM-curveto the righ t.” Comment on this statement.A decrease in the income tax rate (t) will increase the expenditure multiplier (α). But with a larger expenditure multiplier, any increase in investment spending due to a decrease in the interest rate will lead to a larger increase in income. Since fiscal policy affects the expenditure sector, the IS-curve (not the LM-curve) will shift. The IS-curve will become flatter and shift to the right. This will lead to a new equilibrium at a higher level of income (Y) and a higher interest rate (i). But money supply is fixed and the LM-curve remains unaffected by fiscal policy. Therefore, at the new equilibrium (the intersection of the new IS-curve with the old LM-curve) the demand for money will not have changed, since the money sector has to be in an equilibrium at m s = m d(i,Y).10. “If the demand for money becomes more insensitive to changes in the interest rate, equilibriumin the money sector will have to be restored mostly through changes in income. This implies a flat LM-curve.” Comment on this statement.Any increase in income will increase money demand and this will drive the interest rate up. Therefore, the quantity of money balances demanded will decline again until the money sector is back in equilibrium. But if money demand is very interest insensitive, then a larger increase in the interest rate is needed to reach a new equilibrium in the money sector. This means that the LM-curve is steep and not flat.11. Assume the following IS-LM model:Expenditure Sector Money SectorSp = C + I + G + NX M = 700C = 100 + (4/5)YD P = 2YD = Y - TA m d = (1/3)Y + 200 - 10iTA = (1/4)YI = 300 - 20iG = 120NX = -20(a) Derive the equilibrium values of consumption (C) and money demand (m d).(b) How much of investment (I) will be crowded out if the government increases its purchasesby ∆G = 160 and nominal money supply (M) remains unchanged?(c) By how much will the equilibrium level of income (Y) and the interest rate (i) change, ifnominal money supply is also increased to M' = 1,100?a. Sp = 100 + (4/5)[Y - (1/4)Y] + 300 - 20i + 120 - 20 = 500 + (4/5)(3/4)Y – 20i = 500 + (3/5)Y - 20iFrom Y = Sp ==> Y = 500 + (3/5)Y - 20i ==> (2/5)Y = 500 - 20i==> Y = (2.5)(500 - 20i) ==> Y = 1,250 - 50i IS-curveFrom M/P = m d ==> 700/2 = (1/3)Y + 200 - 10i ==> (1/3)Y = 150 + 10i==> Y = 3(150 + 10i) ==> Y = 450 + 30i LM-curve89IS = LM ==> 1,250 - 50i = 450 + 30i ==> 800 = 80i ==> i = 10==> Y = 1,250 - 50*10 ==> Y = 750C = 100 + (4/5)(3/4)750 = 100 + (3/5)750 ==> C = 550m s = M/P = 700/2 = 350 = m dCheck: m d = (1/3)750 + 200 - 10*10 = 350i25 IS o LM o10450 750 1,250 Yb. ∆IS = (2.5)160 = 400 ==> IS' = 1,650 - 50iIS' = LM ==> 1,650 - 50i = 450 + 30i ==> 1,200 = 80i ==> i = 15==> Y = 1,650 - 50*15 ==> Y = 900Since ∆i = + 5 ==> ∆I = - 20*5 ==> ∆I = - 100Check: ∆ 331510450 750 900 1,250 1,650 Yc. From M'/P = m d ==> 1,100/2 = (1/3)Y + 200 - 20i==> (1/3)Y = 350 - 20i ==> Y = 3(350 - 20i) ==> Y = 1,050 + 30iIS 1 = LM 1 ==> 1,650 - 50i = 1,050 + 30i ==> 600 = 80i ==> i = 7.5==> Y = 1,650 - 50(7.5) = 1,275.==> ∆i = - 7.5 and ∆Y = 375 as compared to (b).i1107.512. Assume the money sector can be described by these equations: M/P = 400 and m d = (1/4)Y - 10i.In the expenditure sector only investment spending (I) is affected by the interest rate (i), and the equation of the IS-curve is: Y = 2,000 - 40i.(a) If the size of the expenditure multiplier is α= 2, show the effect of an increase ingovernment purchases by ∆G = 200 on income and the interest rate.(b) Can you determine how much of investment is crowded out as a result of this increase ingovernment spending?(c)If the money demand equation were changed to m d = (1/4)Y, how would your answers in (a)and (b) change?a. From M/P = m d ==> 400 = (1/4)Y - 10i ==> Y = 1,600 + 40i LM-curveFrom IS = LM ==> 2,000 - 40i = 1,600 + 40i ==> 80i = 400 ==> i = 5==> Y = 2,000 - 40*5 ==> Y = 1,800∆IS = 2*200 = 400 ==> IS' = 2,400 - 40iIS' = LM ==> 2,400 - 40i = 1,600 + 40i ==> 80i = 800 ==> i = 10==> Y = 1,600 + 40*10 ==> Y = 2,000Therefore ∆i = + 5 and ∆Y = + 200b.Since the size of the expenditure multiplier is α = 2 but income only goes up by αY = 200, the fiscalpolicy multiplier in the IS-LM model is α1= 1. But this means that the level of investment has been reduced by 100, that is, ∆I = -100. This can be seen by restating the IS-curve as follows:Y = 2,000 - 40i = Y = 2(1,000 - 20i)Since government purchases are changed by ∆G = 200 ==> Y = 2(1,200 - 20i), which means that the IS-curve shifts by ∆IS = 2*200 = 400. But the increase in income is actually only ∆Y = 200. This implies that investment changes by ∆I = -100. Investment is of the form I = I o– 20i; however, since the interest rate went up by ∆i = 5, investment changes by ∆I = - 20*5 = - 100.From ∆Y = α(∆Sp) ==> 200 = 2(∆Sp) ==> ∆Sp = 100But since ∆Sp =∆ G + ∆I ==> 100 = 200 + ∆I ==> ∆I = - 100c. If m d= (1/4)Y, then we have the classical case, that is, a vertical LM-curve. In this case, fiscalexpansion will not change income at all. This occurs since the increase in G will be offset by a decrease in I of equal magnitude due to an increase in the interest rate.(M/P) = m d ==> 400 = (1/4)Y ==> Y = 1,600 LM-curveIS = LM ==> 2,000 - 40i = 1,600 ==> 40i = 400 ==> i = 10 ==> Y = 1,600IS' = LM ==> 2,400 - 40i = 1,600 ==> 40i = 800==> i = 20 ==> Y = 1,600 ==> ∆I = - 2001013. Assume money demand (md) and money supply (ms) are defined as: md = (1/4)Y + 400 - 15iand ms = 600, and intended spending is of the form: Sp = C + I + G + NX = 400 + (3/4)Y - 10i.Calculate the equilibrium levels of Y and i, and indicate by how much the Fed would have to change money supply to keep interest rates constant if the government increased its spending by ∆G = 50. Show your solutions graphically and mathematically.ms = md ==> 600 = (1/4)Y + 400 - 15i ==> (1/4)Y = 200 + 15i==> Y = 4(200 + 15i) ==> Y = 800 + 60i LM-curveY = C + I + G + NX ==> Y = 400 + (3/4)Y - 10i ==>(1/4)Y = 400 - 10i ==> Y = 4(400 - 10i) ==> Y = 1,600 - 40i IS-curveFrom IS = LM ==> 1,600 - 40i = 800 + 60i ==> 100i = 800 ==> i = 8 ==> Y = 1,280If government spending is increased by ∆G = 50, the IS-curve will shift to the right) by (∆IS) = 4*50 = 200. If the Fed wants to keep the interest rate constant, money supply has to be increased in a way that shifts the LM-curve to the right by exactly the same amount as the IS-curve, that is, (∆LM) = 200.From Y = 2(200 + 15i) ==> (∆Y) = 2(∆ms) ==> 200 = 2(∆ms)==> (∆ms) = 100, so money supply has to be increased by 100.Check: IS' = LM": 1,800 - 40i = 1,000 + 60i ==> 800 = 100i4018800 1000 1280 1480 1600 1800 Y14. Assume the equation for the IS-curve is Y = 1,200 – 40i, and the equation for the LM-curve isY = 400 + 40i.(a) Determine the equilibrium value of Y and i.(b) If this is a simple model without income taxes, by how much will these values change if thegovernment increases its expenditures by ∆G = 400, financed by an equal increase in lump sum taxes (∆TA o = 400)?a. From IS = LM ==> 1,200 - 40i = 400 + 40i ==>800 = 80i ==> i = 10 ==> Y = 400 + 40*10 ==> Y = 800b. According to the balanced budget theorem, the IS-curve will shift horizontally by the increase ingovernment purchases, that is, ∆IS = ∆G = ∆TA o = 400.Thus the new IS-curve is of the form: Y = 1,600 - 40i.From IS' = LM ==> 1,600 - 40i = 400 + 40i ==>1,200 = 80i ==> i = 15 ==> Y = 400 + 40*15 ==> Y = 1,00015. Assume you have the following information about a macro model:Expenditure sector: Money sector:11。

宏观经济学(Macroeconomics),是使用国民收入、国民经济统计等宏观经济学数,对一个国家的经济活动开展研究。
宏观经济学是相对于微观经济学之中的各个学派以国民生产总值以及国民收入主要指标的研究视角,国民经济学、太阳经济学都被认为是宏观经济学研究领域之一。
宏观经济学是现代经济学科学体系中重要的学科,宏观经济学来源于法国魁奈的《农业经济管理论》(1613)和英国坎蒂隆的《商业性质概论》(1758)。
首次使用“宏观经济学”一词的是1893年一位英国经济学家创造出来的。
宏观经济学的英文介绍如下:Macroeconomics is a field of economics that studies the performance of the economy as a whole. It focuses on aggregate variables such as national income, output, employment, and inflation, and explores how these variables interact and respond to policy changes. Macroeconomics also examines the role of government policies in stabilizing the economy and achieving economic growth.The key theories and models in macroeconomics include the Keynesian model, which emphasizes the role of government spending and taxation in stabilizing the economy; the monetarist model, which emphasizes the role of money supply and inflation in macroeconomic performance; and the supply-side model, which emphasizes the role of supply-side factors such as labor supply and capital in economic growth.Macroeconomists also study international macroeconomics, which explores how countries' economies interact with each other through trade, exchange rates, and financial markets. They also study macroeconomic policies such as fiscal policy (taxes and government spending) and monetary policy (changes in interest rates and money supply) and how they can be used to achieve economic stability and growth.希望以上信息对您有所帮助。
宏观经济学英文文章English:Macroeconomics is the branch of economics that focuses on the behavior and performance of an economy as a whole. It examines the economy on a broader scale and looks at factors such as unemployment, inflation, economic growth, and the overall level of national income. Macroeconomists study the interactions between different sectors of the economy, such as households, businesses, and government, and how their decisions impact the overall economy. They also analyze the role of government policy, such as fiscal and monetary policy, in influencing economic outcomes. Understanding macroeconomics is crucial for policymakers, as it provides insights into how to manage and stabilize the economy, particularly during times of economic downturn or crisis.中文翻译:宏观经济学是经济学的一个分支,它关注整个经济体的行为和表现。
它以更广泛的范围研究经济,并关注因素,例如失业率、通货膨胀、经济增长和国民收入的总体水平。
Chapter 13Solutions to the Problems in the Textbook:Conceptual Problems:1.a. According to the life-cycle theory of consumption, people try to maintain a fairly stable consumption pathover their lifetime. Individuals save during their working years so they can keep up the same consumption stream after they retire. This implies that wealth increases steadily until retirement while consumption remains stable. We should therefore expect the ratio of consumption to accumulated saving (wealth) to decrease over time up to retirement.1.b. After retirement, wealth is used up to finance consumption during the remaining years. Therefore the ratioof consumption to accumulated saving (wealth) increases again after retirement, eventually approaching 1.2.a. Suppose that you and your neighbor both work the same number of years until retirement and you bothhave the same annual income. If your neighbor is in bad health and does not expect to live as long as you do, she will expect to have fewer retirement years in which to use accumulated wealth to finance a steady consumption stream. Your neighbor's goal for retirement saving will not be as high as yours, and compared to you, she will have a higher level of consumption over her working years.Since planned annual consumption (C) is determined by the number of working years (WL), the number of years to live (NL), and income from labor (YL), we get the equation:C = [(WL)/(NL)](YL).WL and YL are the same for you and your neighbor, but NL is smaller for your neighbor. Therefore you will have a lower level of consumption (C).(Note: Students may come up with a variety of different answers. For one, your neighbor, who is in bad health, currently has much larger medical bills than you do. Therefore she may not be able to save as much for retirement, even if she might expect to live as long as you. On the other hand, she may not have large medical bills now, but expects them later, as she gets older. This may induce her to save more now.While such arguments are valid, instructors should point out that the answer should be related to the life-cycle theory.)2.b. If we assume for simplicity that the rate of return on Social Security is the same as the rate of return onprivate saving, then the introduction of a Social Security system based on a trust fund should not have any effect on your level of consumption. Social Security may be considered a form of "forced saving," since you are forced to pay Social Security taxes during your working years and will, in return, receive benefits during your retirement years. However, most likely you would have voluntarily saved as much as the government is now “forcing” you to save with levying a Social Security tax. Therefore your consumption behavior will not change. Still, the levying of a Social Security tax reduces disposable income during your working years, increasing the ratio of consumption to disposable income (the average propensity to consume). If private saving were simply replaced with government saving, national saving would not be affected.In reality, however, the Social Security system is not strictly financed through a trust fund, but largely on a pay-as-you-go basis. The size of the Social Security trust fund was fairly insignificant until the system was amended in 1983. Now the trust fund is increasing and, in effect, contributing to the federal budget surplus. But because of our aging population, predictions are that the Social Security system will experience severe financial difficulties within the next 20-30 years. If the credibility of the system becomes an issue, people may intensify their saving efforts, since they no longer feel they can rely on the1public system to provide for them during retirement. In the past, most of the Social Security taxes were not "saved" but immediately used by the government to finance the benefits of the current retirees. This is why most economists claim that the Social Security system has led to a decrease in the national savings rate and a decrease in the rate of capital accumulation. The magnitude of this decrease, however, has not been clearly established.3.a. If you get a yearly Christmas bonus, you immediately treat it as part of your permanent income and spendit accordingly, that is, ∆C = c(∆Y). In other words, your current consumption will change significantly. 3.b. If you get a Christmas bonus for only this year, you will consider it as transitory income. Since yourpermanent income is hardly affected, you will consume only a small fraction of it and save the rest. In other words, your current consumption will not be significantly affected.4. Gamblers (or thieves) seldom have a very stable income. However, their consumption is determined bytheir permanent income, that is, their expected average lifetime income. Whether they have a large or small income during any given period, their consumption pattern remains relatively stable, since their permanent income is not significantly affected by temporary changes in earnings.5. Both theories, in their own way, try to explain why the short-run mpc is smaller than the long-run mpc.The life-cycle theory attributes the difference to the fact that people prefer a smooth consumption stream over their lifetime. Therefore the average expected lifetime income is the true determinant of current consumption. The permanent income theory suggests that the difference is due to measurement errors.Measured income has two components, that is, permanent and transitory income. But only permanent income is a true determinant of current consumption.6.a. One possible explanation could be that the “baby boomers” were still in their dissaving phase. In otherwords, if households of the baby boom generation still had to buy houses or pay for expenses related to childcare in their late twenties, they may not have been able to save for retirement yet.6.b. If the above explanation is correct, one can expect an increase in saving as these “baby boomers” age,become more financially solvent, and begin to prepare for retirement.7. The ranking from highest to lowest value should be first (a), then (d), and then (b). Clearly, (c) shouldbe lower than (a), but where exactly it ranks after that depends largely on the severeness of the liquidity constraint.8. A series follows a random walk when future changes cannot be predicted from past behavior. In otherwords, it does not have a mean or clear long-run value. Any major change comes about because of random shocks. Hall asserted that changes in current consumption largely come from unanticipated changes in income. According to the life-cycle theory or permanent-income theory, people try to smoothen out their consumption stream in such a way that its expected value is always the same in each period. Therefore, we can express future consumption as the expected value plus some error term, that is, some random value that is unpredictable. This error term is a shock to future income that is spread over the remaining lifetime.Hall supported the permanent-income hypothesis by showing that lagged consumption is the most2significant determinant of future consumption.9. The problem of excess sensitivity means that consumption responds more strongly to predictable changesin current income than the life-cycle theory and permanent-income theories predict. The problem of excess smoothness means that consumption does not respond as strongly to unpredictable changes in current income as these theories predict. However, the existence of these problems does not invalidate the theories.It simply means that the theories can explain consumption behavior only to a certain degree.10. Precautionary (or buffer stock) saving can be explained by uncertainty. It could be uncertainty in regardto one’s life expectancy or one’s time of retirement (af fecting the accumulated saving needed to finance retirement), or uncertainty about future spending needs (which may be caused by a change in family composition or health). Clearly, if we account for such uncertainties, we bring the model much closer to reality. For example, many elderly still continue to save after retirement in anticipation of predicted high medical costs not covered by Medicare.11.a. It is unclear whether an increase in the interest rate leads to an increase or a decrease in saving. On the onehand, as the interest rate increases, the return on saving increases and people may therefore increase their savings effort (due to the substitution effect). On the other hand, a higher return on saving implies that a given future savings goal can now be reached with a smaller savings effort in each year (due to the income effect).11.b. The income effect and the substitution effect generally tend to go in different directions, and the overalloutcome depends on the relative magnitude of these two effects. Until now, empirical evidence has not established a significant sensitivity of saving to changes in the interest rate. This would imply that the income and the substitution effects have about the same magnitude.12.a. According to the Barro-Ricardo hypothesis, it does not matter whether an increase in government spendingis financed by taxation or by issuing debt.12.b. The Barro-Ricardo hypothesis states that people realize that government debt financing by issuing bondssimply postpones taxation. In other words, people know that the government will have to raise taxes in the future to pay back what they have borrowed now. Therefore, expansionary fiscal policy that results in an increase in the budget deficit will no stimulate the economy since it will lead to an increase in saving rather than consumption. People want to be prepared to pay future taxes.12.c. There are two main objections to the Barro-Ricardo hypothesis. One is based on liquidity constraints, thatis, people may want to consume more but may not be able to borrow as much as they like. Therefore, if there is a tax cut, they will consume more, rather than save the tax cut. The other argument is that those people who benefit from a tax cut or an increase in government spending are not the same as those who will have to pay the higher taxes to pay off the debt. This argument assumes that people are not concerned about the welfare of their descendants.Technical Problems:1.a. If income remains constant over time, permanent income equals current income. Your permanent income3this year is YP0 = (1/5)(5*20,000) = 20,000.1.b. Your permanent income next year is YP1 = (1/5)(30,000 + 4*20,000) =1.c. Since C = 0.9YP, your consumption this year is C0 = 0.9*20,000 = 18,000.Your consumption next year is C1 = 0.9*19,000 = 17,100.1.d. In the short run, the mpc = (0.9)(1/5) = 0.18; but in the long run, the mpc = 0.9.1.e. We have already calculated this and next year's permanent income. In each of the coming years you add$30,000 and subtract $20,000, and therefore your permanent income (which is your average over a five year period) will increase by $2,000 each year until it reaches $30,000 after 5 years.YP o = (1/5)(5*20,000) = 20,000YP1 = (1/5)(1*30,000 + 4*20,000) = 22,000YP2 = (1/5)(2*30,000 + 3*20,000) = 24,000YP3 = (1/5)(3*30,000 + 2*20,000) = 26,000YP4 = (1/5)(4*30,000 + 1*20,000) = 28,000YP5 = (1/5)(5*30,000) = 30,000Y30,00028,00026,00024,00022,00020,0000 1 2 3 4 5 time2.a. The person lives for NL = 4 periods and earns a lifetime income ofYL = 30 + 60 + 90 + 0 = 180.Therefore consumption in each period will be C i = (1/4)180 = 45, i = 1, 2, 3, 4.This implies that saving in each period is:S1 = 30 - 45 = - 15; S2 = 60 - 45 = + 15; S3 = 90 - 45 = + 45; S4 = 0 - 45 = - 45.2.b. If liquidity constraints exist and the person cannot borrow in the first period, then she will consume all ofher income, that is, Y1 = C1 = 30.For the remaining three periods the person wants a stable consumption stream. Thus she will consume C(i) = (1/3)(60 + 90 + 0) = 50 in each of the remaining three periods i = 2, 3, 4.42.c. An increase in wealth of only $13 is not enough to offset the difference in consumption patterns betweenperiod 1 and the other periods. Therefore all of the increase in wealth will be consumed in period 1, such that C1 = 43. In the remaining three periods, consumption will be the same as in 2.b.An increase in wealth of $23 will be enough to offset the difference in consumption patterns. Lifetime consumption in each period will now be C i = (1/4)(180 + 23) = 50.75. This means that 20.75 (or almost all of the additional wealth) will be used up in the first period; the remaining 2.25 will be distributed over the next three years.3.a. According to the life-cycle theory and permanent income hypothesis (LC-PIH), the change in consumptionequals the surprise element, that is, ∆C LC-PIH= ε. According to the traditional theory, the change in consumption equals ∆C tr = c(∆YD). Therefore if a fraction λ of the population behaves according to the traditional theory and the other fraction behaves according to LC-PIH, then the total change in consumption is∆C = λ(∆C tr) + (1 - λ)(∆C LC-PIH) = λc(∆YD)+ (1 - λ)cε = (0.7)(0.8)10 + (0.3)ε = 5.6 + (0.3)ε3.b. ∆C = (.3)(.8)10 + (.7)ε = 2.4 + (.7)ε3.c. ∆C = (0)(.8)10 + 1ε = ε4.a. If the real interest rate increases, the opportunity cost of consuming should increase. Therefore, theaverage propensity to save, that is, the fraction of total income that is saved, should increase.4.b. If you only save for retirement and your savings goal is fixed, then you actually will save less. With ahigher interest rate it will take less saving each year to achieve your goal.4.c. The first case (4.a.) describes the substitution effect, whereas the second case (4.b.) describes the incomeeffect. Unless the magnitude of each of these effects is known, we cannot predict the overall effect of this interest rate increase on saving.5. One way to increase saving would be to either privatize or eliminate the Social Security system, so peoplewould have to save for retirement on their own. (Eliminating Social Security is not a very popular measure, but the privatization of Social Security is often discussed.) This would do away with the negative effect on saving that comes from the pay-as-you-go nature of financing Social Security. Another way might be to make it more difficult to borrow. The U.S. tax system encourages people (and firms) to borrow rather than save.5Additional Problems:1. As a share of GDP, how large is consumption compared to the other three main components.Would you expect consumption's share to increase or decrease in a recession?Consumption expenditures are roughly two thirds of total GDP, which is higher than the other three components (investment, government purchases, and net exports) taken together. The ratio of consumption to GDP, however, does not always remain constant. In a recession, for example, when income is below trend, we should expect the consumption-to-GDP ratio to increase, while in a boom, when income is above trend, we should expect the ratio to decrease. The reason is that current consumption is based on permanent rather than current income and when current income is greater than permanent income, the ratio of consumption to income (the apc) goes down. This argument is reinforced by the concept of automatic stability. When GDP falls, personal disposable income falls by less and thus consumption does not fall dramatically.2. True or false? Why?"The marginal propensity to consume out of transitory income is greater than the marginal propensity to consume out of permanent income."False. The permanent-income hypothesis argues that consumption is related to permanent disposable income. Individuals will only revise their consumption behavior significantly if they perceive a change in income as permanent. Very often people are uncertain as to whether a rise in income is permanent or transitory, so they do not significantly revise their consumption patterns immediately. This suggests a lower marginal propensity to consume out of transitory income than out of permanent income.3. Do you think that the marginal propensity to consume out of current income would differ betweentenured professors who have a high degree of job security and professional gamblers who never know when luck will strike?Tenured professors have a high degree of job security and their income does not vary a great deal. They can therefore relatively accurately estimate their permanent income. This means that their current consumption is largely based on current income, implying that their short-run mpc is fairly high. Gamblers, on the other hand, never know what their income in any given year is going to be. Therefore, they base their consumption decisions on their average expected lifetime income (permanent income) rather than on current income. This implies that their short-run mpc is fairly low.4. Is the short-run marginal propensity to save different between farmers and government employees?Why or why not?Government employees generally have very stable incomes and high job security. Therefore they base their consumption decision to a large extent on current income so their short-run mpc is high, while their short-run mps is low. Farmers, on the other hand, have highly variable incomes, depending on weather conditions. Therefore they tend to base their consumption decisions on their permanent income. Their short-run mpc is low, while their short-run mps is high.5. "If most people base their consumption decisions on their current rather than their permanentincome, then the short-run multiplier is greater than the long-run multiplier." Comment on this6statement.If most people follow the traditional theory and base their consumption decisions mostly on current income, then their mpc out of current income is high, making the value of the short-run multiplier high. But if most people follow the permanent-income theory and base their consumption decisions primarily on permanent income, then the short-run mpc is low, making the value of the short-run multiplier low. In either case, as long as some people follow the permanent-income theory, then the short-run multiplier should always be smaller than the long-run multiplier.6. Assume you define your permanent income as the average of this and the past four years’ incomesand you always consume 4/5 of your permanent income. Your earnings record over these years has been: Y t= 40,000, Y t-1 = 38,000, Y t-2 = 34,000, Y t-3 = 32,000, Y t-4 = 31,000.If next year your income increases to Y t+1= 46,000, by how much will your consumption change between year t and year t+1?YP t= (1/5)(40,000 + 38,000 + 34,000 + 32,000 + 31,000) = (1/5)175,000 = 35,000C t= (4/5)YP t = (4/5)35,000 = 28,000YP t+1 = (1/5)(46,000 + 40,000 + 38,000 + 34,000 + 32,000) = (1/5)190,000 = 38,000C t+1 = (4/5)YP t+1 = (4/5)38,000 = 30,400Therefore your consumption will change by C = 2,400.7. Assume a distant aunt gives you several thousand dollars and you use the money to pay back part ofyour student loan. Does your behavior correspond to the prediction of the permanent-income theory?Why or why not?Paying back your debts actually can be seen as an act of "saving." Therefore, since you use some unexpected income to save (rather than consume), your behavior fits the permanent income theory nicely.8. "Early retirement raises aggregate consumption." Comment on this statement.Early retirement reduces lifetime income and increases the length of retirement. The life-cycle model states that individuals consume on the basis of their average lifetime income to maintain a stable consumption path throughout their lives. In an economy with a constant population and no technological progress, aggregate consumption will fall if retirement age drops because people who retire earlier have to accumulate funds for more retirement years over fewer working years. As this can only be accomplished with greater saving, consumption has to be reduced.However, if the population is growing and retirement benefits are financed through taxes levied on workers currently employed, then aggregate consumption may actually rise. In this case, the working population will be paying for the reduction in lifetime earnings experienced by those who have retired early, and there is less need for retirement saving.9. The simple life-cycle hypothesis predicts that people save over their working years but dissave7during their retirement years. Do we actually observe such behavior? If not, can you explain why not?Most elderly actually do not dissave, but they do save less than they did during their working years. One of the reasons that the elderly still save may be the fact that they anticipate large medical bills as they grow older and therefore prefer to keep a certain buffer stock of saving. The elderly may also hope to leave some of their savings as bequests to their children or grandchildren.10. On October 19, 1987, the Dow Jones industrial average dropped about 500 points, or a little morethan 23%. What effect should a decline in stock values of this magnitude have had on aggregate demand according to the life-cycle theory of consumption?According to the life-cycle theory, any change in wealth should affect consumption behavior. The decline in stock values constituted roughly a $500 billion decline in wealth. However, we did not see a huge decrease in consumption in 1987, since the wealth effect tends to be fairly small. In addition, the Fed reacted promptly, announcing that liquidity would be provided if needed.11. Does the random walk model of consumption disprove the permanent income hypothesis? Why orwhy not?Robert Hall tried to disprove the permanent income theory by applying the concept of rational expectations to the theory of consumption. He asserted that consumption patterns may follow a random walk, that is, changes in consumption may come from unanticipated changes in income. However, by concluding that lagged consumption is the most significant determinant of future consumption, Hall actually supported the predictions of the permanent-income hypothesis.12. How is Hall’s random walk model of consumption related to the permanent-income hypothesis andwhat are the implications of these theories for fiscal policy?Hall asserted that changes in current consumption largely come from unanticipated changes in income. Any major change in consumption comes about because of random shocks. According to the permanent-income theory, people try to smoothen out their consumption stream in such a way that its expected value is always the same in each period. Therefore, we can express future consumption as the expected value plus some error term, that is, some random value that is unpredictable. This error term is a shock to future income that is spread over the remaining lifetime. Hall supported the permanent-income hypothesis by showing that lagged consumption is the most significant determinant of future consumption. The implication for fiscal policy is that a temporary tax change will not significantly affect current consumption, unless there are liquidity constraints.13. True or false? Why?"A temporary tax surcharge never has a significant effect on current consumption."False. If individuals know that the tax surcharge is temporary they will not alter their spending patterns as the tax change has little impact on their permanent income. However, when liquidity constraints exist, individuals may be forced to adjust their consumption behavior immediately. If individuals barely earn enough to finance their current consumption, for example, they may be forced to cut their current consumption if a temporary tax surcharge is levied.814. "As a response to a temporary increase in personal and corporate income taxes consumers willreduce their spending and firms will cut production and increase prices. Therefore all we will get is stagflation, that is, an increase in both unemployment and inflation, and tax revenues won't increase." Comment on this statement.The life-cycle/permanent-income theory of consumption predicts that temporary changes in income will not significantly affect the level of consumption. Thus a temporary tax surcharge should not significantly affect aggregate demand. A similar argument can be made about firms, since changes in production are often costly and therefore a temporary surcharge on corporate income taxes should not affect the level of output and prices. The levels of national income and prices should not be affected significantly but we should see a (temporary) increase in tax revenues due to the surcharge. (Note, however, that if consumers and firms face liquidity constraints, they may react to a temporary surcharge in the way described in the statement.)15. "Any tax cut that results in an increase in the budget deficit will fail to stimulate aggregatedemand." Comment on this statement. In your answer explain the effect of such a tax cut on interest rates, money supply, and private domestic saving.The Barro-Ricardo proposition states that a tax cut that results in a budget deficit increase leads to higher saving. Since people will anticipate a future tax increase to finance the higher deficit, permanent income will not be affected. Thus consumption will not be affected; instead people will save the tax cut. Since this is purely a fiscal policy measure, money supply is not affected. The increase in the budget deficit will lead to higher interest rates due to the increased demand for credit. (Note that evidence from the 1980s does not support this hypothesis. The Reagan tax cuts in 1981 resulted in a large increase in the budget deficit but there was no subsequent increase in saving.)916. Assume the government announces plans for fiscal expansion that are likely to result inincreased government borrowing. What effect should this have on aggregate consumption, money supply, the income velocity of money, the trade deficit, and savings?The Barro-Ricardo proposition states that if fiscal expansion results in a budget deficit, the public will anticipate a future tax increase to finance the deficit. They believe that their permanent income will not be affected and choose to save rather than consume more. Therefore, we should expect an increase in private saving but no significant change in consumption. Thus there is no significant change in national income and, since this is solely a fiscal policy, money supply is also not affected. Therefore there is no change in the income velocity. The trade deficit may also not be significantly affected, since domestic saving supports the budget deficit. However, evidence from the 1980s does not lend support for this hypothesis. Saving did not increase after the Reagan tax cuts that resulted in a huge increase in the budget deficit. Instead, we saw an increase in consumption and the trade deficit, since higher interest rates caused an inflow of funds, leading to an appreciation of the U.S. dollar. The income velocity also increased, due to the increase in economic activity.10。