Optimizing Signal Propagation for 2.4 GHz In-field WSN Systems over Outdoor Line-of-Sight Channels
Zhen Li, Tiansheng Hong*
College of Engineering South China Agricultural University Guangzhou, China, 510642
E-mail: {lizhen, tshong}@https://www.doczj.com/doc/8a16572567.html,
Ning Wang
Dept. of Biosystems and Agricultural Engineering Oklahoma State University
Stillwater, OK, USA, 74078
E-mail: ning.wang@https://www.doczj.com/doc/8a16572567.html,
Abstract—The objective of this study was to evaluate in-field radio frequency signal propagation at 2.4GHz band wireless sensor network (WSN) links. Commercial wireless sensor motes using this band as transmitter was wirelessly connected to its corresponding receiver and a hand-held spectrum analyzer. Indexed packets transmitted from the transmitter were captured by a spectrum analyzer to measure path-loss and synchronously received by a receiver using equal mote model to calculate packet delivery rate. Experiments were implemented in a research field of Oklahoma State University where wheat was planted. Impact factors considered were: plant canopy height, transmitter height, receiver height, carrier frequency, transmitter-to-receiver distance (T-R distance). Results indicated that RF signal was subject to plant canopy height. Univariate ANOVA results indicated in-field RF signal path-loss was subject to system configurations and plant height as well as their interactions. Estimated marginal means plots indicated that the best performance in general, if taking all plant canopy heights into consideration, might happen when the transmitter was installed at a height of 2 m and the receiver was mounted at the height of 3 m.
Keywords-path-loss; wireless sensor networks; signal propagation; precision agriculture
I.I NTRODUCTION
The current state-of-the-art wireless sensor network (WSN) technology is a promising solution for remote, large-scale, real-time, and continuous environmental data acquisition [1,2]. It offers the advantages of simplified wiring and harnessing thus has particular benefits for agricultural applications such as field physical property monitoring. Successful WSN implementations have already demonstrated improved precision agricultural management and operation in a real-time fashion and continue to progress [3-6].
ZigBee technology is a low cost and low power consumption solution for WSN applications which need long battery lives but does not require high data transfer rates [7]. Four physical layers (PHYs) in the industrial, scientific and medical (ISM) bands were specified for the low-rate wireless personal area networks (IEEE 802.15.4/LR-WPANs) in *Corresponding author which three of them were in the 868/915MHz bands and one in the 2.4GHz band [8]. Advantages of using 2.4GHz high frequency band include 250kbps data rate compared to 20kbps or 40kbps of using 868MHz or 915MHz bands, usability of small size antennas, frequency reuse, and low power consumption. However, the low frequency bands achieve longer signal propagation range and larger cover area due to receiver sensitivity reached -92dBm for 868/915MHz bands at lower data rate compared to -85dBm for 2.4GHz band [9].
Quantified relationships between path-loss and the impact factors during data transmission and radio propagation coverage will be useful to design and deploy a reliable, high-performance WSN. However, research on radio performance as affected by agricultural configuration and environment was limited and no standard tests were available. This research aimed to carry out quantitative studies on the effects of the pass-loss introduced by various system configurations and vegetations including transmitter height, receiver height and plant canopy height on the in-field radio-wave path-loss in 2.4GHz band. The specific objectives include:
1.To find and compare the major factors that affect
RF path-loss at 2.4GHz band for in-field WSN
throughout the wheat growing stages.
2.To evaluate and compare impact factor effects on
RF signal path-loss and packet delivery rate at the
selected RF band.
3.To determine the optimal configurations for reliable
data communications in a field WSN 2.4GHz RF
band.
II.M EHOD AND M ATERIALS
A.Definition of In-field Path-loss
Path-loss measures the average radio frequency (RF) attenuation along the path of radio propagation imposed on a transmitted signal when it arrives at the receiver. In this study, the experiment relied on the narrow-band measurements of continuous radio wave (CW) signals at 2.4GHz. Path-loss within a distance d was calculated using in-field measured transmitted and received power, respectively[10]. Logarithmic transformations on path-loss,
transmitted and received power were carried out as described in [11].
The logarithmic transformed equation for path-loss calculation does not hold when the measured received power equals the measured transmitted power. The result is that the actual power coming out of the antenna is inaccessible. In this study, a representation for a close-in distance (d 0) and the received power reference point were introduced into the path-loss calculations [12]. Here, d 0 was set to 1 m during the experiments. The path-loss within distance d was calculated as in
0()rmd rmd
PL d P P =- (1) where P rmd 0 is the power of the received signal at d 0 = 1 m (dBm), P rmd is the measured signal strength at d (dBm), and PL (d ) is the path-loss within d (dB). Further analysis of path-loss at 2.4GHz band was generalized using Eq.1. It was assumed that there was no significant difference between signal attenuation at a distance of 1 m during the experiments. B. Selection of Impact Factors
The impact factors considered in the experiments included the distance between a transmitter and a receiver (T-R distance, d ), the height of a transmitter (h t ), the height of a receiver (h r ), the height of plant canopy (h p ), carrier frequency (f ), antenna gain (G ) of both transmitter and receiver (G t and G r ). The height of plant canopy served as a blocking factor. Values of the impact factors used in the experiments are shown in Table 1. The maximum separation distance tested was 130m, the maximum values of the heights of the transmitter and receiver were set at 3 m. These values were determined based on the results from previous tests [11].
TABLE I. S ELECTED IMPACT FACTORS AND THEIR LEVELS
Factors d (m) h t (m) h r (m) f (MHz) G (dBi) Values
20~130 with 10 interval
1 2 3
1 2 3
2470
0 (G t ) 2.15 (G r )
C. Measurement Devices
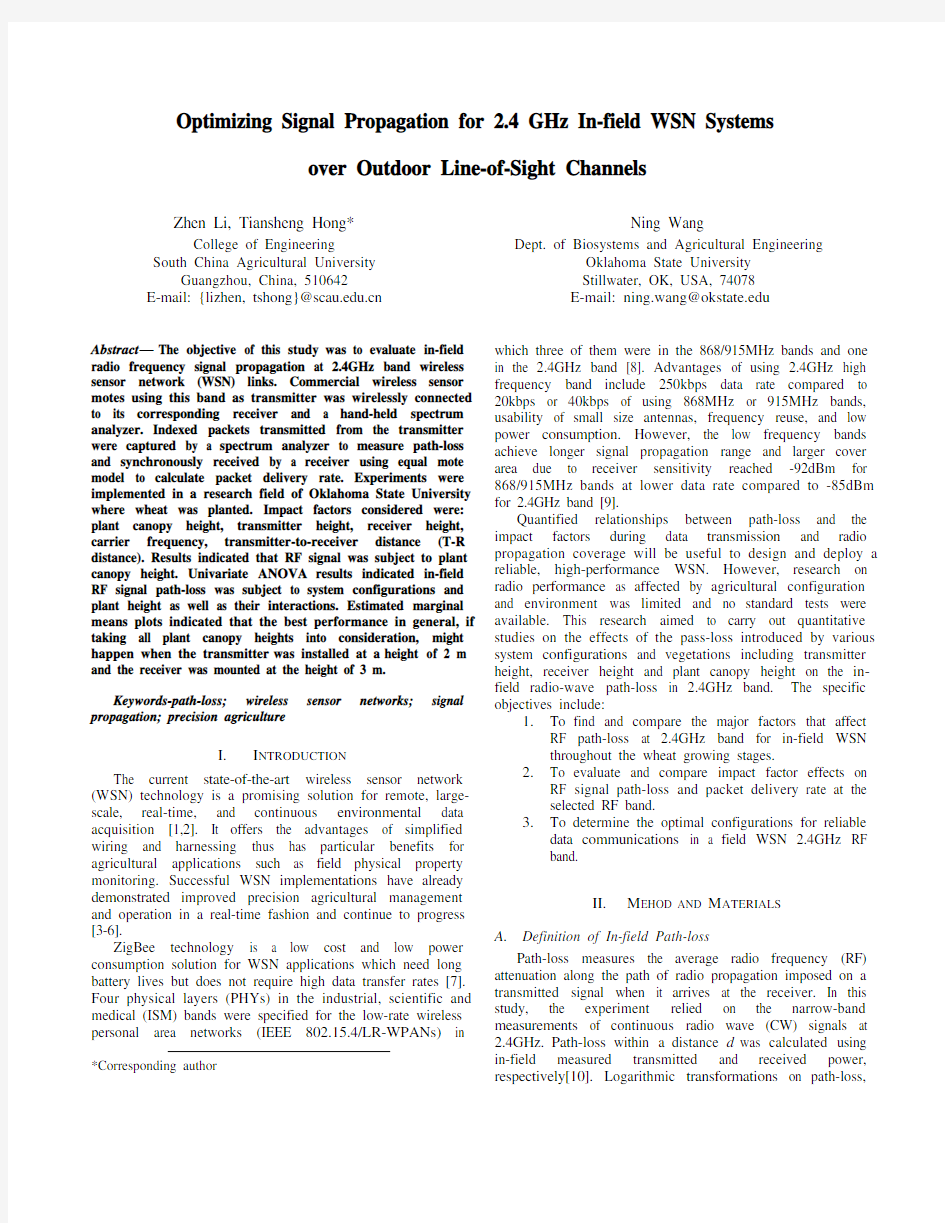
Transmitters : One type of node developed by Crossbow Technology [11] named IRIS was applied as transmitters. Once a node received a predefined request from a paired controller using equal model of node, it transmitted indexed packets to a receiver which measured both received signal strength and packet delivery rate (PDR) at the base station. A tri-pole was built to fix the transmitter at the heights of 1, 2, and 3 m (Fig. 1a). A plastic mounting pad was fixed at each height. The transmitter was attached to the pads using Velcro, as shown in Fig.1b. The tri-pole could be carried to any source spots, and it introduced minimum interference to the antenna polarization pattern.
The IRIS node used Atmel’s AT86RF230 (Atmel Crop., San Jose, CA, USA) as the IEEE 802.15.4 compliant RF transceiver. The transmission power was set to be 3.2dBm and the selected carrier frequency was 2470MHz (Channel 24) for not disturbing the working nodes in the same field. The modulation technique was the direct-sequence spread-
spectrum and quadratic phase shift keying (DSSS/QPSK). A 1/4 wave dipole antenna with 0dBi gain was used.
Receivers : The receivers were located at the receiving spot for different measurements. It was composed of four major components: a Laptop computer (D630, Dell, USA) for displaying and restoring experimental results including spectrum and packets in real-time, a handheld RF spectrum analyzer (N9340B, Agilent Technology, USA) for path-loss and signal attenuation analysis, an IRIS mote attached to a MIB510 mother board, and a cattle mote attached to a CC1010 development kit mother board both as base stations to receive indexed packets from different transmitters for packet PDR calculation.
A frame was built to hold the spectrum analyzer while the two mother boards were mounted on the side for retrieving similar heights. The frame was fixed on a flag-pole which was placed on the edge of the field. The height of the base station (Laptop not included) was adjustable. Key configurations of the spectrum analyzer were: pre-amplifier on, frequency span: 5MHz, resolution bandwidth (RBW): 100kHz, video bandwidth: 30kHz, attenuation: -10dB, reference level: -30dBm. By using the configurations above, the DANL was -100dBm in the experiments.
(a) (b)
Figure 1. Transmitter fixtures. (a) Tri-pole overview. (b) Cattle node on
mounting pad.
D. Measurement Software
Two software were used during the field experiments: Agilent N9340 PC Software (Version A.01.04, Agilent Technologies, USA) and Realterm (Version 2.0.0.43, open source). The N9340 PC Software could (1) display real-time graphical RF power spectrum in span of certain carrier frequency, (2) export power spectrum to spread sheets, and (3) make basic configurations of the analyzer. The XSniffer and Realterm were used to display and restore the received indexed data for PDR calculations.
E. Criterion of Using Wheat Canopy Heights as Blocks In the field, wheat canopy is the major attenuation source along transmission paths. In this study, canopy height was used as a blocking factor to make signal attenuation pattern similar within each block. The height thresholds for different blocks were calculated based on the principles of the Rayleigh roughness [13] and the Fresnel zone clearance [14]. These thresholds blocked the wheat growth into three stages [11].
Eq. 2 was derived from the Rayleigh roughness criterion but took the transmitter and receiver heights into
1
t r
H(2)where H1 was the first threshold of crop height in m, h t and h r were the heights of a transmitter and a receiver in m, respectively, d was the separation distance in m and λwas the wavelength in m. If the wheat height was lower than H1, the reflected waves from both the ground and plant were in phase and led to the situation of specular reflection. If the wheat height is higher than H1, more diffusion reflection is introduced which means waves are not in phase. The minimum H1is 0.14 m for 915MHz carrier frequency and 0.05 m for 2470MHz. As a result, H1=0.05m was considered as the first plant height threshold.
The second principle applied for the height threshold determination was the Fresnel zone clearance. It was commonly used to analyze interference introduced by obstacles near the path of a radio beam for line-of-sight communications [15]. The first Fresnel zone ellipsoid is the highest in the center of the line-of-sight RF transmission. It must be kept largely free from obstructions to avoid interference with the radio reception. However, some obstruction of the Fresnel zones can often be tolerated, as a rule of thumb, the maximum obstruction allowable is 40%, but the recommended obstruction is 20% or less. The second plant height threshold (H2) was calculated for using both 915MHz and 2470MHz carrier frequencies in previous studies as 0.40 m [11].
Using the two calculated thresholds, the growth of wheat was divided into three stages (blocks) based on plant canopy height (h p). Thresholds and signal attenuation patterns within each stage were explained in Table 2. H1 equaled 0.05 m as the threshold for dividing specular and diffusion reflection and H2 equaled 0.4 m for dividing whether or not the Fresnel zone was clear when both transmitter and receiver were at the height of 3 m.
TABLE II. T HRESHOLDS AND SIGNAL ATTENUATION PATTERNS OF
DIFFERENT PLANT HEIGHT BLOCKS
Plant height blocks Canopy height
range*
Radio-wave attenuation
pattern
1 0 ≤ h p < H1Specular reflection, Fresnel zone clear
2 H1≤h p < H2Diffusion reflection, Fresnel zone clear
3 H2≤h p < 0.80m
Diffusion reflection, Fresnel zone not clear
12
The maximum plant height for the third stage was measured during field experiments valued around 0.8 m. In the following sections, the three stages of wheat growth were referred to as plant height blocks 1, 2, and 3 with plant height intervals of [0m, 0.05m], [0.05m, 0.4m] and [0.4m, 0.8m], respectively. F.Experimental Field Setup
Field experiments started on 6 January 2009 and ended
on 22 May 2009, which covered a complete wheat growth
season in Stillwater, Oklahoma. The testing plots were
located in the experimental field where a WSN for soil
property monitoring was deployed [9,10]. Crop heights and
received signal strength data were collected during the
experiment period.
A receiving spot was located at one edge of the field.
Twelve spots with different T-R distances from Table 1, namely “source spots”, were marke d inside the field. The
separation distance between the first source spot and the base
station was 20 m ± 0.5 m. The following source spots were
located in series with a 10 m ±0.5 m interval toward the
other end of the field. A tri-pole with the node acting as
transmitter was placed at each source spot during the experiment. The strengths of the received signal and amount indexed packets, when the transmitters were at different T-R distances and under different system configurations, were recorded by a hand-held spectrum analyzer and two base stations corresponding to the two transmitters separately at the receiving spot.
G.Evaluation of Signal Propagation Performance
Three dimensional (3D) surface curves were plotted
using Matlab (Version 2008a, The MathWorks, Natick, MA,
USA) to evaluate the effects of T-R distance and
transmitter/receiver elevation differences on the performance
of the RF signal propagation under field conditions blocked in different plant growth stages with ling-of-sight communication.
H.Evaluation of Impact Factors’ Influence on Path-Loss
Univariate analysis of variance (ANOVA) was carried
out to identify and compare which impact factor(s) had
significant influences on the path-loss using 2.4GHz carrier frequency. Independent variables included transmitter height, receiver height, plant canopy height, and T-R distance. Treatment levels were as displayed in Table 1. Evaluated interactions included transmitter height and plant canopy height, receiver height and plant canopy height, and transmitter height and receiver height. A significance level of 0.05 was used. Estimated marginal means plots were generated to find the optimal transmitter height and receiver height when using 2.4GHz carrier frequency.
Marginal analysis was carried out and estimated marginal
means were plotted to evaluate and compare transmitter or receiver height affecting RF signal performance when taking all plant canopy heights into consideration. Two pairs of optimized transmitter and receiver heights were obtained for using both carrier frequencies based on estimated marginal means plots when the at which the marginal means reached the lowest point.
III.R ESULTS AND D ISCUSSION
A.Signal Strength at the Received-Power Reference Point
To determine the signal strength at the received-power
reference point, both base station and motes were kept at 1 m
in height and 1 m apart from each other. The transmission power was 4.0 dBm for the cattle mote. The effective radiated power as measured signal strength at the received-power reference point was -18.76 dBm. The path-loss from using 2.4GHz carrier frequency used in the following analysis were calculated as in
PL(d) = -18.76 - P rmd (3) where P rmd was the measured signal strength at d in dBm, PL(d) was the path-loss within d in dB.
B.Signal Propagation Performance Evaluation
3D surface curves of path-loss versus T-R distance and transmitter/receiver elevation difference were depicted in Fig.2. In general, there were combined effects of transmitter/receiver height and T-R distance on path-loss. The surface areas colored from green to orange extended from Fig. 2a to Fig. 2c, indicating that the transition from low path-loss (dark blue) to high path-loss (dark red) went smoothly along with plant growth for 2.4GHz carrier frequency.
(a)
(b)
(c)
Figure 2. Measured path-loss along the T-R distance under different transmitter/receiver heights. (a) to (c) Path-loss blocked in plant growth
stages 1 to 3 at 2.4GHz band. C.Evaluation of Impact Factors’ Influence on Path-loss
Univariate ANOVA results of the impact factors’influences to the path-loss were shown in Table 2. Results from using 2.4GHz carrier frequency indicated that: (1) all the single impact factors had significant influence to path-loss (Sig < 0.01); (2) all the impact factor interactions had significant influences to path-loss (Sig < 0.01).
TABLE III. U NIVARIATE ANOVA RESULTS OF THE IMPACT FACTORS’
INFLUENCES ON THE PATH-LOSS
Source df F Sig.
Corrected Model 125 15.731 0.000*
TH
2
23.998
0.000*
RH 2
42.895 0.000*
Dist 11 120.112 0.000*
PH 2 100.681 0.000*
TH * PH 4 12.629 0.000*
RH * PH 4 11.142 0.000*
TH * RH 4 6.652 0.000*
Total 320
Corrected Total 319
*Factor influence was significant at the 0.01 level
Two out of seven analyzed affecting sources had significant influences to path-loss from using 2.4GHz carrier frequency. It can be concluded that in-field RF signal path-loss was more subject to system configurations and plant height as well as their interactions for using higher carrier frequency.
(a)
(b)
Figure 3. Estimated marginal means of path-loss. (a) and (b), Transmitter height or receiver height as influencing source using 2.4GHz carrier
frequency.
Estimated marginal means of the path-loss to transmitter height or receiver height from using 2.4GHz carrier frequency were depicted in Fig. 3 (a) and (b), respectively. In
Fig.3 a, the minimum path-loss marginal mean was achieved at the transmitter height of 2 m. However, even it was at the valley of the curve, there was no significant difference between marginal means achieved at the transmitter heights of 2 m and 3 m. In Fig.3 b, the minimum path-loss marginal mean was achieved at the receiver height of 3 m. The trend of the curve in Fig.3 b was suggesting that lower marginal means of path-loss may be achieved at a higher receiver elevation. As a result, the best performance in general, if taking all plant canopy heights into consideration, might happen when the transmitter was installed at the height of 2 m and the receiver at the height of 3 m using 2.4GHz carrier frequency in this study.
D.Reliable Communication Distance Based on PDR
During the field experiments, the scenario when both transmitter and receiver heights were at one meter height at plant stage 3 was considered to be the worst case when the lowest PDR was found using the maximum transmission power. Another extreme case was that both transmitter and receiver heights were 3 meter at plant stage 1 which was considered to be the best case. As a result, a reliable communication distance for in-field WSN application using 2.4GMHz carrier frequency was considered to be 70 m, since the one-time PDR values for both the best and worst cases were higher than 80% at this distance.
IV.C ONCLUSION
In this study, wireless sensor motes using 2.4GHz carrier frequency as transmitters were wirelessly connected to their corresponding receivers and a hand-held spectrum analyzer. Plant canopy height, transmitter height, receiver height and transmitter-to-receiver distance were considered as impact factors on the radio propagation.
Univariate ANOVA results indicated that all seven analyzed affecting sources had significant influences to path-loss from using 2.4GHz carrier frequency. It can be concluded that in-field RF signal path-loss was more subject to system configurations and plant height as well as their interactions for using higher carrier frequency.
Estimated marginal means plots indicated that the best performance might happen when the transmitter was installed at a height of 2 m and the receiver was mounted at the height of 3 m for using both kinds of motes. However, it was possible to further lower the path-loss marginal means thus to achieve better communication with higher receiver elevations for using 2.4GHz carrier frequency.
Environmental factors such as humidity, temperature, wind and solar radiation are still unclear factors for in-field radio signal propagation. Further experiments are needed to include them in the models to better understand radio propagation behavior in crop field.
A CKNOWLEDGMENT
This work was supported by Special Fund for Agro-scientific Research in the Public Interest of China (No. 200903023), the National Natural Science Foundation of China (30871450), and the National Science Foundation of USA (CNS-0709329).
R EFERENCES
[1]R. Beckwith, C. Teibel, and P. Bowen. 2004. Report from the
field: Results from an agricultural wireless sensor network. In Proc. 29th Annual IEEE Intl. Conf., 471-478. Piscataway, N.J.: IEEE.
[2]H. Liu, Z. Meng, and S. Cui. 2007. A wireless sensor network
prototype for environmental monitoring in greenhouses: Wireless communications, networking, and mobile computing.
In Proc. WiCom 2007 Intl. Conf., 2344-2347. Piscataway, N.J.: IEEE.
[3]J. Burrell, T. Brooke, and R. Beckwith. 2004. Vineyard
computing: sensor networks in agricultural production. IEEE Pervasive Computing, 3(1):38–45.
[4]N. Wang, N. Zhang, M. Wang. Wireless sensors in agriculture
and food industry: recent developments and future perspective[J]. Computers and Electronics in Agriculture, 2006, 50(1): 1–14.
[5]G. Tolle, J. Polastre, R. Szewczyk, D. Culler, N. Tuner, K. Tu,
and S. Burgess. 2005. A Macroscope in the Redwoods. In Proc.of ACM Sensys '05: 51-63. New York, N.Y.: ACM Press.
[6]T. Wark, P. Corke, P. Sikka, L. Klingbeil, Y. Guo, C.
Crossman, P. Valencia, D. Swain, G. Bishop-Hurly. 2007.
Transforming Agriculture through Pervasive Wireless Sensor Networks. IEEE Pervasive Computing, 6(2): 50-57.
[7]S. A. O'Shaughnessy, Evett, S. R.. 2010. Developing Wireless
Sensor Networks for Monitoring Crop Canopy Temperature Using a Moving Sprinkler System as a Platform. Applied Engineering in Agriculture, 26(2): 331-341.
[8]S. C. Ergen. ZigBee/IEEE 802.15.4 Summary. 2004.
https://www.doczj.com/doc/8a16572567.html,/
csinem/academic/publications/zigbee.pdf. Accessed June 18, 2010.
[9]Z. Li, N. Wang, A. Franzen, and C. Godsey. 2008.
Development of a wireless sensor network for field soil moisture monitoring. ASABE Paper No. 083835. St. Joseph, Mich.: ASABE.
[10]Z. Li, N. Wang, A. Franzen, P. Taher. 2009. In-field Soil
Property Monitoring using Hybrid Sensor Network. ASABE Paper No. 096191. St. Joseph, Mich.: ASABE.
[11]R. D. Stewart, J. Solie. 2007. Foraging Detection of Free-
grazing Cattle using a Wireless Motion Sensing Device and Micro-GPS. 2007 ASABE Annual International Meeting, Paper No. 071133. Minneapolis, Minnesota, USA.
[12]G. Durgin, T. S. Rappaport, and H. Xu. 1998. Measurements
and models for radio-wave path loss and penetration loss in and around homes and trees at 5.85 GHz. IEEE Trans.
Communications 46(11): 1484-1496.
[13]Z. Li, N. Wang, T. Hong. 2010. Radio Path-loss Modeling for
a 2.4GHz In-field Wireless Sensor Network. Transactions of
the ASABE, 53(2): 615-624.
[14]R. E. Sheriff. 1996. Understanding the Fresnel zone. AAPG
Explorer, Geophysical Corner(Oct. 1996). Tulsa, Okla.: AAPG Datapages/Search and Discovery. Available at: https://www.doczj.com/doc/8a16572567.html,/documents/geophysical/sheriff/i mages/sheriff.pdf. Accessed 9 July 2009.
[15]H. Sizun. 2005. Radio Wave Propagation for
Telecommunication Applications. Berlin, Germany: Springer-Verlag.
1、 外文原文 A: Fundamentals of Single-chip Microcomputer Th e si ng le -c hi p m ic ro co mp ut er i s t he c ul mi na ti on of both t h e de ve lo pm en t o f t he d ig it al co m pu te r an d th e i n te gr at ed c i rc ui t a rg ua bl y t h e to w m os t s ig ni f ic an t i nv en ti on s o f t he 20th c e nt ur y [1]. Th es e t ow ty pe s of ar ch it ec tu re a re fo un d i n s in g le -ch i p m i cr oc om pu te r. So m e em pl oy t he spl i t pr og ra m/da ta m e mo ry o f th e H a rv ar d ar ch it ect u re , sh ow n in Fi g.3-5A -1, o th ers fo ll ow t he p h il os op hy , wi del y a da pt ed f or ge n er al -p ur po se co m pu te rs a nd m i cr op ro ce ss o r s, o f ma ki ng n o log i ca l di st in ct ion be tw ee n p r og ra m an d d at a m e mo ry a s i n t he P r in ce to n ar ch ite c tu re , sh ow n i n F ig.3-5A-2. In g en er al te r ms a s in gl e -chi p m ic ro co mp ut er i s c h ar ac te ri ze d b y t h e i nc or po ra ti on o f a ll t he un it s of a co mp uter i n to a s in gl e d ev i ce , as s ho wn in Fi g3-5A -3. Fig.3-5A-1 A Harvard type Program memory Data memory CPU Input& Output unit memory CPU Input& Output unit
中英文资料对照外文翻译 基于网络共享的无线传感网络设计 摘要:无线传感器网络是近年来的一种新兴发展技术,它在环境监测、农业和公众健康等方面有着广泛的应用。在发展中国家,无线传感器网络技术是一种常用的技术模型。由于无线传感网络的在线监测和高效率的网络传送,使其具有很大的发展前景,然而无线传感网络的发展仍然面临着很大的挑战。其主要挑战包括传感器的可携性、快速性。我们首先讨论了传感器网络的可行性然后描述在解决各种技术性挑战时传感器应产生的便携性。我们还讨论了关于孟加拉国和加利 尼亚州基于无线传感网络的水质的开发和监测。 关键词:无线传感网络、在线监测 1.简介 无线传感器网络,是计算机设备和传感器之间的桥梁,在公共卫生、环境和农业等领域发挥着巨大的作用。一个单一的设备应该有一个处理器,一个无线电和多个传感器。当这些设备在一个领域部署时,传感装置测量这一领域的特殊环境。然后将监测到的数据通过无线电进行传输,再由计算机进行数据分析。这样,无线传感器网络可以对环境中各种变化进行详细的观察。无线传感器网络是能够测量各种现象如在水中的污染物含量,水灌溉流量。比如,最近发生的污染涌流进中国松花江,而松花江又是饮用水的主要来源。通过测定水流量和速度,通过传感器对江水进行实时监测,就能够确定污染桶的数量和流动方向。 不幸的是,人们只是在资源相对丰富这个条件下做文章,无线传感器网络的潜力在很大程度上仍未开发,费用对无线传感器网络是几个主要障碍之一,阻止了其更广阔的发展前景。许多无线传感器网络组件正在趋于便宜化(例如有关计算能力的组件),而传感器本身仍是最昂贵的。正如在在文献[5]中所指出的,成功的技术依赖于
Advantages of Managed Code Microsoft intermediate language shares with Java byte code the idea that it is a low-level language witha simple syntax , which can be very quickly translated intonative machine code. Having this well-defined universal syntax for code has significant advantages. Platform independence First, it means that the same file containing byte code instructions can be placed on any platform; atruntime the final stage of compilation can then be easily accomplished so that the code will run on thatparticular platform. In other words, by compiling to IL we obtain platform independence for .NET, inmuch the same way as compiling to Java byte code gives Java platform independence. Performance improvement IL is actually a bit more ambitious than Java bytecode. IL is always Just-In-Time compiled (known as JIT), whereas Java byte code was ofteninterpreted. One of the disadvantages of Java was that, on execution, the process of translating from Javabyte code to native executable resulted in a loss of performance. Instead of compiling the entire application in one go (which could lead to a slow start-up time), the JITcompiler simply compiles each portion of code as it is called (just-in-time). When code has been compiled.once, the resultant native executable is stored until the application exits, so that it does not need to berecompiled the next time that portion of code is run. Microsoft argues that this process is more efficientthan compiling the entire application code at the start, because of the likelihood that large portions of anyapplication code will not actually be executed in any given run. Using the JIT compiler, such code willnever be compiled.
西南交通大学 毕业设计(英文翻译) 节能型机房温湿度远程控制系统测控节点设 计 年级: 学号: 姓名: 专业: 指导老师: 二零一一年六月
Mosix Mosix修改bsdi上的BSD/ OS来提供电脑上的跨网络的动态负载平衡组和先发制人进程迁移。这是不错的东西,不只是为并行处理,但对于通常使用一个集群很像一个可扩展的SMP。是否有Linux版本?详细信息,请看www.cs.huji.ac.il/mosix/。NOW (工作站网络) 伯克利工作站网络项目,https://www.doczj.com/doc/8a16572567.html,/,已经极推广了并行计算中使用工作站网络,这里还有很多工作在进行中,都致力于“在未来几年展示一个实际的100处理器系统”。唉,他们不使用linux。 并行处理使用linux 并行处理使用Linux WWW站点,https://www.doczj.com/doc/8a16572567.html,/LDP/,是这些指南和许多相关文件包括为全日制量身订造的在线幻灯片的家园。除了在报纸项目上,普渡大学电机与计算机工程系已经是并行处理的领先者,这个的设立是为了帮助别人申请并行处理的Linux电脑。 自从普渡大学的第一组Linux个人电脑在1994年2月组装以来,已经诞生了许多的Linux PC集群,有些还包括视频墙。然而这些集群使用386,486和奔腾系统(没有奔腾Pro系统),英特尔最近获得普渡大学的捐赠,将允许它的奔腾II系统构建多个大型集群(与单个群集计划多达165机)。并且这些集群都将有论文网,也具有最传统的网络。 奔腾Pro集群研讨会 1997年,4月10-11日,埃姆斯实验室在得梅因,爱荷华州举行了奔腾Pro集群研讨会。WWW在本次研讨会,https://www.doczj.com/doc/8a16572567.html,/workshops/PPCworkshop.html,从云集的参加者中收集了很多丰富的PC集群信息。 TreadMarks帝斯曼(分布式共享存) 帝斯曼(分布式共享存)是一种技术,即一个消息传递系统可以出现的行为作为一个SMP。有不少这样的系统,其部分使用OS页故障触发消息传输机制。TreadMarks,https://www.doczj.com/doc/8a16572567.html,/~willy/TreadMarks/overview.html,是这种系统更有效地之一,并在Linux集群上运行。坏消息是“TreadMarks”正在由一个小成本的大学和非盈利机构的分配。欲了解更多有关该软件,请联系https://www.doczj.com/doc/8a16572567.html,信息。 U型网 (用户级网络接口架构) U型网(用户级网络接口架构)在康奈尔大学,
无线传感器网络概述 1科技发展的脚步越来越快,人类已经置身于信息时代,作为信息获取最重要和最基本的技术——传感器技术,得到了极大的发展。 2目前无线网络可分为两种:一种是有基础设施的网络,需要固定基站,例如我们使用的手机,属于无线蜂窝网,它就需要高大的天线和大功率基站来支持,基站就是最重要的基础设施;另外,使用无线网卡上网的无线局域网,由于采用了接入点这种固定设备,也属于有基础设施网。 另一类是无基础设施网,又称为无线Ad hoc网络,节点是分布式的,没有专门的固定基站。 无线Ad hoc网络又可分为两类: 一类是移动Ad hoc网络(Mobile Ad hoc Network,简称MANET),它的终端是快速移动的。一个典型的例子是美军101空降师装备的Ad hoc网络通信设备,保证在远程空投到一个陌生地点之后,在高度机动的装备车辆上仍然能够实现各种通信业务,而无需借助外部设施的支援。另一类就是我们讲的无线传感器网络,它的节点是静止的或者移动很慢。 3传感器网络的标准定义是这样的: 传感器网络是大量的静止或移动的传感器以自组织和多跳的方式构成的无线网络,其目的是协作地感知、采集、处理和传输网络覆盖地理区域内感知对象的监测信息,并报告给用户。它的英文是Wireless Sensor Network, 简称WSN。 如图所示,大量的传感器节点将探测数据,通过汇聚节点经其它网络发送给了用户。 在这个定义中,传感器网络实现了数据采集、处理和传输的三种功能,而这正对应着现代信息技术的三大基础技术,即传感器技术、计算机技术和通信技术。 4它们分别构成了信息系统的“感官”、“大脑”和“神经”三个部分。因此说,无线传感器网络正是这三种技术的结合,可以构成一个独立的现代信息系统。 5第一阶段:最早可以追溯二十世纪70年代越战时期使用的传统的传感器系统。当年美越双方在密林覆盖的“胡志明小道”进行了一场血腥较量,这条道路是胡志明部队向南方游击队源源不断输送物资的秘密通道,美军曾经绞尽脑汁动用航空兵狂轰滥炸,但效果不大。后来,美军投放了2万多个“热带树”传感器。所谓“热带树”实际上是由震动和声响传感器组成的系统,它由飞机投放,落地后插入泥土中,只露出伪装成树枝的无线电天线,因而被称为“热带树”。只要对方车队经过,传感器探测出目标产生的震动和声响信息,自动发送到指挥中心,美机立即展开追杀,总共炸毁或炸坏4.6万辆卡车。 这种早期使用的传感器系统的特征在于传感器节点只产生探测数据流,没有计算能力,并且相互之间不能通信。 6第二阶段是二十世纪80年代至90年代之间。 主要是美军研制的分布式传感器网络系统、海军协同交战能力系统、远程战场传感器系统等。这种现代微型化的传感器具备感知能力、计算能力和通信能力。因此在1999年,商业周刊将传感器网络列为21世纪最具影响的21项技术之一。 7第三阶段:21世纪开始至今。也就是本课开始介绍的911事件发生之后。这个阶段的传感器网络技术特点在于网络传输自组织、节点设计低功耗。 除了应用于情报部门反恐活动以外,在其它领域更是获得了很好的应用,所以2002年美国国家重点实验室--橡树岭实验室提出了“网络就是传感器”的论断。 由于无线传感网在国际上被认为是继互联网之后的第二大网络,2003年美国《技术评论》杂志评出对人类未来生活产生深远影响的十大新兴技术,传感器网络被列为第一。 在现代意义上的无线传感网研究及其应用方面,我国与发达国家几乎同步启动,它已经成为我国信息领域位居世界前列的少数方向之一。在2006年我国发布的《国家中长期科学
英文翻译 英语原文: . Introducing Classes The only remaining feature we need to understand before solving our bookstore problem is how to write a data structure to represent our transaction data. In C++ we define our own data structure by defining a class. The class mechanism is one of the most important features in C++. In fact, a primary focus of the design of C++ is to make it possible to define class types that behave as naturally as the built-in types themselves. The library types that we've seen already, such as istream and ostream, are all defined as classesthat is,they are not strictly speaking part of the language. Complete understanding of the class mechanism requires mastering a lot of information. Fortunately, it is possible to use a class that someone else has written without knowing how to define a class ourselves. In this section, we'll describe a simple class that we canuse in solving our bookstore problem. We'll implement this class in the subsequent chapters as we learn more about types,expressions, statements, and functionsall of which are used in defining classes. To use a class we need to know three things: What is its name? Where is it defined? What operations does it support? For our bookstore problem, we'll assume that the class is named Sales_item and that it is defined in a header named Sales_item.h. The Sales_item Class The purpose of the Sales_item class is to store an ISBN and keep track of the number of copies sold, the revenue, and average sales price for that book. How these data are stored or computed is not our concern. To use a class, we need not know anything about how it is implemented. Instead, what we need to know is what operations the class provides. As we've seen, when we use library facilities such as IO, we must include the associated headers. Similarly, for our own classes, we must make the definitions associated with the class available to the compiler. We do so in much the same way. Typically, we put the class definition into a file. Any program that wants to use our class must include that file. Conventionally, class types are stored in a file with a name that, like the name of a program source file, has two parts: a file name and a file suffix. Usually the file name is the same as the class defined in the header. The suffix usually is .h, but some programmers use .H, .hpp, or .hxx. Compilers usually aren't picky about header file names, but IDEs sometimes are. We'll assume that our class is defined in a file named Sales_item.h. Operations on Sales_item Objects
电厂蒸汽动力的基础和使用 1.1 为何需要了解蒸汽 对于目前为止最大的发电工业部门来说, 蒸汽动力是最为基础性的。 若没有蒸汽动力, 社会的样子将会变得和现在大为不同。我们将不得已的去依靠水力发电厂、风车、电池、太阳能蓄电池和燃料电池,这些方法只能为我们平日用电提供很小的一部分。 蒸汽是很重要的,产生和使用蒸汽的安全与效率取决于怎样控制和应用仪表,在术语中通常被简写成C&I(控制和仪表 。此书旨在在发电厂的工程规程和电子学、仪器仪表以 及控制工程之间架设一座桥梁。 作为开篇,我将在本章大体描述由水到蒸汽的形态变化,然后将叙述蒸汽产生和使用的基本原则的概述。这看似简单的课题实际上却极为复杂。这里, 我们有必要做一个概述:这本书不是内容详尽的论文,有的时候甚至会掩盖一些细节, 而这些细节将会使热力学家 和燃烧物理学家都为之一震。但我们应该了解,这本书的目的是为了使控制仪表工程师充 分理解这一课题,从而可以安全的处理实用控制系统设计、运作、维护等方面的问题。1.2沸腾:水到蒸汽的状态变化 当水被加热时,其温度变化能通过某种途径被察觉(例如用温度计 。通过这种方式 得到的热量因为在某时水开始沸腾时其效果可被察觉,因而被称为感热。 然而,我们还需要更深的了解。“沸腾”究竟是什么含义?在深入了解之前,我们必须考虑到物质的三种状态:固态,液态,气态。 (当气体中的原子被电离时所产生的等离子气体经常被认为是物质的第四种状态, 但在实际应用中, 只需考虑以上三种状态固态,
物质由分子通过分子间的吸引力紧紧地靠在一起。当物质吸收热量,分子的能量升级并且 使得分子之间的间隙增大。当越来越多的能量被吸收,这种效果就会加剧,粒子之间相互脱离。这种由固态到液态的状态变化通常被称之为熔化。 当液体吸收了更多的热量时,一些分子获得了足够多的能量而从表面脱离,这个过程 被称为蒸发(凭此洒在地面的水会逐渐的消失在蒸发的过程中,一些分子是在相当低的 温度下脱离的,然而随着温度的上升,分子更加迅速的脱离,并且在某一温度上液体内部 变得非常剧烈,大量的气泡向液体表面升起。在这时我们称液体开始沸腾。这个过程是变为蒸汽的过程,也就是液体处于汽化状态。 让我们试想大量的水装在一个敞开的容器内。液体表面的空气对液体施加了一定的压 力,随着液体温度的上升,便会有足够的能量使得表面的分子挣脱出去,水这时开始改变 自身的状态,变成蒸汽。在此条件下获得更多的热量将不会引起温度上的明显变化。所增 加的能量只是被用来改变液体的状态。它的效用不能用温度计测量出来,但是它仍然发生 着。正因为如此,它被称为是潜在的,而不是可认知的热量。使这一现象发生的温度被称为是沸点。在常温常压下,水的沸点为100摄氏度。 如果液体表面的压力上升, 需要更多的能量才可以使得水变为蒸汽的状态。 换句话说, 必须使得温度更高才可以使它沸腾。总而言之,如果大气压力比正常值升高百分之十,水必须被加热到一百零二度才可以使之沸腾。
Journal of Southeast U niversity (Eng lish Edition) V o.l 26,N o .1,pp .73-77M ar .2010 I SSN 1003 7985 Physiological signal acquisition syste m based on w ireless sensor net works Q iuW enjiao Zhang Y ongkui (K ey L abo ra t o ry o f Ch ild D eve l opm ent and L earn i ng Sc ience o fM i n istry o f Education ,Southea st U n i v ersity ,N anji ng 210096,Ch i na) Abstr act :B ase d on w ireless sensor net w orks ,a physi o l ogical si gnal acquisiti on syste m is pr oposed .The syste m is use d i n classroo m education in order t o understand t he physi o l ogical c hanges i n t he students .I n t he s y ste m,the biolog i cal electrical si gnal relate d to student atte n ti on a nd e m oti on states ca n be m easur ed by electrocar d i ogr aphy signals .The b i oel ectri cal signal is digitali zed at a 200H z s a m p ling rate and is tra n s m itted by t he Z ig B ee protoc o.l S i m u lta neously ,t he B l uet ooth technology is als o e m be dde d i n the nodes so as to m eet the high sa m pli ng rate a nd the high ba nd w i d t h tra n s m issi on .The syste m can i m p l e m ent them on it o ri ng tas k s for 30students ,and t he experi m ental resu lts of usi ng t he syste m i n t he cl assroo m are propose d .Finall y ,t he a pplicati ons of w irel ess se n s or net w orks used in e ducati on is als o d iscussed .K ey w or ds :w ir eless sensor net w or k ;physi o l ogical si gna;l e du cati on Recei ved 2009 07 20.Biographies :Q i u W en ji ao (1969 ),m ale ,graduate ;Zh ang Y on gku i (corres ponding au t ho r),m ale ,do ctor ,ass ociat e pro fess or ,yzhangb @s https://www.doczj.com/doc/8a16572567.html, .cn . Foundati on ite m:The N ati ona lNatural S ci en ce Foundation of Ch i na(No.60775057). C itati on :Q iu W en ji ao,Zh ang Y on gku.i Phy si o l og i ca l signa l acqu isition s y st e m based on w i rel ess sen s or net w ork s[J].J ournal o f SoutheastU niver sit y (E ngli sh Ed iti on ),2010,26(1):73 77. A lthough the attent i on state and e mot i ona l state of stude n ts dur i ng the lear n i ng process belong to the psyc holog ica l do m a i n,it can be i ndirectly m easured by physi o l og i cal signals ,suc h as e lectr ocard i ography si gnals and pulse signals .Students and teachers m ental states of attention and e mo ti on in the classroo m m ay be chang i ng dur i ng teach i ng progress ,wh ich can physi o l og i cally acti vate the sy m pathetic and parasy mpathetic division o f the autono m ic nervous syste m (AN S )[1 2] .T hese m easurable physi o l og i cal signals can be recorded for the analyses of psyc holog ica l ar ousal of social re w ar ds and punish m ents ,such as posit i ve feedbac k by the teacher s praises or higher exa m i nat i on grades ,even the a mount of a scholarship ,al though the arousal of the autono m ic nervous syste m reac t i ons m ay be a co m plex i ndirect relationship to e m o t i on [3 4] .Interact i ons bet w een states of the autono m ic nerv ous syste m and cognit i ve perfor m ance have a long trad ition of being a top ic of psycho log ical research .C lassic concepts fro m mo tivat i onal psycho logy have suggested an i nverted u shaped association bet w een unspec ific activat i on and m en tal funct i oning [5 6] .A ccor d i ng to this ,the best funct i onal condit i ons are expected atm idrange arousa,l and both over ar ousa l and under arousal are acco m panied by declines in perf or m ance .Cardiovasc u lar psychophysiology has also contributed to this li ne of research ,the respective models re l at i ng changes in card i ovascular act i v ity to facilitation, i nh i b it i on of i nfor m ation processi ng [7] or ener get icm ob iliza t i on o f the organis m when faced w ith a situat i on requ iri ng behav i oral ad j ust m ent [8] .H o w ever ,although this certai n ly const itutes a benefic i a l appr oach ,e m p irical work i n th is f i e l d re m a i ns re lati vely sparse [9] .Both the sy m pathetic syste m and the parasy mpathetic syste m contri bute to cardi ovascular regulat i on [10] .Sy mpathetic i n fl uences are trans m itted through efferent fibres to the si nus node ,the m yo cardiu m and the vascularm usc u lature ,and their activati on leads to an i ncrease i n heart rate ,cardiac contract ility and vascular tone .Parasy mpathetic i nfl ue nces arew i de l y ,but not co mpletely ,restri cted to the m odulat i on of heart rate through i nhibiting sinus node act i v ity .I n addition ,the cardiac baroreflex is involved .I n th i s negative feedbac k loop ,c han ges i n the act i vity of the arterial baroreceptors due to fl uctua tions i n b l ood pressure are responded w ith co m pensatory changes i n heart rate and contract ility .A co mplex net work of brai n ste m un its subserve cardi ovascular autono m ic contro,l e .g .,the nucleus of the so litar y tract(NT S),the dorsalm otor nucle us(DMN ),the nucleus a mbiguous(NA )and the rostral ventrolateral medulla(RVL M )[11] .B ilateral direct and i ndi rect c onnecti ons ex ist bet w een this net work and cortical areas ,which for m an m i portant li nk bet wee n cardi ovascular regulation and cogn ition [12-13] .The present study am i s at in vest i gat i ng relationsh i ps a mong features of sy m pathetic ,para sy mpathetic and bar oreflex car d i ovascular control and atten tional perfor mance . To collect these physi ca l and mental states data i n real tm i e and objectivel y ,a hybrid w ireless sensor net w ork is desi gned as the subjects of a teac her and st ude nts are mob ile .For m edical and ho m e usage ,li ce nse free IS M (i ndustr y ,sci ence ,m edical)radio frequency(RF )o f 2 4G H z Z i gBee w ire l ess sensor node technology is usef u l [14 18] . 1 Syste m D escripti o n A s a secondary ai m ,the study i nvestigates i nter i nd i v i d ual differences i n task i nduced cardiovascular m odula t i ons .Porges [19] postulated an associat i on bet w een resti ng cardiac vagal tone and the ex tent o f card i ovascular react i v i ty .Th is is consistent w ith stud i es that have revealed m ore pronounced heart rate responses to var i ous st i m u li i n chil dren and adults w ith higher baseline heart rate variabili ty [19 21].Cardiovascular reacti v ity to cogniti ve de m a nds m ay also rel ate to task perfor m ance .Duschek [22] found a positive correlat i on bet wee n systo lic and diastolic b l ood pressure in creases duri ng the executi on o f five attenti on tasks a nd the perfor mance on each o f the m.I n i nfants ,greater decreases of RS A duri ng m ental testing are related to higher f unct i onal levels [21] .Inter i ndividual differences in cardiovasc ular mod ulation possi bly reflect different degrees of autono m ic adj ust
长江大学工程技术学院 毕业设计(论文)外文翻译 外 文 题 目 Matlab Based Interactive Simulation Program for 2D Multisegment Mechanical Systems 译 文 题 目 二维多段机械系统基于Matlab 的 交互式仿真程序 系 部 化学工程系 专 业 班 级 化工60801 学 生 姓 名 李泽辉 指 导 教 师 张 铭 辅 导 教 师 张 铭 完 成 日 期 2012.4.15 顶层配置在管路等,要求设备,所有设要求,对调整使案,编是指机确保机组中资料试
外文翻译 二维多段机械系统基于Matlab 的交互式仿真程序 Henryk Josiński, Adam ?witoński, Karol J?drasiak 著;李泽辉 译 摘要:本文介绍了多段机械系统设计原则,代表的是一个模型的一部分的设计系统,然后扩展 形成的几个部分和模型算法的分类与整合的过程,以及简化步骤的过程叫多段系统。本文还介绍了设计过程的二维多段机械系统的数字模型,和使用Matlab 的软件包来实现仿真。本文还讨论测试运行了一个实验,以及几种算法的计算,实现了每个单一步骤的整合。 1 简介 科学家创造了物理模型和数学模型来表示人类在运动中的各种形式。数学模型 使创建数字模型和进行计算机仿真成为可能。模型试验,可以使人们不必真正的实 验就可以虚拟的进行力和力矩的分解。 本文研究的目的是建立一个简单的多段运动模型,以增加模型的连续性和如何 避免不连续为原则。这是创建一个人类运动模型系统的冰山一角。其使用matlab 程 序包创建的数字模型,可以仿真人类运动。 文献中关于这一主题的内容很广泛。运动的模式和力矩的分解在这些文献中都 有涉猎。动态的平面人体运动模型,提出了解决了迭代矩阵的方法。还值得一提的 是这类项目的参考书目,布鲁贝克等人提出了一个模型——人腿模型,这个以人的 物理运动为基础的平面模型仿真了人腿——一个单一的扭簧和冲击碰撞模型。人腿 模型虽然简单,但是它展示人类的步态在水平地面上的运动特征。布鲁贝克等人还 介绍,在人腿模型的双足行走的基础上,从生物力学的角度而言,符合人体步行的 特征。这个模型具有一个躯干,双腿膝盖和脚踝。它能够合理的表现出人多样的步 态风格。一个仿真人类运动的数学模型反应出了人的部分运动状态。 图1. 力的分解 2 力的分解
《无线传感器网络》试题 一、填空题(每题4分,共计60分) 1、传感器网络的三个基本要素:传感器,感知对象,观察者 2、传感器网络的基本功能:协作地感知、采集、处理和发布感知信息 3、无线传感器节点的基本功能:采集、处理、控制和通信等 4、传感器网络常见的时间同步机制有: 5、无线通信物理层的主要技术包括:介质的选择、频段的选择、调制技术和扩频技术 6扩频技术按照工作方式的不同,可以分为以下四种: :直接序列扩频、跳频、跳时、宽带线性调频扩频 7、定向扩散路由机制可以分为三个阶段:周期性的兴趣扩散、梯度建立和路径加强 8、无线传感器网络特点:大规模网络、自组织网络、可靠的网络、以数据为中心的网络、应用相关的网络 9、无线传感器网络的关键技术主要包括:网络拓扑控制、网络协议、时间同步、定位技术、数据融合及管理、网络安全、应用层技术等 10、IEEE 802.15.4标准主要包括:物理层和MAC层的标准 11、简述无线传感器网络后台管理软件结构与组成:后台管理软件通常由数据库、数据处理引擎、图形用户界面和后台组件四个部分组成。 12、数据融合的内容主要包括:多传感器的目标探测、数据关联、跟踪与识别、情况评估和预测 13、无线传感器网络可以选择的频段有:868MHZ、915MHZ、2.4GHZ 5GHZ 14、传感器网络的电源节能方法:休眠机制、数据融合等, 15、传感器网络的安全问题:(1) 机密性问题。 (2) 点到点的消息认证问题。 (3) 完整性鉴别问题。 16、802.11规定三种帧间间隔:短帧间间隔SIFS,长度为 28 μs 、点协调功能帧间间隔PIFS长度是 SIFS 加一个时隙(slot)长度,即78 μs 分布协调功能帧间间隔DIFS ,DIFS长度=PIFS +1个时隙长度,DIFS 的长度为128 μs