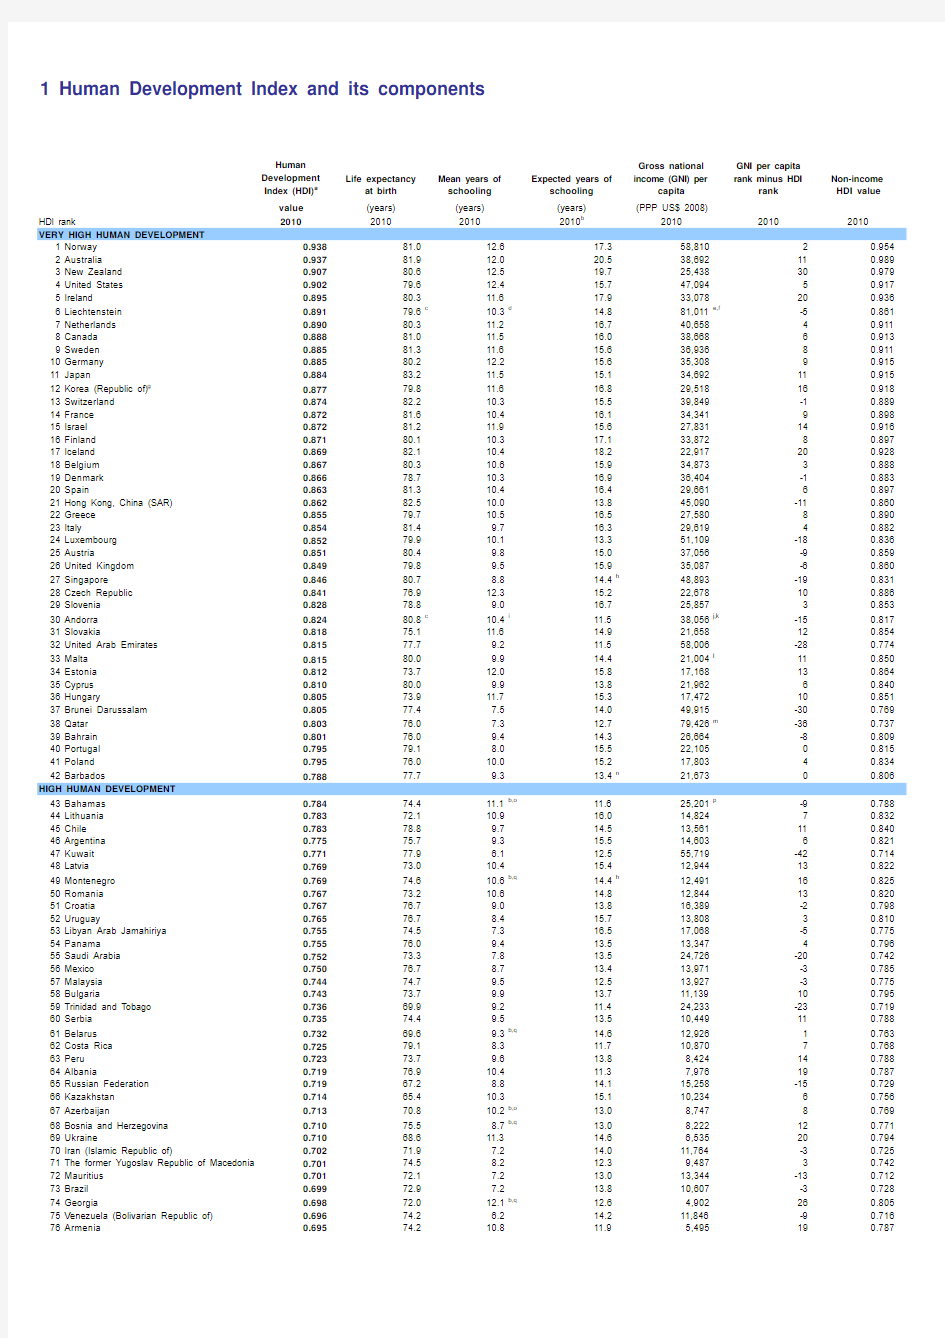
1 Human Development Index and its components
Human Development Index (HDI)a
Life expectancy
at birth
Mean years of schooling
Expected years of
schooling
Gross national income (GNI) per
capita GNI per capita rank minus HDI
rank
Non-income HDI value
value
(years)(years)(years)(PPP US$ 2008)
HDI rank
2010
2010
2010
2010b
2010
2010
2010
1Norway 0.93881.012.617.358,81020.9542Australia 0.93781.912.020.538,692110.9893New Zealand 0.90780.612.519.725,438300.9794United States 0.90279.612.415.747,09450.9175Ireland 0.89580.311.617.933,078200.9366Liechtenstein 0.89179.6c
10.3d
14.881,011e,f
-50.8617Netherlands 0.89080.311.216.740,65840.9118Canada 0.88881.011.516.038,66860.9139Sweden 0.88581.311.615.636,93680.91110Germany 0.88580.212.215.635,30890.91511Japan
0.88483.211.515.134,692110.91512Korea (Republic of)g 0.87779.811.616.829,518160.91813Switzerland 0.87482.210.315.539,849-10.88914France 0.87281.610.416.134,34190.89815Israel 0.87281.211.915.627,831140.91616Finland 0.87180.110.317.133,87280.89717Iceland 0.86982.110.418.222,917200.92818Belgium 0.86780.310.615.934,87330.88819Denmark 0.86678.710.316.936,404-10.88320Spain
0.86381.310.416.429,66160.89721Hong Kong, China (SAR)0.86282.510.013.845,090-110.86022Greece 0.85579.710.516.527,58080.89023Italy
0.85481.49.716.329,61940.88224Luxembourg 0.85279.910.113.351,109-180.83625Austria
0.85180.49.815.037,056-90.85926
United Kingdom
0.84979.89.515.935,087-60.86027Singapore
0.84680.78.814.4h
48,893-190.83128Czech Republic 0.84176.912.315.222,678100.88629Slovenia
0.82878.89.016.725,85730.85330Andorra 0.82480.8c 10.4i 11.538,056j,k -150.81731Slovakia
0.81875.111.614.921,658120.85432United Arab Emirates 0.81577.79.211.558,006-280.77433Malta 0.81580.09.914.421,004l
110.85034Estonia 0.81273.712.015.817,168130.86435Cyprus 0.81080.09.913.821,96260.84036Hungary
0.80573.911.715.317,472100.85137Brunei Darussalam 0.80577.47.514.049,915-300.76938Qatar 0.80376.07.312.779,426m
-360.73739Bahrain 0.80176.09.414.326,664-80.80940Portugal 0.79579.18.015.522,10500.81541
Poland
0.79576.010.015.217,80340.83442Barbados
0.78877.79.313.4n 21,67300.80643Bahamas 0.78474.411.1b,o 11.625,201p -90.78844Lithuania 0.78372.110.916.014,82470.83245Chile 0.78378.89.714.513,561110.84046Argentina 0.77575.79.315.514,60360.82147Kuwait 0.77177.9 6.112.555,719-420.71448Latvia
0.76973.010.415.412,944130.82249Montenegro 0.76974.610.6b,q
14.4h 12,491160.82550Romania 0.76773.210.614.812,844130.82051Croatia 0.76776.79.013.816,389-20.79852Uruguay
0.76576.78.415.713,80830.81053Libyan Arab Jamahiriya 0.75574.57.316.517,068-50.77554Panama 0.75576.09.413.513,34740.79655Saudi Arabia 0.75273.37.813.524,726-200.74256Mexico 0.75076.78.713.413,971-30.78557Malaysia 0.74474.79.512.513,927-30.77558Bulgaria
0.74373.79.913.711,139100.79559Trinidad and Tobago 0.73669.99.211.424,233-230.71960Serbia
0.73574.49.513.510,449110.78861Belarus 0.73269.69.3b,q
14.612,92610.76362Costa Rica 0.72579.18.311.710,87070.76863Peru 0.72373.79.613.88,424140.78864Albania
0.71976.910.411.37,976190.78765Russian Federation 0.71967.28.814.115,258-150.72966Kazakhstan
0.71465.410.315.110,23460.75667Azerbaijan
0.71370.810.2b,o 13.08,74780.76968Bosnia and Herzegovina 0.71075.58.7b,q
13.08,222120.77169Ukraine
0.71068.611.314.66,535200.79470Iran (Islamic Republic of)
0.70271.97.214.011,764-30.72571The former Yugoslav Republic of Macedonia 0.70174.58.212.39,48730.74272Mauritius 0.70172.17.213.013,344-130.71273
Brazil
0.69972.97.213.810,607-30.72874Georgia
0.69872.012.1b,q
12.64,902260.80575Venezuela (Bolivarian Republic of)0.69674.2 6.214.211,846-90.71676Armenia
0.695
74.2
10.8
11.9
5,495
19
0.787
VERY HIGH HUMAN DEVELOPMENT
HIGH HUMAN DEVELOPMENT
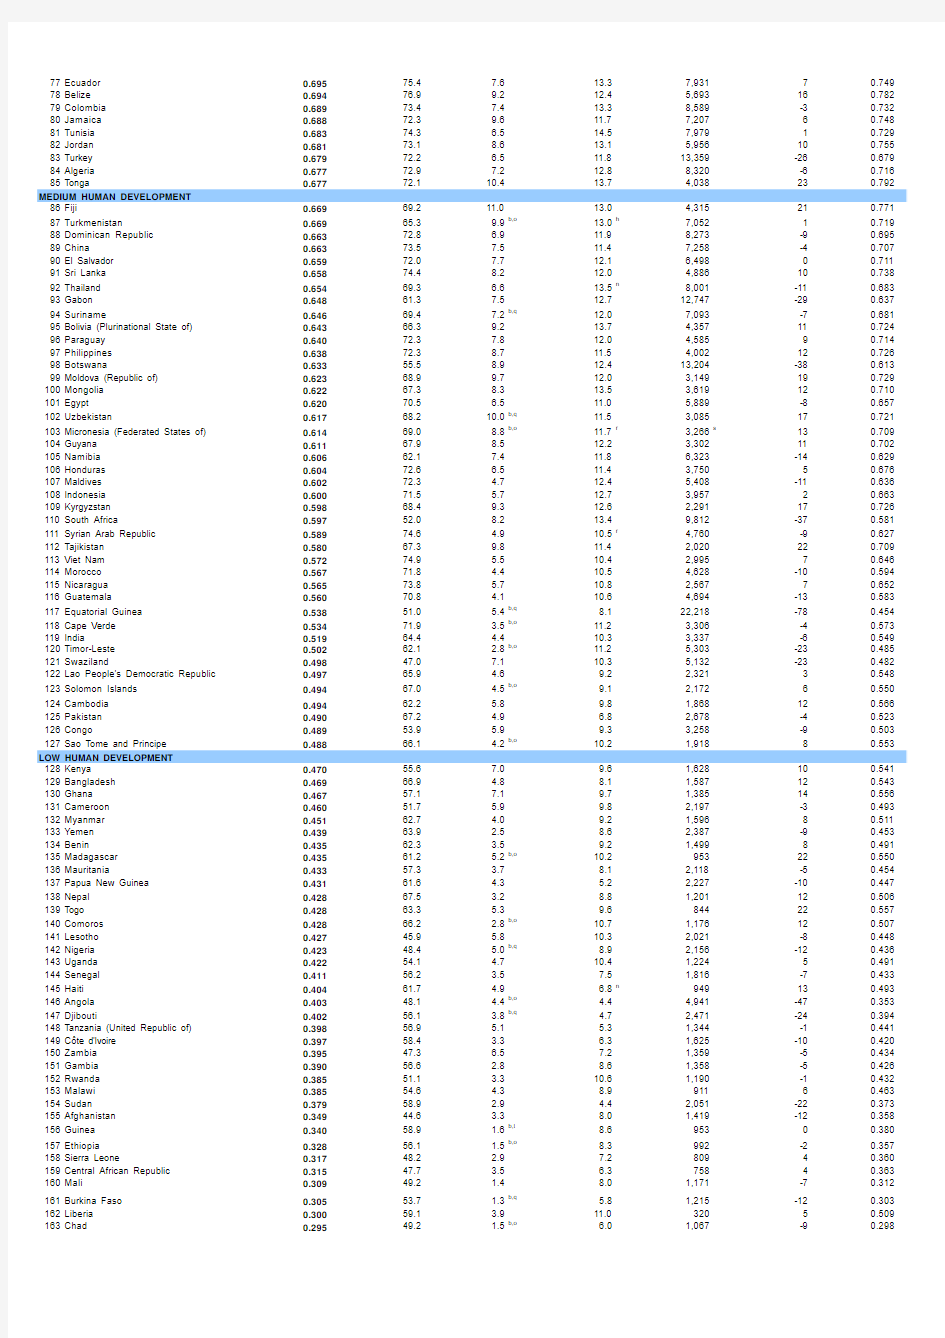
77Ecuador0.69575.47.613.37,93170.749 78Belize0.69476.99.212.45,693160.782 79Colombia0.68973.47.413.38,589-30.732 80Jamaica0.68872.39.611.77,20760.748 81Tunisia0.68374.3 6.514.57,97910.729 82Jordan0.68173.18.613.15,956100.755 83Turkey0.67972.2 6.511.813,359-260.679 84Algeria0.67772.97.212.88,320-60.716 85Tonga0.67772.110.413.74,038230.792 MEDIUM HUMAN DEVELOPMENT
86Fiji0.66969.211.013.04,315210.771 87Turkmenistan0.66965.39.9b,o13.0h7,05210.719 88Dominican Republic0.66372.8 6.911.98,273-90.695 89China0.66373.57.511.47,258-40.707 90El Salvador0.65972.07.712.16,49800.711 91Sri Lanka0.65874.48.212.04,886100.738 92Thailand0.65469.3 6.613.5n8,001-110.683 93Gabon0.64861.37.512.712,747-290.637 94Suriname0.64669.47.2b,q12.07,093-70.681 95Bolivia (Plurinational State of)0.64366.39.213.74,357110.724 96Paraguay0.64072.37.812.04,58590.714 97Philippines0.63872.38.711.54,002120.726 98Botswana0.63355.58.912.413,204-380.613 99Moldova (Republic of)0.62368.99.712.03,149190.729 100Mongolia0.62267.38.313.53,619120.710 101Egypt0.62070.5 6.511.05,889-80.657 102Uzbekistan0.61768.210.0b,q11.53,085170.721 103Micronesia (Federated States of)0.61469.08.8b,o11.7r3,266s130.709 104Guyana0.61167.98.512.23,302110.702 105Namibia0.60662.17.411.86,323-140.629 106Honduras0.60472.6 6.511.43,75050.676 107Maldives0.60272.3 4.712.45,408-110.636 108Indonesia0.60071.5 5.712.73,95720.663 109Kyrgyzstan0.59868.49.312.62,291170.726 110South Africa0.59752.08.213.49,812-370.581 111Syrian Arab Republic0.58974.6 4.910.5r4,760-90.627 112Tajikistan0.58067.39.811.42,020220.709 113Viet Nam0.57274.9 5.510.42,99570.646 114Morocco0.56771.8 4.410.54,628-100.594 115Nicaragua0.56573.8 5.710.82,56770.652 116Guatemala0.56070.8 4.110.64,694-130.583 117Equatorial Guinea0.53851.0 5.4b,q8.122,218-780.454 118Cape Verde0.53471.9 3.5b,o11.23,306-40.573 119India0.51964.4 4.410.33,337-60.549 120Timor-Leste0.50262.1 2.8b,o11.25,303-230.485 121Swaziland0.49847.07.110.35,132-230.482 122Lao People's Democratic Republic0.49765.9 4.69.22,32130.548 123Solomon Islands0.49467.0 4.5b,o9.12,17260.550
124Cambodia0.49462.2 5.89.81,868120.566 125Pakistan0.49067.2 4.9 6.82,678-40.523 126Congo0.48953.9 5.99.33,258-90.503 127Sao Tome and Principe0.48866.1 4.2b,o10.21,91880.553 LOW HUMAN DEVELOPMENT
128Kenya0.47055.67.09.61,628100.541 129Bangladesh0.46966.9 4.88.11,587120.543 130Ghana0.46757.17.19.71,385140.556 131Cameroon0.46051.7 5.99.82,197-30.493 132Myanmar0.45162.7 4.09.21,59680.511 133Yemen0.43963.9 2.58.62,387-90.453 134Benin0.43562.3 3.59.21,49980.491 135Madagascar0.43561.2 5.2b,o10.2953220.550 136Mauritania0.43357.3 3.78.12,118-50.454 137Papua New Guinea0.43161.6 4.3 5.22,227-100.447 138Nepal0.42867.5 3.28.81,201120.506 139Togo0.42863.3 5.39.6844220.557 140Comoros0.42866.2 2.8b,o10.71,176120.507 141Lesotho0.42745.9 5.810.32,021-80.448 142Nigeria0.42348.4 5.0b,q8.92,156-120.436 143Uganda0.42254.1 4.710.41,22450.491 144Senegal0.41156.2 3.57.51,816-70.433 145Haiti0.40461.7 4.9 6.8n949130.493 146Angola0.40348.1 4.4b,o 4.44,941-470.353 147Djibouti0.40256.1 3.8b,q 4.72,471-240.394 148Tanzania (United Republic of)0.39856.9 5.1 5.31,344-10.441 149C?te d'Ivoire0.39758.4 3.3 6.31,625-100.420 150Zambia0.39547.3 6.57.21,359-50.434 151Gambia0.39056.6 2.88.61,358-50.426 152Rwanda0.38551.1 3.310.61,190-10.432 153Malawi0.38554.6 4.38.991160.463 154Sudan0.37958.9 2.9 4.42,051-220.373 155Afghanistan0.34944.6 3.38.01,419-120.358 156Guinea0.34058.9 1.6b,t8.695300.380
157Ethiopia0.32856.1 1.5b,o8.3992-20.357 158Sierra Leone0.31748.2 2.97.280940.360 159Central African Republic0.31547.7 3.5 6.375840.363 160Mali0.30949.2 1.48.01,171-70.312 161Burkina Faso0.30553.7 1.3b,q 5.81,215-120.303 162Liberia0.30059.1 3.911.032050.509 163Chad0.29549.2 1.5b,o 6.01,067-90.298
164Guinea-Bissau0.28948.6 2.3b,q9.153810.362 165Mozambique0.28448.4 1.28.2854-50.300 166Burundi0.28251.4 2.79.640200.400 167Niger0.26152.5 1.4 4.3675-30.285 168Congo (Democratic Republic of the)0.23948.0 3.87.829100.390 169Zimbabwe0.14047.07.29.217600.472 OTHER COUNTRIES OR TERRITORIES
Antigua and Barbuda........17,924....
Bhutan..66.8..11.35,607....
Cuba..79.010.217.7....0.892 Dominica......12.58,549....
Eritrea..60.4.. 5.5643....
Grenada..75.8..13.47,998....
Iraq..68.5 5.69.7....0.600 Kiribati......12.33,715....
Korea (Democratic People's Rep. of)..67.7..........
Lebanon..72.4..13.513,475....
Marshall Islands....9.8b,o13.0....0.766 Monaco..............
Nauru......8.5......
Occupied Palestinian Territories..73.9..13.1......
Oman..76.1..11.125,653....
Palau....12.1b,o14.9..0.836 Saint Kitts and Nevis......12.314,196....
Saint Lucia..74.2..13.08,652....
Saint Vincent and the Grenadines..72.0..13.58,535....
Samoa..72.2..12.24,126....
San Marino..............
Seychelles......14.719,128....
Somalia..50.4.. 1.8r......
Tuvalu......11.2......
Vanuatu..70.8..10.43,908....
Developed
OECD0.87980.311.415.937,077—0.904 Non-OECD0.84480.010.013.942,370—0.845 Developing
Arab States0.58869.1 5.710.87,861—0.610 East Asia and the Pacific0.64372.67.211.56,403—0.692 Europe and Central Asia0.70269.59.213.611,462—0.740 Latin America and the Caribbean0.70474.07.913.710,642—0.746 South Asia0.51665.1 4.610.03,417—0.551 Sub-Saharan Africa0.38952.7 4.59.02,050—0.436
Very high human development0.87880.311.315.937,225—0.902 High human development0.71772.68.313.812,286—0.749 Medium human development0.59269.3 6.311.05,134—0.634 Low human development0.39356.0 4.18.21,490—0.445
Least developed countries0.38657.7 3.78.01,393—0.441
World0.62469.37.412.310,631—0.663
Notes
a. Refer to Technical Note 1 for details on how the HDI is calculated.
b. Refers to an earlier year than that specified.
c. To calculate the HDI, unpublished estimates from UNDESA (2009d) were use
d. The data are not
published because the population is below 100, 000.
d. Assumes the same adult mean years of schooling as Switzerland.
e. Based on the growth rate of GDP per capita in PPP US$ for Switzerland from IMF (2010a).
f. Based on data on GDP from the United Nations Statistics Divison's [National Accounts: Main Aggregates Database] data on population from UNDESA (2009d) and the PPP exchange rate for
Switzerland from World Bank (2010g).
g. In keeping with common usage, the Republic of Korea is referred to as South Korea in the body of this Report.
h. Based on cross-country regression.
i. Assumes the same adult mean years of schooling as Spain.
j. Based on the growth rate of GDP per capita in PPP US$ for Spain from IMF (2010a).
k. Based on data on GDP from the United Nations Statistics Divison's [National Accounts: Main Aggregates Database] data on population from UNDESA (2009d) and the PPP exchange rate for Spain from World Bank (2010g).
l. 2007 prices.
m. Based on the ratio of GNI in US$ to GDP in US$ from World Bank (2010g).
n. UNESCO Institute for Statistics (2009).
o. Based on data on years of schooling of adults from household survey in the World Bank's International Income Distribution Database.
p. Based on implied PPP conversion factors from IMF(2010a), data on GDP per capita in local currency unit and the ratio between GNI and GDP in US$ from World Bank (2010c).
q. Based on data from United Nations Children's Fund Multiple Indicator Cluster Surveys.
r. Refers to primary and secondary education only from UNESCO Institute for Statistics (2010a).
s. Based on the growth rate of GDP per capita in PPP US$ for Fiji from IMF (2010a).
t. Based on data from U.S. Agency for International Development Demographic and Health Surveys.
Sources
Column 1: Calculated based on data from UNDESA (2009d), Barro and Lee (2010), UNESCO Institute for Statistics (2010a), World Bank (2010g) and IMF(2010a).
Column 2: UNDESA (2009d).
Column 3: Barro and Lee(2010).
Column 4: UNESCO Institute for Statistics (2010a).
Column 5: Expressed in 2008 prices, based on data on GNI per capita and GDP per capita in PPP US$ (current and constant prices) from World Bank (2010g) and implied
growth rates of GDP per capita from IMF (2010a).
Column 6: Calculated based on GNI per capita rank and HDI rank.
Column 7: Calculated based on data in columns 2-4.