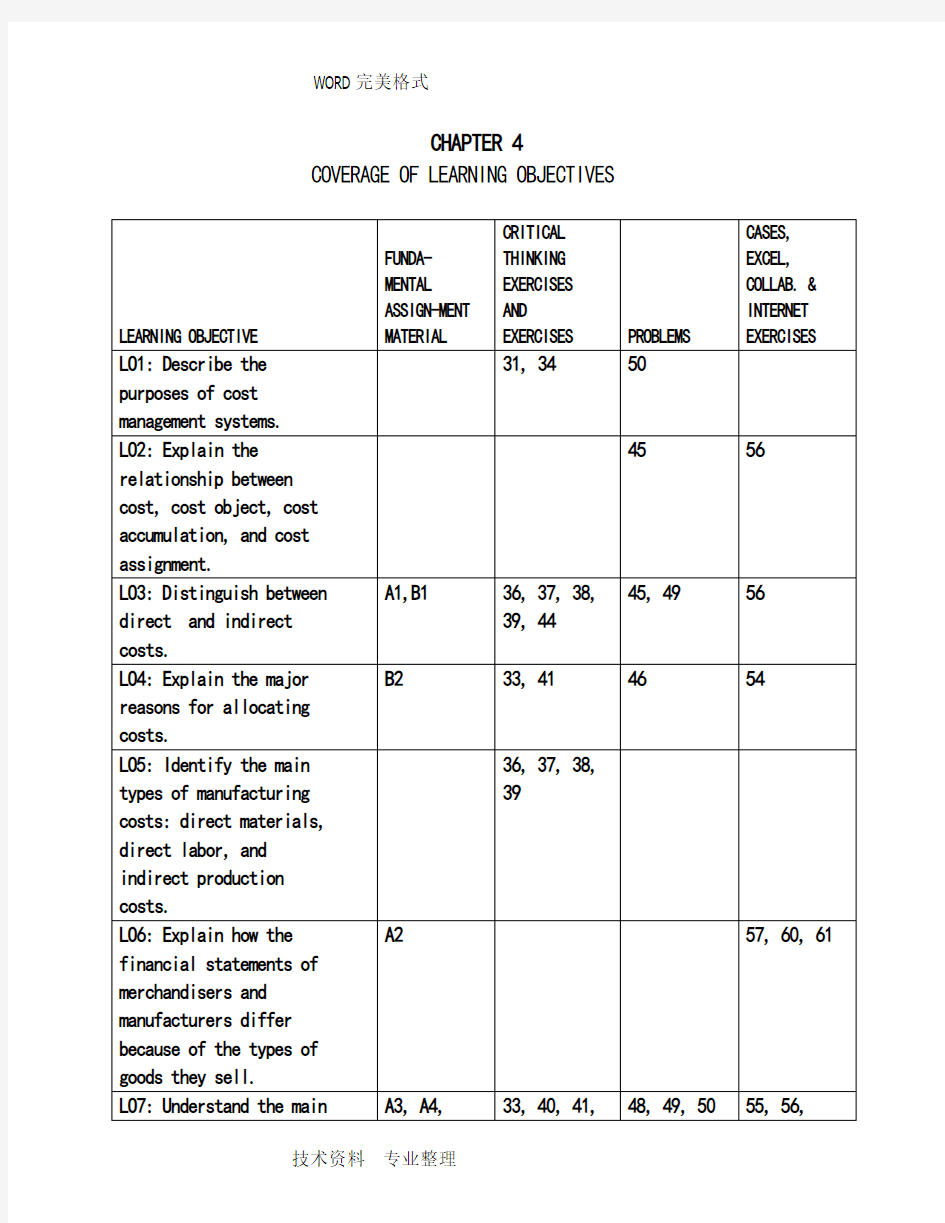

CHAPTER 4 COVERAGE OF LEARNING OBJECTIVES
CHAPTER 4
Cost Management Systems and Activity-Based Costing
4-A1 (20-30 min.)
See Table 4-A1 on the following page.
4-A2 (25-30 min.)
1. Merchandise Inventories, 1,000 devices @ $97 $97,000
2. Direct materials inventory $ 40,000
Work-in-process inventory 0 Finished goods inventory 97,000 Total inventories $137,000 3.
NILE ELECTRONICS PRODUCTS
Statement of Operating Income
For the Year Ended December 31, 20X9
Sales (9,000 units at $170) $1,530,000 Cost of goods sold:
Beginning inventory $ 0
Purchases 970,000
Cost of goods available for sale $ 970,000
Less ending inventory 97,000
Cost of goods sold (an expense) 873,000 Gross margin or gross profit $ 657,000 Less other expenses: selling & administrative costs 185,000 Operating income (also income before taxes
in this example) $ 472,000
TABLE 4-A1
STATEMENT OF OPERATING INCOME OPERATING INCOME BY PRODUCT LINE
EXTERNAL REPORTING PURPOSE INTERNAL STRATEGIC DECISION MAKING PURPOSE
Custom Large Small
Detailed Std. Std. Cost Type, Assignment Method Sales $155,000 $30,000 $45,000 $80,000
Cost of goods sold:
Direct material 40,000 5,000 15,000 20,000 Direct, Direct Trace
Indirect manufacturing 41,000 28,0001 5,000 8,000 Indirect, Alloc. – Mach. Hours
81,000 33,000 20,000 28,000
Gross profit 74,000 (3,000) 25,000 52,000
Selling and administrative expenses:
Commissions 15,000 1,500 3,500 10,000 Direct, Direct Trace Distribution to warehouses 10,400 1,0002 3,000 6,400 Indirect, Allocation - Weight Total selling and admin. expenses 25,400 2,500 6,500 16,400
Contribution to corporate expenses
and profit 48,600 $(5,500) $18,500 $35,600
Unallocated expenses:
Administrative salaries 8,000
Other administrative expenses 4,000
Total unallocated expenses 12,000
Operating income before tax $ 36,600
1 Total machine hours is 1,400 + 250 + 400 = 2,050. Indirect manufacturing cost per machine hour is then $41,000 ÷ 2,050 = $20. The al location to custom detailed is $20 × 1,400 machine hours = $28,000.
2 Total weight shipped is 25,000 kg + 75,000 kg + 160,000 kg = 260,000 kg. Indirect distribution costs per kilogram is then $10,400 ÷ 260,000 kg = $0.04. The allocation to custom detailed is $0.04 × 25,000 kg = $1,000.
技术资料专业整理
4. ORINOCO, INC.
Statement of Operating Income
For the Year Ended December 31, 20X9
Sales (9,000 units at $170)
$1,530,000
Cost of goods manufactured and sold:
Beginning finished goods inventory $ 0
Cost of goods manufactured:
Beginning WIP inventory $ 0
Direct materials used 530,000
Direct labor 290,000
Indirect manufacturing 150,000
Total mfg. costs to account for $970,000
Less ending work-in-
process inventory 0 970,000
Cost of goods available for sale $970,000
Less ending finished goods inventory 97,000
Cost of goods sold (an expense) 873,000
Gross margin or gross profit $ 657,000 Less other expenses: selling and administrative costs 185,000
Operating income (also income before taxes
in this example) $ 472,000
5. The balance sheet for the merchandiser (Nile) has just one line for
inventories, the ending inventory of the items purchased for resale.
The balance sheet for the manufacturer (Orinoco) has three items:
direct materials inventory, work-in-process inventory, and finished
goods inventory.
The income statements are similar except for the computation of cost of goods available for sale. The merchandiser (Nile) simply shows
purchases for the year plus beginning inventory. In contrast, the
manufacturer (Orinoco) shows beginning work-in-process inventory plus
the three categories of cost that comprise manufacturing cost (direct
materials used, direct labor, and factory (or manufacturing) overhead)
and then deducts the ending work-in-process inventory. The manufacturer then adds the beginning finished goods inventory to this cost of goods
manufactured to get the cost of goods available for sale.
6. The purpose is providing aggregate measures of inventory value and cost
of goods manufactured for external reporting to investors, creditors,
and other external stakeholders.
4-A3 (10-15 min.)
There can be many justifiable answers for each item other than the
listed cost driver and behavior. The purpose of this exercise is to
generate an active discussion regarding those chosen by First Bank’s
managers. One point that should be emphasized is that many times
managers choose cost drivers that are not the most plausible or reliable because of lack of data availability. Cost drivers are also used as a
basis to allocate activity and resource costs and so the availability of data is often an important consideration.
Activity
Or Cost
Resource Cost Driver Behavior
a.* R Number of square feet F
b.** R Number of person hours F
c. R Number of computer transactions V
d. A Number of schedules
e. R Number of person hours F
f. R Number of loan inquiries V
g.*** A Number of investments
h. A Number of applications
i. R Number of person hours V
j. R Number of minutes V
k. R Number of person hours F
l. A Number of loans
* An argument can be made that maintenance of the building is an activity.
If this was the case, resources such as supplies and labor would be resources consumed, and several resource cost drivers would be needed. In addition, a separate resource and associated cost driver would be needed for insurance costs. However, the company had a contract for maintenance (fixed price), so this was a fixed-cost resource that was added to other occupancy costs such as insurance. The cost driver chosen for all these occupancy costs was square feet occupied by the various departments.
** Normally, the cost driver used for any labor resource is person hours.
It is assumed that the staff person hours used are regular hours rather than overtime or temporary labor hours. Thus, the cost is fixed with respect to changes in hours used. As the hours used increases (decreases) the
utilization of the resources increases (decreases) and eventually, management will need to make a decision whether to expand capacity (or whether to cut
back on labor). This is an example of a step cost that is fixed over wide
ranges of cost-driver level.
*** Students may try to determine the cost behavior of activities even though
the problem requirements do not ask for it. Point out that activities almost
always have mixed cost behavior because they consume various resources. Some
of these are fixed-cost and others variable-cost resources. For example, the
activity “research to evaluate a loan application” consumes such fixed-cost
resources as manager labor time and computers (assumed owned by the bank).
This activity also consumes variable-cost resources such as telecommunications
time and external computing services.
4-A4 (20-30 min.)
1. The first step is to determine the cost per cost-driver unit for each
activity:
Monthly Cost- Cost per
Manufacturing Driver Driver
Activity [Cost driver] Overhead Activity Unit
Material Handling [Direct materials cost] $12,000 $200,000
$ 0.06
Engineering [Engineering change notices] 20,000 20 1,000.00
Power [Kilowatt hours] 16,000 400,000 0.04
Total Manufacturing Overhead $48,000
Next, the costs of each activity can be allocated to each of the three
products:
PHYSICAL FLOW / ALLOCATED COST
Cost Senior Basic Deluxe
Material Handling$.06 × 25,000 = $1,500$.06 × 50,000 = $ 3,000$.06 × 125,000 = $ 7,5 Engineering $1,000 × 13 = 13,000$1,000 × 5 = 5,000$1,000 × 2 = 2,000
Power $.04 × 50,000 = 2,000$.04 × 200,000 = 8,000$.04 × 150,000 = 6,000 Total $16,500 $16,000 $15,500
2. Overhead rate based on direct labor costs:
Rate = Total manufacturing overhead ÷ Total direct labor cost
= $48,000 ÷ $8,000 = $6.00/DL$
Overhead allocated to each product is:
Senior: $6.00 × 4,000 = $24,000
Basic: $6.00 × 1,000 = 6,000
Deluxe: $6.00 × 3,000 = 18,000
Total $48,000
Notice that much less manufacturing overhead cost is allocated to Basic using direct labor as a cost driver. Why? Because Basic uses only a
small amount of labor but large amounts of other resources, especially power.
3. The product costs in requirement 1 are more accurate if the cost
drivers are good indicators of the causes of the costs -- they are both plausible and reliable. For example, kilowatt hours is certainly a
better measure of the cost of power costs than is direct labor hours.
Therefore, the allocation of power costs in requirement 1 is certainly better than in requirement 2. Materials handling and engineering are
likewise more plausible. A manager would be much more confident in the manufacturing overhead allocated to products in requirement 1.
Remember, however, that there are incremental costs of data collection associated with the more accurate ABC system. The benefit/cost
criteria must be applied in deciding which costing system is “best.”
4-B1 (20-30 min.)
See Table 4-B1 on the following page.
4-B2 (25-30 min.)
1. $1,080,000 ÷ 45,000 hours = $24 per direct-labor hour
2. (a) $585,000 ÷ 15,000 hours = $39 per direct-labor hour
(b) $495,000 ÷ 30,000 hours = $16.50 per direct-labor hour
3. (a) $585,000 ÷ 97,500 hours = $6 per machine hour
(b) $495,000 ÷ 30,000 hours = $16.50 per direct-labor hour
4. (a) $24 × (1.0 + 14.0) = $360.00
$24 × (1.5 + 3.0) = $108.00
$24 × (1.3 + 8.0) = $223.20
(b) ($39 × 1.0) + ($16.50 × 14.0) = $39.00 + $231.00 = $270.00
($39 × 1.5) + ($16.50 × 3.0) = $58.50 + $ 49.50 = $108.00
($39 × 1.3) + ($16.50 × 8.0) = $50.70 + $132.00 = $182.70
(c) ($6 × 12.0) + ($16.50 × 14.0) = $ 72.00 + $231.00 = $303.00
($6 × 17.0) + ($16.50 × 3.0) = $102.00 + $ 49.50 = $151.50
($6 × 14.0) + ($16.50 × 8.0) = $ 84.00 + $132.00 = $216.00
(d) First consider using departmental instead of firm-wide rates (part
b vs. part a). Departmental rates that use direct-labor hours as
the base decrease the cost applied to units of A and C and leave B unaffected. Other products that use relatively less assembly time will increase in cost. Now examine changing to a base of machine hours in machining (part c vs. part a). Product B is the only one with an increase in cost in (c) compared to (a). Why? Because B's uses only 16% of the direct labor hours used for A, B, and C, so it is is allocated only 16% of the costs allocated on the basis of
direct labor hours. But it uses 40% of the machine hours, and
there is allocated 40% of costs that are allocated on the basis on machine hours. Therefore, it receives relatively more costs with a base of machine hours than with a base of direct-labor hours.
TABLE 4-B1
STATEMENT OF OPERATING INCOME OPERATING INCOME BY PRODUCT LINE
Thousands of Dollars Lawn Hand
Scooter Mower Tool Cost Type,
Parts Parts Parts Assignment Method Sales $990 $350 $380 $260
Cost of goods sold:
Direct material 400 175 125 100 Direct, Direct Trace Indirect manufacturing 94 68 1 14 12 Indirect – Mach.Hrs
494 243 139 112
Gross profit 496 107 241 148
Selling and administrative expenses:
Commissions 55 25 20 10 Direct, Direct Trace Distribution to warehouses 150 20 2 80 50 Indirect - Weight Total selling and administrative expenses 205 45 100 60
Contribution to corporate expenses and profit 291 $ 62 $141 $ 88
Unallocated expenses:
Corporate salaries 11
Other general expenses 17
Total unallocated expenses 28
Operating income before tax $263
1 Total machine hours is 8,500 + 1,750 + 1,500 = 11,750. Indirect manufacturing cost per machine hour is
then $94,000 ÷ 11,750 = $8. The allocation to scooter parts is $8 × 8,500 machine hours = $68,000.
2 Total weight shipped is 100,000 kg + 400,000 kg + 250,000 kg = 750,000 kg. Indirect distribution costs per
kilogram is then $150,000 ÷ 750,000 kg = $0.20. The allocation to scooter parts is $0.20 × 100,000 kg = $20,000.
技术资料专业整理
4-B3 (30-35 min.)
1.The existing system allocates all costs based on direct labor cost. The rate for allocating indirect production costs is:
Estimated indirect production cost ÷ Estimated direct labor cost
= ¥24,500,000 ÷ ¥35,000,000 = 70%
That is, each time ¥1 is spent on direct labor, Watanabe adds ¥0.7 of indirect production cost to the cost of the product.
2. Under an ABC system, Watanabe would allocate indirect production costs separately for each activity. This would result in the following four allocation rates:
Receiving: Receiving co sts ÷ Direct material cost
=¥4,800,000 ÷ 60,000,000 = ¥0.08 per ¥1of dir. mat. Assembly: Assembly costs ÷ Number of control units
=¥13,800,000 ÷ 92,000 = ¥150 per control unit
Qual. Control: Quality control cost ÷ QC hours
=¥1,800,000 ÷ 600 = ¥3,000 per QC hour
Shipping: Shipping cost ÷ # of boxes shipped
=¥4,100,000 ÷ 8,200 = ¥500 per box shipped
3. (a) The cost will contain 3 components (in thousands of yen):
Direct material ¥ 8,000
Direct labor 2,000
Indirect production cost (¥2,000 × .7 = 1,400) 1,400
Total cost ¥11,400
Price (¥11,400 × 1.3)¥14,820
(b) The cost will have 7 components, 4 of them allocating indirect production costs (totals in thousands of yen):
Direct materials ¥ 8,000
Direct labor 2,000
Receiving (¥0.08 × 8,000)¥640
Assembly (¥150 × 5,000)750
Quality control (¥3,000 × 50)150
Shipping (¥500 × 600) 300
Total indirect production cost 1,840
Total cost ¥11,840 Price (11 ,840 × 1.3)¥15,392
4. The order from Nissan requires a relatively large amount of receiving, quality control, and shipping resources compared to the relative amount of labor required. This makes its indirect production costs are relatively expensive relative to the labor required. The following illustrates why an allocation on the basis of labor cost results in less costs than allocations based on the four activities:
Budgeted Cost- Nissan Cost- Nissan
Activity Allocation Base Allocation Base Percentage Direct materials 60,000,000 8,000,000 13.3%
Direct labor 35,000,000 2,000,000 5.7 Receiving 60,000,000 8,000,000 13.3 Assembly 92,000 5,000 5.4 Quality control 600 50 8.3 Shipping 8,200 600 7.3
Using the single direct-labor cost-allocation base, this order would receive 5.7% of all indirect production costs. The main reason that indirect production costs for this order under the ABC system are relatively high is the large relative cost of materials that drives a large allocation (13.3%) of receiving costs to this order. The allocations of both quality control and shipping costs are slightly larger that they would be using a direct-labor cost-allocation base, while the allocation of assembly costs is slightly smaller.
4-B4 (50-60 min.)
1. A summary of the analyses follows.
Pen Cell-Phone
Casings Casings Company
Base Gross Profit Percentage* 1.25% 38.75% 8.07% Plan Gross Profit Percentage** 10.80% 37.20% 17.40% Support of Product Manager? Strong None
Support of President? Moderate
* See Exhibit 4-6 on p. 136 of the text.
** See Panel B of Exhibit 4-B4 that follows.
Exhibit 4-B4, Panels A and B on the following pages can be used to explain the impact of the controller’s idea using the process map of the traditional costing system and the related financial reports. Notice that the $80,000 annual decrease in the cost of engineers needs to be converted to a $20,000 quarterly savings. The controller’s idea will result in an increase of 9.55%
in the gross profit of the pen-casings line but a decrease of 1.55% in the
cell-phone line. The product manager of pen casings would probably give strong support to the idea but the cell-phone casings manager would most likely not support the idea.
Although the company-level gross profit margin improves, the president’s support may not be strong. Why? There is not a strong consensus among product-line managers. Top management is normally hesitant to support actions that do not have the unanimous support among product-line managers unless there is solid evidence of material improvement in profitability. While the current loss would be reversed, the return on sales is still nominal at 3,500 ÷ $480,000 = .73%.
Exhibit 4-B4: Panel A
Process Map of Traditional Cost System
[Direct Labor Hours = 4,500 +
Exhibit 4-B4: Panel B
PRO-FORMA FINANCIAL REPORTS:
TRADITIONAL COST ALLOCATION SYSTEM
STATEMENT OF OPERTING INCOME CONTRIBUTION TO CORPORATE COSTS
AND PROFIT [EXTERNAL REPORTING PURPOSE] [INTERNAL STRATEGIC DECISION MAKING
AND OPERATIONAL-CONTROL PURPOSE]
Pen Casings Cell Phone Casings
Sales $480,000 $360,000 $120,000 1 Cost of goods sold:
Direct material 46,500 22,500 24,000 2 Direct labor 150,000 135,000 15,000
Indirect manufacturing 200,000 163,636 3 36,364 4 Cost of goods sold 396,500 321,136 75,364 Gross profit 83,500 $ 38,864 $ 44,636 Corporate expenses (unallocated) 80,000
Operating income $ 3,500
Gross profit margin 17.40% 10.80% 37.20%
1. $80,000 × .75 × 2
2. $12,000 × 2
3. $200,000 × [4,500/(4,500 + 1,000)]
4. $200,000 × [1,000/(4,500 + 1,000)]
5. $83,500/$480,000
技术资料专业整理
Perhaps the most important factor bearing on the president’s support is lack of confidence in the accuracy of the cost and hence gross margin figures. She probably will inquire whether the shift in the consumption percentages by the two activities is captured by the traditional costing system. Does the change in allocation rates from 90:10 to 82:18 based on direct labor hour changes accurately capture the impact of the operational changes? An informal analysis of the controller’s idea might look like the following table.
Based on the informal analysis, the President probably would expect the profitability of cell-phone casings to improve and the profitability of pen casings to be unaffected. This disagrees with the numerical analysis. Given the propensity of managers to embrace numerical results, less weight will likely be given this analysis compared to the “objective” numbers. As a result, she may question the validity of the numerical analysis as well as the value of the traditional costing system!
Finally, the focus of improvement efforts should be directly on the pen-casing product line. This initiative deals mostly with the cell-phone line. What can be done to improve profitability of the pen casings? Can prices be raised without losing too much volume? Can operational improvements be made to lower the indirect manufacturing costs? The controller’s idea is worthy of some support but it does not address the profitability issue head on.
2. Exhibit 4-B4, Panel C on the following page is a process map that can be used to explain the impact of the controller’s idea. Panel D at the end of the solution provides a detailed evaluation of the controller’s idea.
Pen Cell-Phone
Casings Casings Company Base Gross Profit Percentage* 16.22% (28.63%) 8.07% Plan Gross Profit Percentage** 17.26% 17.81% 17.40% Support of Product Manager? Neutral Strong
Support of President? Strong
* See the table on p. 139 of the text.
** See panel D of Exhibit 4-B4 that follows.
The controller’s idea will result in a slight increase in the gross profit of the pen-casings line but a dramatic turnaround in the profitability of the
cell-phone line. The product manager of pen casings would probably be neutral or slightly positive about the idea because the idea does not focus on operational improvements that directly affect the pen-casings line. The cell-phone casings manager would give strong support to the idea – this may save his/her job! The president would strongly support this idea while encouraging all managers involved to keep up the good work. Also, note that the numbers agree with the informal analysis – generating confidence in the integrity of the cost accounting system.
Exhibit 4-B4, Panel C
CHAPTER 7 COVERAGE OF LEARNING OBJECTIVES
Introduction to Budgets and Preparing the Master Budget 7-A1 (60-90 min.) 1. Exhibit I RAPIDBUY ELECTRONICS, INC. Mall of America Store Budgeted Income Statement For the Three Months Ending August 31, 20X8 Sales $300,000 Cost of goods sold (.62 × $300,000) 186,000 Gross profit $114,000 Operating expenses: Salaries, wages, commissions $60,000 Other expenses 12,000 Depreciation 1,500 Rent, taxes and other fixed expenses 33,000 106,500 Income from operations. $ 7,500 Interest expense* 1,338 Net income $ 6,162 * See schedule g for calculation of interest.
RAPIDBUY ELECTRONICS, INC. Mall of America Store Cash Budget For the Three Months Ending August 31, 20X8 June July August Beginning cash balance $ 5,800 $ 5,600 $ 5,079 Minimum cash balance desired 5,000 5,000 5,000 (a) Available cash balance $ 800 $ 600 $ 79 Cash receipts & disbursements: Collections from customers (schedule b) $ 75,200 $121,400 $ 90,800 Payments for merchandise (schedule d) (86,800) (49,600) (49,600) Fixtures (purchased in May) (11,000) - - Payments for operating expenses (schedule f) (44,600) (30,200) (30,200) (b) Net cash receipts & disbursements $(67,200) $ 41,600 $ 11,000 Excess (deficiency) of cash before financing (a + b) (66,400) 42,200 11,079 Financing: Borrowing, at beginning of period $ 67,000$ - $ - Repayment, at end of period - (41,000) (10,000) Interest, 10% per annum - (1,121)* (217)* (c) Total cash increase (decrease) from financing $ 67,000 $(42,121) $(10,217) (d) Ending cash balance (beginning balance + b + c) $ 5,600 $ 5,079 $ 5,862 * See schedule g
CHAPTER 4 COVERAGE OF LEARNING OBJECTIVES
CHAPTER 4 Cost Management Systems and Activity-Based Costing 4-A1 (20-30 min.) See Table 4-A1 on the following page. 4-A2 (25-30 min.) 1. Merchandise Inventories, 1,000 devices @ $97 $97,000 2. Direct materials inventory $ 40,000 Work-in-process inventory 0 Finished goods inventory 97,000 Total inventories $137,000 3. NILE ELECTRONICS PRODUCTS Statement of Operating Income For the Year Ended December 31, 20X9 Sales (9,000 units at $170) $1,530,000 Cost of goods sold: Beginning inventory $ 0 Purchases 970,000 Cost of goods available for sale $ 970,000 Less ending inventory 97,000 Cost of goods sold (an expense) 873,000
Gross margin or gross profit $ 657,000 Less other expenses: selling & administrative costs 185,000 Operating income (also income before taxes in this example) $ 472,000
CHAPTER 5 COVERAGE OF LEARNING OBJECTIVES
CHAPTER 5 Relevant Information for Decision Making with a Focus on Pricing Decisions 5-A1 (40-50 min.) 1. INDEPENDENCE COMPANY Contribution Income Statement For the Year Ended December 31, 2009 (in thousands of dollars) Sales $2,200 Less variable expenses Direct material $400 Direct labor 330 Variable manufacturing overhead (Schedule 1) 150 Total variable manufacturing cost of goods sold $880 Variable selling expenses 80 Variable administrative expenses 25 Total variable expenses 985 Contribution margin $ 1,215 Less fixed expenses: Fixed manufacturing overhead (Schedule 2) $345 Selling expenses 220 Administrative expenses 119 Total fixed expenses 684 Operating income $ 531
亨格瑞管理会计英文第15版练习答案07 CHAPTER 7 COVERAGE OF LEARNING OBJECTIVES CRITICAL CASES, FUNDA- THINKING EXCEL, MENTAL EXERCISES COLLAB. & ASSIGNMENT AND INTERNET LEARNING OBJECTIVE MATERIAL EXERCISES PROBLEMS EXERCISES LO1: Explain how budgets A1,B1 facilitate planning and coordination. LO2: Anticipate possible 25 40 human relations problems caused by budgets. LO3: Explain potentially 22 39, 40 dysfunctional incentives in the budget process. LO4: Explain the difficulties 23 42 49 of sales forecasting. LO5: Explain the major A1,B1 24,26 39 features and advantages of a master budget. LO6: Follow the principal A1,B1 29 40 43,45 steps in preparing a master budget. LO7: Prepare the operating A1,B1 28,29,30,31 40 43,45,46,48 budget and the supporting schedules.
CHAPTER 11 Capital Budgeting 11-A1 (15-25 min.) Answers are printed in the text at the end of the assignment material. 11-29 (10-15 min.) 1. The present value is $480,000 and the annual payments are an annuity, requiring use of Table 2: (a)$480,000 = annual payment × 11.2578 annual payment = $480,000 ÷ 11.2578 = $42,637 (b)$480,000 = annual payment × 9.4269 annual payment = $480,000 ÷ 9.4269 = $50,918 (c)$480,000 = annual payment × 8.0552 annual payment = $480,000 ÷ 8.0552 =$59,589 2. (a)$480,000 = annual payment × 8.5595 annual payment = $480,000 ÷ 8.5595 = $56,078 (b)$480,000 = annual payment × 7.6061 annual payment = $480,000 ÷ 7.6061 = $63,107 (c)$480,000 = annual payment × 6.8109 annual payment = $480,000 ÷ 6.8109 =$70,475 3. (a) Total payments= 30 × $50,918 = $1,527,540 Total interest paid= $1,527,540- $480,000 = $1,047,540 (b) Total payments= 15 × $63,107= $946,605 Total interest paid = $946,605 - $480,000 = $466,605 11-36 (10 min.) Buy. The net present value is positive. Initial outlay * $(21,000) Present value of cash operating savings, from 12-year, 12% column of Table 2, 6.1944 × $5,000 30,972 Net present value $ 9,972 * The trade-in allowance really consists of a $5,000 adjustment of the selling price and a bona fide $10,000 cash allowance for the old equipment. The relevant amount is the incremental cash outlay, $21,000. The book value is irrelevant. 11-39 (10-15 min.) Copyright ?2011 Pearson Education 1
CHAPTER 6 COVERAGE OF LEARNING OBJECTIVES
LO6: Decide A4,B5 40 57,59 whether to keep or replace equipment. 26,39,41 52,58,64 71 LO7: Identify irrelevant and misspecified costs. B6 43 60 LO8: Discuss how performance measures can affect decision making. CHAPTER 6 Relevant Information and Decision Making With a Focus on Operational Decisions 6-A1 (20 min) 1. The key to this question is what will happen to the fixed overhead costs if production of the boxes is discontinued. Assume that all $60,000 of fixed costs will continue. Then, Sunshine State will lose $20,000 by purchasing the boxes from Weyerhaeuser: Payment to Weyerhaeuser, 80,000 × $2.10$168,000 Costs saved, variable costs 148,000 Additional costs $ 20,000 2. Some subjective factors are: Might Weyerhaeuser raise prices if Sunshine State closed down its box-making facility? Will sub-contracting the box production affect the quality of the boxes? Is a timely supply of boxes assured, even if the number needed changes? Does Sunshine State sacrifice proprietary information when disclosing the box specifications to Weyerhaeuser? 3. In this case the fixed costs are relevant. However, it is not the depreciation on the old equipment that is relevant. It is
CHAPTER 7 COVERAGE OF LEARNING OBJECTIVES CHAPTER 7 Introduction to Budgets and Preparing the Master Budget 7-A1 (60-90 min.)
1. Exhibit I RAPIDBUY ELECTRONICS, INC. Mall of America Store Budgeted Income Statement For the Three Months Ending August 31, 20X8 Sales $300,000 Cost of goods sold (.62 × $300,000) 186,000 Gross profit $114,000 Operating expenses: Salaries, wages, commissions $60,000 Other expenses 12,000 Depreciation 1,500 Rent, taxes and other fixed expenses 33,000 106,500 Income from operations. $ 7,500 Interest expense* 1,338 Net income $ 6,162 * See schedule g for calculation of interest. Exhibit II RAPIDBUY ELECTRONICS, INC. Mall of America Store Cash Budget For the Three Months Ending August 31, 20X8 JuneJulyAugust Beginning cash balance $ 5,800 $ 5,600 $ 5,079 Minimum cash balance desired 5,000 5,000 5,000 (a) Available cash balance $ 800$ 600$ 79 Cash receipts & disbursements: Collections from customers (schedule b) $ 75,200 $121,400 $ 90,800 Payments for merchandise (schedule d) (86,800) (49,600) (49,600) Fixtures (purchased in May) (11,000) - - Payments for operating expenses (schedule f) (44,600) (30,200) (30,200) (b) Net cash receipts & disbursements $(67,200) $ 41,600 $ 11,000 Excess (deficiency) of cash before financing (a + b) (66,400) 42,200 11,079 Financing: Borrowing, at beginning of period $ 67,000 $ - $ - Repayment, at end of period - (41,000) (10,000) Interest, 10% per annum - (1,121)* (217)*
管理会计key terms Chapter1 1、activity-based management 作业管理 2、certified internal auditor(CIA)注册内部审计师 3、Certified management accountant(CMA)注册管理会计师 4、certified public accountant(CPA)注册会计师 5、continuous improvement 持续改进 6、controller 管理员 7、controlling 控制 8、customer value 客户价值 9、decision making决策 10、electronic business(e-business)电子商务 11、electronic commerce(e-commerce)电子商务 12、employee empowerment 员工激励 13、ethical behavior 道德行为 14、external linkages 外部联系 15、feedback反馈 16、financial accounting information system 财务会计信息系统 17、industrial value chain 产业价值链 18、internal linkages外部联系 19、internal value chain内部价值链 20、line position 直接职能 21、management accounting information system管理会计信息系统 22、performance reports 业绩报告 23、planning计划 24、postpurchase costs 售后服务成本 25、staff positon间接职能 26、strategic cost management 战略成本管理 27、strategic decision making 战略决策 28、supply chain management 供应链管理 29、total product 总产量 30、total quality management 全面质量管理 31、treasurer 财务主管 Chapter2 1、absorption-costing(full-costing)income完全成本法收益 2、activity 作业 3、activity-based costing(ABC)作业成本法 4、activity-based management(ABM)作业成本管理 5、activity-based management(ABM)accounting systerms作业成本管理会计系统
CHAPTER 3 COVERAGE OF LEARNING OBJECTIVES
CHAPTER 3 Measurement of Cost Behavior 3-A1 (20-25 min.) Some of these answers are controversial, and reasonable cases can be built for alternative classifications. Class discussion of these answers should lead to worthwhile disagreements about anticipated cost behavior with regard to alternative cost drivers. 1. (b) Discretionary fixed cost. 2. (e) Step cost. 3. (a) Purely variable cost with respect to revenue. 4. (a) Purely variable cost with respect to miles flown. 5. (d) Mixed cost with respect to miles driven. 6. (c) Committed fixed cost. 7. (b) Discretionary fixed cost. 8. (c) Committed fixed cost. 9. (a) Purely variable cost with respect to cases of 7-Up. 10. (b) Discretionary fixed cost. 11. (b) Discretionary fixed cost. 3-A2 (25-30 min.) 1. Support costs based on 60% of the cost of materials: Sign A Sign B Direct materials cost $400 $200 Support cost (60% of materials cost) $240 $120 Support costs based on $50 per power tool operation: Sign A Sign B Power tool operations 3 6 Support cost $150 $300 2. If the activity analysis is reliable, by using the current method, Evergreen Signs is predicting too much cost for signs that use few power tool operations and is predicting too little cost for signs that use many power tool operations. As a result the company could be losing jobs that require few power tool operations because its bids are too high -- it could afford to bid less on these jobs. Conversely, the company could be getting too many jobs that require many power tool operations, because its bids are too low -- given what the "true" costs will be, the company cannot afford these jobs at those prices. Either way, the sign business could be more profitable if the owner better understood and used activity analysis. Evergreen Signs would be advised to adopt the activity- analysis recommendation, but also to closely monitor costs to see if the activity- analysis predictions of support costs are accurate.
CHAPTER 3 COVERAGE OF LEARNING OBJECTIVES
CHAPTER 3 Measurement of Cost Behavior 3-A1 (20-25 min.) Some of these answers are controversial, and reasonable cases can be built for alternative classifications. Class discussion of these answers should lead to worthwhile disagreements about anticipated cost behavior with regard to alternative cost drivers. 1. (b) Discretionary fixed cost. 2. (e) Step cost. 3. (a) Purely variable cost with respect to revenue. 4. (a) Purely variable cost with respect to miles flown. 5. (d) Mixed cost with respect to miles driven. 6. (c) Committed fixed cost. 7. (b) Discretionary fixed cost. 8. (c) Committed fixed cost. 9. (a) Purely variable cost with respect to cases of 7-Up. 10. (b) Discretionary fixed cost. 11. (b) Discretionary fixed cost. 3-A2 (25-30 min.) 1. Support costs based on 60% of the cost of materials: Sign A Sign B Direct materials cost $400 $200 Support cost (60% of materials cost) $240 $120 Support costs based on $50 per power tool operation: Sign A Sign B