亨格瑞管理会计英文第15版 答案 10-12章
- 格式:pdf
- 大小:556.89 KB
- 文档页数:21
亨格瑞管理会计英文第15版练习答案01CHAPTER 1COVERAGE OF LEARNING OBJECTIVESLEARNING OBJECTIVE LO1: Describe the major users and uses of accounting information. LO2: Describe the cost-benefit and behavioral issues involved in designing an accounting system. LO3: Explain the role of budgets and performance reports in planning and control. LO4: Discuss the role accountants play in the company’s value chain functions. LO5: Explain why accounting is important in a variety of career paths. LO6: Identify current trends in management accounting. LO7: Explain why ethics and standards of ethical conduct are important to accountants. FUNDA- CRITICAL CASES, MENTAL THINKING EXCEL, ASSIGN-EXERCISES COLLAB., & MENT AND INTERNET MATERIAL EXERCISES PROBLEMS EXERCISES A1, B1 28, 29, 33 39, 40, 42 55 41, 43 A2, B2 32 45 53A1, B1 30, 31, 34, 35, 39, 42, 44 36 30, 31 52, 55 A3, B3 37, 38 47, 48, 49 54 51, 52, 55 1 Copyright ?2021 Pearson Education, Inc., Publishing as Prentice Hall.CHAPTER 1Managerial Accounting, the Business Organization, and Professional Ethics1-A1 (10-15 min.)Information is often useful for more than one function, so the following classifications for each activity are not definitive but serve as a starting point for discussion: 1. Scorekeeping. A depreciation schedule is used in preparing financial statementsto report the results of activities. 2. Problem solving. Helps a manager assess the impact of a purchase decision. 3. Scorekeeping. Reports on the results of an operation. Could also be attentiondirecting if scrap is an area that might require management attention. 4. Attention directing. Focuses attention on areas that need attention. 5. Attention directing. Helps managers learn about the information contained in aperformance report. 6. Scorekeeping. The statement reports what has happened. Could also be attentiondirecting if the report highlights a problem or issue. 7. Problem solving. Assuming the cost comparison is to help the manager decidebetween two alternatives, this is problem solving. 8. Attention directing. Variances point out areas where results differ fromexpectations. Interpreting them directs attention to possible causes of the differences. 9. Problem solving. Aids a decision about where to make parts. 10. Attention directing and problem solving. Budgeting involves making decisionsabout planned activities -- hence, aiding problem solving. Budgets also direct attention to areas of opportunity or concern --hence, directing attention. Reporting against the budget also has a scorekeeping dimension.2 Copyright ?2021 Pearson Education, Inc., Publishing as Prentice Hall.1-A2 1. 2.(15-20 min.)Room rental FoodEntertainment Decorations TotalBudgeted Amounts $ 140 700 600 220 $1,660 Actual Amounts $ 140865 600 260 $1,865 Deviations or Variances $ 0 165U 0 40U $205U Because of the management by exception rule, room rental and entertainment require no explanation. The actual expenditure for food exceeded the budgetby $165. Of this $165, $150 is explained by attendance of 15 persons morethan budgeted (at a budget of $10 per person for food) and $15 is explained by expenditures above $10 per person.Actual expenditures for decorations were $40 more than the budget. The decorations committee should be asked for an explanation of the excess expenditures.1-A3 (10 min.)All of the situations raise possibilities for violation of the integrity standard. In addition, the manager in each situation must address an additional ethical standard: 1. The General Mills manager must respect the confidentiality standard. He or sheshould not disclose any information about the new cereal. 2. Felix must address his level of competence for the assignment. If his supervisorknows his level of expertise and wants an analysis from a “layperson” point of view, he should do it. However, if the supervisor expects an expert analysis, Felix must disclose his lack of competence. 3. The credibility standard should cause Mary Sue to decline to omit the informationfrom the budget. It is relevant information, and its omission may mislead readers of the budget.3 Copyright ?2021 Pearson Education, Inc., Publishing as Prentice Hall.1-B1 (15-20 min.)Information is often useful for more than one function, so the following classifications for each activity are not definitive but serve as a starting point for discussion: 1. Problem solving. Provides information for deciding between two alternativecourses of action. 2. Scorekeeping. Recording what has happened. If amounts are compared withexpectations, this could also serve an attention-directing function. 3. Problem solving. Helps a manager decide among alternatives. 4. Attention directing. Directs attention to the use of overtime labor. Alsoscorekeeping. 5. Problem solving. Provides information to managers for deciding whether to movecorporate headquarters. 6. Attention directing. Directs attention to why nursing costs increased. 7. Attention directing. Directs attention to areas where actual results differed fromthe budget. 8. Problem solving. Helps the vice-president decide which course of action is best. 9. Problem solving. Produces information to help the marketing department make adecision about a marketing campaign. 10. Scorekeeping. Records actual overtime costs. If results are compared withexpectations, also attention directing. 11. Attention directing. Directs attention to stores with either high or low ratios ofadvertising expenses to sales. 12. Attention directing. Directs attentionto causes of returns of the drug. 13. Attention directing or problem solving, depending on the use of the schedule. If itis to identify areas of high fuel usage it is attention directing. If itis to plan for purchases of fuel, it is problem solving. 14. Scorekeeping. Records items needed for financial statements.4 Copyright ?2021 Pearson Education, Inc., Publishing as Prentice Hall.1-B2 (10-15 min.)1 & 2. Budget Actual Variance Sales $75,000 $74,600 $ 400U Costs: Fireworks $36,000 $35,500 $500F Labor 15,000 18,000 3,000U Other 8,000 7,910 90F Total cost 59,000 61,410 2,410U Profit $16,000 $13,190 $2,810U 3. The cost of fireworks was $500 ÷ $36,000 = 1.4%under budget while sales wasjust 400 ÷ $75,000 = .5% under budget. Did fireworks suppliers lowertheir prices? Were selling prices set higher than expected? There should be some explanation for the lower cost of fireworks. The labor cost was $3,000÷ $15,000 =20% over budget. Sales and other costswere close to budget in percentage terms. Why was labor cost much higherthan expected?1-B3 (15 - 20 min.) 1. A code of conduct is a document specifying theethical standards of anorganization. 2. Different companies include different elements intheir codes of conduct. Some ofthe items included in companies’ codes of condu ct include maintaining adress code, avoiding illegal drugs, following instructions of superiors, being reliable and prompt, maintaining confidentiality, not accepting personal gifts fromstakeholders as a result of company role, avoiding racial or sexual discrimination, avoiding conflict of interest, complying with laws and regulations, not using organization’s property for personal use, andreporting illegal or questionable activity. Some companies have a simple code with little detail, and others have long lists of rules and regulations regarding appropriate conduct. The key is that the code of conduct must fit with the corporate culture. 3. Simply having a code of conduct does not guarantee ethical behavior byemployees. Most important is top management’s ethical example and its support of the code of conduct. A company’s performance evaluation and reward system must be consistent with its code of conduct. If unethical actions are rewarded, they will be encouraged even if they violate the code of conduct.5 Copyright ?2021 Pearson Education, Inc., Publishing as Prentice Hall.感谢您的阅读,祝您生活愉快。
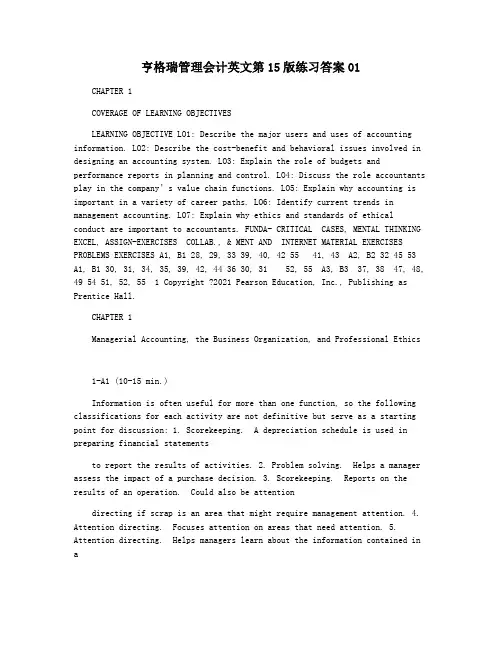
CHAPTER 5 COVERAGE OF LEARNING OBJECTIVESCHAPTER 5Relevant Information for Decision Making with a Focus on Pricing Decisions5-A1 (40-50 min.)1. INDEPENDENCE COMPANYContribution Income StatementFor the Year Ended December 31, 2009(in thousands of dollars)Sales $2,200 Less variable expensesDirect material $400Direct labor 330Variable manufacturing overhead (Schedule 1) 150 Total variable manufacturing cost ofgoods sold $880 Variable selling expenses 80Variable administrative expenses 25Total variable expenses 985 Contribution margin $ 1,215 Less fixed expenses:Fixed manufacturing overhead (Schedule 2) $345Selling expenses 220Administrative expenses 119 Total fixed expenses 684 Operating income $ 531INDEPENDENCE COMPANYAbsorption Income StatementFor the Year Ended December 31, 2009(in thousands of dollars)Sales $2,200 Less manufacturing cost of goods sold:Direct material $400Direct labor 330Manufacturing overhead (Schedules 1 and 2) 495 Total manufacturing cost of goods sold 1,225 Gross margin $ 975 Less:Selling expenses $300Administrative expenses 144 444 Operating income $ 531INDEPENDENCE COMPANYSchedules of Manufacturing OverheadFor the Year Ended December 31, 2009(in thousands of dollars)Schedule 1: Variable CostsSupplies $ 20Utilities, variable portion 40Indirect labor, variable portion 90 $150 Schedule 2: Fixed CostsUtilities, fixed portion $ 15Indirect labor, fixed portion 50Depreciation 200Property taxes 20Supervisory salaries 60 345 Total manufacturing overhead $495 2. Change in revenue $200,000Change in total contribution margin:Contribution margin ratio in part 1is $1,215 ÷ $2,200 = .552Ratio times decrease in revenue is .552 × $200,000 $ 110,400 Operating income before change 531,000 New operating income $420,600 This analysis is readily done by using data from the contribution income statement.In contrast, the data in the absorption income statement must be analyzed and split into variable and fixed categories before the effect on operating income can beestimated.5-A2 (25-30 min.)1. A contribution format, which is similar to Exhibit 5-6, clarifies the analysis.Without WithSpecial Effect of SpecialOrder Special Order Order Units 2,000,000 150,000 2,150,000Total Per UnitSales $11,000,000 $660,000 $4.40 1$11,660,000 Less variable expenses:Manufacturing $ 3,500,000 $322,500 $2.15 2$ 3,822,500 Selling & administrative 800,000 35,250 .2353 835,250 Total variable expenses $ 4,300,000 $357,750 $2.385 $ 4,647,250 Contribution margin $ 6,700,000 $302,250 $2.015 $ 7,002,250 Less fixed expenses:Manufacturing $ 3,000,000 0 0.00 $ 3,000,000 Selling & administrative 2,200,000 0 0.00 2,200,000 Total fixed expenses $ 5,200,000 0 0.00 $ 5,200,000 Operating income $ 1,500,000 $302,250 $2.015 $ 1,802,250 1$660,000 ÷ 150,000 = $4.402Regular unit cost = $3,500,000 ÷ 2,000,000 = $1.75 Logo .40Variable manufacturing costs $2.153Regular unit cost = $800,000 ÷ 2,000,000 = $ .40 Less sales commissions not paid (3% of $5.50) (.165)Regular unit cost, excluding sales commission $ .2352. Operating income from selling 7.5% more units would increase by $302,250 ÷$1,500,000 = 20.15%. Note also that the average selling price on regularbusiness was $5.50. The full cost, including selling and administrative expenses, was $4.75. The $4.75, plus the 40¢ per logo, less savings in commissionsof .165¢ came to $4.985. The president apparently wanted $4.985 + .08($4.985)= $4.985 + .3988 = $5.3838 per pen.Most students will probably criticize the president for being too stubborn. Thecost to the company was the forgoing of $302,250 of income in order to protectthe company's image and general market position. Whether $302,250 was a wise investment in the future is a judgment that managers are paid for rendering.5-A3 (15-20 min.)The purpose of this problem is to underscore the idea that any of a number of general formulas might be used that, properly employed, would achieve the same target selling prices. Desired sales = $7,500,000 + $1,500,000 = $9,000,000.The target markup percentage would be:1. 100% of direct materials and direct labor costs of $4,500,000.Computation is: ($9,000,000 - $4,500,000) ÷ $4,500,000 = 100%2. 50% of the full cost of jobs of $6,000,000.Computation is: ($9,000,000 - $6,000,000) ÷ $6,000,000 = 50%3. [$9,000,000 – ($3,500,000 + $1,000,000 + $700,000)] ÷ $5,200,000 = 73.08%4. ($9,000,000 - $7,500,000) ÷ $7,500,000 = 20%5. [$9,000,000 – ($3,500,000 + $1,000,000 + $700,000 + $500,000)] ÷ $5,700,000= $3,300,000 ÷ $5,700,000 = 57.9%If the contractor is unable to maintain these profit percentages consistently, the desired operating income of $1,500,000 cannot be obtained.1. Revenue ($360 × 70,000) $25,200,000Total cost over product life 16,000,000 Estimated contribution to profit $ 9,200,000 Desired (target) contribution to profit40% × $25,200,000 10,080,000 Deficiency in profit $ 880,000The product should not be released to production.2. Previous total estimated cost $16,000,000Cost savings from suppliers.20 × .70 × $8,000,000 1,120,000 Revised total estimated cost $14,880,000 Revised total contribution to profit:$25,200,000 - $14,880,000 $10,320,000 Desired (target) contribution to profit 10,080,000 Excess contribution to profit $ 240,000The product should be released to production.3. Previous revised total estimated cost fromrequirement 2. $14,880,000 Process improvement savings:.25 × .30 × $8,000,000 $600,000Less cost of new technology 220,000 380,000 Revised total estimated cost 14,500,000 Revised total contribution to profit:$25,200,000 - $14,500,000 $10,700,000 Desired (target) contribution to profit 10,080,000 Excess contribution to profit $ 620,000 The product should be released to production.1. KINGLAND MANUFACTURINGContribution Income StatementFor the Year Ended December 31, 2009(In thousands of dollars)Sales $13,000 Less variable expenses:Direct material $4,000Direct labor 2,000Variable indirect manufacturingcosts (Schedule 1) 960Total variable manufacturing cost of goods sold $6,960Variable selling expenses:Sales commissions $500Shipping expenses 300 800Variable clerical salaries 400Total variable expenses 8,160 Contribution margin $ 4,840 Less fixed expenses:Manufacturing (Schedule 2) $ 702Selling (advertising) 400 Administrative-executive salaries 100Total fixed expenses 1,202 Operating income $ 3,638KINGLAND MANUFACTURINGAbsorption Income StatementFor the Year Ended December 31, 2009(In thousands of dollars)Sales $13,000 Less manufacturing cost of goods sold:Direct material $4,000Direct labor 2,000Indirect manufacturing costs(Schedules 1 and 2) 1,662Gross profit 5,338 Selling expenses:Sales commissions $500Advertising 400Shipping expenses 300 $1,200 Administrative expenses:Executive salaries $100Clerical salaries 400 500 1,700 Operating income $ 3,638KINGLAND MANUFACTURINGSchedules 1 and 2Indirect Manufacturing CostsFor the Year Ended December 31, 2009(In thousands of dollars)Schedule 1: Variable CostsCutting bits $ 60Abrasives for machining 100Indirect labor 800 $ 960Schedule 2: Fixed CostsFactory supervisors' salaries $100Factory methods research 40Long-term rent, factory 100Fire insurance on equipment 2Property taxes on equipment 30Depreciation on equipment 400Factory superintendent's salary 30 702Total indirect manufacturing costs $1,6622. Operating income would decrease from $3,638,000 to $3,268,000:Decrease in revenue $1,000,000Decrease in total contribution margin*:Ratio times revenue is .37 × $1,000,000 $ 370,000Decrease in fixed expenses 0Operating income before increase 3,638,000New operating income $3,268,000*Contribution margin ratio in contribution income statement is $4,840 ÷$13,000 = .37 (rounded).The above analysis is readily calculated by using data from the contribution income statement. In contrast, the data in the absorption income statement must be analyzed and divided into variable and fixed categories before the effect on operating income can be estimated.5-B2 (30-40 min.)1. DANUBE COMPANYIncome StatementFor the Year Ended December 31, 20X0Total Per Unit Sales $40,000,000 $20.00Less variable expenses:Manufacturing $18,000,000Selling & administrative 9,000,000 27,000,000 13.50Contribution margin $13,000,000 $ 6.50Less fixed expenses:Manufacturing $ 4,000,000Selling & administrative 6,000,000 10,000,000 5.00Operating income $ 3,000,000 $ 1.50 2. Additional details are either in the statement of the problem or in the solution torequirement 1:Total Per Unit Full manufacturing cost $22,000,000 $11.00 Variable cost:Manufacturing $18,000,000 $ 9.00 Selling and administrative 9,000,000 4.50 Total variable cost $27,000,000 $13.50 Full cost = fully allocated cost*Full manufacturing cost $22,000,000 $11.00 Selling and administrative expenses 15,000,000 7.50 Full cost $37,000,000 $18.50 Gross margin ($40,000,000 - $22,000,000) $18,000,000 $ 9.00 Contrib. margin ($40,000,000 - $27,000,000) $13,000,000 $ 6.50 * Students should be alerted to the loose use of these words. Their meaning maynot be exactly the same from company to company. Thus, "fully allocatedcost" in some companies may be used to refer to manufacturing costs only.3. Ricardo’s analysis is incorrect. He was on the right track, but he did notdistinguish sufficiently between variable and fixed costs. For example, whenmultiplying the additional quantity ordered by the $11 full manufacturing cost, hefailed to recognize that $2.00 of the $11 full manufacturing cost was a "unitized"fixed cost allocation. The first fallacy is in regarding the total fixed cost asthough it fluctuated like a variable cost. A unit fixed cost can be misleading if itis used as a basis for predicting how total costs will behave.A second false assumption is that no selling and administrative expenses will beaffected except commissions. Shipping expenses and advertising allowances willbe affected also -- unless arrangements with Costco on these items differ fromthe regular arrangements.The following summary, which is similar to Exhibit 5-6 in the textbook, is acorrect analysis. The middle columns are all that are really necessary.Without WithSpecial Effect of SpecialOrder Special Order Order Units 2,000,000 100,000 2,100,000Total Per UnitSales $40,000,000 $1,600,000 $16.00 $41,600,000 Less variable expenses:Manufacturing $18,000,000 $ 900,000 $ 9.00 $18,900,000 Selling and administrative 9,000,000 330,000 3.30* 9,330,000 Total variable expenses $27,000,000 $1,230,000 $12.30 $28,230,000 Contribution margin $13,000,000 $ 370,000 $ 3.70 $13,370,000 Less fixed expenses:Manufacturing $ 4,000,000 0 0.00 $ 4,000,000 Selling and administrative 6,000,000 20,000 0.20** 6,020,000 Total fixed expenses $10,000,000 20,000 0.20 $10,020,000 Operating income $ 3,000,000 $ 350,000 $ 3.50 $ 3,350,000 * Regular variable selling and administrative expenses,$9,000,000 ÷ 2,000,000 = $ 4.50 Less: Average sales commission at 6% of $20 = (1.20) Regular variable sell. and admin. expenses, less commission $ 3.30**Fixed selling and administrative expenses, specialcommission, $20,000 ÷ 100,000 .20Some students may wish to enter the $20,000 as an extra variable cost, makingthe unit variable selling and administrative cost $3.50 and thus adding no fixedcost. The final result would be the same; in any event, the cost is relevantbecause it would not exist without the special order.Some instructors may wish to point out that a 5% increase in volume wouldcause an 11.7% increase in operating income, which seems like a highinvestment by Danube to maintain a rigid pricing policy.4. Ricardo is incorrect. Operating income would have declined from $3,000,000 to$2,850,000, a decline of $150,000. Ricardo’s faulty analysis follows:Old fixed manufacturing cost per unit,$4,000,000 ÷ 2,000,000 = $2.00 New fixed manufacturing cost per unit,$4,000,000 ÷ 2,500,000 = 1.60 "Savings" $ .40Loss on variable manufacturing costs per unit,$8.70 - $9.00 (.30) Net savings per unit in manufacturing costs $ .10The analytical pitfalls of unit-cost analysis can be avoided by using thecontribution approach and concentrating on the totals:Without Effect of WithSpecial Special SpecialOrder Order Order Sales $40,000,000 $4,350,000a$44,350,000Variable manufacturingcosts $18,000,000 $4,500,000b$22,500,000 Other variable costs 9,000,000 0 9,000,000 Total variable costs $27,000,000 $4,500,000 $31,500,000 Contribution margin $13,000,000 $ (150,000)c$12,850,000a500,000 × $8.70 selling price of special orderb 500,000 × $9.00 variable manufacturing cost per unit of special orderc 500,000 × $.30 negative contribution margin per unit of special orderNo matter how fixed manufacturing costs are unitized, or spread over the unitsproduced, their total of $4,000,000 remains unchanged by the special order.5-B3 (10-15 min.)1. Cost-plus pricing is adding a specified markup to cost to cover those components of the value chain not included in the cost plus a desired profit. In this case the markup is 30% of production cost.Price charged for piston pin = 1.30 × $50.00 = $65.00. If the estimated selling price is only $46 and this price cannot be influenced by Caterpillar, a manager would be unlikely to favor releasing this product for production.2. Target costing assumes the market price cannot be influenced by companies except by changing the value of the product to consumers. The price charged would then be the $46 estimated by market research.The highest acceptable manufactured cost or target cost, T, isDollarsTarget Price $ 46.00Target Cost TTarget Gross Margin $ .30T46 – T = .30T1.30T = 46T = 46 ÷ 1.30 = $35.383. The required cost reduction over the product’s life isExisting manufacturing cost $50.00Target manufacturing cost 35.38Required cost reduction $14.62Steps that Caterpillar managers can take to meet the required cost reduction include value engineering during the design phase, Kaizen costing during the production phase, and activity-based management throughout the product’s life.5-1 Precision is a measure of the accuracy of certain data. It is a quantifiable term. Relevance is an indication of the pertinence of certain facts for the problem at hand. Ideally, data should be both precise and relevant, but relevance generally takes priority.5-2 Decisions may have both quantitative and qualitative aspects corresponding to the nature of the facts being considered before deciding. Quantitative implications of alternative choices can be expressed in monetary or numerical terms, such as variable costs, initial investment, etc. Other relevant features may not be quantifiable, such as the quality of life in a choice between locating in San Francisco or New York. The advantage of quantitative information is that it is more objective and often easier to compare alternatives than with qualitative judgments.5-3 The accountant's role in decision-making is primarily that of a technical expert on relevant information analysis, especially relevant costs. The accountant is usually an information provider, not the decision maker, although the accountant may be part of a management team charged with making decisions.5-4 No. Only future costs that are different under different alternatives are relevant to a decision.5-5 Past data are unchangeable regardless of present or future action and thus would not differ under different alternatives.5-6 Past costs may be bases for formulating predictions. However, past costs are not inputs to the decision model itself because past costs cannot be changed by the decision.5-7 The contribution approach has several advantages over the absorption approach, including a better analysis of cost-volume-profit relationships, clearer presentation of all variable costs, and more relevant arrangement of data for such decisions as make-or-buy or product expansion.5-8 The terms that describe an income statement that emphasizes the differences between variable or fixed costs are contribution approach, variable costing, or direct costing.5-9 The commonalty of approach is the focus on the differences between future costs and revenues of different available alternatives.5-10 No, fixed costs are not always irrelevant. Often they are not relevant. However, they can be relevant if they are affected by the decision being considered.5-11 Customers are one of the factors influencing pricing decisions because they can buy or do without the product, they can make the product themselves, or they can usually purchase a similar product from another supplier.5-12 Target cost per unit is the average total unit cost over the product’s life cycle that will yield the desired profit margin.5-13 Value engineering is a cost-reduction technique, used primarily during the design function in the value chain, that uses information about all value chain functions to satisfy customer needs while reducing costs.5-14 Kaizen costing is the Japanese term for continuous improvement during manufacturing.5-15 In target costing, managers start with a market price. Then they try to design a product with costs low enough to be profitable at that price. Thus, prices essentially determine costs.5-16 Customer demands and requirements are important in the product development process. Many companies seek customer input on the design of product features. They seek to reduce non-value-added costs without affecting product features that are valuable to customers. Suppliers are also important. Companies purchase many of the materials used in products. They have to work with suppliers to get the lowest cost for these materials.5-17 Not necessarily. There are other important factors that management must consider before discontinuing a product. The product may be necessary to round out a product line. The product may be the company’s attempt to break into a new market area or new product class.5-18 The variable costs of a job can be misused as a guide to pricing. However, the adjusted markup percentages based on variable costs can have the same price result as those based on total costs, plus they have the advantage of indicating the minimum price at which any sale may be considered profitable even in the short run.5-19 Three examples of pricing decisions are (1) pricing new products, (2) pricing products sold under private labels, and (3) responding to new prices of a competitor's products.5-20 Three popular markup formulas are (1) as a percentage of variable manufacturing costs, (2) as a percentage of total variable costs, and (3) as a percentage of full costs.5-21 Two long-run effects that inhibit price cutting are (a) the effects on longer-run price structures and (b) the effects on longer-run relations with customers.5-22 Full costs are more popular than variable costs for pricing because price stability is encouraged and in the long run all costs must be recovered to stay in business.5-23 No. There is a confusion between total fixed costs and unit fixed costs. Increasing sales volume will decrease unit fixed costs, but not total fixed costs. This assumes that the volume increase results in operating levels that are still within the relevant range.5-24 Managers generally find contribution margin income statements more useful, especially if they are concerned with short-term results. The contribution margin statement provides information on the immediate profit impact of increases or decreases in sales.5-25 Marginal cost is the additional cost resulting from producing and selling one additional unit. It changes as production volume changes. With a given fixed capacity, marginal cost generally decreases up to a point and then increases. Variable cost is the accountant's approximation to marginal cost. It remains constant over the relevant range of volume. Because the difference between these two costs often is not material (within the relevant range), in such cases we can use the variable-cost estimate of marginal cost for decision-making purposes.5-26 Pricing decisions must be made within legal constraints. These laws help protect companies from predatory and discriminatory pricing. Predatory pricing involves setting prices so low that they drive competitors out of the market. Discriminatory pricing is charging different prices to different customers for the same product or service.5-27 Managers are directly involved in the research and development and the design functions. During the initial product research phase, managers often are involved in surveys, focus groups (with major airlines), and other market research activities to explore the potential for a new airplane. During process and product design, managers help with such tasks as negotiations with suppliers and cost analyses. Production managers provide input regarding cost reduction ideas. Marketing managers provide input regarding customer needs (a super large plane with more than 500 seats versus more medium-sized planes that can serve more markets). Distribution managers provide input regarding the costs of various channels of distribution. Finally, managers involved with customer relations provide input regarding the likely cost-to-serve profile for expected customers for a new product.5-28 (5 min.)All the data given are historical costs. Most students will identify the $5 and $7 prices as relevant. They will also declare that the $3 price of popcorn is irrelevant. Press them to see that the relevant admission prices are expected future costs that will differ between the alternatives. The past prices are being used as a basis for predicting the future prices.Similarly, the past prices of popcorn were not different. Hence, they are regarded as irrelevant under the assumption that the future prices will not differ.5-29 (20 min.) Some students may forget to apply the 10% wage rate increase to both alternatives.(1) Historical direct materials were $5.00per unit; direct labor was $6.00 per unit. (2) (2) Direct material costs are expected tofall by 10%, or 50¢ per unit. Directlabor costs are affected by a 10% rateincrease and a 5% increase in labortime if the new material is used.(3) (3) Cost comparisons per unit:Old NewMaterial MaterialDirect material $ 5.00 $ 4.50Direct labor$6.00 × 110% 6.60$6.00×110%×105% 6.93Expected futurecost $11.60 $11.43(4) The chosen action is implemented,and the evaluation of performance be-comes a principal source of feedback.This historical information aids thedecision process (prediction, decision,and implementation) of future decisions.5-30 (10 min.)Relevant costs are the future costs that differ between alternatives. Among the irrelevant costs are the cost of tickets to the symphony, automobile costs, and baby-sitting cost for the first four hours. The relevant costs are:Symphony Game Difference Tickets, 2 @ $20 each $0 $40 $40Parking 0 6 6Baby-sitting, 1 extrahour @ $7 0 7 7Total $0 $53 $53 The baseball game is $53 more costly to the Petrocelis than is the symphony.5-31 (10 min.) This is a basic exercise. Answers are in thousands of dollars.1. 200 + 200 + 170 = 5702. 800 - 570 = 2303. 230 - 150 = 804. 570 – 200 = 370; or 200 + 170 = 3705-32 (10-15 min.) This is a basic exercise.Sales ¥950Variable expenses:Direct materials ¥290Direct labor 160Variable factory overhead 60(a) Variable manufacturing cost ofgoods sold ¥510Variable selling and admin. expenses 100Total variable expenses 610(b) Contribution margin ¥340Fixed expenses:Fixed factory overhead ¥120Fixed selling and administrativeexpenses 45 165(c) Operating income ¥ 1755-33 (15-20 min.)This is a straightforward exercise in basic terms and relationships. To fill all theblanks, both absorption and contribution income statements must be prepared. Data arein millions of dollars. Required answers are in italics.Absorption ContributionApproach Approach Sales $920 $920 Direct materials used $350 $350Direct labor 210 210Variable indirectmanufacturing costs 100 100f. Variable manufacturing cost ofgoods sold 660 Variable selling and administrativeexpenses 90 Total variable expenses 750 k. Contribution margin 170 Fixed factory overhead 50 50g. Manufacturing cost of goods sold 710j. Gross profit 210Fixed selling and administrativeexpenses 80 80 130 Variable selling and administrativeexpenses 90 170Operating income $ 40 $ 405-34 (10-20 min.) Answers are in thousands of rands (ZAR).Prime costs = Direct material + Direct labor600 = 370 + DLDL = 230The body of a model income statement follows. The computations are explainedfor each item that was originally blank. Numbers given in the problem are in bold.Sales, 780 + 120 ZAR900Direct materials ZAR370Direct labor, 600 - 370 230Factory overhead, 780 - (370 + 230) 180Manufacturing cost of goods sold 780Gross margin ZAR120Selling and administrative expenses* 100Operating income ZAR 20*120 - 205-35 (15-20 min.) The data are placed in the format of the income statement, and the unknowns are computed as shown:Sales $890 Variable expensesDirect materials $150Direct labor 170Variable indirect manufacturing 110Variable manufacturing cost of goods sold 430 1 Variable selling and administrative expenses 260 2Total variable expenses (890 - 200) 690Contribution margin 200 Fixed expensesFixed indirect manufacturing $ 90 3Fixed selling and administrative expenses 100 190 Operating income $ 10 1150 + 170 + 110 = 4302890 - 200 = 690; 690 - 430 = 2603Total fixed expenses = 200 - 10 = 190Fixed indirect manufacturing = 190 - 100 = 905-36 (10-15 min.)1. Operating income would increase by $300 if the order is accepted.Without Effect of WithSpecial Special SpecialOrder Order Order Units 2,000 100 2,100 Sales $36,000 $1,500 $37,500 Purchase cost 20,000 1,000 21,000 Variable printing cost 4,000 200 4,200 Total variable cost 24,000 1,200 25,200 Contribution margin 12,000 300 12,300 Fixed cost 8,000 0 8,000 Operating income $ 4,000 $ 300 $ 4,300 2. If maximizing operating income in the short run were the only goal, the ordershould be accepted. However, if qualitative considerations favoring rejection are worth more than the $300 increase in operating income, the manager wouldreject the offer. For example, accepting the offer from F. C. Kitsap may generate similar offers from other clubs who now willingly pay the $18 normal price.Lost profits on such business might more than offset the $300 gain on this sale.On the other hand, this might be a way of gaining F. C. Kitsap as a regularcustomer who will then buy other items that generate a profit well in excess ofthe $300.。
![亨格瑞成本与管理会计(中英第15版)中文PPT (12)[38页]](https://uimg.taocdn.com/83c244d3a6c30c2258019eb7.webp)
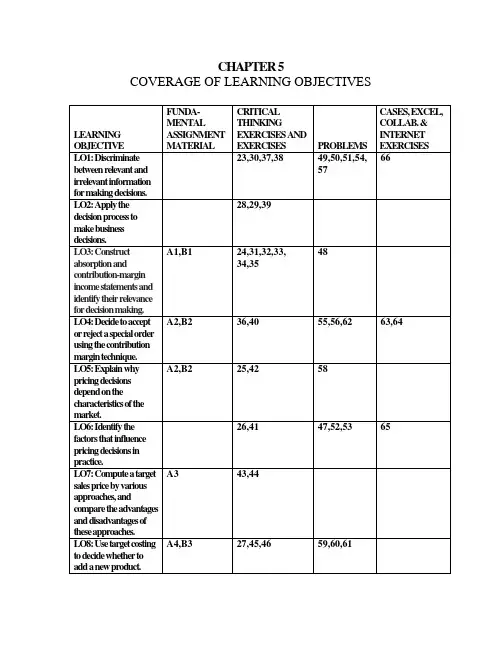
CHAPTER 11Capital Budgeting11-A1 (15-25 min.) Answers are printed in the text at the end of the assignment material.11-29 (10-15 min.)1. The present value is $480,000 and the annual payments are an annuity, requiringuse of Table 2:(a)$480,000 = annual payment × 11.2578annual payment = $480,000 ÷ 11.2578 = $42,637(b)$480,000 = annual payment × 9.4269annual payment = $480,000 ÷ 9.4269 = $50,918(c)$480,000 = annual payment × 8.0552annual payment = $480,000 ÷ 8.0552 =$59,5892. (a)$480,000 = annual payment × 8.5595annual payment = $480,000 ÷ 8.5595 = $56,078(b)$480,000 = annual payment × 7.6061annual payment = $480,000 ÷ 7.6061 = $63,107(c)$480,000 = annual payment × 6.8109annual payment = $480,000 ÷ 6.8109 =$70,4753. (a) Total payments= 30 × $50,918 = $1,527,540Total interest paid= $1,527,540- $480,000 = $1,047,540(b) Total payments= 15 × $63,107= $946,605Total interest paid = $946,605 - $480,000 = $466,60511-36 (10 min.)Buy. The net present value is positive.Initial outlay * $(21,000)Present value of cash operating savings, from12-year, 12% column of Table 2, 6.1944 × $5,000 30,972Net present value $ 9,972* The trade-in allowance really consists of a $5,000 adjustment of the sellingprice and a bona fide $10,000 cash allowance for the old equipment. Therelevant amount is the incremental cash outlay, $21,000. The book value isirrelevant.11-39 (10-15 min.)Copyright ©2011 Pearson Education 1Copyright ©2011 Pearson Education21. NPV @ 10% = 10,000 × 3.7908 = $37,908 - $36,048 = $1,860 NPV @ 12% = 10,000 × 3.6048 = $36,048 - $36,048 = $0NPV @ 14% = 10,000 × 3.4331 = $34,331 - $36,048 = $(1,717)2.The IRR is the interest rate at which NPV = $0; therefore, from requirement 1 we know that IRR = 12%.3.The NPV at the company’s cost of capital, 10%, is positive, so the project should be accepted.4.The IRR (12%) is greater than the company’s cost of capital (10%), so the project should be accepted. Note that the IRR and NPV models give the same decision.11-46 (10-15 min.)Annual addition to profit = 40% × $25,000 = $10,000.1.Payback period is $36,000 ÷ $10,000 = 3.6 years. It is not a good measure of profitability because it ignores returns beyond the payback period and it does not account for the time value of money.2. NPV = $5,114. Accept the proposal because NPV is positive. Computation: NPV = ($10,000 × 4.1114) - $36,000= $41,114 - $36,000 = $ 5,1143. ARR = (Increase in average cash flow – Increase in depreciation) ÷ Initialinvestment= ($10,000 - $6,000) ÷ $36,000 = 11.1%11-51 (30-35 min.)1.Annual Operating Cash FlowsXeroxCannon Difference Salaries $49,920(a) $41,600(b) $ 8,320 Overtime 1,728(c) -- 1,728 Repairs and maintenance 1,800 1,050 750Toner, supplies, etc. 3,6003,300 300 Total annual cash outflows $57,048 $45,950 $11,098(a) ($ 8 × 40 hrs.) × 52 weeks × 3 employees = $320 × 52 × 3 = $49,920 (b) ($10 × 40 hrs.) × 52 weeks × 2 employees = $400 × 52 × 2 = $41,600 (c) ($12 × 4 hrs.) × 12 months × 3 machines = $ 48 × 12 × 3 = $ 1,728Initial Cash FlowsXeroxCannon Difference Purchase of Cannon machines $ -- $50,000 $50,000Sale of Xerox machines -- -3,000 -3,000 Training and remodeling -- 4,000 4,000 Total $ -- $51,000 $51,000Copyright ©2011 Pearson Education 3EXHIBIT 11-50All numbers are expressed in Mexican pesos.2. 18% Total Sketch of Relevant Cash Flows(inthousands)PresentPVFactor Value 0 1 2 3 4 5Cash operating savings:* .8475 83,902 99,000108,90078,212.718272,904119,790.608667,966 131,769 .5158.4371 63,356 144,946Total366,340Income tax savings fromdepreciation not changedby inflation, see 1 3.1272 105,074 33,600 33,600 33,600 33,600 33,600471,414TotalRequired outlay at time zero 1.0000 (420,000) (420,000)Net present value 51,414*Amounts are computed by multiplying (150,000 × .6) = 90,000 by 1.10, 1.10 2, 1.10 3, etc.Copyright ©2011 Pearson Education 461PV PresentofValue$1.00ofCashFlows Annual Cash FlowsDiscountedat 12% 0 1 2 3 4 5T OTAL P ROJECT A PPROACH:Cannon:Init. cash outflow 1.0000 $ (51,000)Oper. cash flows 3.6048 (165,641) (45,950) (45,950) (45,950) (45,950) (45,950)Total $(216,641)Xerox:Oper. cash flows 3.6048 $(205,647) (57,048) (57,048) (57,048) (57,048) (57,048)Difference in favor ofretaining Xerox $ (10,994)I NCREMENTAL A PPROACH:Initial investment 1.0000 $(51,000)Annual operatingcash savings 3.6048 40,006 11,098 11,098 11,098 11,098 11,098Net present valueof purchase $(10,994)2. The Xerox machines should not be replaced by the Cannon equipment.Net savings = (Present value of expenditures to retain Xerox machines) less (Present value of expenditures toconvert to Cannon machines)= $205,647 - $216,641 = $(10,994)3. a. How flexible is the new machinery? Will it be useful only for the presently intended functions, or can it be easilyadapted for other tasks that may arise over the next 5 years?b. What psychological effects will it have on various interested parties?Copyright ©2011 Pearson Education 46211-71 (60-90 min.)This is a complex problem because it requires comparing three alternatives. It reviews Chapter 6 as well as covering several of the topics of Chapter 11. The following answer uses the total project approach. The total net future cash outflows are shown for each alternative.1. Alternative A: Continue to manufacture the parts with the current tools.Annual cash outlaysVariable cost, $92 × 8,000 $(736,000)Fixed cost, 1/3 × $45 × 8,000 × .6 (72,000)Tax savings, .4 × ($736,000 + $72,000) 323,200After-tax annual cost $(484,800)Present value, 3.6048 × $484,800 $(1,747,607)PV of remaining tax savings on MACRS:11.52% × $2,000,000 × .4 × .8929 82,2905.76% × $2,000,000 × .4 × .7972 36,735Total present value of costs, Alternative A $(1,628,582)Alternative B: Purchase from outside supplierAnnual cash outlaysPurchase cost, $110 × 8,000 $(880,000)Tax savings, $880,000 × .4 352,000After-tax annual cost $(528,000)Copyright ©2011 Pearson Education 463Present value, $528,000 × 3.6048 $(1,903,334)Sale of old equipment:Sales price $ 400,000Book value [(11.52% + 5.76%) × $2,000,000] 345,600Gain $ 54,400Taxes @ 40% (21,760)Total after-tax effect ($400,000 - $21,760) 378,240Total present value of costs, Alternative B $(1,525,094)Copyright ©2011 Pearson Education 464Alternative C: Purchase new toolsInvestment $(1,800,000) Annual cash outlaysVariable cost, $73 × 8,000 $(584,000)Fixed cost (same as A) (72,000)Tax savings, .4 × ($584,000 + $72,000) 262,400After-tax annual cost $(393,600)Present value, $393,600 × 3.6048 (1,418,849)Tax savings on new equipment* 579,217Effect of disposal of new equipmentSales price $ 500,000Book value 0Gain $500,000Taxes @ 40% 200,000Total after-tax effect $ 300,000Present value, $300,000 × .5674 170,220Effect of disposal of old equipment (see Alternative B) 378,240Total present value of costs, Alternative C $(2,091,172)* Using the MACRS schedule for tax depreciation, the depreciation rate for each year of a 3-year asset's life is shown inExhibit 11-6:Depreciation Tax PV PresentYear Rate Savings Factor Value1 33.33% .3333 × $1,800,000 × .40 = $239,976 .8929 $214,2752 44.45% .4445 × 1,800,000 × .40 = 320,040 .7972 255,1363 14.81% .1481 × 1,800,000 × .40 = 106,632 .7118 75,9014 7.41% .0741 × 1,800,000 × .40 = 53,352 .6355 33,905Total present value of tax savings $579,217Using Exhibit 11-7, we get .8044 × $1,800,000 × .4 = $579,168, which differs from $579,217 by a $49 rounding error.The alternative with the lowest present value of cost is Alternative B, purchasing from the outside supplier.Copyright ©2011 Pearson Education 4652. Among the major factors are (1) the range of expected volume (both large increases and decreases in volume make thepurchase of the parts relatively less desirable), (2) the reliability of the outside supplier, (3) possible changes inmaterial, labor, and overhead prices, (4) the possibility that the outside supplier can raise prices before the end of five years, (5) obsolescence of the products and equipment, and (6) alternate uses of available capacity (alternative uses make Alternative B relatively more desirable).Copyright ©2011 Pearson Education 466Copyright ©2011 Pearson Education467CHAPTER 12 Cost Allocation12-30 (10-15 min.) 1. Rate = [$2,500 + ($.05 × 100,000)] ÷ 100,000 = $.075 per copy Cost allocated to City Planning in August = $.075 × 42,000 = $3,150. 2. Fixed cost pool allocated as a lump sum depending on predicted usage:To City Planning: (36,000 ÷ 100,000) × $2,500 = $900 per monthVariable cost pool allocated on the basis of actual usage: $.05 × number of copies Cost allocated to City Planning in August: $900 + ($.05 × 42,000) = $3,000. 3. The second method, the one that allocated fixed- and variable-cost pools separately, is preferable. It better recognizesthe causes of the costs. The fixed cost depends on the size of the photocopy machine, which is based on predicted usage and is independent of actual usage. Variable costs, in contrast are caused by actual usage.Exhibit 12-34Customer Type 1Customer Type 2 Customer Type 3 Sales Gross price profit per margin Gross Gross Gross Product unit per unit Units Revenue profit Units Revenue profit Units Revenue profitA $11.031$ 4.14 200 $ 2,206 $ 828 2,200 $ 24,266 $ 9,108 500 $ 5,515 $ 2,070 B 20.47 4.09 100 2,047 409 1,200 24,564 4,908 3,000 61,410 12,270 C 51.38 10.28 50 2,569 514 400 20,552 4,112 5,000 256,900 51,400D 90.00 39.38 400 36,000 15,752 800 72,000 31,504 400 36,000 15,752Total 750 $42,822 17,5034,600 $141,382 49,632 8,900 $359,825 81,492 Cost to serve 7,36845,193 87,439 Operating income $10,135 $4,439 ($5,947) Customer gross margin percentage 40.9% 35.1% 22.6% Cost to serve percentage 17.2% 32.0% 24.3%Customer operating income percentage 23.7%3.1% (1.7%)1$32,000 ÷ 2,900 units; etc. The rounded numbers from the first two columns are used in subsequent calculations.5. The chart below shows customer profitability for the three customer types and suggested strategies for profit improvement.Grow business with this customer type byfocused sales efforts and quantity discounts.Work with customers to lowerthe cost to serve. Seek internalprocess improvements to lowerthose elements of the cost toserve controllable by thecompany.Copyright ©2011 Pearson Education 46912-35 (15-20 min.)of1. AllocationCostsGallons Weighting Joint$300,000 $180,000×A 9,000 9/15SolventSolvent B 6,000 6/15 × $300,000 120,00015,000 $300,0002. Relative Sales Allocation ofCostsValue at Split-off* Weighting JointSolvent A $270,000 27/54 × $300,000 $150,000Solvent B 270,000 27/54 × $300,000 150,000$540,000 $300,000 * $30 × 9,000 and $45 × 6,00012-42 (25-30 min.)There a several ways to organize an analysis that provides product costs. We like to focus first on determining total activity-cost pools and activity cost per driver unit. Then, an analysis similar to the one shown in Exhibit 12-8 can be used.Schedule a: Activity center cost poolsResources Supporting the Allocated Setup/Maintenance Activity Center Allocation Calculation Cost Assembly supervisors $90,000 × 2% $ 1,800 Assembly machines $247,000 × (400 ÷ 1,900) 52,000 Facilities management $95,000 × (400 ÷ 1,900) 20,000 Power $54,000 × (10 ÷ 90) 6,000Total assigned cost $79,800Cost per driver unit (setup) $79,800 ÷ 40 $ 1,995 Resources Supporting the Allocated Setup/Maintenance Activity Center Allocation Calculation Cost Assembly supervisors $90,000 × 98% $ 88,200 Assembly machines $247,000 × (1,500 ÷ 1,900) 195,000 Facilities management $95,000 × (1,500 ÷ 1,900) 75,000 Power $54,000 × (80 ÷ 90) 48,000Total assigned cost $406,200Cost per driver unit (machine hour) $406,200 ÷ 1,500 $ 270.80Copyright ©2011 Pearson Education 470Exhibit 12-42 Contribution to cover other value-chain costs by productStandardDeluxe Custom Cost per Driver unit Driver Driver Driver Activity/Resource (Schedule a) Units Cost Units Cost Units Cost Setup/Maintenance $1,995 20 $ 39,900 12 $ 23,940 8 $ 15,960 Assembly $270.80 1,000 270,800 400 108,320 100 27,080 Parts 1,003,800 115,080 15,980Direct labor 298,00072,000 68,000 Total $1,612,500$319,340 $127,020 Units 100,000 10,000 1,000 Cost per display $16.125 $31.934 $127.02Selling price 20.00050.000 250.00 Unit gross profit $ 3.875$18.066 $122.98 Total gross profit $387,500$180,660 $122,980The total contribution of these products is $387,500 + $180,660 + $122,980 = $691,140.12-43 (25-30 min.) See solution to problem 12-42.12-55 (100 – 200 min.)1. Exhibits 12-55A and 12-55B show the calculation of customer gross margin percentage and customer cost-to-serve percentage for the 4 customer types. Exhibit 12-55C shows a plot of customer gross margin percentage versus customer cost-to-serve percentage for the 4 customer types.2. Suggested strategies for profit improvement for the 4 customer types follow.•Customer type 1 - Mega stores. These stores have the lowest cost-to-serve.Profitability can be improved by focusing on a better product mix. A quarter ofthe sales (cases) to these stores are from bulk and singles products – both ofwhich have a negative gross margin. A shift in mix towards more regular andfragile product types would improve profitability.•Customer type 2 – Local small stores. These stores have a product mix that contains a substantial amount (32%) of the negative gross margin products. Thesame change in sales focus that applies to mega stores can be applied to localsmall stores.But unlike mega stores, small stores are very costly to serve. From Exhibit 12-55 B, the largest single cost to serve local small stores is truck deliveries. Theaverage number of cases per order (the same as per truck delivery) is 6,000,000 ÷ 80,000 = 75. Compare this to mega stores that average 7,680,000 ÷ 32,000 = 240 cases per order (delivery). This is a significant factor causing the high cost-to-serve.For example, suppose that the average order size could be increased from 75,000 to 150,000 cases. If the total annual cases sold is unchanged (6,000,000), a totalof 40 orders, a 50% reduction, would be made. An estimate of the cost savingsand the impact on the cost-to-serve percentage can be made as follows:Cost per Driver Unit Reduction in Driver Cost Savings(Exhibit 12-55B) Units of 50% (000) Truck delivery $167.55 34,000 $5,696.70 Order processing 27.49 40,000 1,099.60 Regular scheduling 5.83 36,000 209.88 Expedited scheduling 19.44 4,000 77.76 Total cost savings (000) $7,083.94 Cost savings as a percent of revenue 24.9%New cost-to-serve as a percent of revenue 60.1%In addition to the above savings, other activities would also be impacted by thereduction in orders such as customer service. So while the total impact ofCopyright ©2011 Pearson Education 472focusing on increasing order size can only be estimated, it is reasonable to expect dramatic cost savings from the current 85% of revenue.Other factors that should be investigated include the high level of corporatesupport and customer service.•Customer type 3 – Local large stores. Local large stores generate $68,400 ÷ $136,230 = 50% of DSI’s total revenue and with a net margin of 58% - 47% = 11%. The key to local large store profitability is sales of a large percentage (80%) of regular product. The cost-to-serve percentage is 47%. This could be reduced as for customer type 2 by increasing the order size from the current level of14,400,000 ÷ 120,000 = 120 cases per order. But a dramatic improvementshould not be expected. In general, local large stores are sustaining DSI’sbusiness and their loyalty should be cultivated.•Customer type 4 – Specialty stores. Specialty stores have a low gross margin of 22% coupled with a very large cost-to-serve percent of 106%! Although thesestores do not account for a significant portion of DSI’s revenue the companyshould rationalize their business. Several actions could be suggested. One is to charge a premium for all high-security products. The vast majority of theseproducts are sold to specialty stores with only marginal sales to mega and local small stores. Another action is to adopt a customer loyalty program based onvolume of sales. The list price of $7.25 per case would apply to customers with sales volumes less than a specified level. Most of DSI’s customers would qualify for discounts (similar to those currently existing) so prices would not besignificantly different. For specialty stores, prices would increase dramatically.This may result in losing specialty-store business so DSI needs to decide is this isa direction they wish to consider.Copyright ©2011 Pearson Education 473Exhibit 12-55A (Units and dollars are in thousands.)C u s t o m e r T y p eProductRegular Short Fragile Bulk HighSecurity Singles Total Gross Profit PercentageProduct mix percentage 60% 5% 5% 20% 5% 5% 100% Cases sold 4,608 384 384 1,536 384 3847,680Total Revenue$ 21,888 $ 1,824$ 1,824$7,296$ 1,824 $ 1,824 $36,480Gross Profit per Case $ 3.28 $ 1.58 $ 2.74 $(1.44)$ 0.54 $ (5.30)1Total Gross Profit$ 15,114 $ 607 $ 1,052 $(2,212)$ 207 $(2,035)$12,733 35%Product mix percentage 50% 5% 5% 30% 8% 2% 100% Cases sold3,000 300 300 1,800 480 120 6,000 Total Revenue @ 4.75/case $ 14,250 $ 1,425 $ 1,425 $ 8,550 $ 2,280 $ 570 $28,500 Gross Profit per Case $ 3.28 $ 1.58 $ 2.74 $ (1.44) $ 0.54 $ (5.30)2Total Gross Profit$ 9,840 $ 474 $ 822 $(2,592) $ 259 $ (636)$ 8,167 29%Product mix percentage 80% 0% 10% 10% 0% 0% 100%Cases sold 11,520 -1,4401,440--14,400Total Revenue @ 4.75/case $ 54,720 $ - $ 6,840 $ 6,840 $ - $ - $68,400Gross Profit per Case $ 3.28 $ 1.58 $ 2.74 $ (1.44) $ 0.54 $ (5.30)3Total Gross Profit$ 37,786 $ - $ 3,946 $(2,074) $ - $ - $39,658 58%Product mix percentage 10% 20% 0% 0% 70% 0% 100% Cases sold 60 120 - - 420-600Total Revenue @ 4.75/case $ 285 $ 570 $ - $ - $ 1,995 $ - $ 2,850 Gross Profit per Case $ 3.28 $ 1.58 $ 2.74 $ (1.44)$ 0.54 $ (5.30)4Total Gross Profit $ 197$ 190$ -$ -$ 227$ - $ 61322%Exhibit 12-55B (Units and dollars are in thousands.)ActivityO r d e r P r o c e s s i n gC u s t o m e r S e r v i c eO r d e r C h a n g e sC o r p o r a t e S u p p o r tR e g u l a r S c h e d u l i n gE x p e d i t e d S c h e d u l i n gS h i p p i n gT r u c k D e l i v e r yP a r c e l D e l i v e r y Cost DriverO r d e r sL a b o r H o u r sN u m b e r o f C h a n g e sL a b o r H o u r sO r d e r sO r d e r sP a l l e t sD e l i v e r i e sD e l i v e r i e sC u s t o m e r T y p eCost/DriverUnit $27.49 $43.34$32.63$51.66$5.83 $19.44 $6.60 $167.55 $23.89Total Driver Units3218.73.2 - 29 3 41625.6 1.6 Cost to Serve $879.68 $810.46$104.42-$169.07$58.32$2,745.6$4,289.28$38.22$9,095.05Revenue (See Exhibit 12-55A) $36,480.001 Cost-to-Serve Percentage24.9%Driver Units 80 100 8 20 72 8 640 68 8Cost to Serve $2,199.2 $4,334$261.04$1,033.2 $419.76$155.52$4,224$11,393.4$191.12$24,211.24Revenue (See Exhibit 12-55A) $28,500.02Cost-to-Serve Percentage85.0%Exhibit 12-55B (continued)ActivityO r d e r P r o c e s s i n gC u s t o m e r S e r v i c eO r d e r C h a n g e sC o r p o r a t e S u p p o r tR e g u l a r S c h e d u l i n gE x p e d i t e d S c h e d u l i n gS h i p p i n gT r u c k D e l i v e r y P a r c e l D e l i v e r y Cost DriverO r d e r sL a b o r H o u r sN u m b e r o f C h a n g e sL a b o r H o u r sO r d e r sO r d e r sP a l l e t sD e l i v e r i e sD e l i v e r i e sC u s t o m e r T y p eCost/DriverUnit $27.49 $43.34$32.63$51.66$5.83 $19.44 $6.60 $167.55 $23.89TotalDriver Units 120 70 2.4 80 108 12 840 90 6Cost to Serve$3,298.8 $3,033.8 $78.31$4,132.8 $629.64 $233.28 $5,544$15,079.5$143.34$32,173.47Revenue (See Exhibit 12-55A) $68,400.03 Cost-to-Serve Percentage47.0%Driver Units 12 30 1.2 0 10 2 60 4.8 2.4Cost to Serve $329.88$1,300.2 $39.16- $58.3 $38.88 $396 $804.24 $57.34$3,023.99Revenue (See Exhibit 12-55A) $2,850.004 Cost-to-Serve Percentage106.1%CUSTOMER PROFITABILITYCT3, 47%, 58%0%10%20%30%40%50%60%70%80%90%100%0%10%20%30%40%50%60%70%80%90%100%110%120%COST-TO-SERVE PERCENTAGEG R O S S P R O F I T P E R C E N T A G EExhibit 12-55CCopyright ©2011 Pearson Education 478。
管理会计第15版英文版答案021、He _______ getting up early. [单选题] *A. used toB. is used to(正确答案)C. is usedD. is used for2、85.You’d better? ? ? ? ? a taxi, or you’ll be late. [单选题] *A.take(正确答案)B.takingC.tookD.to take3、John is quite _______. He likes to attend activities in?his spare time. [单选题] *A. active(正确答案)B. quietC. lazyD. honest4、--Henry treats his secretary badly.--Yes. He seems to think that she is the _______ important person in the office. [单选题] *A. littleB. least(正确答案)C. lessD. most5、The flowers _______ sweet. [单选题] *A. tasteB. smell(正确答案)C. soundD. feel6、The market economy is quickly changing people’s idea on_____is accepted. [单选题] *A.what(正确答案)B.whichC.howD.that7、Jeanne's necklace was _____ 500 francs at most. [单选题] *A. worthyB. costC. worth(正确答案)D. valuable8、Just use this room for the time being ,and we’ll offer you a larger one _______it becomes available [单选题] *A. as soon as(正确答案)B unless .C as far asD until9、78.According to a report on Daily Mail, it’s on Wednesday()people start feeling really unhappy. [单选题] *A. whenB. whichC. whatD. that(正确答案)10、I’d like to know the _______ of the club. [单选题] *A. schedule(正确答案)B. schoolC. menuD. subject11、( ) What _____ fine weather we have these days! [单选题] *A. aB. theC. /(正确答案)D. an12、The scenery is so beautiful. Let’s _______. [单选题] *A. take photos(正确答案)B. take mapsC. take busD. take exams13、He can’t meet his friends tonight because he _______ do homework. [单选题] *A. has to(正确答案)B. needC. have toD. don’t have to14、While my mother _______ the supper, my father came back. [单选题] *A. cooksB. is cookingC. was cooking(正确答案)D. has cooked15、46.The pants look cool.You can ________. [单选题] *A.try it onB.try on itC.try them on(正确答案)D.try on them16、Its’time to go to bed. _______ your computer, please. [单选题] *A. Turn onB. Turn inC. Turn off(正确答案)D. Turn down17、He prefers to use the word “strange”to describe the way()she walks. [单选题] *A. in which(正确答案)B. by whichC. in thatD. by that18、He is a student of _______. [单选题] *A. Class SecondB. the Class TwoC. Class Two(正确答案)D. Second Two19、( ) It ___ the Chinese people 8 years to build the Dam. [单选题] *A. took(正确答案)B. costsC. paidD. spends20、My father and I often go ______ on weekends so I can ______ very well. ()[单选题] *A. swim; swimmingB. swims; swimC. swimming; swimmingD. swimming; swim(正确答案)21、75.As a student in Senior Three, I must work hard.(), I should take exercise to strengthen my body.[单选题] *A.OtherwiseB.Meanwhile(正确答案)C.ThereforeD.Thus22、The huntsman caught only a()of the deer before it ran into the woods. [单选题] *A. gazeB. glareC. glimpse(正确答案)D. stare23、--Don’t _______ too late, or you will feel tired in class.--I won’t, Mum. [单选题] *A. call upB. wake upC. stay up(正确答案)D. get up24、5 He wants to answer the ________ because it is an interesting one. [单选题] * A.problemB.question(正确答案)C.doorD.plan25、A brown bear escaped from the zoo, which was a()to everyone in the town. [单选题] *A. HarmB. violenceC. hurtD. threat(正确答案)26、He went to America last Friday. Alice came to the airport to _______ him _______. [单选题] *A. take; offB. see; off(正确答案)C. send; upD. put; away27、This kind of work _______ skills and speed. [单选题] *A. looks forB. waits forC. calls for(正确答案)D. cares for28、A survey of the opinions of students()that they admit several hours of sitting in front of the computer harmful to health. [单选题] *A. show;areB. shows ;is(正确答案)C.show;isD.shows ;are29、My English teacher has given us some _______ on how to study English well. [单选题] *A. storiesB. suggestions(正确答案)C. messagesD. practice30、I used to take ____ long way to take the bus that went by ____ tunnel under the water. [单选题] *A. a, aB. a. theC. a, /(正确答案)D. the, a。
![亨格瑞成本与管理会计(中英第15版)中文PPT (11)[39页]](https://uimg.taocdn.com/6577b6349b89680202d825c7.webp)
亨格瑞管理会计英文第15版答案11CHAPTERllCapitalBudgetin ; 1. ; Thepresentvalueis$480,00(a)$480,000=annualpaymen ; annualpayment=$480,0004- 1 annualpaymcnt=$480,000 4- 9 ; annualpayment=$480,000 4- 8 armualpaymcnt 二$480, 0004-8; anCHAPTER 11 Capital Budgeting1.The present value is $480, 000 and the annual payments are an annuity, requiring use of Table 2:(a)$480,000 = annual payment X 11.2578 annual payment 二 $480, 000 4- 11. 2578 二 $42, 637 (b) $480, 000 二 annual payment X 9.4269annual payment = $480, 000payment X 8.0552 annual payment二 $480,000payment X 8.5595 annual payment= $480, 000 payment X 7.6061 annual payment = $480, 000payment X 6.8109 annual payment= $480, 000 4- 6.8109 =$70,475 (a) Total payments=30 X $50,918 = $1,527,540Total interest paid= $1, 527, 540- $480, 000 = $1, 047, 540 2.3.(b) Total payments 二 15 X $63, 107= $946, 605 Total interest paid 二$946, 605 一 $480, 000 = $466, 6059. 4269 = $50,918 (c) $480, 000 = annual8. 0552 二$59, 589 (a)$480, 000 = annual 8. 5595 二 $56, 078 (b) $480, 000 = annual 7. 6061 = $63, 107 (c) $480, 000 二 annualmin.) Buy. The net present value is positive.Initial outlay *Present value of cash operating savings, from12-year, 12% column of Table 2, 6. 1944 X $5, 000 Net present value$ (21,000) * The trade-in allowance really consists of a $5,000 adjustme nt of the sei ling price and a bona fide $10,000 cash al Iowa neo for the old equipment ・ The relevant amo unt is the incremental cash outlay, $21,000. The book value is irrelevant・ min.)Copyright ?2011 Pearson Education11.NPV @ 10% = 10, 000 X 3. 7908 = $37, 908 - $36, 048 = $1, 860 NPV @ 12% =10, 000 X 3. 6048 = $36, 048 - $36, 048 = $0NPV @ 14% = 10, 000 X 3.4331 = $34, 331 - $36, 048 = $(1,717)The IRR is the interest rate at which NPV 二$0; therefore, from requirement 1 we know that IRR 二12%・The NPV at the company? s cost of capital, 10%, is positive, so the project should be accepted・The TRR (12%) is greater than the company' s cost of capital (10%), so the project should be accepted・ Note that the IRR and NPV models give the same decision.2.3.4.min.)Payback period is $36, 000 $10, 000 = 3.6 years・ It is not a good measure of profitabi1ity because it ignores returns beyond the payback period and it does not account for the time value of money.NPV = $5, 114. Accept the proposal because NPV is positive・ Computation: NPV 二($10, 000 X 4. 1114) - $36,000 =$41, 114 一$36, 000 = $ 5, 114 2.3. ARR 二(Increase in average cash f 1 ow - Increase in depreciation)4- Initial investmenl二($10, 000 - $6, 000) 一$36, 000 二11. 1%min.)Salaries $49, 920 (a) $41, 600(b) $ 8,320 Overtime 1, 728(c) — 1,728 Repairs and maintenanee 1,800 1,050 750Toner, supplies, etc. Total annual cash outflows(a) ($ 8 X 40 hrs.) X 52 weeks X 3 employees 二$320 X 52 X 3 =$49,920 (b) ($10 X 40 hrs.) X 52 weeks X 2 employees = $400 X 52 X 2 二$41, 600 (c) ($12 X 4 hrs.) X 12 months X 3 machines =$ 48 X 12 X 3 = $ 1,728Purchase of Cannon machines $ -- $50,000 $50,000Copyright ?2011 Pearson Education2 1.Sale of Xerox machines Training and remodeling Total 一一-3,000-3,000 Copyright ?2011 Pearson Education 3All numbers are expressed in Mexican pesos・ 2. 18% Total Sketch ofRelevant Cash Flows (in thousands) Cash operating savings:* ・847583,902 99,000 10& 900 119, 790 131,769 .4371 144,946 Income tax savings fromdepreciation not changed by inflation, see 1 3.1272 33,600 33, 600 33, 60033,600 33,600 Required outlay at time zero 1.0000 Net present value^Amounts are computed by multiplying (150,000 X .6) = 90, 000 by 1. 10, 1. 102, 1. 10 3, etc.Copyright ?2011 Pearson Education 461PV Present of $1.00 Value ofTOTAL PROJECT APPROACH: Cannon:Init. cash outflow 1.0000 $ (51,000) Oper. cash flows (45,950) (45, 950) (45,950) (45, 950) (45, 950) Total $(216, 641)Xerox:Oper. cash flows 3. 6048 (57, 048) (57, 048) (57, 048) (57, 048) (57, 048)Differenee in favor of retaining XeroxINCREMENTAL APPROACH: Initial investment 1.0000 $(51,000) Annual operatingcash savings 3. 6048 11, 098 11, 098 11, 098 11, 098 11, 098 Net present valueof purchase 2. The Xerox machines should not be replaced by the Cannonequipment. Net savings = (Present value of expenditures to retain Xeroxmachines) 1 ess (Present value of expenditures toconvert to Cannon machines)二$205, 647 - $216,641 二$ (10, 994) 3. a. How flexible is the new machinery? Will it be useful only for the presently intended functions, or can it beeasilyadapted for other tasks that may arise over the next 5 years?b. What psychological effects will it have on various interested parties? Copyright ?2011 Pearson Education。
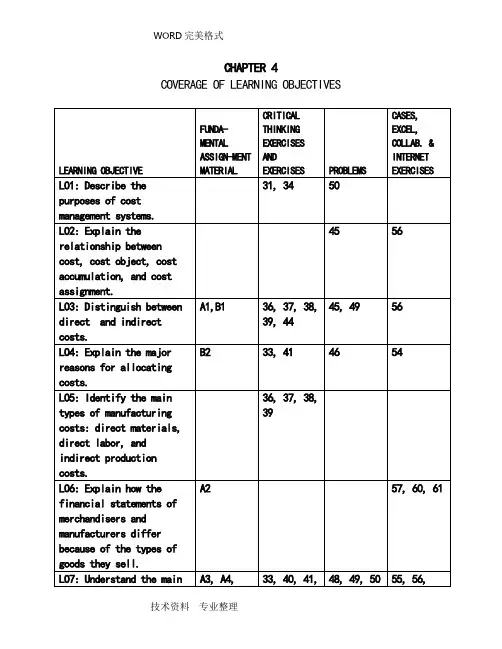
CHAPTER 4 COVERAGE OF LEARNING OBJECTIVESCHAPTER 4Cost Management Systems and Activity-Based Costing4-A1 (20-30 min.)See Table 4-A1 on the following page.4-A2 (25-30 min.)1. Merchandise Inventories, 1,000 devices @ $97 $97,0002. Direct materials inventory $ 40,000Work-in-process inventory 0 Finished goods inventory 97,000 Total inventories $137,000 3.NILE ELECTRONICS PRODUCTSStatement of Operating IncomeFor the Year Ended December 31, 20X9Sales (9,000 units at $170) $1,530,000 Cost of goods sold:Beginning inventory $ 0Purchases 970,000Cost of goods available for sale $ 970,000Less ending inventory 97,000Cost of goods sold (an expense) 873,000 Gross margin or gross profit $ 657,000 Less other expenses: selling & administrative costs 185,000 Operating income (also income before taxesin this example) $ 472,000TABLE 4-A1STATEMENT OF OPERATING INCOME OPERATING INCOME BY PRODUCT LINEEXTERNAL REPORTING PURPOSE INTERNAL STRATEGIC DECISION MAKING PURPOSECustom Large SmallDetailed Std. Std. Cost Type, Assignment Method Sales $155,000 $30,000 $45,000 $80,000Cost of goods sold:Direct material 40,000 5,000 15,000 20,000 Direct, Direct TraceIndirect manufacturing 41,000 28,0001 5,000 8,000 Indirect, Alloc. – Mach. Hours81,000 33,000 20,000 28,000Gross profit 74,000 (3,000) 25,000 52,000Selling and administrative expenses:Commissions 15,000 1,500 3,500 10,000 Direct, Direct Trace Distribution to warehouses 10,400 1,0002 3,000 6,400 Indirect, Allocation - Weight Total selling and admin. expenses 25,400 2,500 6,500 16,400Contribution to corporate expensesand profit 48,600 $(5,500) $18,500 $35,600Unallocated expenses:Administrative salaries 8,000Other administrative expenses 4,000Total unallocated expenses 12,000Operating income before tax $ 36,6001 Total machine hours is 1,400 + 250 + 400 = 2,050. Indirect manufacturing cost per machine hour is then $41,000 ÷ 2,050 = $20. The al location to custom detailed is $20 × 1,400 machine hours = $28,000.2 Total weight shipped is 25,000 kg + 75,000 kg + 160,000 kg = 260,000 kg. Indirect distribution costs per kilogram is then $10,400 ÷ 260,000 kg = $0.04. The allocation to custom detailed is $0.04 × 25,000 kg = $1,000.技术资料专业整理4. ORINOCO, INC.Statement of Operating IncomeFor the Year Ended December 31, 20X9Sales (9,000 units at $170)$1,530,000Cost of goods manufactured and sold:Beginning finished goods inventory $ 0Cost of goods manufactured:Beginning WIP inventory $ 0Direct materials used 530,000Direct labor 290,000Indirect manufacturing 150,000Total mfg. costs to account for $970,000Less ending work-in-process inventory 0 970,000Cost of goods available for sale $970,000Less ending finished goods inventory 97,000Cost of goods sold (an expense) 873,000Gross margin or gross profit $ 657,000 Less other expenses: selling and administrative costs 185,000Operating income (also income before taxesin this example) $ 472,0005. The balance sheet for the merchandiser (Nile) has just one line forinventories, the ending inventory of the items purchased for resale.The balance sheet for the manufacturer (Orinoco) has three items:direct materials inventory, work-in-process inventory, and finishedgoods inventory.The income statements are similar except for the computation of cost of goods available for sale. The merchandiser (Nile) simply showspurchases for the year plus beginning inventory. In contrast, themanufacturer (Orinoco) shows beginning work-in-process inventory plusthe three categories of cost that comprise manufacturing cost (directmaterials used, direct labor, and factory (or manufacturing) overhead)and then deducts the ending work-in-process inventory. The manufacturer then adds the beginning finished goods inventory to this cost of goodsmanufactured to get the cost of goods available for sale.6. The purpose is providing aggregate measures of inventory value and costof goods manufactured for external reporting to investors, creditors,and other external stakeholders.4-A3 (10-15 min.)There can be many justifiable answers for each item other than thelisted cost driver and behavior. The purpose of this exercise is togenerate an active discussion regarding those chosen by First Bank’smanagers. One point that should be emphasized is that many timesmanagers choose cost drivers that are not the most plausible or reliable because of lack of data availability. Cost drivers are also used as abasis to allocate activity and resource costs and so the availability of data is often an important consideration.ActivityOr CostResource Cost Driver Behaviora.* R Number of square feet Fb.** R Number of person hours Fc. R Number of computer transactions Vd. A Number of schedulese. R Number of person hours Ff. R Number of loan inquiries Vg.*** A Number of investmentsh. A Number of applicationsi. R Number of person hours Vj. R Number of minutes Vk. R Number of person hours Fl. A Number of loans* An argument can be made that maintenance of the building is an activity.If this was the case, resources such as supplies and labor would be resources consumed, and several resource cost drivers would be needed. In addition, a separate resource and associated cost driver would be needed for insurance costs. However, the company had a contract for maintenance (fixed price), so this was a fixed-cost resource that was added to other occupancy costs such as insurance. The cost driver chosen for all these occupancy costs was square feet occupied by the various departments.** Normally, the cost driver used for any labor resource is person hours.It is assumed that the staff person hours used are regular hours rather than overtime or temporary labor hours. Thus, the cost is fixed with respect to changes in hours used. As the hours used increases (decreases) theutilization of the resources increases (decreases) and eventually, management will need to make a decision whether to expand capacity (or whether to cutback on labor). This is an example of a step cost that is fixed over wideranges of cost-driver level.*** Students may try to determine the cost behavior of activities even thoughthe problem requirements do not ask for it. Point out that activities almostalways have mixed cost behavior because they consume various resources. Someof these are fixed-cost and others variable-cost resources. For example, theactivity “research to evaluate a loan application” consumes such fixed-costresources as manager labor time and computers (assumed owned by the bank).This activity also consumes variable-cost resources such as telecommunicationstime and external computing services.4-A4 (20-30 min.)1. The first step is to determine the cost per cost-driver unit for eachactivity:Monthly Cost- Cost perManufacturing Driver DriverActivity [Cost driver] Overhead Activity UnitMaterial Handling [Direct materials cost] $12,000 $200,000$ 0.06Engineering [Engineering change notices] 20,000 20 1,000.00Power [Kilowatt hours] 16,000 400,000 0.04Total Manufacturing Overhead $48,000Next, the costs of each activity can be allocated to each of the threeproducts:PHYSICAL FLOW / ALLOCATED COSTCost Senior Basic DeluxeMaterial Handling$.06 × 25,000 = $1,500$.06 × 50,000 = $ 3,000$.06 × 125,000 = $ 7,5 Engineering $1,000 × 13 = 13,000$1,000 × 5 = 5,000$1,000 × 2 = 2,000Power $.04 × 50,000 = 2,000$.04 × 200,000 = 8,000$.04 × 150,000 = 6,000 Total $16,500 $16,000 $15,5002. Overhead rate based on direct labor costs:Rate = Total manufacturing overhead ÷ Total direct labor cost= $48,000 ÷ $8,000 = $6.00/DL$Overhead allocated to each product is:Senior: $6.00 × 4,000 = $24,000Basic: $6.00 × 1,000 = 6,000Deluxe: $6.00 × 3,000 = 18,000Total $48,000Notice that much less manufacturing overhead cost is allocated to Basic using direct labor as a cost driver. Why? Because Basic uses only asmall amount of labor but large amounts of other resources, especially power.3. The product costs in requirement 1 are more accurate if the costdrivers are good indicators of the causes of the costs -- they are both plausible and reliable. For example, kilowatt hours is certainly abetter measure of the cost of power costs than is direct labor hours.Therefore, the allocation of power costs in requirement 1 is certainly better than in requirement 2. Materials handling and engineering arelikewise more plausible. A manager would be much more confident in the manufacturing overhead allocated to products in requirement 1.Remember, however, that there are incremental costs of data collection associated with the more accurate ABC system. The benefit/costcriteria must be applied in deciding which costing system is “best.”4-B1 (20-30 min.)See Table 4-B1 on the following page.4-B2 (25-30 min.)1. $1,080,000 ÷ 45,000 hours = $24 per direct-labor hour2. (a) $585,000 ÷ 15,000 hours = $39 per direct-labor hour(b) $495,000 ÷ 30,000 hours = $16.50 per direct-labor hour3. (a) $585,000 ÷ 97,500 hours = $6 per machine hour(b) $495,000 ÷ 30,000 hours = $16.50 per direct-labor hour4. (a) $24 × (1.0 + 14.0) = $360.00$24 × (1.5 + 3.0) = $108.00$24 × (1.3 + 8.0) = $223.20(b) ($39 × 1.0) + ($16.50 × 14.0) = $39.00 + $231.00 = $270.00($39 × 1.5) + ($16.50 × 3.0) = $58.50 + $ 49.50 = $108.00($39 × 1.3) + ($16.50 × 8.0) = $50.70 + $132.00 = $182.70(c) ($6 × 12.0) + ($16.50 × 14.0) = $ 72.00 + $231.00 = $303.00($6 × 17.0) + ($16.50 × 3.0) = $102.00 + $ 49.50 = $151.50($6 × 14.0) + ($16.50 × 8.0) = $ 84.00 + $132.00 = $216.00(d) First consider using departmental instead of firm-wide rates (partb vs. part a). Departmental rates that use direct-labor hours asthe base decrease the cost applied to units of A and C and leave B unaffected. Other products that use relatively less assembly time will increase in cost. Now examine changing to a base of machine hours in machining (part c vs. part a). Product B is the only one with an increase in cost in (c) compared to (a). Why? Because B's uses only 16% of the direct labor hours used for A, B, and C, so it is is allocated only 16% of the costs allocated on the basis ofdirect labor hours. But it uses 40% of the machine hours, andthere is allocated 40% of costs that are allocated on the basis on machine hours. Therefore, it receives relatively more costs with a base of machine hours than with a base of direct-labor hours.TABLE 4-B1STATEMENT OF OPERATING INCOME OPERATING INCOME BY PRODUCT LINEThousands of Dollars Lawn HandScooter Mower Tool Cost Type,Parts Parts Parts Assignment Method Sales $990 $350 $380 $260Cost of goods sold:Direct material 400 175 125 100 Direct, Direct Trace Indirect manufacturing 94 68 1 14 12 Indirect – Mach.Hrs494 243 139 112Gross profit 496 107 241 148Selling and administrative expenses:Commissions 55 25 20 10 Direct, Direct Trace Distribution to warehouses 150 20 2 80 50 Indirect - Weight Total selling and administrative expenses 205 45 100 60Contribution to corporate expenses and profit 291 $ 62 $141 $ 88Unallocated expenses:Corporate salaries 11Other general expenses 17Total unallocated expenses 28Operating income before tax $2631 Total machine hours is 8,500 + 1,750 + 1,500 = 11,750. Indirect manufacturing cost per machine hour isthen $94,000 ÷ 11,750 = $8. The allocation to scooter parts is $8 × 8,500 machine hours = $68,000.2 Total weight shipped is 100,000 kg + 400,000 kg + 250,000 kg = 750,000 kg. Indirect distribution costs perkilogram is then $150,000 ÷ 750,000 kg = $0.20. The allocation to scooter parts is $0.20 × 100,000 kg = $20,000.技术资料专业整理4-B3 (30-35 min.)1.The existing system allocates all costs based on direct labor cost. The rate for allocating indirect production costs is:Estimated indirect production cost ÷ Estimated direct labor cost= ¥24,500,000 ÷ ¥35,000,000 = 70%That is, each time ¥1 is spent on direct labor, Watanabe adds ¥0.7 of indirect production cost to the cost of the product.2. Under an ABC system, Watanabe would allocate indirect production costs separately for each activity. This would result in the following four allocation rates:Receiving: Receiving co sts ÷ Direct material cost=¥4,800,000 ÷ 60,000,000 = ¥0.08 per ¥1of dir. mat. Assembly: Assembly costs ÷ Number of control units=¥13,800,000 ÷ 92,000 = ¥150 per control unitQual. Control: Quality control cost ÷ QC hours=¥1,800,000 ÷ 600 = ¥3,000 per QC hourShipping: Shipping cost ÷ # of boxes shipped=¥4,100,000 ÷ 8,200 = ¥500 per box shipped3. (a) The cost will contain 3 components (in thousands of yen):Direct material ¥ 8,000Direct labor 2,000Indirect production cost (¥2,000 × .7 = 1,400) 1,400Total cost ¥11,400Price (¥11,400 × 1.3)¥14,820(b) The cost will have 7 components, 4 of them allocating indirect production costs (totals in thousands of yen):Direct materials ¥ 8,000Direct labor 2,000Receiving (¥0.08 × 8,000)¥640Assembly (¥150 × 5,000)750Quality control (¥3,000 × 50)150Shipping (¥500 × 600) 300Total indirect production cost 1,840Total cost ¥11,840 Price (11 ,840 × 1.3)¥15,3924. The order from Nissan requires a relatively large amount of receiving, quality control, and shipping resources compared to the relative amount of labor required. This makes its indirect production costs are relatively expensive relative to the labor required. The following illustrates why an allocation on the basis of labor cost results in less costs than allocations based on the four activities:Budgeted Cost- Nissan Cost- NissanActivity Allocation Base Allocation Base Percentage Direct materials 60,000,000 8,000,000 13.3%Direct labor 35,000,000 2,000,000 5.7 Receiving 60,000,000 8,000,000 13.3 Assembly 92,000 5,000 5.4 Quality control 600 50 8.3 Shipping 8,200 600 7.3Using the single direct-labor cost-allocation base, this order would receive 5.7% of all indirect production costs. The main reason that indirect production costs for this order under the ABC system are relatively high is the large relative cost of materials that drives a large allocation (13.3%) of receiving costs to this order. The allocations of both quality control and shipping costs are slightly larger that they would be using a direct-labor cost-allocation base, while the allocation of assembly costs is slightly smaller.4-B4 (50-60 min.)1. A summary of the analyses follows.Pen Cell-PhoneCasings Casings CompanyBase Gross Profit Percentage* 1.25% 38.75% 8.07% Plan Gross Profit Percentage** 10.80% 37.20% 17.40% Support of Product Manager? Strong NoneSupport of President? Moderate* See Exhibit 4-6 on p. 136 of the text.** See Panel B of Exhibit 4-B4 that follows.Exhibit 4-B4, Panels A and B on the following pages can be used to explain the impact of the controller’s idea using the process map of the traditional costing system and the related financial reports. Notice that the $80,000 annual decrease in the cost of engineers needs to be converted to a $20,000 quarterly savings. The controller’s idea will result in an increase of 9.55%in the gross profit of the pen-casings line but a decrease of 1.55% in thecell-phone line. The product manager of pen casings would probably give strong support to the idea but the cell-phone casings manager would most likely not support the idea.Although the company-level gross profit margin improves, the president’s support may not be strong. Why? There is not a strong consensus among product-line managers. Top management is normally hesitant to support actions that do not have the unanimous support among product-line managers unless there is solid evidence of material improvement in profitability. While the current loss would be reversed, the return on sales is still nominal at 3,500 ÷ $480,000 = .73%.Exhibit 4-B4: Panel AProcess Map of Traditional Cost System[Direct Labor Hours = 4,500 +Exhibit 4-B4: Panel BPRO-FORMA FINANCIAL REPORTS:TRADITIONAL COST ALLOCATION SYSTEMSTATEMENT OF OPERTING INCOME CONTRIBUTION TO CORPORATE COSTSAND PROFIT [EXTERNAL REPORTING PURPOSE] [INTERNAL STRATEGIC DECISION MAKINGAND OPERATIONAL-CONTROL PURPOSE]Pen Casings Cell Phone CasingsSales $480,000 $360,000 $120,000 1 Cost of goods sold:Direct material 46,500 22,500 24,000 2 Direct labor 150,000 135,000 15,000Indirect manufacturing 200,000 163,636 3 36,364 4 Cost of goods sold 396,500 321,136 75,364 Gross profit 83,500 $ 38,864 $ 44,636 Corporate expenses (unallocated) 80,000Operating income $ 3,500Gross profit margin 17.40% 10.80% 37.20%1. $80,000 × .75 × 22. $12,000 × 23. $200,000 × [4,500/(4,500 + 1,000)]4. $200,000 × [1,000/(4,500 + 1,000)]5. $83,500/$480,000技术资料专业整理Perhaps the most important factor bearing on the president’s support is lack of confidence in the accuracy of the cost and hence gross margin figures. She probably will inquire whether the shift in the consumption percentages by the two activities is captured by the traditional costing system. Does the change in allocation rates from 90:10 to 82:18 based on direct labor hour changes accurately capture the impact of the operational changes? An informal analysis of the controller’s idea might look like the following table.Based on the informal analysis, the President probably would expect the profitability of cell-phone casings to improve and the profitability of pen casings to be unaffected. This disagrees with the numerical analysis. Given the propensity of managers to embrace numerical results, less weight will likely be given this analysis compared to the “objective” numbers. As a result, she may question the validity of the numerical analysis as well as the value of the traditional costing system!Finally, the focus of improvement efforts should be directly on the pen-casing product line. This initiative deals mostly with the cell-phone line. What can be done to improve profitability of the pen casings? Can prices be raised without losing too much volume? Can operational improvements be made to lower the indirect manufacturing costs? The controller’s idea is worthy of some support but it does not address the profitability issue head on.2. Exhibit 4-B4, Panel C on the following page is a process map that can be used to explain the impact of the controller’s idea. Panel D at the end of the solution provides a detailed evaluation of the controller’s idea.Pen Cell-PhoneCasings Casings Company Base Gross Profit Percentage* 16.22% (28.63%) 8.07% Plan Gross Profit Percentage** 17.26% 17.81% 17.40% Support of Product Manager? Neutral StrongSupport of President? Strong* See the table on p. 139 of the text.** See panel D of Exhibit 4-B4 that follows.The controller’s idea will result in a slight increase in the gross profit of the pen-casings line but a dramatic turnaround in the profitability of thecell-phone line. The product manager of pen casings would probably be neutral or slightly positive about the idea because the idea does not focus on operational improvements that directly affect the pen-casings line. The cell-phone casings manager would give strong support to the idea – this may save his/her job! The president would strongly support this idea while encouraging all managers involved to keep up the good work. Also, note that the numbers agree with the informal analysis – generating confidence in the integrity of the cost accounting system.Exhibit 4-B4, Panel CProcess Map for ABC SystemExhibit 4-B4: Panel DPRO-FORMA FINANCIAL REPORTS FOR LOPEZ PLASTICS COMPANY:ACTIVITY-BASED COST ALLOCATION SYSTEMSTATEMENT OF OPERTING INCOME CONTRIBUTION TO CORPORATE COSTSAND PROFIT [EXTERNAL REPORTING PURPOSE] [INTERNAL STRATEGIC DECISION MAKINGAND OPERATIONAL-CONTROL PURPOSE]Pen Casings Cell Phone Casings Sales $480,000 $360,000 $120,000 Cost of goods sold:Direct material 46,500 22,500 24,000 Direct labor 150,000 135,000 15,000Processing activity 154,000 126,000 128,000 2Production support activity 46,000 14,375 3 31,625 4 Cost of goods sold 396,500 297,875 98,625 Gross profit 83,500 $ 62,125 $ 21,375 Corporate expenses (unallocated) 80,000Operating loss $ 3,500Gross profit margin 17.26% 17.81%1. $154,000 × [4,500 labor hours/(4,500 labor hours + 1,000 labor hours)]2. $154,000 × [1,000 labor hours/(4,500 labor hours + 1,000 labor hours)]3. $46,000 × [5 distinct parts/(5 distinct parts + 11 distinct parts)]4. $46,000 × [11 distinct parts/(5 distinct parts + 11 distinct parts)]技术资料专业整理3. As vice president, you probably are pleased with the new ABC system. The cost drivers that are used to allocate activity costs appear to be plausible and reliable and thus probably represent a sound cause-effect model of operations. This will improve both the accuracy of product costing and operating managers’ control over costs. Operating managers will be pleased with the ABC system because it helps them understand how their day-to-day work impacts costs and profits. From a behavioral perspective, this should behighly motivational.This problem emphasizes the importance of the cost-accounting system to managers. Different systems can result in significantly different management decisions. In this case, the product-line managers’ support for the controller’s idea changes when an ABC system is used to evaluate the idea. Although the company-level gross margins do not change, it is possible thatthe president would strongly support the idea based on ABC data. Why? Neither of the product-line managers is against the idea, and one strongly supports it. In addition, the president may have more confidence in the accuracy of the ABC analysis. The substantial losses of the current quarter have been completely eliminated and the serious profitability problem of the cell-phone casing product line has been reversed.4-1 A cost management system is a collection of tools and techniques that identifies how management’s decisions affect costs. The three purposesof a CMS are to provide1.cost information for operational control,2.cost information for strategic decisions, and3.measures of inventory value and cost of goods manufactured (orpurchased) for external reporting to investors, creditors, and otherexternal stakeholders.4-2 a. The production manager needs operational control information.b. Setting the product mix is a strategic decision.c. The cost of inventory that appears on the balance sheet is information that is used by external investors, creditors, and other stakeholders.4-3 Cost objects are any items for which decision makers desire a separate measurement of costs. They include departments, products, services, territories, and customers.4-4 No. Products are one of the main cost objects for most companies, but departments are also important cost objects because they represent a logical grouping of activities for which managers desire a separate determination of costs.4-5 The major purpose of a detailed cost-accounting system is to measure costs for decision making and financial reporting. Cost accounting systems become more detailed as management seeks more accurate data for decision making.4-6 The two major processes performed by a cost accounting system are cost accumulation and cost assignment. Cost accumulation is collecting costs by some “natural” classification, such as materials or labor, or by activities performed such as order processing or machine processing. Cost assignment is attaching costs to one or more cost objects, such as activities, processes, departments, customers, or products.4-7 Managers make important decisions on a daily basis. They base these decisions in large part on financial data provided by the cost accounting system. So it is critically important that the cost accounting system provide accurate and reliable financial information.4-8 Managers can specifically and exclusively identify direct costs with a given cost object (that is, directly trace them) in an economically feasible way. Indirect costs cannot be so identified. However, managers can usually identify a plausible and reliable cost driver to use to allocate resourcecosts to cost objects that consume the resources. When direct tracing is not economically feasible and a plausible and reliable cost driver cannot be found, costs should remain unallocated.4-9 Yes, the same cost (for example, the department supervisor's salary)can be direct with respect to a department but indirect with respect to the variety of products flowing through a department (e.g., tables, chairs, and cabinets).4-10 Some costs can be physically linked with a department (or a product), but not in an economically feasible way. An example is the use of departmental meters for measuring power usage. Such devices could measure power costs as direct costs of a department. The alternative is to regard factory power costs as indirect costs of individual departments. Managers often decide whether the resulting increased accuracy provided by individual power meters is worth their additional cost; thus, the test of economic feasibility will decide whether a particular cost is regarded as direct or indirect.4-11 The four purposes of cost allocation are (1) to predict the economic effects of strategic and operational control decisions, (2) to obtain desired motivation, (3) to compute income and asset valuations, and (4) to justify costs or obtain reimbursement.4-12 Generally Accepted Accounting Principles (GAAP) require publically-held companies to allocate all production-related costs and only production-related costs to its products for financial reporting to the public.4-13 No. The costs in a cost pool are not physically traced to cost objects. Only direct costs are traced to cost objects. A cost pool contains indirect costs that are allocated to cost objects using a single cost-allocation base.4-14 Some possible terms are reallocate, assign, distribute, redistribute, load, apportion, reapportion, and burden.4-15 For financial statement purposes, the typical accounting system does not allocate costs associated with value-chain functions other than production to the physical units produced. However, for guiding decisions regarding product-pricing and product-mix decisions, many companies allocate all costs, including R&D, design, marketing, distribution, and customer service costs. However, the allocations of these costs may not be embedded in the system that generates financial statements.4-16 Yes. The two criteria that should be met before using any measure as a cost-allocation base are economic plausibility and reliability. A measure should be plausible – make common sense. If managers cannot easily understand the logical relationship between a cost allocation-base and the costs of an activity or resource, managers will perceive the resulting allocations as arbitrary.4-17 Production maintenance costs are normally indirect. Sales commissions normally can be directly traced to specific products. The costs associated with process design are normally unallocated because it is too difficult to identify plausible and reliable cost-allocation bases, although some companies elect to allocate them.4-18 Generally not. They are direct as far as the physical product is concerned, but in accounting for their cost it would usually be impractical (too costly) to keep records of the amount of glue or tacks used in each unit of product. A more feasible method would be to consider these as supplies (indirect materials).4-19 Depreciation related to production activities is a product cost, not a period cost. Hence, it will become an expense as a part of manufacturing cost of goods sold. Thus, depreciation is not always an immediate expense.。
CHAPTER 1Managerial Accounting, the Business Organization, andProfessional Ethics1-A1 Solution:Information is often useful for more than one function, so the following classifications for each activity are not definitive but serve as a starting point for discussion:1. Scorekeeping. A depreciation schedule is used in preparing financialstatements to report the results of activities.2. Problem solving. Helps a manager assess the impact of a purchase decision.3. Scorekeeping. Reports on the results of an operation. Could also beattention directing if scrap is an area that might require management attention.4. Attention directing. Focuses attention on areas that need attention.5. Attention directing. Helps managers learn about the information contained ina performance report.6. Scorekeeping. The statement reports what has happened. Could also beattention directing if the report highlights a problem or issue.7. Problem solving. Assuming the cost comparison is to help the managerdecide between two alternatives, this is problem solving.8. Attention directing. Variances point out areas where results differ fromexpectations. Interpreting them directs attention to possible causes of thedifferences.9. Problem solving. Aids a decision about where to make parts.10. Attention directing and problem solving. Budgeting involves makingdecisions about planned activities -- hence, aiding problem solving. Budgets also direct attention to areas of opportunity or concern --hence, directingattention. Reporting against the budget also has a scorekeeping dimension.1-A2 Solution:1. Budgeted Actual DeviationsAmounts Amounts or Variances Room rental $ 140 $ 140 $ 0Food 700 865 165UEntertainment 600 600 0Decorations 220 260 40UTotal $1,660 $1,865 $205U 2. Because of the management by exception rule, room rental and entertainmentrequire no explanation. The actual expenditure for food exceeded the budget by $165. Of this $165, $150 is explained by attendance of 15 persons morethan budgeted (at a budget of $10 per person for food) and $15 is explained by expenditures above $10 per person.Actual expenditures for decorations were $40 more than the budget. Thedecorations committee should be asked for an explanation of the excessexpenditures.1-29 Solution:1. Controller. Financial statements are generally produced by the controller'sdepartment.2. Controller. Advising managers aids operating decisions.3. Controller. Advice on cost analysis aids managers' operating decisions.4. Treasurer. Analysts affect the company's ability to raise capital, which is theresponsibility of the treasurer.5. Treasurer. Financing the business is the responsibility of the treasurer.6. Controller. Tax returns are part of the accounting process overseen by thecontroller.7. Treasurer. Insurance, as with other risk management activities, is usually theresponsibility of the treasurer.8. Treasurer. Allowing credit is a financial decision.CHAPTER 2INTRODUCTION TO COST BEHAVIOR AND COST-VOLUME RELATIONSHIPS2-A3 Solution:The following format is only one of many ways to present a solution. This situation is reallya demonstration of "sensitivity analysis," whereby a basic solution is tested to see how much it is affected by changes in critical factors. Much discussion can ensue, particularly about the finalthree changes.The basic contribution margin per revenue mile is $1.50 - $1.30 = $.20(1) (2) (3) (4) (5)(1)×(2) (3)-(4)Revenue Cont ri buti on To talMi l es Margi n Pe r Cont ri buti on Fi xed NetSol d Revenue Mi l e Margi n Expen se s In co me 1. 800,000$.20$160,000$120,000$ 40,0002. (a) 800,000.35280,000120,000160,000(b) 880,000.20176,000120,00056,000(c) 800,000.0756,000120,000(64,000)(d) 800,000.20160,000132,00028,000(e) 840,000.17142,800120,00022,800(f) 720,000.25180,000120,00060,000(g) 840,000.20168,000132,00036,0002-B2 Solution:1. $2,300 ÷ ($30 - $10) = 115 child-days or 115 × $30 = $3,450 revenue dollars.2. 176 × ($30 - $10) - $2,300 = $3,520 - $2,300 = $1,2203. a. 198 × ($30 - $10) - $2,300 = $3,960 - $2,300 = $1,660 or (22 × $20) + $1,220 = $440 + $1,220 = $1,660 b. 176 × ($30 - $12) - $2,300 = $3,168 - $2,300 = $868 or $1,220 - ($2 × 176) = $868 c. $1,220 - $220 = $1,000d. [(9.5 × 22) × ($30 - $10)] - ($2,300 + $300) = $4,180 - $2,600 = $1,580e.[(7 × 22) × ($33 - $10)] - $2,300 = $3,542 - $2,300 = $1,2422-B 3 So lu tio n :1.$16)($20$5,000- = $4$5,000= 1,250 units2. Contribution margin ratio:($40,000)$30,000)($40,000- = 25%$8,000 ÷ 25% = $32,0003.$14)($30$7,000)($33,000-+ = $16$40,000 = 2,500 units4. ($50,000 - $20,000)(110%) = $33,000 contribution margin;$33,000 - $20,000 = $13,0005. New contribution margin:$40 - ($30 - 20% of $30)= $40 - ($30 - $6) = $16;New fixed expenses: $80,000 × 110% = $88,000;$16$20,000)($88,000+ = $16$108,000 = 6,750 units2-27 Soluti on:2-38Sol uti on:1. 100% Full 50% FullRoom revenue @ $50 $1,825,000 a$ 912,500 bVariable costs @ $10 365,000 182,500Contribution margin 1,460,000 730,000Fixed costs 1,200,000 1,200,000Net income (loss) $ 260,000 $ (470,000)a 100 × 365 = 36,500 rooms per year36,500 × $50 = $1,825,000b50% of $1,825,000 = $912,5002. Let N = number of rooms$50N -$10N - $1,200,000 = 0N = $1,200,000 ÷ $40 = 30,000 rooms Percentage occupancy = 30,000 ÷ 36,500 = 82.2%2-40 Solution:1. Let R = pints of raspberries and 2R = pints of strawberriessales - variable expenses - fixed expenses = zero net income$1.10(2R) + $1.45(R) - $.75(2R) - $.95(R) - $15,600 = 0$2.20R + $1.45R - $1.50R - $.95R -$15,600 = 0$1.2R - $15,600 = 0 R = 13,000 pints of raspberries2R = 26,000 pints of strawberries2. Let S = pints of strawberries($1.10 - $.75) × S - $15,600 = 0.35S - $15,600 = 0S = 44,571 pints of strawberries3. Let R = pints of raspberries($1.45 - $.95) × R - $15,600 = 0$.50R - $15,600 = 0R = 31,200 pints of raspberries2-42 Solution:Several variations of the following general approach are possible:Sales - Variable expenses - Fixed expenses = Target after-tax net income 1 - tax rateS - .75S - $440,000 =.3)-(1$84,000.25S = $440,000 + $120,000 3-A1 Solution:Some of these answers are controversial, and reasonable cases can be built for alternative classifications. Class discussion of these answers should lead to worthwhile disagreements about anticipated cost behavior with regard to alternative cost drivers.1. (b) Discretionary fixed cost.2. (e) Step cost.3. (a) Purely variable cost with respect to revenue.4. (a) Purely variable cost with respect to miles flown.5. (d) Mixed cost with respect to miles driven.6. (c) Committed fixed cost.7. (b) Discretionary fixed cost.8. (c) Committed fixed cost.9. (a) Purely variable cost with respect to cases of Coca-Cola.10. (b) Discretionary fixed cost.11. (b) Discretionary fixed cost.3-A2 Solution:1. Support costs based on 60% of the cost of materials:Sign A Sign B Direct materials cost $400 $200 Support cost (60% of m ater ial s c o st) $240 $120 Support costs based on $50 per power tool operation:Sign A Sign B Power tool operations 3 6 Support cost $150 $300 2. If the activity analysis is reliable, by using the current method, Evergreen Signs is predicting too much cost for signs that use few power tool operations and is predicting too little cost for signs that use many power tool operations. As a result the company could be losing jobs that require few power tool operations because its bids are too high -- it could afford to bid less on these jobs. Conversely, the company could be getting too many jobs that require many power tool operations, because its bids are too low -- given what the "true" costs will be, the company cannot afford these jobs at those prices. Either way, the sign business could be more profitable if the owner better understood and used activity analysis. Evergreen Signs would be advised to adopt the activity-analysis recommendation, but also to closely monitor costs to see if the activity-analysis predictions of support costs are accurate.3-B2 Solution:Board Z15 Board Q52Mark-up method:Material cost $40 $60Support costs (100%) $40 $60Activity analysis method:Manual operations 15 7Support costs (@$4) $60 $28The support costs are different because different cost behavior is assumed by the two methods. If the activity analyses are reliable, then boards with few manual operations are overcosted with the markup method, and boards with many manual operatio ns are undercosted with the markup method.3-B3 Solution:Variable cost per machine hour =Change in Repair Cost Change in Machine Hours= (P260,000,000 - P200,000,000) (12,000 - 8,000)= P15,000 per machine hourFixed cost per month = total cost - variable cost= P260,000,000 - P15,000 x 12,000= P260,000,000 - P180,000,000= P 80,000,000 per monthor = P200,000,000 - P15,000 x 8,000= P200,000,000 - P120,000,000= P 80,000,000 per month3-32 Solution:1. Machining labor: G, number of units completed or labor hours2. Raw material: B, units produced; could also be D if the company’s purchases do not affect the price of the raw material.3. Annual wage: C or E (depending on work levels), labor hours4. Water bill: H, gallons used5. Quantity discounts: A, amount purchased6. Depreciation: E, capacity7. Sheet steel: D, number of implements of various types8. Salaries: F, number of solicitors9. Natural gas bill: C, energy usage3-34 Solution:1. 2001 2002Sales revenues $57 $116Less: Operating income (loss) (19) 18Operating expenses $76 $ 982. Change in operating expenses ÷ Change in revenues = Variable cost percentage($98 - $76) ÷ ($116 - $57) = $22 ÷ $59 = .37 or 37%Fixed cost = Total cost – Variable cost= $76 - .37 × $57= $55or= $98 - .37 × $116= $55Cost function = $55 + .37 × Sales revenue3. Because fixed costs to not change, the entire additional total contributionmargin is added to operating income. The $57 sales revenue in 2001generated a total contribution margin of $57 × (1 - .37) = $36, which was $19 short of covering the $55 of fixed cost. But the additional $59 of salesrevenue in 2002 generated a total contribution margin of $59 × (1 - .37) = $37 that could go directly to operating income because there was no increase infixed costs. It wiped out the $19 operating loss and left $18 of operatingincome.3-35 Solution:1. Fuel costs: $.40 × 16,000 miles per month = $6,400 per month.2. Equipment rental: $5,000 × 7 × 3 = $105,000 for seven pieces of equipment for three months3. Ambulance and EMT cost: $1,200 × (2,400/200) = $1,200 × 12 = $14,4004. Purchasing: $7,500 + $5 × 4,000 = $27,500 for the month.3-36 Solution:There may be some disagreement about these classifications, but reasons for alternative classifications should be explored.Cost Discretionary Committed Advertising $22,000Depreciation $ 47,000 Company health insurance 21,000 Management salaries 85,000 Payment of long-term debt 50,000 Property tax 32,000 Grounds maintenance 9,000Office remodeling 21,000Research and development 46,000Totals $98,000 $235,000。
![亨格瑞成本与管理会计(中英第15版)中文PPT (16)[30页]](https://uimg.taocdn.com/0e132f0076eeaeaad0f330c7.webp)
第二章产品成本计算Exercises2–1(指教材上的第2章练习第1题,下同)1. Part #72A Part #172CSteel* $ 12.00 $ 18.00Setup cost** 6.00 6.00Total $ 18.00 $ 24.00*($1.00 ? 12; $1.00 ? 18)**($60,000/10,000)Steel cost is assigned by calculating a cost per ounce and then multiplying this by the ounces used by each part:Cost per ounce= $3,000,000/3,000,000 ounces= $1.00 per ounceSetup cost is assigned by calculating the cost per setup and then dividing this by the number of units in each batch (there are 20 setups per year):Cost per setup = $1,200,000/20= $60,0002. The cost of steel is assigned through the driver tracing using the number of ounces of steel, and the cost of the setups is assigned through driver tracing also using number of setups as the driver.3. The assumption underlying number of setups as the driver is that each part uses an equal amount of setup time. Since Part #72A uses double the setup time of Part #172C, it makes sense to assign setup costs based on setup time instead of number of setups. This illustrates the importance of identifying drivers that reflect the true underlying consumption pattern. Using setup hours [(40 ?10) + (20 ? 10)], we get the following rate per hour:Cost per setup hour = $1,200,000/600= $2,000 per hourThe cost per unit is obtained by dividing each part’s total setup costs by the number of units:Part #72A = ($2,000 ? 400)/100,000 = $8.00Part #172C = ($2,000 ? 200)/100,000 = $4.00Thus, Part #72A has its unit cost increased by $2.00, while Part #172C has its unit cost decreased by $2.00.problems2–51. Nursing hours required per year: 4 ? 24 hours ? 364 days* = 34,944*Note: 364 days = 7 days ? 52 weeksNumber of nurses = 34,944 hrs./2,000 hrs. per nurse = 17.472Annual nursing cost = (17 ? $45,000) + $22,500= $787,500Cost per patient day = $787,500/10,000 days= $78.75 per day (for either type of patient)2. Nursing hours act as the driver. If intensive care uses half of the hours and normal care the other half, then 50 percent of the cost is assigned to each patient category. Thus, the cost per patient day by patient category is as follows:Intensive care = $393,750*/2,000 days= $196.88 per dayNormal care = $393,750/8,000 days= $49.22 per day*$525,000/2 = $262,500The cost assignment reflects the actual usage of the nursing resource and, thus, should be more accurate. Patient days would be accurate only if intensive care patients used the same nursing hours per day as normal care patients.3. The salary of the nurse assigned only to intensive care is a directly traceable cost. To assign the other nursing costs, the hours of additional usage would need to be measured. Thus, both direct tracing and driver tracing would be used to assign nursing costs for this new setting.2–61. Bella Obra CompanyStatement of Cost of Services SoldFor the Year Ended June 30, 2006Direct materials:Beginning inventory $ 300,000Add: Purchases 600,000Materials available $ 900,000Less: Ending inventory 450,000*Direct materials used $ 450,000Direct labor 12,000,000Overhead 1,500,000Total service costs added $ 13,950,000Add: Beginning work in process 900,000Total production costs $ 14,850,000Less: Ending work in process 1,500,000Cost of services sold $ 13,350,000*Materials available less materials used2. The dominant cost is direct labor (presumably the salaries of the 100 professionals). Although labor is the major cost of providing many services, it is not always the case. For example, the dominant cost for some medical services may be overhead (e.g., CAT scans). In some services, the dominant cost may be materials (e.g., funeral services).3. Bella Obra CompanyIncome StatementFor the Year Ended June 30, 2006Sales $ 21,000,000Cost of services sold 13,350,000Gross margin $ 7,650,000Less operating expenses:Selling expenses $ 900,000Administrative expenses 750,000 1,650,000Income before income taxes $ 6,000,0004. Services have four attributes that are not possessed by tangible products: (1) intangibility, (2) perishability, (3) inseparability, and (4) heterogeneity. Intangibility means that the buyers of services cannot see, feel, hear, or taste a service before it is bought. Perishability means that services cannot be stored. This property affects the computation in Requirement 1. Inability to store services means that there will never be any finished goods inventories, thus making the cost of services produced equivalent to cost of services sold. Inseparability simply means that providers and buyers of services must be in direct contact for an exchange to take place. Heterogeneity refers to the greater chance for variation in the performance of services than in the production of tangible products.2–71. Direct materials:Magazine (5,000 ? $0.40) $ 2,000Brochure (10,000 ? $0.08) 800 $ 2,800Direct labor:Magazine [(5,000/20) ? $10] $ 2,500Brochure [(10,000/100) ? $10] 1,000 3,500Manufacturing overhead:Rent $ 1,400Depreciation [($40,000/20,000) ? 350*] 700Setups 600Insurance 140Power 350 3,190Cost of goods manufactured $ 9,490*Production is 20 units per printing hour for magazines and 100 units per printing hour for brochures, yielding monthly machine hours of 350 [(5,000/20) + (10,000/100)]. This is also monthly labor hours, as machine labor only operates the presses.2. Direct materials $ 2,800Direct labor 3,500Total prime costs $ 6,300Magazine:Direct materials $ 2,000Direct labor 2,500Total prime costs $ 4,500Brochure:Direct materials $ 800Direct labor 1,000Total prime costs $ 1,800Direct tracing was used to assign prime costs to the two products.3. Total monthly conversion cost:Direct labor $ 3,500Overhead 3,190Total $ 6,690Magazine:Direct labor $ 2,500Overhead:Power ($1 ? 250) $ 250Depreciation ($2 ? 250) 500Setups (2/3 ? $600) 400Rent and insurance ($4.40 ? 250 DLH)* 1,100 2,250Total $ 4,750Brochure:Direct labor $ 1,000Overhead:Power ($1 ? 100) $ 100Depreciation ($2 ? 100) 200Setups (1/3 ? $600) 200Rent and insurance ($4.40 ? 100 DLH)* 440 940Total $ 1,940*Rent and insurance cannot be traced to each product so the costs are assigned using direct labor hours: $1,540/350 DLH = $4.40 per direct labor hour. The other overhead costs are traced according to their usage. Depreciation and power are assigned by using machine hours (250 for magazines and 100 for brochures): $350/350 = $1.00 per machine hour for power and $40,000/20,000 = $2.00 per machine hour for depreciation. Setups are assigned according to the time required. Since magazines use twice as much time, they receive twice the cost: Letting X = the pro?portion of setup time used for brochures, 2X + X = 1 implies a cost assignment ratio of 2/3 for magazines and 1/3 for brochures.Exercises3–11. Resource Total Cost Unit CostPlastic1 $ 10,800 $0.027Direct labor andvariable overhead2 8,000 0.020Mold sets3 20,000 0.050Other facility costs4 10,000 0.025Total $ 48,800 $0.12210.90 ? $0.03 ? 400,000 = $10,800; $10,800/400,000 = $0.0272$0.02 ? 400,000 = $8,000; $8,000/400,000 = $0.023$5,000 ? 4 quarters = $20,000; $20,000/400,000 = $0.054$10,000; $10,000/400,000 = $0.0252. Plastic, direct labor, and variable overhead are flexible resources; molds and other facility costs are committed resources. The cost of plastic, direct labor, and variable overhead are strictly variable. The cost of the molds is fixed for the particular action figure being produced; it is a step cost for the production of action figures in general. Other facility costs are strictly fixed.3–3High (1,400, $7,950); Low (700, $5,150)V = ($7,950 – $5,150)/(1,400 – 700)= $2,800/700 = $4 per oil changeF = $5,150 – $4(700)= $5,150 – $2,800 = $2,350Cost = $2,350 + $4 (oil changes)Predicted cost for January = $2,350 + $4(1,000) = $6,350problems3–61. High (1,700, $21,000); Low (700, $15,000)V = (Y2 – Y1)/(X2 – X1)= ($21,000 – $15,000)/(1,700 – 700) = $6 per receiving orderF = Y2 – VX2= $21,000 – ($6)(1,700) = $10,800Y = $10,800 + $6X2. Output of spreadsheet regression routine with number of receiving orders as the independent variable:Constant 4512.98701298698Std. Err. of Y Est. 3456.24317476605R Squared 0.633710482694768No. of Observations 10Degrees of Freedom 8X Coefficient(s) 13.3766233766234Std. Err. of Coef. 3.59557461331427V = $13.38 per receiving order (rounded)F = $4,513 (rounded)Y = $4,513 + $13.38XR2 = 0.634, or 63.4%Receiving orders explain about 63.4 percent of the variability in receiving cost, providing evidence that Tracy’s choice o f a cost driver is reasonable. However, other drivers may need to be considered because 63.4 percent may not be strong enough to justify the use of only receiving orders.3. Regression with pounds of material as the independent variable:Constant 5632.28109733183Std. Err. of Y Est. 2390.10628259277R Squared 0.824833789433823No. of Observations 10Degrees of Freedom 8X Coefficient(s) 0.0449642991356633Std. Err. of Coef. 0.0073259640055344V = $0.045 per pound of material delivered (rounded)F = $5,632 (rounded)Y = $5,632 + $0.045XR2 = 0.825, or 82.5%Pounds of material delivered explains about 82.5 percent of the variability in receiving cost. This is a better result than that of the receiving orders and should convince Tracy to try multiple regression.4. Regression routine with pounds of material and number of receiving orders as the independent variables:Constant 752.104072925631Std. Err. of Y Est. 1350.46286973443R Squared 0.951068418023306No. of Observations 10Degrees of Freedom 7X Coefficient(s) 0.0333883151096915 7.14702865269395Std. Err. of Coef. 0.00495524841198368 1.68182916088492V1 = $0.033 per pound of material delivered (rounded)V2 = $7.147 per receiving order (rounded)F = $752 (rounded)Y = $752 + $0.033a + $7.147bR2 = 0.95, or 95%Multiple regression with both variables explains 95 percent of the variability in receiving cost. This is the best result.5–21. Job #57 Job #58 Job #59Balance, 7/1 $ 22,450 $ 0 $ 0Direct materials 12,900 9,900 35,350Direct labor 20,000 6,500 13,000Applied overhead:Power 750 600 3,600Material handling 1,500 300 6,000Purchasing 250 1,000 250Total cost $ 57,850 $ 18,300 $ 58,2002. Ending balance in Work in Process = Job #58 = $18,3003. Ending balance in Finished Goods = Job #59 = $58,2004. Cost of Goods Sold = Job #57 = $57,850problems5–31. Overhead rate = $180/$900 = 0.20 or 20% of direct labor dollars.(This rate was calculated using information from the Ladan job; however, the Myron and Coe jobs would give the same answer.)2. Ladan Myron Coe Walker WillisBeginning WIP $ 1,730 $1,180 $2,500 $ 0 $ 0Direct materials 400 150 260 800 760Direct labor 800 900 650 350 900Applied overhead 160 180 130 70 180Total $ 3,090 $2,410 $3,540 $ 1,220 $ 1,840Note: This is just one way of setting up the job-order cost sheets. You might prefer to keep the detail on the materials, labor, and overhead in beginning inventory costs.3. Since the Ladan and Myron jobs were completed, the others must still be in process. Therefore, the ending balance in Work in Process is the sum of the costs of the Coe, Walker, and Willis jobs.Coe $3,540Walker 1,220Willis 1,840Ending Work in Process $6,600Cost of Goods Sold = Ladan job + Myron job = $3,090 + $2,410 = $5,5004. Naman CompanyIncome StatementFor the Month Ended June 30, 20XXSales (1.5 ? $5,500) $8,250Cost of goods sold 5,500Gross margin $2,750Marketing and administrative expenses 1,200Operating income $1,5505–201. Overhead rate = $470,000/50,000 = $9.40 per MHr2. Department A: $250,000/40,000 = $6.25 per MHrDepartment B: $220,000/10,000 = $22.00 per MHr3. Job #73 Job #74Plantwide:70 ? $9.40 = $658 70 ? $9.40 = $658Departmental:20 ? $6.25 $ 125.00 50 ? $6.25 $ 312.5050 ? $22 1,100.00 20 ? $22 440.00$ 1,225.00 $ 752.50Department B appears to be more overhead intensive, so jobs spending more time in Department B ought to receive more overhead. Thus, departmental rates provide more accuracy.4. Plantwide rate: $250,000/40,000 = $6.25Department B: $62,500/10,000 = $6.25Job #73 Job #74Plantwide:70 ? $6.25 = $437.50 70 ? $6.25 = $437.50Departmental:20 ? $6.25 $ 125.00 50 ? $6.25 $ 312.5050 ? $6.25 312.50 20 ? $6.25 125.00$ 437.50 $ 437.50Assuming that machine hours is a good cost driver, the departmental rates reveal that overhead consumption is the same in each department. In this case, there is no need for departmental rates, and a plantwide rate is sufficient.5–41. Overhead rate = $470,000/50,000 = $9.40 per MHr2. Department A: $250,000/40,000 = $6.25 per MHrDepartment B: $220,000/10,000 = $22.00 per MHr3. Job #73 Job #74Plantwide:70 ? $9.40 = $658 70 ? $9.40 = $658Departmental:20 ? $6.25 $ 125.00 50 ? $6.25 $ 312.5050 ? $22 1,100.00 20 ? $22 440.00$ 1,225.00 $ 752.50Department B appears to be more overhead intensive, so jobs spending more time in Department B ought to receive more overhead. Thus, departmental rates provide more accuracy.4. Plantwide rate: $250,000/40,000 = $6.25Department B: $62,500/10,000 = $6.25Job #73 Job #74Plantwide:70 ? $6.25 = $437.50 70 ? $6.25 = $437.50Departmental:20 ? $6.25 $ 125.00 50 ? $6.25 $ 312.5050 ? $6.25 312.50 20 ? $6.25 125.00$ 437.50 $ 437.50Assuming that machine hours is a good cost driver, the departmental rates reveal that overhead consumption is the same in each department. In this case, there is no need for departmental rates, and a plantwide rate is sufficient.5–51. Last year’s unit-based overhead rate = $50,000/10,000 = $5This year’s unit-based overhead rate = $100,000/10,000 = $10Last Year This YearBike cost:2 ? $20 $ 40 $ 403 ? $12 36 36Overhead:5 ? $5 255 ? $10 50Total $101 $126Price last year = $101 ? 1.40 = $141.40/dayPrice this year = $126 ? 1.40 = $176.40/dayThis is a $35 increase over last year, nearly a 25 percent increase. No doubt the Carsons arenot pleased and would consider looking around for other recreational possibilities.2. Purchasing rate = $30,000/10,000 = $3 per purchase orderPower rate = $20,000/50,000 = $0.40 per kilowatt hourMaintenance rate = $6,000/600 = $10 per maintenance hourOther rate = $44,000/22,000 = $2 per DLHBike Rental Picnic CateringPurchasing$3 ? 7,000 $21,000$3 ? 3,000 $ 9,000Power$0.40 ? 5,000 2,000$0.40 ? 45,000 18,000Maintenance$10 ? 500 5,000$10 ? 100 1,000Other$2 ? 11,000 22,000 22,000Total overhead $50,000 $50,0003. This year’s bike rental overhead rate = $50,000/10,000 = $5Carson rental cost = (2 ? $20) + (3 ? $12) + (5 ? $5) = $101Price = 1.4 ? $101 = $141.40/day4. Catering rate = $50,000/11,000 = $4.55* per DLHCost of Estes job:Bike rental rate (2 ? $7.50) $15.00Bike conversion cost (2 ? $5.00) 10.00Catering materials 12.00Catering conversion (1 ? $4.55) 4.55Total cost $41.55*Rounded5. The use of ABC gives Mountain View Rentals a better idea of the types and costs of activities that are used in their business. Adding Level 4 bikes will increase the use of the most expensive activities, meaning that the rental rate will no longer be an average of $5 per rental day. Mountain View Rentals might need to set a Level 4 price based on the increased cost of both the bike and conversion cost.分步成本法6–11. Cutting Sewing PackagingDepartment Department DepartmentDirect materials $5,400 $ 900 $ 225Direct labor 150 1,800 900Applied overhead 750 3,600 900Transferred-in cost:From cutting 6,300From sewing 12,600Total manufacturing cost $6,300 $12,600 $14,6252. a. Work in Process—Sewing 6,300Work in Process—Cutting 6,300b. Work in Process—Packaging 12,600Work in Process—Sewing 12,600c. Finished Goods 14,625Work in Process—Packaging 14,625 3. Unit cost = $14,625/600 = $24.38* per pair6–21. Units transferred out: 27,000 + 33,000 – 16,200 = 43,8002. Units started and completed: 43,800 – 27,000 = 16,8003. Physical flow schedule:Units in beginning work in process 27,000Units started during the period 33,000Total units to account for 60,000Units started and completed 16,800Units completed from beginning work in process 27,000Units in ending work in process 16,200Total units accounted for 60,0004. Equivalent units of production:Materials ConversionUnits completed 43,800 43,800Add: Units in ending work in process:(16,200 ? 100%) 16,200(16,200 ? 25%) 4,050 Equivalent units of output 60,000 47,8506–31. Physical flow schedule:Units to account for:Units in beginning work in process 80,000Units started during the period 160,000Total units to account for 240,000Units accounted for:Units completed and transferred out:Started and completed 120,000From beginning work in process 80,000 200,000 Units in ending work in process 40,000Total units accounted for 240,0002. Units completed 200,000Add: Units in ending WIP ? Fraction complete(40,000 ? 20%) 8,000Equivalent units of output 208,0003. Unit cost = ($374,400 + $1,258,400)/208,000 = $7.854. Cost transferred out = 200,000 ? $7.85 = $1,570,000Cost of ending WIP = 8,000 ? $7.85 = $62,8005. Costs to account for:Beginning work in process $ 374,400Incurred during June 1,258,400Total costs to account for $ 1,632,800Costs accounted for:Goods transferred out $ 1,570,000Goods in ending work in process 62,800Total costs accounted for $ 1,632,8006–31、Units t0 account for:Units in beginning work in process(25% completed) 10000Units started during the period 70000 Total units to account for 80000 Units accounted forUnits completed and transferred outStarted and completed 50000From beginning work in process 10000 60000 Units in ending work in process(60% completed) 20000 Total units accounted for 80000 2、60000+20000×60%=72000(units)3、Unit cost for materials:($/unit)Unit cost for convension:($/unit)Total unit cost:5+1.13=6.13($/unit)4、The cost of units of transferred out:60000×6.13=367800($)The cost of units of ending work in process:20000×5+20000×20%×1.13=113560($)作业成本法4–21. Predetermined rates:Drilling Department: Rate = $600,000/280,000 = $2.14* per MHrAssembly Department: Rate = $392,000/200,000= $1.96 per DLH*Rounded2. Applied overhead:Drilling Department: $2.14 ? 288,000 = $616,320Assembly Department: $1.96 ? 196,000 = $384,160Overhead variances:Drilling Assembly TotalActual overhead $602,000 $ 412,000 $ 1,014,000Applied overhead 616,320 384,160 1,000,480Overhead variance $ (14,320) over $ 27,840 under $ 13,5203. Unit overhead cost = [($2.14 ? 4,000) + ($1.96 ? 1,600)]/8,000= $11,696/8,000= $1.46**Rounded4–31. Yes. Since direct materials and direct labor are directly traceable to each product, their cost assignment should be accurate.2. Elegant: (1.75 ? $9,000)/3,000 = $5.25 per briefcaseFina: (1.75 ? $3,000)/3,000 = $1.75 per briefcaseNote: Overhead rate = $21,000/$12,000 = $1.75 per direct labor dollar (or 175 percent of direct labor cost).There are more machine and setup costs assigned to Elegant than Fina. This is clearly a distortion because the production of Fina is automated and uses the machine resources much more than the handcrafted Elegant. In fact, the consumption ratio for machining is 0.10 and 0.90 (using machine hours as the measure of usage). Thus, Fina uses nine times the machining resources as Elegant. Setup costs are similarly distorted. The products use an equal number of setups hours. Yet, if direct labor dollars are used, then the Elegant briefcase receives three times more machining costs than the Fina briefcase.3. Overhead rate = $21,000/5,000= $4.20 per MHrElegant: ($4.20 ? 500)/3,000 = $0.70 per briefcaseFina: ($4.20 ? 4,500)/3,000 = $6.30 per briefcaseThis cost assignment appears more reasonable given the relative demands each product places on machine resources. However, once a firm moves to a multiproduct setting, using only one activity driver to assign costs will likely produce product cost distortions. Products tend to make different demands on overhead activities, and this should be reflected in overhead cost assignments. Usually, this means the use of both unit- and nonunit-level activity drivers. In this example, there is a unit-level activity (machining) and a nonunit-level activity (setting up equipment). The consumption ratios for each (using machine hours and setup hours as the activity drivers) are as follows:Elegant FinaMachining 0.10 0.90 (500/5,000 and 4,500/5,000)Setups 0.50 0.50 (100/200 and 100/200)Setup costs are not assigned accurately. Two activity rates are needed—one based on machine hours and the other on setup hours:Machine rate: $18,000/5,000 = $3.60 per MHrSetup rate: $3,000/200 = $15 per setup hourCosts assigned to each product:Machining: Elegant Fina$3.60 ? 500 $ 1,800$3.60 ? 4,500 $ 16,200Setups:$15 ? 100 1,500 1,500Total $ 3,300 $ 17,700Units ÷3,000 ÷3,000Unit overhead cost $ 1.10 $ 5.904:Elegant Unit overhead cost:[9000+3000+18000*500/5000+3000/2]/3000=$5.1 Fina Unit overhead cost:[3000+3000+18000*4500/5000+3000/2]/3000=$7.94–51. Deluxe Percent Regular PercentPrice $900 100% $750 100%Cost 576 64 600 80Unit gross profit $324 36% $150 20%Total gross profit:($324 ? 100,000) $32,400,000($150 ? 800,000) $120,000,0002. Calculation of unit overhead costs:Deluxe gularUnit-level:Machining:$200 ? 100,000 $20,000,000$200 ? 300,000 $60,000,000Batch-level:Setups:$3,000 ? 300 900,000$3,000 ? 200 600,000Packing:$20 ? 100,000 2,000,000$20 ? 400,000 8,000,000Product-level:Engineering:$40 ? 50,000 2,000,000$40 ? 100,000 4,000,000Facility-level:Providing space:$1 ? 200,000 200,000$1 ? 800,000 800,000Total overhead $25,100,000 $73,400,000Units ÷100,000 ÷800,000Overhead per unit $251 $91.75Deluxe Percent Regular PercentPrice $900 100% $750.00 100%Cost 780* 87*** 574.50** 77***Unit gross profit $120 13%*** $175.50 23%***Total gross profit:($120 ? 100,000) $12,000,000($175.50 ? 800,000) $140,400,000*$529 + $251**$482.75 + $91.753. Using activity-based costing, a much different picture of the deluxe and regular products emerges. The regular model appears to be more profitable. Perhaps it should be emphasized.4–61. JIT Non-JITSalesa $12,500,000 $12,500,000Allocationb 750,000 750,000a$125 ? 100,000, where $125 = $100 + ($100 ? 0.25), and 100,000 is the average order size times the number of ordersb0.50 ? $1,500,0002. Activity rates:Ordering rate = $880,000/220 = $4,000 per sales orderSelling rate = $320,000/40 = $8,000 per sales callService rate = $300,000/150 = $2,000 per service callJIT Non-JITOrdering costs:$4,000 ? 200 $ 800,000$4,000 ? 20 $ 80,000Selling costs:$8,000 ? 20 160,000$8,000 ? 20 160,000Service costs:$2,000 ? 100 200,000$2,000 ? 50 100,000Total $1,160,000 $340,0 0For the non-JIT customers, the customer costs amount to $750,000/20 = $37,500 per order under the original allocation. Using activity assign?ments, this drops to $340,000/20 = $17,000 per order, a difference of $20,500 per order. For an order of 5,000 units, the order price can be decreased by $4.10 per unit without affecting customer profitability. Overall profitability will decrease, however, unless the price for orders is increased to JIT customers.3. It sounds like the JIT buyers are switching their inventory carrying costs to Emery without any significant benefit to Emery. Emery needs to increase prices to reflect the additional demands on customer-support activities. Furthermore, additional price increases may be needed to reflectthe increased number of setups, purchases, and so on, that are likely occurring inside the plant. Emery should also immediately initiate discussions with its JIT customers to begin negotiations for achieving some of the benefits that a JIT supplier should have, such as long-term contracts. The benefits of long-term contracting may offset most or all of the increased costs from the additional demands made on other activities.4–71. Supplier cost:First, calculate the activity rates for assigning costs to suppliers:Inspecting components: $240,000/2,000 = $120 per sampling hourReworking products: $760,500/1,500 = $507 per rework hourWarranty work: $4,800/8,000 = $600 per warranty hourNext, calculate the cost per component by supplier:Supplier cost:Vance FoyPurchase cost:$23.50 ? 400,000 $ 9,400,000$21.50 ? 1,600,000 $ 34,400,000Inspecting components:$120 ? 40 4,800$120 ? 1,960 235,200Reworking products:$507 ? 90 45,630$507 ? 1,410 714,870Warranty work:$600 ? 400 240,000$600 ? 7,600 4,560,000Total supplier cost $ 9,690,430 $ 39,910,070Units supplied ÷400,000 ÷1,600,000Unit cost $ 24.23* $ 24.94**RoundedThe difference is in favor of Vance; however, when the price concession is considered, the cost of Vance is $23.23, which is less than Foy’s component. Lumus should accept the contractual offer made by Vance.4–7 Concluded2. Warranty hours would act as the best driver of the three choices. Using this driver, the rate is $1,000,000/8,000 = $125 per warranty hour. The cost assigned to each component would be:Vance FoyLost sales:$125 ? 400 $ 50,000$125 ? 7,600 $ 950,000$ 50,000 $ 950,000Units supplied ÷400,000 ÷1,600,000Increase in unit cost $ 0.13* $ 0.59**Rounded$0.075 per unitCategory II: $45/1,000 = $0.045 per unitCategory III: $45/1,500 = $0.03 per unitCategory I, which has the smallest batches, is the most undercosted of the three categories. Furthermore, the unit ordering cost is quite high relative to Category I’s selling price (9 to 15 percent of the selling price). This suggests that something should be done to reduce the order-filling costs.3. With the pricing incentive feature, the average order size has been increased to 2,000 units for all three product families. The number of orders now processed can be calculated as follows:Orders = [(600 ? 50,000) + (1,000 ? 30,000) + (1,500 ? 20,000)]/2,000= 45,000Reduction in orders = 100,000 – 45,000 = 55,000Steps that can be reduced = 55,000/2,000 = 27 (rounding down to nearest whole number)There were initially 50 steps: 100,000/2,000Reduction in resource spending:Step-fixed costs: $50,000 ? 27 = $1,350,000Variable activity costs: $20 ? 55,000 = 1,100,000$2,450,000预算9-4Norton, Inc.Sales Budget For the Coming YearModel Units Price Total SalesLB-1 50,400 $29.00 $1,461,600LB-2 19,800 15.00 297,000WE-6 25,200 10.40 262,080 WE-7 17,820 10.00 178,200 WE-8 9,600 22.00 211,200 WE-9 4,000 26.00 104,000 Total $2,514,080二、1. Raylene’s Flowers and GiftsProduction Budget for Gift BasketsFor September, October, November, and DecemberSept. Oct. Nov. D ec.Sales 200 150 180 250Desired ending inventory 15 18 25 10Total needs 215 168 205 260Less: Beginning inventory 20 15 18 25 Units produced 195 153 187 2352. Raylene’s Flowers and GiftsDirect Materials Purchases BudgetFor September, October, and NovemberFruit: Sept. Oct. Nov.Production 195 153 187? Amount/basket (lbs.) ? 1 ? 1 ?1Needed for production 195 153 187Desired ending inventory 8 9 12Needed 203 162 200Less: Beginning inventory 10 8 9Purchases193 154 190Small gifts: Sept. Oct. Nov.Production 195 153 187 ? Amount/basket (items) ? 5 ? 5 ? 5Needed for production 975 765 935Desired ending inventory 383 468 588Needed 1,358 1,233 1,523Less: Beginning inventory 488 383 468Purchases 870 850 1,055Cellophane: Sept. Oct. Nov.Production 195 153 187。
CHAPTER 3 COVERAGE OF LEARNING OBJECTIVESCHAPTER 3Measurement of Cost Behavior3-A1 (20-25 min.) Some of these answers are controversial, and reasonable cases can be built for alternative classifications. Class discussion of these answers should lead to worthwhile disagreements about anticipated cost behavior with regard to alternative cost drivers.1. (b) Discretionary fixed cost.2. (e) Step cost.3. (a) Purely variable cost with respect to revenue.4. (a) Purely variable cost with respect to miles flown.5. (d) Mixed cost with respect to miles driven.6. (c) Committed fixed cost.7. (b) Discretionary fixed cost.8. (c) Committed fixed cost.9. (a) Purely variable cost with respect to cases of 7-Up.10. (b) Discretionary fixed cost.11. (b) Discretionary fixed cost.3-A2 (25-30 min.)1. Support costs based on 60% of the cost of materials:Sign A SignBDirect materials cost $400 $200Support cost (60% of materials cost) $240 $120Support costs based on $50 per power tool operation:Sign A SignBPower tool operations 3 6Support cost $150 $3002. If the activity analysis is reliable, by using the current method,Evergreen Signs is predicting too much cost for signs that use fewpower tool operations and is predicting too little cost for signs thatuse many power tool operations. As a result the company could belosing jobs that require few power tool operations because its bids are too high -- it could afford to bid less on these jobs. Conversely, thecompany could be getting too many jobs that require many powertool operations, because its bids are too low -- given what the "true"costs will be, the company cannot afford these jobs at those prices.Either way, the sign business could be more profitable if the ownerbetter understood and used activity analysis. Evergreen Signs wouldbe advised to adopt the activity-analysis recommendation, but also toclosely monitor costs to see if the activity-analysis predictions ofsupport costs are accurate.3-A3 (25-30 min.)1. High-Low Method:Support Cost Machine HoursHigh month = September $13,500 1,750Low month = May 9,000 850Difference $ 4,500 900Variable cost per machine hour = Change in cost ÷ Change in costdriver= $4,500 ÷ 900 = $5.00Fixed support cost per month = Total support cost - Variable supportcostAt the high point: = $13,500 - $5.00 × 1,750= $13,500 - $8,750= $ 4,750or at the low point: = $ 9,000 - $5.00 × 850= $ 9,000 - $4,250= $ 4,7502. The high-low method uses the high and low activity levels todetermine the cost function. Since the new October data for machinehours does not change either the high or low level there would be no change in the analysis.3. The regression analysis results differ from the results of the high-lowmethod. As a result, estimates of total support cost may differconsiderably depending on the expected machine hour usage. Forexample, consider the following support cost estimates at three levelsof machine hour usage (all within the relevant range):Machine Hour Usage950 Hours 1,200 Hours 1,450 HoursHigh-Low:Fixed $4,750 $ 4,750 $ 4,750 Variable: $5.00 × 950 4,750$5.00 × 1,200 6,000$5.00 × 1,450 7,250 Total $9,500 $10,750 $12,000Regression:Fixed $3,355 $ 3,355 $ 3,355 Variable: $6.10 × 950 5,795$6.10 × 1,200 7,320$6.10 × 1,450 8,845 Total $9,150 $ 10,675 $12,200Because the high-low method has a lower variable cost estimate, theregression-based predictions exceed the high-low-based predictions at higher levels of machine usage, while the high-low estimates aregreater at lower levels of usage. The high-low method used only twodata points, so the results may not be reliable. Fernandez would beadvised to use the regression results, which are based on all relevantdata.3-B1 (20-25 min.)The following classifications are open to debate. With appropriate assumptions, other answers could be equally supportable. For example, in #2, the health insurance would be a committed fixed cost if the number of employees will not change. This problem provides an opportunity to discuss various aspects of cost behavior. Students should make an assumption regarding the time period involved. For example, if the time period is short, say one month, more costs tend to be fixed. Over longer periods, more costs are variable. They also must assume something about the nature of the cost. For example, consider #4. Repairs and maintenance are often thought of as a single cost. However, repairs are more likely to vary with the amount of usage, making them variable, while maintenance is often on a fixed schedule regardless of activity, making them fixed.Another important point to make is the cost/benefit criterion applied to determining “true” cost behavior. A manager may accept a cost driver that is plausible but may have less reliability than an alternative due to the cost associated with maintaining data for the more reliable cost driver.Cost Cost Behavior Likely Cost Driver(s)1. X-ray operating cost Mixed Number of x-rays2. Insurance Step (or variable) Number of employees3. Cancer research Discretionary fixed4. Repairs Variable Number of patients5. Training cost Discretionary fixed6. Depreciation Committed fixed7. Consulting Discretionary fixed8. Nursing supervisors Step Number of nurses,patient-days3-B2 (25-30 min.) Board Z15 Board Q52 Mark-up method:Material cost $40 $60Support costs (100%) $40 $60Activity analysis method:Manual operations 15 7Support costs (@$4) $60 $28The support costs are different because different cost behavior is assumed by the two methods. If the activity analyses are reliable, then boards with few manual operations are overcosted with the markup method, and boards with many manual operations are undercosted with the markup method.3-B3 (25-30 min.)Variable cost per machine hour = Change in Repair Cost ÷ Change in Machine Hours= (P260,000,000 –P200,000,000) ÷ (12,000 –8,000)= P15,000 per machine hourFixed cost per month = total cost - variable cost= P260,000,000 - P15,000 × 12,000= P260,000,000 - P180,000,000= P 80,000,000 per monthor = P200,000,000 - P15,000 × 8,000= P200,000,000 - P120,000,000= P 80,000,000 per month3-1 A cost driver is any output measure that is believed to cause costs to fluctuate in a predictable manner. For example, direct labor costs areprobably driven by direct labor hours; materials costs are probablydriven by levels of product output; and support costs may be driven bya variety of drivers, such as output levels, product complexity, numberof different products and/or parts, and so on.3-2 Linear cost behavior assumes that costs behave as a straight line. This line is anchored by an intercept, or fixed cost estimate, and total costs increase proportionately as cost driver activity increases. The slope ofthe line is the estimate of variable cost per unit of cost driver activity.3-3 Whether to categorize a step cost either as a fixed cost or as a variable cost depends on the "size" of the steps (height and width) and on thedesired accuracy of the description of step cost behavior. If the stepsare wide, covering a wide range of cost driver activity, then within each range the cost may be regarded as fixed. If the steps are narrow andnot too high, with small changes in cost, then the cost may beregarded as variable over a wide range of activity level, with little error.If the steps are narrow and high, covering big changes in cost, then the cost probably should not be regarded as variable, since small changesin activity level can result in large changes in cost.3-4 Mixed costs are costs that contain both fixed and variable elements. A mixed cost has a fixed portion that is usually a cost per time period.This is the minimum mixed cost per period. A mixed cost also has avariable portion that is a cost per unit of cost driver activity. Thevariable portion of a mixed cost increases proportionately withincreases in the cost driver.3-5 In order to achieve the goals set for the organization, management makes critical choices -- choices that guide the future activities of theorganization. These choices include decisions about locations, products, services, organization structure, and so on. Choices about product orservice attributes (mix, quality, features, performance, etc.), capacity(committed and discretionary fixed costs), technology (capital/laborconsiderations, alternative technologies), and incentives (standard-based performance evaluation) can greatly affect cost behavior.3-6 Some fixed costs are called capacity costs because the levels of these fixed costs are determined by management's strategic decisions aboutthe organization's expected levels of activities, or capacity.3-7 Committed fixed costs are costs that are often driven by the planned scale of operations. These costs typically cannot be changed easily orquickly without drastically changing the operations of the organization.Typical committed fixed costs include lease or mortgage payments,property taxes, and long-term management compensation.Discretionary fixed costs are costs that may be necessary to achievecertain operational goals, but there are no contractual obligations tocontinue these payments. Typical discretionary fixed costs includeadvertising, research and development, and employee trainingprograms. The distinction between committed and discretionary fixedcosts is that discretionary fixed costs are flexible and could beincreased, decreased, or eliminated entirely on short notice if necessary, but committed fixed costs usually must be incurred for some time --greater effort is needed to change or eliminate them.3-8 Committed fixed costs are the most difficult to change because long-term commitments generally have been made. These long-termcommitments may involve legal contracts that would be costly torenegotiate or dissolve. Committed fixed costs also are difficult tochange because doing so may mean greatly changing the way theorganization conducts its activities. Changing these committed fixedcosts may also mean changing organization structure, location,employment levels, and products or services.3-9 An organization’s capacity generally determines its committed fixed costs. Management’s choice is the main influence on discretionaryfixed costs. Both committed and discretionary fixed costs depend onthe organization's strategy relating to capacity, product attributes, andtechnology. These elements will determine long-term costcommitments (committed costs) and flexible spending responses tochanges in the environment (discretionary costs).3-10 Both planning for and controlling discretionary costs are important. It is hard to say that one is more important than the other, but certainlyeffective use of discretionary costs requires prior planning. One would not know, however, if these costs had been effective in meeting goalsunless the organization has a reliable and timely control system -- ameans of checking accomplishments against goals.3-11 High technology production systems often mean higher fixed costs and lower variable costs.3-12 Incentives to control costs are means of making cost control in the best interests of the people responsible for making cost expenditures. Asimple example will illustrate the use of incentives to control costs.Assume that you are an executive who travels for business, purchasesprofessional literature, and keeps current with personal computertechnology. Under one incentive system, you simply bill theorganization for all your travel and professional expenses. Underanother system, you are given an annual budget for travel andprofessional needs. Which system do you think would cause you to be more careful about how you spend money for travel and professionalneeds? Most likely, the latter system would be more effective incontrolling costs. Usually these incentives are economic, but other non-financial incentives may also be effective.3-13 Use of cost functions, or algebraic representations of cost behavior, allows cost analysts or management to build models of theorganization's cost behavior. These models can be used to aidplanning and control activities. One common use of cost functions isin financial planning models, which are algebraic models of the costand revenue behavior of the firm, essentially extended C-V-P modelssimilar to those discussed in Chapter 2. Understanding relationshipsbetween costs and cost drivers allows managers to make betterdecisions.3-14 A "plausible" cost function is one that is intuitively sound. A cost function is plausible if a knowledgeable analyst can make soundeconomic justifications why a particular cost driver could cause the cost in question. A "reliable" cost function is one that accurately andconsistently describes actual cost behavior, past and future. Bothplausibility and reliability are essential to useful cost functions. It isdifficult to say that one is more important than the other, but onewould not have much confidence in the future use of a cost functionthat is not plausible, even if past reliability (e.g., based on statisticalmeasures) has been high. Likewise, one would not be confident usinga cost function that is highly plausible, but that has not been shown tobe reliable. The cost analyst should strive for plausible and reliablecost functions.3-15 Activity analysis identifies underlying causes of cost behavior (appropriate cost drivers) and measures the relationships of costs totheir cost drivers. A variety of methods may be used to measure costfunctions, including engineering analysis and account analysis.3-16 Engineering analysis is a method of identifying and measuring cost and cost driver relationships that does not require the use of historical data.Engineering analysis proceeds by the use of interviews, experimentation, and observation of current cost generating activities. Engineeringanalysis will be more reliable if the organization has had pastexperience with the activities.Account analysis is a method of identifying and measuring costs andcost driver relationships that depend explicitly on historical cost data.An analyst selects a single cost driver and classifies each cost accountas fixed or variable with respect to that cost driver. Account analysiswill be reliable if the analyst is skilled and if the data are relevant tofuture uses of the derived cost function.3-17 There are four general methods covered in this text to measure mixed costs using historical data: (1) account analysis, (2) high-low, (3) visualfit, and (4) regression.• Account analysis looks to the organization's cost accounts andclassifies each cost as either fixed, variable, or mixed with regard to anappropriate cost driver.• High-low analysis algebraically measures mixed cost behavior by con-structing a straight line between the cost at the highest activity leveland that at the lowest activity level.• Visual-fit analysis seeks to place a straight line among data points on a plot of each cost and its appropriate cost driver.• Regression analysis fits a straight line to cost and activity data according to statistical criteria.3-18 Engineering analysis and account analysis often are combined. One of the problems of account analysis is that historical data may containpast inefficiencies. Therefore, account analysis measures what costswere, not necessarily what they should be. Differences in future costsmay be desired and/or anticipated, and account analysis alone usuallywill not account for these differences. Engineering analysis may becombined with account analysis to revise account-based measures fordesired improvements in efficiency and/or planned changes in inputs or processes.3-19 The strengths of the high-low method are also its weaknesses -- the method is simple to apply since it does not require extensive data orstatistical sophistication. This simplicity also means that the methodmay not be reliable because it may not use all the relevant data thatare available, and choice of the two points to measure the linear costrelationship is subjective. The method itself also does not give anymeasures of reliability.The visual-fit method is an improvement over the high-low methodbecause it uses all the available (relevant) data. However, this method, too, may not be reliable since it relies on the analyst's judgment onwhere to place the line.3-20 The cost-driver level should be used to determine the two data points to be used to determine the cost function. Why? Because thehigh- and low-cost points are more likely to have measurement errors, an unusually high cost at the high-cost point and an unusually low cost at the low-cost point.3-21 Regression analysis is usually preferred to the high-low method (and the visual-fit method) because regression analysis uses all the relevantdata and because easy-to-use computer software does the analysis and provides useful measures of cost function reliability. The majordisadvantage of regression analysis is that it requires statisticalsophistication to use properly. Because the software is easy to use,many users of regression analysis may not be able to critically evaluate the output and may be misled to believe that they have developed areliable cost function when they have not.3-22 This is a deceptive statement, because it is true on the face of it, but regression also has many pitfalls for the unwary. Yes, regressionsoftware provides useful output that can be used to evaluate thereliability of the measured cost function. If one understands theassumptions of least-squares regression, this output can be used tocritically evaluate the measured function. However, the regressionsoftware cannot evaluate the relevance or accuracy of the data that are used. Even though regression analysis is statistically objective,irrelevant or inaccurate data used as input will lead to unreliable costfunctions, regardless of the strength of the statistical indicators ofreliability.3-23 Plotting data helps to identify outliers, that is, observations that are unusual and may indicate a situation that is not representative of theenvironment for which cost predictions are being made. It can alsoshow nonlinear cost behavior that can lead to transformations of thedata before applying linear regression methods.3-24 R2 is a goodness-of-fit statistic that describes the percentage of variation in cost explained by changes in the cost driver.3-25 Control of costs does require measurement of cost behavior, either what costs have been or what costs should be. Problems of work rules and the like may make changing cost behavior difficult. There aretradeoffs, of course, and the instructor should expect that studentscould get into an impassioned debate over where the balance lies --union job protection versus improved efficiency. This debate gets toone of the major roles of accounting in organizations, and it isimportant that students realize that accounting does matter greatly toindividuals, and, ultimately, to society.3-26 The fixed salary portion of the compensation is a fixed cost. It is independent of how much is sold. In contrast, the 5% commission is a variable cost. It varies directly with the amount of sales. Because thecompensation is part fixed cost and part variable cost, it is considered a mixed cost.3-27 Both depreciation and research and development costs are fixed costs because they are independent of the volume of operations.Depreciation is generally a committed fixed cost. Managers have littlediscretion over the amount of the cost. In contrast, research anddevelopment costs are discretionary fixed costs because their size isoften the result of management’s judgment.3-28 Decision makers should know a product’s cost function if their decisions affect the amount of product produced. To know the costimpact of their decisions, decision makers apply the cost function toeach possible volume of production. This is important in manydecisions, such as pricing decisions, promotion and advertisingdecisions, sales staff deployment decisions, and many more decisionsthat affect the volume of product that the company produces.3-29 Regression analysis is a statistical method of fitting a cost-function line to observed costs. It is objective; that is, each cost analyst would come up with the same regression line, whereas different analysts might have different cost functions when using a visual fit method. In addition,regression analysis provides measures of how well the cost-functionline fits the data, so that managers know how much reliance they canput on cost predictions that use the cost function.3-30 (5 min.) Only (b) is a step cost.(a) This is a fixed cost. The same cost applies to all volumes in therelevant range.(b) This is a true step cost. Each time 15 students are added, the costincreases by the amount of one teacher’s salary.(c) This is a variable cost that may be different per unit at differentlevels of volume. It is not a step cost. Why? Because each unit ofproduct requires a particular amount of steel, regardless of the form in which the steel is purchased.3-31 (5 min.) The $8,000 is a fixed cost and the $52 per unit is a variable cost. By definition, adding a fixed cost and a variable cost togetherproduces a mixed cost.3-32 (10-15 min.)1. Machining labor: G, number of units completed or labor hours2. Raw material: B, units produced; could also be D if the company’spurchases do not affect the price of the raw material.3. Annual wage: C or E (depending on work levels), labor hours4. Water bill: H, gallons used5. Quantity discounts: A, amount purchased6. Depreciation: E, capacity7. Sheet steel: D, number of implements of various types8. Salaries: F, number of solicitors9. Natural gas bill: C, energy usage3-33 (15 min.)The analysis is faulty because of the following errors.1. The scales used for both axes are incorrect. The space between equalintervals in number of orders and order-department costs should bethe same.2. The visual-fit line is too high, and the slope is too steep. It appears thatthe line has been purposely drawn to pass through the (100,450) datapoint and the $200 point on the y-axis to simplify the analysis. Avisual-fit line most often will not pass through any one data point.Choosing one point (any point) or a data point and the Y-interceptmakes this similar to the high-low method, ignoring much of theinformation contained in the rest of the data.3. The total cost for 90 orders is wrong. Either the fixed costs should beexpressed in thousands of dollars or the unit variable costs should be$2,000 per order. Even if the derived total cost function was accurate,the resulting cost prediction is incorrect. The formula should beexpressed as:Total cost (thousands of dollars) = $200 + $2.50 × Number of orders processed, orTotal cost = $200,000 + $2,500 × Number of orders processedThis would result in a predicted total cost for 90 orders of:Total cost (thousands of dollars) = $200 + $2.50 × 90 = $425, orTotal cost = $200,000 + $2,500 × 90 = $425,000.Correct AnalysisThe following graph has correctly constructed scales. The visual fit lineshown indicates that fixed costs are about $200,000 and variable cost isabout $2,250 per order – a lower slope than that shown in the text.The total cost function is:Total cost (thousands of dollars) = $200 + $2.25 × Number of orders, or Total cost = $200,000 + $2,250 × Number of ordersVariable cost (thousands of dollars) $180 ÷ 80 orders = $2.25The predicted total cost for 90 orders is:Total cost = $200,000 + $2,250 × 90 = $200,000 + $202,500 = $402,500.3-34 (15-20 min.) Amounts are in millions.1. 2001 2002Sales revenues $57 $116Less: Operating income (loss) (19) 18Operating expenses $76 $ 982. Change in operating expenses ÷ Change in revenues = Variable cost percentage($98 - $76) ÷ ($116 - $57) = $22 ÷ $59 = .37 or 37%Fixed cost = Total cost – Variable cost= $76 - .37 × $57= $55or= $98 - .37 × $116= $55Cost function = $55 + .37 × Sales revenue3. Because fixed costs to not change, the entire additional totalcontribution margin is added to operating income. The $57 salesrevenue in 2001 generated a total contribution margin of $57 × (1 - .37) = $36, which was $19 short of covering the $55 of fixed cost. But theadditional $59 of sales revenue in 2002 generated a total contributionmargin of $59 × (1 - .37) = $37 that could go directly to operatingincome because there was no increase in fixed costs. It wiped out the$19 operating loss and left $18 of operating income.3-35 (10-15 min.)1. Fuel costs: $.40 × 16,000 miles per month = $6,400 per month.2. Equipment rental: $5,000 × 7 × 3 = $105,000 for seven pieces ofequipment for three months3. Ambulance and EMT cost: $1,200 × (2,400/200) = $1,200 × 12 =$14,4004. Purchasing: $7,500 + $5 × 4,000 = $27,500 for the month.3-36 (10-15 min.) There may be some disagreement about these classifications, but reasons for alternative classifications should be explored.Cost Discretionary Committed Advertising $22,000Depreciation $ 47,000 Company health insurance 21,000 Management salaries 85,000 Payment of long-term debt 50,000 Property tax 32,000 Grounds maintenance 9,000Office remodeling 21,000Research and development 46,000Totals $98,000 $235,0003-37 (15-20 min.)This problem extends the chapter analysis to preview short-run decision making and capital budgeting. This problem ignores taxes, invest-ment cost, and the time value of money, which are covered in Chapter 11.Alternative 1 Alternative 2 Variable cost per order $8.00 $4.00 Expected number of orders 70,000 70,000 Annual variable costs $560,000 $280,000 Annual fixed cost 200,000 400,000 Annual total costs $760,000 $680,000Therefore, Alternative 2 is less costly than Alternative 1 by $80,000.Let X = the break-even number of orders, the level at which expected costs are equal.Costs for Alternative 1 = Costs for Alternative 2$200,000 + $8X = $400,000 + $4X$4X = $200,000X = 50,000 ordersAt 50,000 orders, the alternatives are equivalent. If order levels are expected to be below 50,000 orders, then Alternative 1 would have lower costs because fixed costs are lower. If orders are expected to be greater than 50,000, then Alternative 2 would have lower costs because variable costs are lower.3-38 (20-25 min.) A master of the scatter-diagrams with least-square regression lines and high-low lines appears in Exhibit 3-38 on the following page.This exercise enables a comparison of the high-low and visual-fit methods of decomposing mixed-costs into fixed and variable parts. Students find it interesting to compare their best guesses to the least-squares regression results. They find it interesting that a fairly complete and accurate analysis is possible based on a scatter-diagram and a little common sense. We normally have the class determine a “class best guess” before showing the transparency of the regression results.The exercise also introduces students to the concept of a hierarchy of activity levels, although this topic is not covered in the text. The literature contains discussions of four general levels of activities. Recognizing each of these levels can be an aid in choosing appropriate cost drivers. These levels and example cost drivers are:a. Unit-level activities -- performed each time a unit is produced (units ofproduct, machine hours, labor hours).b. Batch-level activities -- performed each time a batch of goods isprocessed or handled (number of orders processed, number of setups,number of material moves).c. Product-level activities -- performed as needed to support theproduction of each different type of product (number of tests, number of parts, number of engineering change notices, hours of design time,number of inspections).d. Facility-level activities -- sustain a facility’s general manufacturingprocess (square footage, number of employees, hours of training).In this exercise, a batch-level activity is involved -- setups.。
CHAPTER 3 COVERAGE OF LEARNING OBJECTIVESCHAPTER 3Measurement of Cost Behavior3-A1 (20-25 min.) Some of these answers are controversial, and reasonable cases can be built for alternative classifications. Class discussion of these answers should lead to worthwhile disagreements about anticipated cost behavior with regard to alternative cost drivers.1. (b) Discretionary fixed cost.2. (e) Step cost.3. (a) Purely variable cost with respect to revenue.4. (a) Purely variable cost with respect to miles flown.5. (d) Mixed cost with respect to miles driven.6. (c) Committed fixed cost.7. (b) Discretionary fixed cost.8. (c) Committed fixed cost.9. (a) Purely variable cost with respect to cases of 7-Up.10. (b) Discretionary fixed cost.11. (b) Discretionary fixed cost.3-A2 (25-30 min.)1. Support costs based on 60% of the cost of materials:Sign A SignBDirect materials cost $400 $200Support cost (60% of materials cost) $240 $120Support costs based on $50 per power tool operation:Sign A SignBPower tool operations 3 6Support cost $150 $3002. If the activity analysis is reliable, by using the current method,Evergreen Signs is predicting too much cost for signs that usefew power tool operations and is predicting too little cost forsigns that use many power tool operations. As a result thecompany could be losing jobs that require few power tooloperations because its bids are too high -- it could afford tobid less on these jobs. Conversely, the company could be gettingtoo many jobs that require many power tool operations, because its bids are too low -- given what the "true" costs will be, the company cannot afford these jobs at those prices. Either way, the sign business could be more profitable if the owner better understood and used activity analysis. Evergreen Signs would be advised to adopt the activity-analysis recommendation, but also to closely monitor costs to see if the activity-analysis predictions of support costs are accurate.3-A3 (25-30 min.)1. High-Low Method:Support Cost Machine HoursHigh month = September $13,500 1,750Low month = May 9,000 850Difference $ 4,500 900Variable cost per machine hour = Change in cost ÷ Change incost driver= $4,500 ÷ 900 = $5.00Fixed support cost per month = Total support cost - Variablesupport costAt the high point: = $13,500 - $5.00 × 1,750= $13,500 - $8,750= $ 4,750or at the low point: = $ 9,000 - $5.00 × 850= $ 9,000 - $4,250= $ 4,7502. The high-low method uses the high and low activity levels todetermine the cost function. Since the new October data formachine hours does not change either the high or low level therewould be no change in the analysis.3. The regression analysis results differ from the results of thehigh-low method. As a result, estimates of total support costmay differ considerably depending on the expected machine hourusage. For example, consider the following support costestimates at three levels of machine hour usage (all within therelevant range):Machine Hour Usage950 Hours 1,200 Hours 1,450 HoursHigh-Low:Fixed $4,750 $ 4,750 $ 4,750 Variable: $5.00 × 950 4,750$5.00 × 1,200 6,000$5.00 × 1,450 7,250 Total $9,500 $10,750 $12,000Regression:Fixed $3,355 $ 3,355 $ 3,355 Variable: $6.10 × 950 5,795$6.10 × 1,200 7,320$6.10 × 1,450 8,845 Total $9,150 $ 10,675 $12,200Because the high-low method has a lower variable cost estimate,the regression-based predictions exceed the high-low-basedpredictions at higher levels of machine usage, while the high-low estimates are greater at lower levels of usage. The high-lowmethod used only two data points, so the results may not bereliable. Fernandez would be advised to use the regressionresults, which are based on all relevant data.3-B1 (20-25 min.)The following classifications are open to debate. With appropriate assumptions, other answers could be equally supportable. For example, in #2, the health insurance would be a committed fixed cost if the number of employees will not change. This problem provides an opportunity to discuss various aspects of cost behavior. Students should make an assumption regarding the time period involved. For example, if the time period is short, say one month, more costs tend to be fixed. Over longer periods, more costs are variable. They also must assume something about the nature of the cost. For example, consider #4. Repairs and maintenance are often thought of as a single cost. However, repairs are more likely to vary with the amount of usage, making them variable, while maintenance is often on a fixed schedule regardless of activity, making them fixed.Another important point to make is the cost/benefit criterion applied to determining “true” cost behavior. A manager may accept a cost driver that is plausible but may have less reliability than an alternative due to the cost associated with maintaining data for the more reliable cost driver.Cost Cost Behavior Likely Cost Driver(s)1. X-ray operating cost Mixed Number of x-rays2. Insurance Step (or variable) Number of employees3. Cancer research Discretionary fixed4. Repairs Variable Number of patients5. Training cost Discretionary fixed6. Depreciation Committed fixed7. Consulting Discretionary fixed8. Nursing supervisors Step Number of nurses,patient-days3-B2 (25-30 min.) Board Z15 Board Q52Mark-up method:Material cost $40 $60Support costs (100%) $40 $60Activity analysis method:Manual operations 15 7Support costs (@$4) $60 $28The support costs are different because different cost behavior is assumed by the two methods. If the activity analyses are reliable, then boards with few manual operations are overcosted with the markup method, and boards with many manual operations are undercosted with the markup method.3-B3 (25-30 min.)Variable cost per machine hour = Change in Repair Cost ÷ Change in Machine Hours= (P260,000,000 –P200,000,000) ÷ (12,000– 8,000)= P15,000 per machine hourFixed cost per month = total cost - variable cost= P260,000,000 - P15,000 × 12,000= P260,000,000 - P180,000,000= P 80,000,000 per monthor = P200,000,000 - P15,000 × 8,000= P200,000,000 - P120,000,000= P 80,000,000 per month3-1 A cost driver is any output measure that is believed to cause costs to fluctuate in a predictable manner. For example, directlabor costs are probably driven by direct labor hours; materialscosts are probably driven by levels of product output; and support costs may be driven by a variety of drivers, such as output levels,product complexity, number of different products and/or parts, and so on.3-2 Linear cost behavior assumes that costs behave as a straight line.This line is anchored by an intercept, or fixed cost estimate, and total costs increase proportionately as cost driver activityincreases. The slope of the line is the estimate of variable cost per unit of cost driver activity.3-3 Whether to categorize a step cost either as a fixed cost or as a variable cost depends on the "size" of the steps (height and width) and on the desired accuracy of the description of step costbehavior. If the steps are wide, covering a wide range of costdriver activity, then within each range the cost may be regardedas fixed. If the steps are narrow and not too high, with smallchanges in cost, then the cost may be regarded as variable over awide range of activity level, with little error. If the steps are narrow and high, covering big changes in cost, then the costprobably should not be regarded as variable, since small changesin activity level can result in large changes in cost.3-4 Mixed costs are costs that contain both fixed and variable elements. A mixed cost has a fixed portion that is usually a cost per time period. This is the minimum mixed cost per period. Amixed cost also has a variable portion that is a cost per unit ofcost driver activity. The variable portion of a mixed costincreases proportionately with increases in the cost driver.3-5 In order to achieve the goals set for the organization, management makes critical choices -- choices that guide the future activities of the organization. These choices include decisions aboutlocations, products, services, organization structure, and so on.Choices about product or service attributes (mix, quality,features, performance, etc.), capacity (committed anddiscretionary fixed costs), technology (capital/laborconsiderations, alternative technologies), and incentives(standard-based performance evaluation) can greatly affect costbehavior.3-6 Some fixed costs are called capacity costs because the levels of these fixed costs are determined by management's strategicdecisions about the organization's expected levels of activities,or capacity.3-7 Committed fixed costs are costs that are often driven by the planned scale of operations. These costs typically cannot bechanged easily or quickly without drastically changing theoperations of the organization. Typical committed fixed costsinclude lease or mortgage payments, property taxes, and long-termmanagement compensation. Discretionary fixed costs are costs that may be necessary to achieve certain operational goals, but thereare no contractual obligations to continue these payments. Typical discretionary fixed costs include advertising, research and development, and employee training programs. The distinction between committed and discretionary fixed costs is that discretionary fixed costs are flexible and could be increased, decreased, or eliminated entirely on short notice if necessary, but committed fixed costs usually must be incurred for some time -- greater effort is needed to change or eliminate them.3-8 Committed fixed costs are the most difficult to change because long-term commitments generally have been made. These long-termcommitments may involve legal contracts that would be costly torenegotiate or dissolve. Committed fixed costs also are difficult to change because doing so may mean greatly changing the way theorganization conducts its activities. Changing these committedfixed costs may also mean changing organization structure,location, employment levels, and products or services.3-9 An organization’s capacity generally determines its committed fixed costs. Management’s choice is the main influence ondiscretionary fixed costs. Both committed and discretionary fixed costs depend on the organization's strategy relating to capacity, product attributes, and technology. These elements will determine long-term cost commitments (committed costs) and flexible spending responses to changes in the environment (discretionary costs).3-10 Both planning for and controlling discretionary costs are important. It is hard to say that one is more important than the other, but certainly effective use of discretionary costs requires prior planning. One would not know, however, if these costs hadbeen effective in meeting goals unless the organization has areliable and timely control system -- a means of checkingaccomplishments against goals.3-11 High technology production systems often mean higher fixed costs and lower variable costs.3-12 Incentives to control costs are means of making cost control in the best interests of the people responsible for making costexpenditures. A simple example will illustrate the use ofincentives to control costs. Assume that you are an executive who travels for business, purchases professional literature, and keeps current with personal computer technology. Under one incentivesystem, you simply bill the organization for all your travel andprofessional expenses. Under another system, you are given anannual budget for travel and professional needs. Which system do you think would cause you to be more careful about how you spendmoney for travel and professional needs? Most likely, the latter system would be more effective in controlling costs. Usually theseincentives are economic, but other non-financial incentives mayalso be effective.3-13 Use of cost functions, or algebraic representations of cost behavior, allows cost analysts or management to build models ofthe organization's cost behavior. These models can be used to aid planning and control activities. One common use of cost functions is in financial planning models, which are algebraic models of the cost and revenue behavior of the firm, essentially extended C-V-P models similar to those discussed in Chapter 2. Understandingrelationships between costs and cost drivers allows managers tomake better decisions.3-14 A "plausible" cost function is one that is intuitively sound. A cost function is plausible if a knowledgeable analyst can makesound economic justifications why a particular cost driver couldcause the cost in question. A "reliable" cost function is onethat accurately and consistently describes actual cost behavior,past and future. Both plausibility and reliability are essential to useful cost functions. It is difficult to say that one is more important than the other, but one would not have much confidencein the future use of a cost function that is not plausible, evenif past reliability (e.g., based on statistical measures) has been high. Likewise, one would not be confident using a cost function that is highly plausible, but that has not been shown to bereliable. The cost analyst should strive for plausible andreliable cost functions.3-15 Activity analysis identifies underlying causes of cost behavior (appropriate cost drivers) and measures the relationships of costs to their cost drivers. A variety of methods may be used tomeasure cost functions, including engineering analysis and account analysis.3-16 Engineering analysis is a method of identifying and measuring cost and cost driver relationships that does not require the use ofhistorical data. Engineering analysis proceeds by the use ofinterviews, experimentation, and observation of current costgenerating activities. Engineering analysis will be more reliable if the organization has had past experience with the activities.Account analysis is a method of identifying and measuring costsand cost driver relationships that depend explicitly on historical cost data. An analyst selects a single cost driver and classifies each cost account as fixed or variable with respect to that costdriver. Account analysis will be reliable if the analyst isskilled and if the data are relevant to future uses of the derived cost function.3-17 There are four general methods covered in this text to measure mixed costs using historical data: (1) account analysis, (2) high-low, (3) visual fit, and (4) regression.• Account analysis looks to the organization's cost accounts andclassifies each cost as either fixed, variable, or mixed withregard to an appropriate cost driver.• High-low analysis algebraically measures mixed cost behavior by constructing a straight line between the cost at the highestactivity level and that at the lowest activity level.• Visual-fit analysis seeks to place a straight line among datapoints on a plot of each cost and its appropriate cost driver.• Regression analysis fits a straight line to cost and activitydata according to statistical criteria.3-18 Engineering analysis and account analysis often are combined. One of the problems of account analysis is that historical data maycontain past inefficiencies. Therefore, account analysis measures what costs were, not necessarily what they should be. Differences in future costs may be desired and/or anticipated, and accountanalysis alone usually will not account for these differences.Engineering analysis may be combined with account analysis torevise account-based measures for desired improvements inefficiency and/or planned changes in inputs or processes.3-19 The strengths of the high-low method are also its weaknesses -- the method is simple to apply since it does not require extensive data or statistical sophistication. This simplicity also meansthat the method may not be reliable because it may not use all the relevant data that are available, and choice of the two points to measure the linear cost relationship is subjective. The methoditself also does not give any measures of reliability.The visual-fit method is an improvement over the high-low methodbecause it uses all the available (relevant) data. However, this method, too, may not be reliable since it relies on the analyst's judgment on where to place the line.3-20 The cost-driver level should be used to determine the two data points to be used to determine the cost function. Why?Because the high- and low-cost points are more likely to havemeasurement errors, an unusually high cost at the high-cost point and an unusually low cost at the low-cost point.3-21 Regression analysis is usually preferred to the high-low method (and the visual-fit method) because regression analysis uses allthe relevant data and because easy-to-use computer software doesthe analysis and provides useful measures of cost functionreliability. The major disadvantage of regression analysis isthat it requires statistical sophistication to use properly.Because the software is easy to use, many users of regressionanalysis may not be able to critically evaluate the output and may be misled to believe that they have developed a reliable costfunction when they have not.3-22 This is a deceptive statement, because it is true on the face of it, but regression also has many pitfalls for the unwary. Yes,regression software provides useful output that can be used toevaluate the reliability of the measured cost function. If oneunderstands the assumptions of least-squares regression, thisoutput can be used to critically evaluate the measured function.However, the regression software cannot evaluate the relevance or accuracy of the data that are used. Even though regressionanalysis is statistically objective, irrelevant or inaccurate data used as input will lead to unreliable cost functions, regardlessof the strength of the statistical indicators of reliability.3-23 Plotting data helps to identify outliers, that is, observations that are unusual and may indicate a situation that is notrepresentative of the environment for which cost predictions arebeing made. It can also show nonlinear cost behavior that canlead to transformations of the data before applying linearregression methods.3-24 R2 is a goodness-of-fit statistic that describes the percentage of variation in cost explained by changes in the cost driver.3-25 Control of costs does require measurement of cost behavior, either what costs have been or what costs should be. Problems of workrules and the like may make changing cost behavior difficult.There are tradeoffs, of course, and the instructor should expectthat students could get into an impassioned debate over where the balance lies -- union job protection versus improved efficiency.This debate gets to one of the major roles of accounting inorganizations, and it is important that students realize thataccounting does matter greatly to individuals, and, ultimately, to society.3-26 The fixed salary portion of the compensation is a fixed cost. It is independent of how much is sold. In contrast, the 5%commission is a variable cost. It varies directly with the amount of sales. Because the compensation is part fixed cost and partvariable cost, it is considered a mixed cost.3-27 Both depreciation and research and development costs are fixed costs because they are independent of the volume of operations.Depreciation is generally a committed fixed cost. Managers havelittle discretion over the amount of the cost. In contrast,research and development costs are discretionary fixed costsbecause their size is often the result of management’s judgment.3-28 Decision makers should know a product’s cost function if their decisions affect the amount of product produced. To know the cost impact of their decisions, decision makers apply the cost function to each possible volume of production. This is important in many decisions, such as pricing decisions, promotion and advertisingdecisions, sales staff deployment decisions, and many moredecisions that affect the volume of product that the companyproduces.3-29 Regression analysis is a statistical method of fitting a cost-function line to observed costs. It is objective; that is, eachcost analyst would come up with the same regression line, whereas different analysts might have different cost functions when usinga visual fit method. In addition, regression analysis providesmeasures of how well the cost-function line fits the data, so that managers know how much reliance they can put on cost predictionsthat use the cost function.3-30 (5 min.) Only (b) is a step cost.(a) This is a fixed cost. The same cost applies to all volumesin the relevant range.(b) This is a true step cost. Each time 15 students are added,the cost increases by the amount of one teacher’s salary.(c) This is a variable cost that may be different per unit atdifferent levels of volume. It is not a step cost. Why? Because each unit of product requires a particular amount of steel,regardless of the form in which the steel is purchased.3-31 (5 min.) The $8,000 is a fixed cost and the $52 per unit is a variable cost. By definition, adding a fixed cost and a variablecost together produces a mixed cost.3-32 (10-15 min.)1. Machining labor: G, number of units completed or labor hours2. Raw material: B, units produced; could also be D if the company’spurchases do not affect the price of the raw material.3. Annual wage: C or E (depending on work levels), labor hours4. Water bill: H, gallons used5. Quantity discounts: A, amount purchased6. Depreciation: E, capacity7. Sheet steel: D, number of implements of various types8. Salaries: F, number of solicitors9. Natural gas bill: C, energy usage3-33 (15 min.)The analysis is faulty because of the following errors.1. The scales used for both axes are incorrect. The space betweenequal intervals in number of orders and order-department costsshould be the same.2. The visual-fit line is too high, and the slope is too steep. Itappears that the line has been purposely drawn to pass through the (100,450) data point and the $200 point on the y-axis to simplifythe analysis. A visual-fit line most often will not pass throughany one data point. Choosing one point (any point) or a data point and the Y-intercept makes this similar to the high-low method,ignoring much of the information contained in the rest of the data.3. The total cost for 90 orders is wrong. Either the fixed costsshould be expressed in thousands of dollars or the unit variablecosts should be $2,000 per order. Even if the derived total costfunction was accurate, the resulting cost prediction is incorrect.The formula should be expressed as:Total cost (thousands of dollars) = $200 + $2.50 × Number of orders processed, orTotal cost = $200,000 + $2,500 × Number of orders processedThis would result in a predicted total cost for 90 orders of:Total cost (thousands of dollars) = $200 + $2.50 × 90 = $425, orTotal cost = $200,000 + $2,500 × 90 = $425,000.Correct AnalysisThe following graph has correctly constructed scales. The visualfit line shown indicates that fixed costs are about $200,000 andvariable cost is about $2,250 per order – a lower slope than thatshown in the text.The total cost function is:Total cost (thousands of dollars) = $200 + $2.25 × Number of orders, or Total cost = $200,000 + $2,250 × Number of ordersVariable cost (thousands of dollars) $180 ÷ 80 orders = $2.25The predicted total cost for 90 orders is:Total cost = $200,000 + $2,250 × 90 = $200,000 + $202,500 = $402,500.3-34 (15-20 min.) Amounts are in millions.1. 2001 2002Sales revenues $57 $116Less: Operating income (loss) (19) 18Operating expenses $76 $ 982. Change in operating expenses ÷ Change in revenues = Variable cost percentage($98 - $76) ÷ ($116 - $57) = $22 ÷ $59 = .37 or 37%Fixed cost = Total cost – Variable cost= $76 - .37 × $57= $55or= $98 - .37 × $116= $55Cost function = $55 + .37 × Sales revenue3. Because fixed costs to not change, the entire additional totalcontribution margin is added to operating income. The $57 salesrevenue in 2001 generated a total contribution margin of $57 × (1 - .37) = $36, which was $19 short of covering the $55 of fixedcost. But the additional $59 of sales revenue in 2002 generated a total contribution margin of $59 × (1 - .37) = $37 that could go directly to operating income because there was no increase infixed costs. It wiped out the $19 operating loss and left $18 of operating income.3-35 (10-15 min.)1. Fuel costs: $.40 × 16,000 miles per month = $6,400 per month.2. Equipment rental: $5,000 × 7 × 3 = $105,000 for seven pieces ofequipment for three months3. Ambulance and EMT cost: $1,200 × (2,400/200) = $1,200 × 12 =$14,4004. Purchasing: $7,500 + $5 × 4,000 = $27,500 for the month.3-36 (10-15 min.) There may be some disagreement about these classifications, but reasons for alternative classifications should be explored.Cost Discretionary Committed Advertising $22,000Depreciation $ 47,000Company health insurance 21,000 Management salaries 85,000Payment of long-term debt 50,000Property tax 32,000Grounds maintenance 9,000Office remodeling 21,000Research and development 46,000Totals $98,000 $235,0003-37 (15-20 min.)This problem extends the chapter analysis to preview short-run decision making and capital budgeting. This problem ignores taxes, investment cost, and the time value of money, which are covered in Chapter 11.Alternative 1 Alternative 2 Variable cost per order $8.00 $4.00Expected number of orders 70,000 70,000Annual variable costs $560,000 $280,000Annual fixed cost 200,000 400,000Annual total costs $760,000 $680,000Therefore, Alternative 2 is less costly than Alternative 1 by $80,000.Let X = the break-even number of orders, the level at which expected costs are equal.Costs for Alternative 1 = Costs for Alternative 2$200,000 + $8X = $400,000 + $4X$4X = $200,000X = 50,000 ordersAt 50,000 orders, the alternatives are equivalent. If order levels are expected to be below 50,000 orders, then Alternative 1 would have lower costs because fixed costs are lower. If orders are expected to be greater than 50,000, then Alternative 2 would have lower costs because variable costs are lower.3-38 (20-25 min.) A master of the scatter-diagrams with least-square regression lines and high-low lines appears in Exhibit 3-38 on the following page.This exercise enables a comparison of the high-low and visual-fit methods of decomposing mixed-costs into fixed and variable parts. Students find it interesting to compare their best guesses to the least-squares regression results. They find it interesting that a fairly complete and accurate analysis is possible based on a scatter-diagram and a little common sense. We normally have the class determine a “class best guess” before showing the transparency of the regression results.The exercise also introduces students to the concept of a hierarchy of activity levels, although this topic is not covered in the text. The literature contains discussions of four general levels of activities. Recognizing each of these levels can be an aid in choosing appropriate cost drivers. These levels and example cost drivers are:a. Unit-level activities -- performed each time a unit is produced(units of product, machine hours, labor hours).b. Batch-level activities -- performed each time a batch of goods isprocessed or handled (number of orders processed, number ofsetups, number of material moves).c. Product-level activities -- performed as needed to support theproduction of each different type of product (number of tests,number of parts, number of engineering change notices, hours ofdesign time, number of inspections).d. Facility-level activities -- sustain a facility’s generalmanufacturing process (square footage, number of employees, hours of training).In this exercise, a batch-level activity is involved -- setups.。
管理会计英文版课后习题答案第二章产品成本计算Exercises2–1(指教材上的第2章练习第1题,下同)1. Part #72A Part #172CSteel* $ 12.00 $ 18.00Setup cost** 6.00 6.00Total $ 18.00 $ 24.00*($1.00 ? 12; $1.00 ? 18)**($60,000/10,000)Steel cost is assigned by calculating a cost per ounce and then multiplying this by the ounces used by each part: Cost per ounce = $3,000,000/3,000,000 ounces= $1.00 per ounceSetup cost is assigned by calculating the cost per setup and then dividing this by the number of units in each batch (there are 20 setups per year):Cost per setup = $1,200,000/20= $60,0002. The cost of steel is assigned through the driver tracing using thenumber of ounces of steel, and the cost of the setups is assigned through driver tracing also using number of setups as the driver.3. The assumption underlying number of setups as the driver is thateach part uses an equal amount of setup time. Since Part #72A uses double the setup time of Part #172C, it makes sense to assign setup costs based on setup time instead of number ofsetups. This illustrates the importance of identifying drivers that reflect the true underlying consumption pattern. Using setup hours [(40 ? 10) + (20 ?10)], we get the following rate per hour:Cost per setup hour = $1,200,000/600= $2,000 per hourThe cost per unit is obtained by dividing each part’s total setup costs by the number of units:Part #72A = ($2,000 ? 400)/100,000 = $8.00Part #172C = ($2,000 ? 200)/100,000 = $4.00Thus, Part #72A has its unit cost increased by $2.00, while Part #172C has its unit cost decreased by $2.00.problems2–51. Nursing hours required per year: 4 ? 24 hours ? 364 days* = 34,944*Note: 364 days = 7 days ? 52 weeksNumber of nurses = 34,944 hrs./2,000 hrs. per nurse = 17.472 Annual nursing cost = (17 ? $45,000) + $22,500= $787,500Cost per patient day = $787,500/10,000 days= $78.75 per day (for either type of patient)2. Nursing hours act as the driver. If intensive care uses half of thehours and normal care the other half, then 50 percent of the cost is assigned to each patient category. Thus, the cost per patient day by patient category is as follows:Intensive care = $393,750*/2,000 days= $196.88 per dayNormal care = $393,750/8,000 days= $49.22 per day*$525,000/2 = $262,500The cost assignment reflects the actual usage of the nursing resource and, thus, should be more accurate. Patient days would be accurate only if intensive care patients used the same nursing hours per day as normal care patients.3. The salary of the nurse assigned only to intensive care is a directlytraceable cost. To assign the other nursing costs, the hours of additional usage would need to be measured. Thus, both direct tracing and driver tracing would be used to assign nursing costs for this new setting.2–61. Bella Obra CompanyStatement of Cost of Services SoldFor the Year Ended June 30, 2006 Direct materials:.............................................................................. Beginninginventory .............................................................. $ 300,000.............................................................................. Add: Purchases 600, .............................................................................. Materials available $ 900, .............................................................................. Less: Ending inventory .............................................................. 450,000*Direct materials used .......................................... $ 450,000 Direct labor .......................................................... 12,000,0 Overhead .............................................................. 1,500,00 Total service costs added .................................. $ 13,950,0 Add: Beginning work in process ....................... 900,000 Total production costs ........................................ $ 14,850,0 Less: Ending work in process ........................... 1,500,00 Cost of services sold .......................................... $ 13,350,0 *Materials available lessmaterials used2. The dominant cost is direct labor (presumably the salaries of the 100professionals). Although labor is the major cost of providing manyservices, it is not always the case. For example, the dominant costfor some medical services may be overhead (e.g., CAT scans). Insome services, the dominant cost may be materials (e.g., funeralservices).3. Bella Obra CompanyIncome StatementFor the Year Ended June 30, 2006 Sales ..................................................................... $ 21,000,0 Cost of services sold .......................................... 13,350,0 Gross margin ....................................................... $ 7,650,00 Less operating expenses:.............................................................................. Selling expenses $ 900, .............................................................................. Administrative expenses ............................................................................................................................... 750,000.............................................................. 1,650,000Income before income taxes .............................. $ 6,000,00 4. Services have four attributes that are not possessed by tangible products: (1) intangibility, (2) perishability, (3) inseparability, and (4)heterogeneity. Intangibility means that the buyers of services cannotsee, feel, hear, or taste a service before it is bought. Perishabilitymeans that services cannot be stored. This property affects thecomputation in Requirement 1. Inability to store services means thatthere will never be any finished goods inventories, thus making thecost of services produced equivalent to cost of services sold.Inseparability simply means that providers and buyers of servicesmust be in direct contact for an exchange to take place.Heterogeneity refers to the greater chance for variation in theperformance of services than in the production of tangible products.2–71. Direct materials:Magazine (5,000 ? $0.40) $ 2,000Brochure (10,000 ? $0.08) 800 $ 2,800 Direct labor:Magazine [(5,000/20) ? $10] $ 2,500Brochure [(10,000/100) ? $10] 1,000 3,500 Manufacturing overhead:Rent $ 1,400Depreciation [($40,000/20,000) ? 350*] 700Setups 600Insurance 140Power 350 3,190 Cost of goods manufactured $ 9,490*Production is 20 units per printing hour for magazines and 100units per printing hour for brochures, yielding monthly machinehours of 350 [(5,000/20) + (10,000/100)]. This is also monthly laborhours, as machine labor only operates the presses.2. Direct materials $ 2,800Direct labor 3,500Total prime costs $ 6,300Magazine:Direct materials $ 2,000Direct labor 2,500Total prime costs $ 4,500Brochure:Direct materials $ 800Direct labor 1,000Total prime costs $ 1,800Direct tracing was used to assign prime costs to the two products.3. Total monthly conversion cost:Direct labor $ 3,500Overhead 3,190Total $ 6,690Magazine:Direct labor $ 2,500 Overhead:Power ($1 ? 250) $ 250Depreciation ($2 ? 250) 500Setups (2/3 ? $600) 400Rent and insurance ($4.40 ? 250 DLH)* 1,100 2,250 Total $ 4,750 Brochure:Direct labor $ 1,000 Overhead:Power ($1 ? 100) $ 100Depreciation ($2 ? 100) 200Setups (1/3 ? $600) 200Rent and insurance ($4.40 ? 100 DLH)* 440 940 Total $ 1,940 *Rent and insurance cannot be traced to each product so the costsare assigned using direct labor hours: $1,540/350 DLH = $4.40 perdirect labor hour. The other overhead costs are traced according totheir usage. Depreciation and power are assigned by using machine hours (250 for magazines and 100 for brochures): $350/350 = $1.00 per machine hour for power and $40,000/20,000 = $2.00 per machine hour for depreciation. Setups are assigned according to the time required. Since magazines use twice as much time, they receive twice the cost: Letting X = the proportion of setup time used for brochures, 2X + X = 1 implies a cost assignment ratio of 2/3 for magazines and 1/3 for brochures.Exercises3–11. Resource Total Cost Unit CostPlastic1$ 10,800 $0.027Direct labor andvariable overhead28,000 0.020Mold sets320,000 0.050Other facility costs410,000 0.025 Total $ 48,800 $0.12210.90 ? $0.03 ? 400,000 = $10,800; $10,800/400,000 = $0.0272$0.02 ? 400,000 = $8,000; $8,000/400,000 = $0.023$5,000 ? 4 quarters = $20,000; $20,000/400,000 = $0.054$10,000; $10,000/400,000 = $0.0252. Plastic, direct labor, and variable overhead are flexible resources;molds and other facility costs are committed resources. The cost of plastic, direct labor, and variable overhead are strictly variable. The cost of the molds is fixed for the particular action figure being produced; it is a step cost for the production of action figures in general. Other facility costs are strictly fixed.3–3High (1,400, $7,950); Low (700, $5,150)V = ($7,950 – $5,150)/(1,400 – 700)= $2,800/700 = $4 per oil changeF = $5,150 – $4(700)= $5,150 – $2,800 = $2,350Cost = $2,350 + $4 (oil changes)Predicted cost for January = $2,350 + $4(1,000) = $6,350problems3–61. High (1,700, $21,000); Low (700, $15,000)V = (Y2– Y1)/(X2– X1)= ($21,000 – $15,000)/(1,700 – 700) = $6 per receiving orderF = Y2– VX2= $21,000 – ($6)(1,700) = $10,800Y = $10,800 + $6X2. Output of spreadsheet regression routine with number of receivingorders as the independent variable:Constant 4512.98701298698 Std. Err. of Y Est. 3456.24317476605 R Squared 0.633710482694768 No. of10ObservationsDegrees of8 FreedomX Coefficient(s) 13.3766233766234Std. Err. of Coef. 3.59557461331427V = $13.38 per receiving order (rounded)F = $4,513 (rounded)Y = $4,513 + $13.38XR2 = 0.634, or 63.4%Receiving orders explain about 63.4 percent of the variability in receiving cost, providing evidence that Tracy’s choi ce of a cost driver is reasonable. However, other drivers may need to be considered because 63.4 percent may not be strong enough to justify the use of only receiving orders.3. Regression with pounds of material as the independent variable:Constant 5632.28109733183 Std. Err. of Y Est. 2390.10628259277 R Squared 0.824833789433823 No. of10ObservationsDegrees of8 FreedomX Coefficient(s) 0.0449642991356633Std. Err. of Coef. 0.0073259640055344V = $0.045 per pound of material delivered (rounded)F = $5,632 (rounded)Y = $5,632 + $0.045XR2 = 0.825, or 82.5%Pounds of material delivered explains about 82.5 percent of the variability in receiving cost. This is a better result than that ofthe receiving orders and should convince Tracy to try multiple regression.4. Regression routine with pounds of material and number of receiving orders as the independent variables:Constant 752.104072925631 Std. Err. of Y Est. 1350.46286973443 R Squared 0.951068418023306 No. of10ObservationsDegrees of7 FreedomX Coefficient(s) 0.0333883151096915 7.14702865269395 Std. Err. of Coef. 0.00495524841198368 1.68182916088492 V1= $0.033 per pound of material delivered (rounded)V2= $7.147 per receiving order (rounded)F = $752 (rounded)Y = $752 + $0.033a + $7.147bR2= 0.95, or 95%Multiple regression with both variables explains 95 percent of thevariability in receiving cost. This is the best result.5–21. Job #57 Job #58 Job #59Balance, 7/1 $ 22,450 $ 0 $ 0Direct materials 12,900 9,900 35,350Direct labor 20,000 6,500 13,000Applied overhead:Power 750 600 3,600Material handling 1,500 300 6,000Purchasing 250 1,000 250 Total cost $ 57,850 $ 18,300 $ 58,2002. Ending balance in Work in Process = Job #58 = $18,3003. Ending balance in Finished Goods = Job #59 = $58,2004. Cost of Goods Sold = Job #57 = $57,850problems5–31. Overhead rate = $180/$900 = 0.20 or 20% of direct labor dollars.(This rate was calculated using information from the Ladan job;however, the Myron and Coe jobs would give the same answer.)2. Ladan Myron Coe Walker WillisBeginning WIP $ 1,730 $1,180 $2,500 $ 0 $ 0 Direct materials 400 150 260 800 760 Direct labor 800 900 650 350 900 Applied overhead 160 180 130 70 180 Total $ 3,090 $2,410 $3,540 $ 1,220 $ 1,840 Note: This is just one way of setting up the job-order cost sheets.You might prefer to keep the detail on the materials, labor, andoverhead in beginning inventory costs.3. Since the Ladan and Myron jobs were completed, the others muststill be in process. Therefore, the ending balance in Work in Process is the sum of the costs of the Coe, Walker, and Willis jobs.Coe $3,540Walker 1,220Willis 1,840Ending Work in Process $6,600Cost of Goods Sold = Ladan job + Myron job = $3,090 + $2,410 = $5,5004. Naman CompanyIncome StatementFor the Month Ended June 30, 20XXSales (1.5 ? $5,500) ................................................................... $8,250 Cost of goods sold ................................................................... 5,500 Gross margin ............................................................................ $2,750 Marketing and administrative expenses ................................ 1,200 Operating income ..................................................................... $1,550 5–201. Overhead rate = $470,000/50,000 = $9.40 per MHr2. Department A: $250,000/40,000 = $6.25 per MHrDepartment B: $220,000/10,000 = $22.00 per MHr3. Job #73 Job #74Plantwide:70 ? $9.40 = $658 70 ? $9.40 = $658Departmental:20 ? $6.25 $ 125.00 50 ? $6.25 $ 312.5050 ? $22 1,100.00 20 ? $22 440.00$ 1,225.00 $ 752.50Department B appears to be more overhead intensive, so jobs spending more time in Department B ought to receive more overhead. Thus, departmental rates provide more accuracy.4. Plantwide rate: $250,000/40,000 = $6.25Department B: $62,500/10,000 = $6.25Job #73 Job #74Plantwide:70 ? $6.25 = $437.50 70 ? $6.25 = $437.50Departmental:20 ? $6.25 $ 125.00 50 ? $6.25 $ 312.5050 ? $6.25 312.50 20 ? $6.25 125.00$ 437.50 $ 437.50 Assuming that machine hours is a good cost driver, the departmental rates reveal that overhead consumption is the same in each department. In this case, there is no need for departmental rates, anda plantwide rate is sufficient.5–41. Overhead rate = $470,000/50,000 = $9.40 per MHr2. Department A: $250,000/40,000 = $6.25 per MHrDepartment B: $220,000/10,000 = $22.00 per MHr3. Job #73 Job #74Plantwide:70 ? $9.40 = $658 70 ? $9.40 = $658Departmental:20 ? $6.25 $ 125.00 50 ? $6.25 $ 312.5050 ? $22 1,100.00 20 ? $22 440.00$ 1,225.00 $ 752.50 Department B appears to be more overhead intensive, so jobs spending more time in Department B ought to receive more overhead. Thus, departmental rates provide more accuracy.4. Plantwide rate: $250,000/40,000 = $6.25Department B: $62,500/10,000 = $6.25Job #73 Job #74Plantwide:70 ? $6.25 = $437.50 70 ? $6.25 = $437.50Departmental:20 ? $6.25 $ 125.00 50 ? $6.25 $ 312.5050 ? $6.25 312.50 20 ? $6.25 125.00$ 437.50 $ 437.50 Assuming that machine hours is a good cost driver, the departmental rates reveal that overhead consumption is the same in each department. In this case, thereis no need for departmental rates, anda plantwide rate is sufficient.5–51. Last year’s unit-based overhead rate = $50,000/10,000 = $5This year’s unit-based overhead rate = $100,000/10,000 = $10Last Year This Year Bike cost:2 ? $20 $ 40 $ 403 ? $12 36 36Overhead:5 ? $5 255 ? $10 50Total $101 $126P rice last year = $101 ? 1.40 = $141.40/dayPrice this year = $126 ? 1.40 = $176.40/dayThis is a $35 increase over last year, nearly a 25 percent increase. No doubt the Carsons are not pleased and would consider looking around for other recreational possibilities.2. Purchasing rate = $30,000/10,000 = $3 per purchase orderPower rate = $20,000/50,000 = $0.40 per kilowatt hourMaintenance rate = $6,000/600 = $10 per maintenance hour Other rate = $44,000/22,000 = $2 per DLHBike Rental Picnic Catering Purchasing$3 ? 7,000 $21,000$3 ? 3,000 $ 9,000 Power$0.40 ? 5,000 2,000$0.40 ? 45,000 18,000 Maintenance$10 ? 500 5,000$10 ? 100 1,000 Other$2 ? 11,000 22,000 22,000 Total overhead $50,000 $50,000 3. This year’s bike rental overhead rate = $50,000/10,000 = $5 Carson rental cost = (2 ? $20) + (3 ? $12) + (5 ? $5) = $101 Price = 1.4 ? $101 = $141.40/day4. Catering rate = $50,000/11,000 = $4.55* per DLHCost of Estes job:Bike rental rate (2 ? $7.50) $15.00Bike conversion cost (2 ? $5.00) 10.00Catering materials 12.00Catering conversion (1 ? $4.55) 4.55Total cost $41.55*Rounded5. The use of ABC gives Mountain View Rentals a better idea of thetypes and costs of activities that are used in their business. Adding Level 4 bikes will increase the use of the most expensive activities, meaning that the rental rate will no longer be an average of $5 per rental day. Mountain View Rentals might need to set a Level 4 price based on the increased cost of both the bike and conversion cost.分步成本法6–11. C utting Sewing PackagingDepartment Department Department Direct materials $5,400 $ 900 $ 225 Direct labor 150 1,800 900 Applied overhead 750 3,600 900 Transferred-in cost:From cutting 6,300From sewing 12,600 Total manufacturing cost $6,300 $12,600 $14,625 2. a. Work in Process—Sewing ................. 6,300 Work in Process—Cutting .......... 6,300b. Work in Process—Packaging ............ 12,600Work in Process—Sewing .......... 12,600c. Finished Goods ................................... 14,625Work in Process—Packaging ..... 14,6253. Unit cost = $14,625/600 = $24.38* per pair6–21. Units transferred out: 27,000 + 33,000 – 16,200 = 43,8002. Units started and completed: 43,800 – 27,000 = 16,8003. Physical flow schedule:Units in beginning work in process 27,000Units started during the period 33,000 Total units to account for 60,000 Units started and completed 16,800Units completed from beginning work in process 27,000Units in ending work in process 16,200 Total units accounted for 60,0004. Equivalent units of production:Materials Conversion Units completed 43,800 43,800 Add: Units in ending work in process:(16,200 ? 100%) 16,200(16,200 ? 25%) 4,050 Equivalent units of output 60,000 47,850 6–31. Physical flow schedule:Units to account for:Units in beginning work in process 80,000 Units started during the period 160,000 Total units to account for 240,000 Units accounted for:Units completed and transferred out:Started and completed 120,000From beginning work in process 80,000 200,000 Units inending work in process 40,000 Total units accounted for 240,000 2. Units completed 200,000Add: Units in ending WIP ? Fraction complete(40,000 ? 20%) 8,000 Equivalent units of output 208,0003. Unit cost = ($374,400 + $1,258,400)/208,000 = $7.854. Cost transferred out = 200,000 ? $7.85 = $1,570,000Cost of ending WIP = 8,000 ? $7.85 = $62,8005. Costs to account for:Beginning work in process $ 374,400Incurred during June 1,258,400Total costs to account for $ 1,632,800Costs accounted for:Goods transferred out $ 1,570,000Goods in ending work in process 62,800 Total costs accounted for $ 1,632,8006–31、Units t0 account for:Units in beginning work in process(25% completed) 10000 Units started during the period 70000 Total units to account for 80000 Units accounted forUnits completed and transferred outStarted and completed 50000From beginning work in process 10000 60000 Units in ending work in process(60% completed) 20000 Total units accounted for 80000 2、60000+20000×60%=72000(units ) 3、Unit cost for materials:4900035100056000020000+=+($/unit )Unit cost for convension:2625787351.136000012000+=+($/unit )Total unit cost:5+1.13=6.13($/unit )4、The cost of units of transferred out:60000×6.13=367800($)The cost of units of ending work in process:20000×5+20000×20%×1.13=113560($)作业成本法4–21. Predetermined rates:Drilling Department: Rate = $600,000/280,000 = $2.14* per MHrAssembly Department: Rate = $392,000/200,000= $1.96 per DLH*Rounded2. Applied overhead:Drilling Department: $2.14 ? 288,000 = $616,320Assembly Department: $1.96 ? 196,000 = $384,160Overhead variances:Drilling Assembly Total Actual overhead $602,000 $ 412,000 $ 1,014,000 Applied overhead 616,320 384,160 1,000,480 Overhead variance $ (14,320) over $ 27,840 under $ 13,520 3. Unit overhead cost = [($2.14 ? 4,000) + ($1.96 ? 1,600)]/8,000 = $11,696/8,000= $1.46**Rounded4–31. Yes. Since direct materials and direct labor are directly traceable toeach product, their cost assignment should be accurate.2. Elegant: (1.75 ? $9,000)/3,000 = $5.25 per briefcaseFina: (1.75 ? $3,000)/3,000 = $1.75 per briefcaseNote: Overhead rate = $21,000/$12,000 = $1.75 per direct labor dollar (or 175 percent of direct labor cost).There are more machine and setup costs assigned to Elegant thanFina. This is clearly a distortion because the production of Fina isautomated and uses the machine resources much more than thehandcrafted Elegant. In fact, the consumption ratio for machining is0.10 and 0.90 (using machine hours as the measure of usage). Thus,Fina uses nine times the machining resources as Elegant. Setupcosts are similarly distorted. The products use an equal number of setups hours. Yet, if direct labor dollars are used, then the Elegant briefcase receives three times more machining costs than the Finabriefcase.3. Overhead rate = $21,000/5,000= $4.20 per MHrElegant: ($4.20 ? 500)/3,000 = $0.70 per briefcaseFina: ($4.20 ? 4,500)/3,000 = $6.30 per briefcaseThis cost assignment appears more reasonable given the relativedemands each product places on machine resources. However, oncea firm moves to a multiproduct setting, using only one activity driverto assign costs will likely produce product cost distortions. Productstend to make different demands on overhead activities, and thisshould be reflected in overhead cost assignments. Usually, thismeans the use of both unit- and nonunit-level activity drivers. In thisexample, there is a unit-level activity (machining) and a nonunit-levelactivity (setting up equipment). The consumption ratios for each(using machine hours and setup hours as the activity drivers) are asfollows:Elegant FinaMachining 0.10 0.90 (500/5,000 and4,500/5,000)Setups 0.50 0.50 (100/200 and 100/200)Setup costs are not assigned accurately. Two activity rates are needed—one based on machine hours and the other on setup hours:Machine rate: $18,000/5,000 = $3.60 per MHrSetup rate: $3,000/200 = $15 per setup hourCosts assigned to each product:Machining: Elegant Fina$3.60 ? 500 $ 1,800$3.60 ? 4,500 $ 16,200Setups:$15 ? 100 1,500 1,500Total $ 3,300 $ 17,700Units ÷3,000 ÷3,000Unit overhead cost $ 1.10 $ 5.904:Elegant Unit overhead cost:[9000+3000+18000*500/5000+3000/2]/3000=$5.1 Fina Unit overhead cost:[3000+3000+18000*4500/5000+3000/2]/3000=$7.94–51. Deluxe Percent Regular PercentPrice $900 100% $750 100%Cost 576 64 600 80Unit gross profit $324 36% $150 20% Total gross profit:($324 ? 100,000) $32,400,000($150 ? 800,000) $120,000,000 2. Calculation of unit overhead costs:Deluxe gularUnit-level:Machining:$200 ? 100,000 $20,000,000$200 ? 300,000 $60,000,000 Batch-level:Setups:$3,000 ? 300 900,000$3,000 ? 200 600,000 Packing:$20 ? 100,000 2,000,000$20 ? 400,000 8,000,000 Product-level:Engineering:$40 ? 50,000 2,000,000$40 ? 100,000 4,000,000 Facility-level:Providing space:$1 ? 200,000 200,000$1 ? 800,000 800,000 Total overhead $25,100,000 $73,400,000 Units ÷100,000 ÷ 800,000 Overhead per unit $251 $91.75Deluxe Percent Regular Percent Price $900 100% $750.00 100% Cost 780* 87*** 574.50** 77*** Unit gross profit $120 13%*** $175.50 23%*** Total gross profit:($120 ? 100,000) $12,000,000($175.50 ? 800,000) $140,400,000*$529 + $251**$482.75 + $91.753. Using activity-based costing, a much different picture of the deluxeand regular products emerges. The regular model appears to be more profitable. Perhaps it should be emphasized.4–61. JIT Non-JITSales a$12,500,000 $12,500,000Allocation b750,000 750,000a$125 ?100,000, where $125 = $100 + ($100 ?0.25), and 100,000 is the average order size times the number of orders b0.50 ? $1,500,0002. Activity rates:Ordering rate = $880,000/220 = $4,000 per sales orderSelling rate = $320,000/40 = $8,000 per sales callService rate = $300,000/150 = $2,000 per service callJIT Non-JIT Ordering costs:$4,000 ? 200 $ 800,000$4,000 ? 20 $ 80,000 Selling costs:$8,000 ? 20 160,000$8,000 ? 20 160,000 Service costs:$2,000 ? 100 200,000$2,000 ? 50 100,000 T otal $1,160,000 $340,0 0For the non-JIT customers, the customer costs amount to $750,000/20 = $37,500 per order under the original allocation. Using activity assignments, this drops to $340,000/20 = $17,000 per order, a difference of $20,500 per order. For an order of 5,000 units, the order price can be decreased by $4.10 per unit without affecting customer profitability. Overall profitability will decrease, however, unless the price for orders is increased to JIT customers.3. It sounds like the JIT buyers are switching their inventory carryingcosts to Emery without any significant benefit to Emery. Emery needs to increase prices to reflect the additional demands on customer-support activities. Furthermore, additional price increases may be needed to reflect the increased number of setups, purchases, and so on, that are likely occurring inside the plant. Emery should also immediately initiate discussions with its JIT customers to begin negotiations for achieving some of the benefits that a JIT supplier should have, such as long-term contracts. The benefits of long-term。
Cost and Management Accounting English Version 15th Edition Exercise Questions with Answers Cost and management accounting is a crucial aspect of any business organization. It is a process that involves collecting, analyzing, and interpreting financial information to help companies make informed decisions. The 15th edition of Cost and Management Accounting focuses on the principles, techniques, and practices that are important inanalyzing costs in a manufacturing and service environment.In this article, we will provide a series of exercise questions with answers from the 15th edition of Cost and Management Accounting.Exercise Questions1.Expln the difference between actual and normal capacity.2.Describe the different types of cost behavior: fixed,variable, and semi-variable.3.What is cost-volume-profit analysis? How can this analysisbe used to make decisions?4.What are the different methods for allocating overhead costs?Which method is most appropriate in a particular situation?5.Expln the difference between job-order costing and processcosting.6.What is activity-based costing? How can it be used toimprove decision-making?7.Define cost of goods manufactured and cost of goods sold.8.What is the difference between job costing and processcosting?9.Expln the difference between direct materials, direct labor,and manufacturing overhead.10.How can a company use budgeting to plan, control, andevaluate performance?Answers1.Actual capacity refers to the maximum amount of goods orservices a company can produce in a given period, while normal capacity is the expected capacity level given typical business conditions.2.Fixed costs remn constant regardless of the level ofactivity, while variable costs change in proportion to changes in activity levels. Semi-variable costs have both fixed and variable cost components.3.Cost-volume-profit analysis is a tool used to understand howchanges in volume, price, and costs affect a company’s profits.It can be used to make decisions regarding pricing, product mix, and cost reduction strategies.4.The different methods for allocating overhead costs includedirect labor hours, direct labor cost, machine hours, andactivity-based costing. The most appropriate method depends on the nature of the costs and the activities being performed.5.Job-order costing is used for unique, customized products orservices, while process costing is used for mass-produced products or services that are identical.6.Activity-based costing is a costing method that identifiesall the activities that go into producing a product or service and assigns costs based on the activities. It can be used to improvedecision-making by providing more accurate cost information andidentifying areas where costs can be reduced.7.Cost of goods manufactured is the total cost of producinggoods, including direct materials, direct labor, and manufacturing overhead. Cost of goods sold is the cost of the goods that havebeen sold during a period.8.The mn difference between job costing and process costing isthe type of product being produced. Job costing is used for unique, customized products, while process costing is used for mass-produced products.9.Direct materials are the materials that go into a product,such as raw materials or components. Direct labor is the cost ofthe workers directly involved in producing the product.Manufacturing overhead includes all other costs that are necessary for producing a product, such as utilities, rent, and equipmentmntenance.10.Budgeting can be used to plan, control, and evaluateperformance. By setting targets and monitoring actual performanceagnst those targets, a company can identify areas where it needsto make changes to achieve its goals.In conclusion, cost and management accounting is a critical aspectof business decision-making. The 15th edition of Cost and Management Accounting provides a comprehensive overview of the principles, techniques, and practices that are essential for analyzing costs in amanufacturing and service environment. These exercise questions and answers can be used to reinforce your understanding and test your knowledge.。
CHAPTER 11Capital Budgeting11-A1 (15-25 min.) Answers are printed in the text at the end of the assignment material.11-29 (10-15 min.)1. The present value is $480,000 and the annual payments are an annuity, requiringuse of Table 2:(a)$480,000 = annual payment × 11.2578annual payment = $480,000 ÷ 11.2578 = $42,637(b)$480,000 = annual payment × 9.4269annual payment = $480,000 ÷ 9.4269 = $50,918(c)$480,000 = annual payment × 8.0552annual payment = $480,000 ÷ 8.0552 =$59,5892. (a)$480,000 = annual payment × 8.5595annual payment = $480,000 ÷ 8.5595 = $56,078(b)$480,000 = annual payment × 7.6061annual payment = $480,000 ÷ 7.6061 = $63,107(c)$480,000 = annual payment × 6.8109annual payment = $480,000 ÷ 6.8109 =$70,4753. (a) Total payments= 30 × $50,918 = $1,527,540Total interest paid= $1,527,540- $480,000 = $1,047,540(b) Total payments= 15 × $63,107= $946,605Total interest paid = $946,605 - $480,000 = $466,60511-36 (10 min.)Buy. The net present value is positive.Initial outlay * $(21,000)Present value of cash operating savings, from12-year, 12% column of Table 2, 6.1944 × $5,000 30,972Net present value $ 9,972* The trade-in allowance really consists of a $5,000 adjustment of the sellingprice and a bona fide $10,000 cash allowance for the old equipment. Therelevant amount is the incremental cash outlay, $21,000. The book value isirrelevant.11-39 (10-15 min.)Copyright ©2011 Pearson Education 1Copyright ©2011 Pearson Education21. NPV @ 10% = 10,000 × 3.7908 = $37,908 - $36,048 = $1,860 NPV @ 12% = 10,000 × 3.6048 = $36,048 - $36,048 = $0NPV @ 14% = 10,000 × 3.4331 = $34,331 - $36,048 = $(1,717)2.The IRR is the interest rate at which NPV = $0; therefore, from requirement 1 we know that IRR = 12%.3.The NPV at the company’s cost of capital, 10%, is positive, so the project should be accepted.4.The IRR (12%) is greater than the company’s cost of capital (10%), so the project should be accepted. Note that the IRR and NPV models give the same decision.11-46 (10-15 min.)Annual addition to profit = 40% × $25,000 = $10,000.1.Payback period is $36,000 ÷ $10,000 = 3.6 years. It is not a good measure of profitability because it ignores returns beyond the payback period and it does not account for the time value of money.2. NPV = $5,114. Accept the proposal because NPV is positive. Computation: NPV = ($10,000 × 4.1114) - $36,000= $41,114 - $36,000 = $ 5,1143. ARR = (Increase in average cash flow – Increase in depreciation) ÷ Initialinvestment= ($10,000 - $6,000) ÷ $36,000 = 11.1%11-51 (30-35 min.)1.Annual Operating Cash FlowsXeroxCannon Difference Salaries $49,920(a) $41,600(b) $ 8,320 Overtime 1,728(c) -- 1,728 Repairs and maintenance 1,800 1,050 750Toner, supplies, etc. 3,6003,300 300 Total annual cash outflows $57,048 $45,950 $11,098(a) ($ 8 × 40 hrs.) × 52 weeks × 3 employees = $320 × 52 × 3 = $49,920 (b) ($10 × 40 hrs.) × 52 weeks × 2 employees = $400 × 52 × 2 = $41,600 (c) ($12 × 4 hrs.) × 12 months × 3 machines = $ 48 × 12 × 3 = $ 1,728Initial Cash FlowsXeroxCannon Difference Purchase of Cannon machines $ -- $50,000 $50,000Sale of Xerox machines -- -3,000 -3,000 Training and remodeling -- 4,000 4,000 Total $ -- $51,000 $51,000Copyright ©2011 Pearson Education 3EXHIBIT 11-50All numbers are expressed in Mexican pesos.2. 18% Total Sketch of Relevant Cash Flows(inthousands)PresentPVFactor Value 0 1 2 3 4 5Cash operating savings:* .8475 83,902 99,000108,90078,212.718272,904119,790.608667,966 131,769 .5158.4371 63,356 144,946Total366,340Income tax savings fromdepreciation not changedby inflation, see 1 3.1272 105,074 33,600 33,600 33,600 33,600 33,600471,414TotalRequired outlay at time zero 1.0000 (420,000) (420,000)Net present value 51,414*Amounts are computed by multiplying (150,000 × .6) = 90,000 by 1.10, 1.10 2, 1.10 3, etc.Copyright ©2011 Pearson Education 461PV PresentofValue$1.00ofCashFlows Annual Cash FlowsDiscountedat 12% 0 1 2 3 4 5T OTAL P ROJECT A PPROACH:Cannon:Init. cash outflow 1.0000 $ (51,000)Oper. cash flows 3.6048 (165,641) (45,950) (45,950) (45,950) (45,950) (45,950)Total $(216,641)Xerox:Oper. cash flows 3.6048 $(205,647) (57,048) (57,048) (57,048) (57,048) (57,048)Difference in favor ofretaining Xerox $ (10,994)I NCREMENTAL A PPROACH:Initial investment 1.0000 $(51,000)Annual operatingcash savings 3.6048 40,006 11,098 11,098 11,098 11,098 11,098Net present valueof purchase $(10,994)2. The Xerox machines should not be replaced by the Cannon equipment.Net savings = (Present value of expenditures to retain Xerox machines) less (Present value of expenditures toconvert to Cannon machines)= $205,647 - $216,641 = $(10,994)3. a. How flexible is the new machinery? Will it be useful only for the presently intended functions, or can it be easilyadapted for other tasks that may arise over the next 5 years?b. What psychological effects will it have on various interested parties?Copyright ©2011 Pearson Education 46211-71 (60-90 min.)This is a complex problem because it requires comparing three alternatives. It reviews Chapter 6 as well as covering several of the topics of Chapter 11. The following answer uses the total project approach. The total net future cash outflows are shown for each alternative.1. Alternative A: Continue to manufacture the parts with the current tools.Annual cash outlaysVariable cost, $92 × 8,000 $(736,000)Fixed cost, 1/3 × $45 × 8,000 × .6 (72,000)Tax savings, .4 × ($736,000 + $72,000) 323,200After-tax annual cost $(484,800)Present value, 3.6048 × $484,800 $(1,747,607)PV of remaining tax savings on MACRS:11.52% × $2,000,000 × .4 × .8929 82,2905.76% × $2,000,000 × .4 × .7972 36,735Total present value of costs, Alternative A $(1,628,582)Alternative B: Purchase from outside supplierAnnual cash outlaysPurchase cost, $110 × 8,000 $(880,000)Tax savings, $880,000 × .4 352,000After-tax annual cost $(528,000)Copyright ©2011 Pearson Education 463Present value, $528,000 × 3.6048 $(1,903,334)Sale of old equipment:Sales price $ 400,000Book value [(11.52% + 5.76%) × $2,000,000] 345,600Gain $ 54,400Taxes @ 40% (21,760)Total after-tax effect ($400,000 - $21,760) 378,240Total present value of costs, Alternative B $(1,525,094)Copyright ©2011 Pearson Education 464Alternative C: Purchase new toolsInvestment $(1,800,000) Annual cash outlaysVariable cost, $73 × 8,000 $(584,000)Fixed cost (same as A) (72,000)Tax savings, .4 × ($584,000 + $72,000) 262,400After-tax annual cost $(393,600)Present value, $393,600 × 3.6048 (1,418,849)Tax savings on new equipment* 579,217Effect of disposal of new equipmentSales price $ 500,000Book value 0Gain $500,000Taxes @ 40% 200,000Total after-tax effect $ 300,000Present value, $300,000 × .5674 170,220Effect of disposal of old equipment (see Alternative B) 378,240Total present value of costs, Alternative C $(2,091,172)* Using the MACRS schedule for tax depreciation, the depreciation rate for each year of a 3-year asset's life is shown inExhibit 11-6:Depreciation Tax PV PresentYear Rate Savings Factor Value1 33.33% .3333 × $1,800,000 × .40 = $239,976 .8929 $214,2752 44.45% .4445 × 1,800,000 × .40 = 320,040 .7972 255,1363 14.81% .1481 × 1,800,000 × .40 = 106,632 .7118 75,9014 7.41% .0741 × 1,800,000 × .40 = 53,352 .6355 33,905Total present value of tax savings $579,217Using Exhibit 11-7, we get .8044 × $1,800,000 × .4 = $579,168, which differs from $579,217 by a $49 rounding error.The alternative with the lowest present value of cost is Alternative B, purchasing from the outside supplier.Copyright ©2011 Pearson Education 4652. Among the major factors are (1) the range of expected volume (both large increases and decreases in volume make thepurchase of the parts relatively less desirable), (2) the reliability of the outside supplier, (3) possible changes inmaterial, labor, and overhead prices, (4) the possibility that the outside supplier can raise prices before the end of five years, (5) obsolescence of the products and equipment, and (6) alternate uses of available capacity (alternative uses make Alternative B relatively more desirable).Copyright ©2011 Pearson Education 466Copyright ©2011 Pearson Education467CHAPTER 12 Cost Allocation12-30 (10-15 min.) 1. Rate = [$2,500 + ($.05 × 100,000)] ÷ 100,000 = $.075 per copy Cost allocated to City Planning in August = $.075 × 42,000 = $3,150. 2. Fixed cost pool allocated as a lump sum depending on predicted usage:To City Planning: (36,000 ÷ 100,000) × $2,500 = $900 per monthVariable cost pool allocated on the basis of actual usage: $.05 × number of copies Cost allocated to City Planning in August: $900 + ($.05 × 42,000) = $3,000. 3. The second method, the one that allocated fixed- and variable-cost pools separately, is preferable. It better recognizesthe causes of the costs. The fixed cost depends on the size of the photocopy machine, which is based on predicted usage and is independent of actual usage. Variable costs, in contrast are caused by actual usage.Exhibit 12-34Customer Type 1Customer Type 2 Customer Type 3 Sales Gross price profit per margin Gross Gross Gross Product unit per unit Units Revenue profit Units Revenue profit Units Revenue profitA $11.031$ 4.14 200 $ 2,206 $ 828 2,200 $ 24,266 $ 9,108 500 $ 5,515 $ 2,070 B 20.47 4.09 100 2,047 409 1,200 24,564 4,908 3,000 61,410 12,270 C 51.38 10.28 50 2,569 514 400 20,552 4,112 5,000 256,900 51,400D 90.00 39.38 400 36,000 15,752 800 72,000 31,504 400 36,000 15,752Total 750 $42,822 17,5034,600 $141,382 49,632 8,900 $359,825 81,492 Cost to serve 7,36845,193 87,439 Operating income $10,135 $4,439 ($5,947) Customer gross margin percentage 40.9% 35.1% 22.6% Cost to serve percentage 17.2% 32.0% 24.3%Customer operating income percentage 23.7%3.1% (1.7%)1$32,000 ÷ 2,900 units; etc. The rounded numbers from the first two columns are used in subsequent calculations.5. The chart below shows customer profitability for the three customer types and suggested strategies for profit improvement.Grow business with this customer type byfocused sales efforts and quantity discounts.Work with customers to lowerthe cost to serve. Seek internalprocess improvements to lowerthose elements of the cost toserve controllable by thecompany.Copyright ©2011 Pearson Education 46912-35 (15-20 min.)of1. AllocationCostsGallons Weighting Joint$300,000 $180,000×A 9,000 9/15SolventSolvent B 6,000 6/15 × $300,000 120,00015,000 $300,0002. Relative Sales Allocation ofCostsValue at Split-off* Weighting JointSolvent A $270,000 27/54 × $300,000 $150,000Solvent B 270,000 27/54 × $300,000 150,000$540,000 $300,000 * $30 × 9,000 and $45 × 6,00012-42 (25-30 min.)There a several ways to organize an analysis that provides product costs. We like to focus first on determining total activity-cost pools and activity cost per driver unit. Then, an analysis similar to the one shown in Exhibit 12-8 can be used.Schedule a: Activity center cost poolsResources Supporting the Allocated Setup/Maintenance Activity Center Allocation Calculation Cost Assembly supervisors $90,000 × 2% $ 1,800 Assembly machines $247,000 × (400 ÷ 1,900) 52,000 Facilities management $95,000 × (400 ÷ 1,900) 20,000 Power $54,000 × (10 ÷ 90) 6,000Total assigned cost $79,800Cost per driver unit (setup) $79,800 ÷ 40 $ 1,995 Resources Supporting the Allocated Setup/Maintenance Activity Center Allocation Calculation Cost Assembly supervisors $90,000 × 98% $ 88,200 Assembly machines $247,000 × (1,500 ÷ 1,900) 195,000 Facilities management $95,000 × (1,500 ÷ 1,900) 75,000 Power $54,000 × (80 ÷ 90) 48,000Total assigned cost $406,200Cost per driver unit (machine hour) $406,200 ÷ 1,500 $ 270.80Copyright ©2011 Pearson Education 470Exhibit 12-42 Contribution to cover other value-chain costs by productStandardDeluxe Custom Cost per Driver unit Driver Driver Driver Activity/Resource (Schedule a) Units Cost Units Cost Units Cost Setup/Maintenance $1,995 20 $ 39,900 12 $ 23,940 8 $ 15,960 Assembly $270.80 1,000 270,800 400 108,320 100 27,080 Parts 1,003,800 115,080 15,980Direct labor 298,00072,000 68,000 Total $1,612,500$319,340 $127,020 Units 100,000 10,000 1,000 Cost per display $16.125 $31.934 $127.02Selling price 20.00050.000 250.00 Unit gross profit $ 3.875$18.066 $122.98 Total gross profit $387,500$180,660 $122,980The total contribution of these products is $387,500 + $180,660 + $122,980 = $691,140.12-43 (25-30 min.) See solution to problem 12-42.12-55 (100 – 200 min.)1. Exhibits 12-55A and 12-55B show the calculation of customer gross margin percentage and customer cost-to-serve percentage for the 4 customer types. Exhibit 12-55C shows a plot of customer gross margin percentage versus customer cost-to-serve percentage for the 4 customer types.2. Suggested strategies for profit improvement for the 4 customer types follow.•Customer type 1 - Mega stores. These stores have the lowest cost-to-serve.Profitability can be improved by focusing on a better product mix. A quarter ofthe sales (cases) to these stores are from bulk and singles products – both ofwhich have a negative gross margin. A shift in mix towards more regular andfragile product types would improve profitability.•Customer type 2 – Local small stores. These stores have a product mix that contains a substantial amount (32%) of the negative gross margin products. Thesame change in sales focus that applies to mega stores can be applied to localsmall stores.But unlike mega stores, small stores are very costly to serve. From Exhibit 12-55 B, the largest single cost to serve local small stores is truck deliveries. Theaverage number of cases per order (the same as per truck delivery) is 6,000,000 ÷ 80,000 = 75. Compare this to mega stores that average 7,680,000 ÷ 32,000 = 240 cases per order (delivery). This is a significant factor causing the high cost-to-serve.For example, suppose that the average order size could be increased from 75,000 to 150,000 cases. If the total annual cases sold is unchanged (6,000,000), a totalof 40 orders, a 50% reduction, would be made. An estimate of the cost savingsand the impact on the cost-to-serve percentage can be made as follows:Cost per Driver Unit Reduction in Driver Cost Savings(Exhibit 12-55B) Units of 50% (000) Truck delivery $167.55 34,000 $5,696.70 Order processing 27.49 40,000 1,099.60 Regular scheduling 5.83 36,000 209.88 Expedited scheduling 19.44 4,000 77.76 Total cost savings (000) $7,083.94 Cost savings as a percent of revenue 24.9%New cost-to-serve as a percent of revenue 60.1%In addition to the above savings, other activities would also be impacted by thereduction in orders such as customer service. So while the total impact ofCopyright ©2011 Pearson Education 472focusing on increasing order size can only be estimated, it is reasonable to expect dramatic cost savings from the current 85% of revenue.Other factors that should be investigated include the high level of corporatesupport and customer service.•Customer type 3 – Local large stores. Local large stores generate $68,400 ÷ $136,230 = 50% of DSI’s total revenue and with a net margin of 58% - 47% = 11%. The key to local large store profitability is sales of a large percentage (80%) of regular product. The cost-to-serve percentage is 47%. This could be reduced as for customer type 2 by increasing the order size from the current level of14,400,000 ÷ 120,000 = 120 cases per order. But a dramatic improvementshould not be expected. In general, local large stores are sustaining DSI’sbusiness and their loyalty should be cultivated.•Customer type 4 – Specialty stores. Specialty stores have a low gross margin of 22% coupled with a very large cost-to-serve percent of 106%! Although thesestores do not account for a significant portion of DSI’s revenue the companyshould rationalize their business. Several actions could be suggested. One is to charge a premium for all high-security products. The vast majority of theseproducts are sold to specialty stores with only marginal sales to mega and local small stores. Another action is to adopt a customer loyalty program based onvolume of sales. The list price of $7.25 per case would apply to customers with sales volumes less than a specified level. Most of DSI’s customers would qualify for discounts (similar to those currently existing) so prices would not besignificantly different. For specialty stores, prices would increase dramatically.This may result in losing specialty-store business so DSI needs to decide is this isa direction they wish to consider.Copyright ©2011 Pearson Education 473Exhibit 12-55A (Units and dollars are in thousands.)C u s t o m e r T y p eProductRegular Short Fragile Bulk HighSecurity Singles Total Gross Profit PercentageProduct mix percentage 60% 5% 5% 20% 5% 5% 100% Cases sold 4,608 384 384 1,536 384 3847,680Total Revenue$ 21,888 $ 1,824$ 1,824$7,296$ 1,824 $ 1,824 $36,480Gross Profit per Case $ 3.28 $ 1.58 $ 2.74 $(1.44)$ 0.54 $ (5.30)1Total Gross Profit$ 15,114 $ 607 $ 1,052 $(2,212)$ 207 $(2,035)$12,733 35%Product mix percentage 50% 5% 5% 30% 8% 2% 100% Cases sold3,000 300 300 1,800 480 120 6,000 Total Revenue @ 4.75/case $ 14,250 $ 1,425 $ 1,425 $ 8,550 $ 2,280 $ 570 $28,500 Gross Profit per Case $ 3.28 $ 1.58 $ 2.74 $ (1.44) $ 0.54 $ (5.30)2Total Gross Profit$ 9,840 $ 474 $ 822 $(2,592) $ 259 $ (636)$ 8,167 29%Product mix percentage 80% 0% 10% 10% 0% 0% 100%Cases sold 11,520 -1,4401,440--14,400Total Revenue @ 4.75/case $ 54,720 $ - $ 6,840 $ 6,840 $ - $ - $68,400Gross Profit per Case $ 3.28 $ 1.58 $ 2.74 $ (1.44) $ 0.54 $ (5.30)3Total Gross Profit$ 37,786 $ - $ 3,946 $(2,074) $ - $ - $39,658 58%Product mix percentage 10% 20% 0% 0% 70% 0% 100% Cases sold 60 120 - - 420-600Total Revenue @ 4.75/case $ 285 $ 570 $ - $ - $ 1,995 $ - $ 2,850 Gross Profit per Case $ 3.28 $ 1.58 $ 2.74 $ (1.44)$ 0.54 $ (5.30)4Total Gross Profit $ 197$ 190$ -$ -$ 227$ - $ 61322%Exhibit 12-55B (Units and dollars are in thousands.)ActivityO r d e r P r o c e s s i n gC u s t o m e r S e r v i c eO r d e r C h a n g e sC o r p o r a t e S u p p o r tR e g u l a r S c h e d u l i n gE x p e d i t e d S c h e d u l i n gS h i p p i n gT r u c k D e l i v e r yP a r c e l D e l i v e r y Cost DriverO r d e r sL a b o r H o u r sN u m b e r o f C h a n g e sL a b o r H o u r sO r d e r sO r d e r sP a l l e t sD e l i v e r i e sD e l i v e r i e sC u s t o m e r T y p eCost/DriverUnit $27.49 $43.34$32.63$51.66$5.83 $19.44 $6.60 $167.55 $23.89Total Driver Units3218.73.2 - 29 3 41625.6 1.6 Cost to Serve $879.68 $810.46$104.42-$169.07$58.32$2,745.6$4,289.28$38.22$9,095.05Revenue (See Exhibit 12-55A) $36,480.001 Cost-to-Serve Percentage24.9%Driver Units 80 100 8 20 72 8 640 68 8Cost to Serve $2,199.2 $4,334$261.04$1,033.2 $419.76$155.52$4,224$11,393.4$191.12$24,211.24Revenue (See Exhibit 12-55A) $28,500.02Cost-to-Serve Percentage85.0%Exhibit 12-55B (continued)ActivityO r d e r P r o c e s s i n gC u s t o m e r S e r v i c eO r d e r C h a n g e sC o r p o r a t e S u p p o r tR e g u l a r S c h e d u l i n gE x p e d i t e d S c h e d u l i n gS h i p p i n gT r u c k D e l i v e r y P a r c e l D e l i v e r y Cost DriverO r d e r sL a b o r H o u r sN u m b e r o f C h a n g e sL a b o r H o u r sO r d e r sO r d e r sP a l l e t sD e l i v e r i e sD e l i v e r i e sC u s t o m e r T y p eCost/DriverUnit $27.49 $43.34$32.63$51.66$5.83 $19.44 $6.60 $167.55 $23.89TotalDriver Units 120 70 2.4 80 108 12 840 90 6Cost to Serve$3,298.8 $3,033.8 $78.31$4,132.8 $629.64 $233.28 $5,544$15,079.5$143.34$32,173.47Revenue (See Exhibit 12-55A) $68,400.03 Cost-to-Serve Percentage47.0%Driver Units 12 30 1.2 0 10 2 60 4.8 2.4Cost to Serve $329.88$1,300.2 $39.16- $58.3 $38.88 $396 $804.24 $57.34$3,023.99Revenue (See Exhibit 12-55A) $2,850.004 Cost-to-Serve Percentage106.1%CUSTOMER PROFITABILITYCT3, 47%, 58%0%10%20%30%40%50%60%70%80%90%100%0%10%20%30%40%50%60%70%80%90%100%110%120%COST-TO-SERVE PERCENTAGEG R O S S P R O F I T P E R C E N T A G EExhibit 12-55CCopyright ©2011 Pearson Education 478。