Is What You See, What You Get? Geospatial
Visualizations Address Scale and Usability
AashishChaudhary and Jeff Baumes
Unlimited geospatial information now is at everyone’s fingertips with the proliferation of GPS-embedded mobile devices and large online geospatial databases. To fully understand these data and make wise decisions, more people are turning to informatics and geospatial visualization, which are used to solve many real-world problems.
To effec tively gather information from data, it’s critical to address scalability and intuitive user interactions and visualizations. New geospatial analysis and visualization techniques are being used in fields such as video analysis for national defense, urban planning and hydrology.
Why Having Data Isn’t Good Enough Anymore
People are realizing that data are only useful if they can find the relevant pieces of data to make better decisions. This has broad applicability, from finding a movie to watch to elected officials deciding how much funding to allocate for an aging bridge. Information can easily be obtained, but how can it be sorted, organized, made sense of and acted on? The field of informatics solves this challenge by taking large amounts of data and processing them into meaningful, truthful insights.
In informatics, two main challenges arise when computers try to condense information down to meaningful concepts: disorganization and size. Some information is available in neat, organized tables, ready for users to pull out the needed pieces, but most is scattered across and hidden in news articles, blog posts and poorly organized lists.
Researchers are feverishly working on new ways to retrieve key ideas and facts from these types of messy data sources. For example, services such as Google News use computers that constantly "read" news articles and posts worldwide, and then automatically rank them by popularity, group them by topic, or organize them based on what the computer thinks is important to viewers. Researchers at places such as the University of California, Irvine, and Sandia National Laboratories are investigating the next approaches to sort through large amounts of documents using powerful supercomputers.
The other obstacle is the sheer vo lume of data. It’s difficult to use informatics techniques that only work on data of limited size. Facebook, Google and Twitter have data centers that constantly process huge quantities of information to deliver timely and relevant information and advertisements to each person currently logged on..
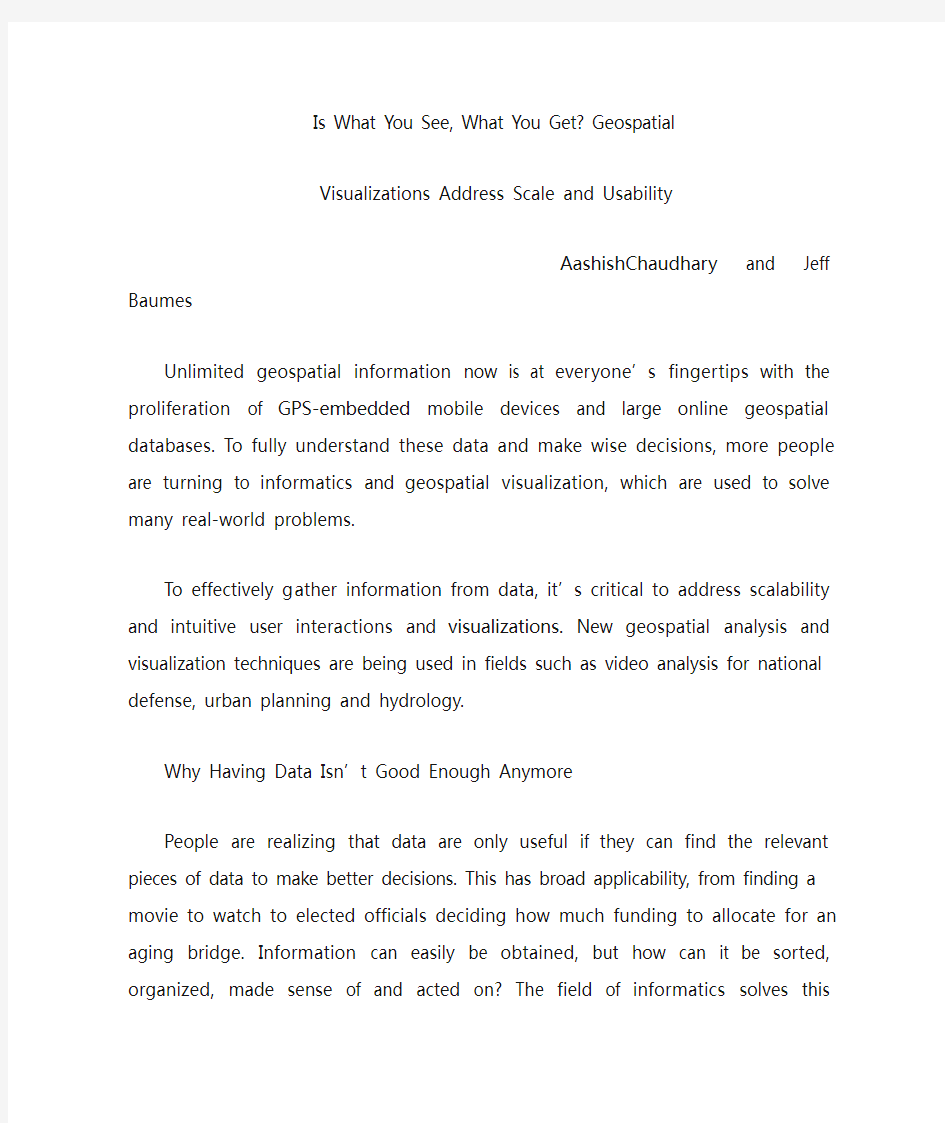
Figure 1. A collection of videos are displayed without overlap (top). The outline color represents how close each video matches a query. An alternate view (bottom) places the
videos on top of each other in a stack, showing only the strongest match result.
Informatics is a key tool, but it’s not enough to simply find these insights that explain the data. Geospatial visualization bridges the gap from computer number-crunching to human understanding. If informatics is compared to finding the paths in a forest, visualization is like creating a visual map of those paths so a person can navigate through the forest with ease.
Most people today are familiar with basic geospatial visualizations such as weather maps and Web sites for driving directions. The news media are starting to test more-complex geospatial visualizations such as online interactive maps to help navigate politicians’ stances on issues, exit polls and precinct reports during election times. People are just beginning to see the impact that well-designed geospatial visualizations have on their understanding of the world..
Geospatial Visualization in the Real World
People have been looking at data for decades, but the relevant information that accompanies the data has changed in recent years. In late 1999, Esri released a new software suite, ArcGIS, that could use data from various sources. ArcGIS provides an easy-to-use interface for visualizing 2-D and 3-D data in a geospatial context. In 2005, Google Earth launched and made geospatial visualization available to the general public.
Geospatial visualization is becoming more significant and will continue to grow as it allows people to look at the totality of the data, not just one aspect. This enables better understanding and comprehension, because it puts the data in context with their surroundings. The following three cases demonstrate geospatial visualization use in real-world scenarios:
1. Urban Planning
Planners use geomodeling and geovisualization tools to explore possible scenarios and communicate their design decisions to team members or the general public. For example, urban planners may look at the presence of underground water and the terrain’s surrounding topology before deciding to build a new suburb. This is relevant for areas around Phoenix, for example, where underground water presence and proximity to a knoll or hill can determine the suitability of a location for construction.
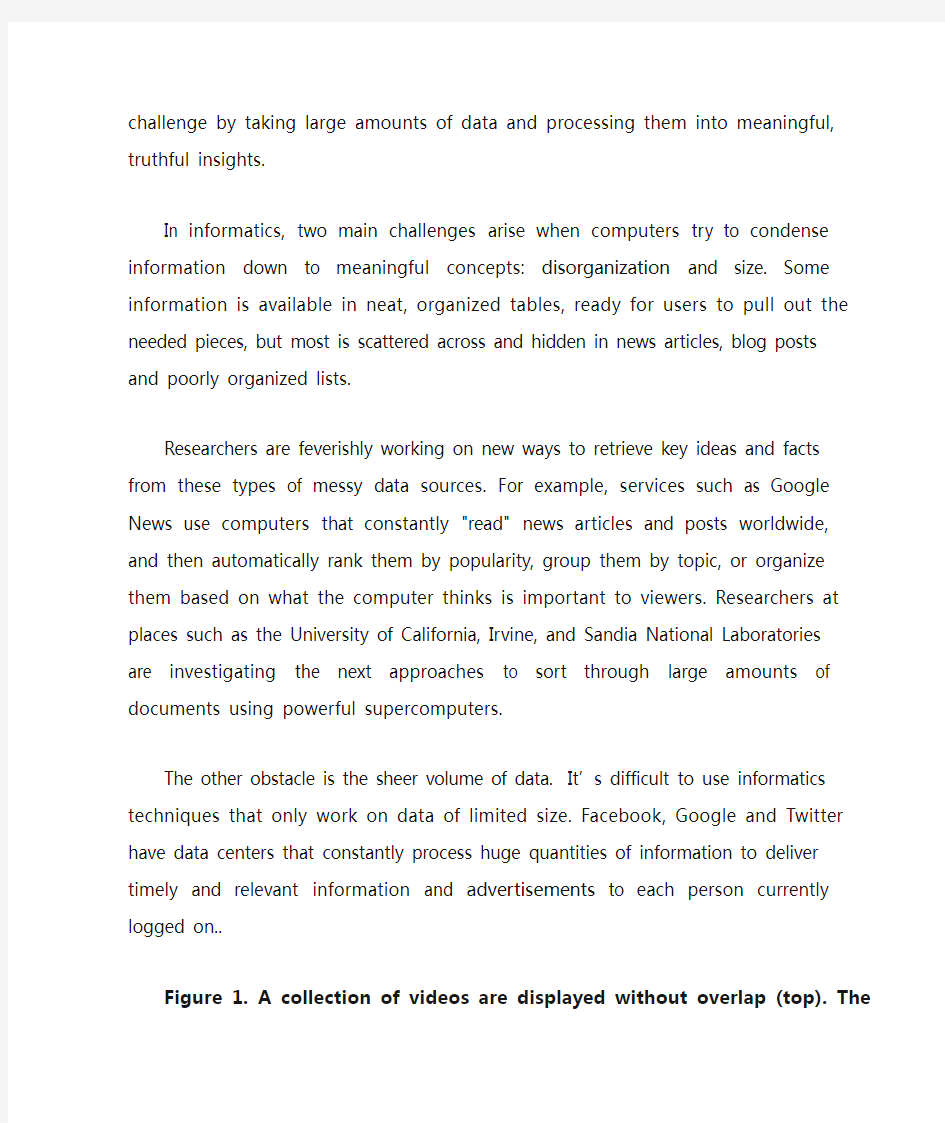
Figure 2. Videos from the same location are partially visible, resembling a stack of cards. Each video is outlined by the color representing the degree to which it matches the query.
Looking at a 3-D model of a house with its surroundings gives a completely different perspective than just looking at the model of a house by itself. This also can help provide clear solutions to problems, such as changing the elevation of a building’s base to make it stand better.
Urban planning is one of the emerging applications of computer-generated simulation. Cities’ rapid growth places a strain on natural resources that sustain growth. Water management, in particular, becomes a critical issue.
The East Valley Water Forum is a regional cooperative of water providers east of Phoenix, and it’s designing a water-management plan for the next 100 years. Water resources in this region come from the Colorado River, the Salt River Project, groundwater, and other local and regional water resources. These resources are affected directly and indirectly by local and global factors such as population, weather, topography, etc.
To best understand the relationship among water resources and various factors, the Arizona Department of Water Resources analyzes hydrologic data in the region using U.S. Geological Survey MODFLOW software, which simulates the status of underground water resources in the region. For better decision making and effective water management, a comprehensive scientific understanding of the inputs, outputs and uncertainties is needed. These uncertainties include local factors such as drought and urban growth.
Looking at numbers or 2-D graphs to understand the complex relationship between input, output and other factors is insufficient in most cases. Integrating geospatial visualizations with MODFLOW simulations, for example, creates visuals that accurately represent the model inputs and outputs in ways that haven’t been previously presented.
For such visualizations, two water surfaces are positioned side-by-side—coming from two different simulations—with contour lines drawn on top. In this early prototype, a simple solution—providing a geospatial plane that can be moved vertically—brings the dataset into a geospatial context. This plane includes a multi-resolution map with transparency. Because these water layers are drawn in geospatial coordinates, it matches exactly with the geospatial plane. This enables researchers to quickly see the water supplies of various locations.
2. Image and Video Analysis
Defense Advanced Research Projects Agency launched a program, Video and Image Retrieval nd Analysis Tool (VIRAT), for understanding large video collections. The project’s core requirement is to add video-analysis capabilities that perform the following:
? Filter and prioritize massive amounts of archived and strea ming video based on events.
? Present high-value intelligence content clearly and intuitively to video analysts.
? Reduce analyst workload while increasing quality and accuracy of intelligence yield.
Visualization is an integral component of the VIRAT system, which uses geospatial metadata and video descriptors to display results retrieved from a database.
Analysts may want to look at retrieval result sets from a specific location or during a specific time range. The results are short clips containing the object of interest and its recent trajectory. By embedding these results in a larger spatiotemporal context, analysts can determine whether a retrieved result is important.
3. Scientific Visualization
U.S. Army Corps of Engineers’ research organ ization, the Engineer Research and Development Center, is working to extend the functionality of the Computational Model Builder (CMB) environment in the area of simulation models for coastal systems, with an emphasis on the Chesapeake and Delaware bays.
The CMB environment consists of a suite of applications that provide the capabilities necessary to define a model (consisting of geometry and attribute information) that’s suitable for hydrological simulation. Their simulations are used to determine the impact that environmental conditions, such as human activities, have on bodies of water.
Figure 3. Google Earth was used to display Chesapeake Bay’s relative salt (top) and oxygen (bottom) content (higher concentrations in red).
One goal is to visualize simulation data post-processed by CMB tools. Spatiotemporal information, for example, is included in oxygen content and salinity data. Drawing data in geospatial context lets users or analysts see which locations are near certain features, giving the data orientation and scale that can easily be understood. Figure 3 shows the oxygen and salt content of Chesapeake Bay, where red shows higher concentrations and blue shows lower concentrations.
Moving Forward
Visualizations that can be understood at all levels will be key in politics, economics, national security, urban planning and countless other fields. As information becomes increasingly complex, it will be harder for computers to extract and display those insights in ways people can understand.
More research must be done in new geospatial analysis and visualization capabilities before we drown in our own data. And it’s even more important to educate people in how to use and interpret the wealth of analysis tools already available, extending beyond the basic road map.
High schools, colleges and the media should push the envelope with new types of visuals and animations that show data in richer ways. The price of explaining these new views will be repaid when audiences gain deeper insights into the real issues otherwise hidden by simple summaries. Progress isn’t limited by the volume of available information, but by the ability to consume it.
翻译:
你所看到的,你得到了什么?地理空间可视化的
处理规模和可用性
作者:AashishChaudhary和包密斯·杰夫
无限的空间信息现在就在每个人的指尖,其与扩散的嵌入式GPS移动设备和大型网上地理空间数据库。充分了解这些数据和作出明智的决定,更多的人正在转向信息和空间可视化,这可以用来解决许多实际的问题。
有效地收集信息的数据,这是至关重要的解决可扩展性和直观的用户交互与可视化。新的地理空间分析和可视化技术被用于视频分析等领域的国防,城市规划和水文学。
为什么有数据质量不够理想?
人们认识到,数据是唯一有用的,如果他们可以找到相关的数据块作出更好的决定。这一具有广泛的适用性,从电影看当选官员决定多少资金分配的老化的桥。信息可以很容易得到,但它如何分类,组织,意识和行动?信息学领域的解决这一挑战,以大量数据和加工成有意义的,真实的见解。
在信息论中,主要的挑战时产生尝试压缩信息到有意义的概念:混乱和大小。有些信息可整齐,组织表,准备用户拉出所需,但大部分是分散在隐藏在新闻文章,博客文章和缺乏组织的名单。
研究人员正在狂热地工作的新途径检索的关键思想和事实从这些类型的散乱数据来源。例如,谷歌新闻等服务使用电脑,不断地“读”的新闻文章和帖子,然后自动排序的普及,组织他们的话题,或组织他们的基础上计算机所认为重要的是观众。研究人员等场所的加利福尼亚大学,尔湾,和桑迪亚国家实验室正在调查方法整理大量文献利用强大的超级计算机。
另一个障碍是庞大的数据。很难使用信息技术,只能在有限大小的数据。脸谱网和推特,谷歌数据中心,不断地处理大量的信息提供及时和相关的信息和广告的每个人目前登录。
推测1:一个视频显示不重叠(顶部)。轮廓颜色代表如何关闭每个视频匹配查询。不同的观点(底部)地方的视频在彼此顶部堆栈中,只显示最强的比赛结果。
信息是一个关键的工具,但这不足以发现这些见解,解释数据。地理空间可视化的差距桥梁从计算机处理人类理解。如果信息是比较,寻找路径在森林,可视化是想创造一个视觉地图的路径,这样一个人可以轻松浏览森林。
今天大多数人都熟悉基本的地理空间可视化等天气图和网站的驾车路线。新闻媒体开始测试复杂的地理空间可视化等在线交互式地图浏览帮助政治家的立场问题,民意测验和分局报告在选举的时候。人们刚刚开始看到的影响,设计良好的地理空间可视化对他们的理解的世界。
现实世界中的地理空间可视化:
人们一直在寻找资料,几十年来,但相关的信息,伴随数据已经改变,近年来。1999年底,公司发布了一个新的软件套件,地理信息系统,可以使用的数据从各种来源。中提供了一个易于使用的界面,可视化的二维和三维数据在一个地理背景。2005,谷歌地球发射和空间可视化提供给广大公众。
地理空间可视化是变得越来越重要,将继续增长,因为它允许人们看总体数据,而不只是一个方面。这使更好地了解和理解,因为它把数据背景与环境。以下三起案件表明地理空间可视化使用在现实世界的情景:
1、城市规划
利用规划地理模型和可视化工具探索可能的情景和沟通的设计决策团队成员或一般公众。例如,城市规划者可以看存在地下水和地形的周边拓扑才决定建立一个新的郊区。这是有关地区的凤凰,例如,当地下存在水和接近小丘或可确定适宜的位置建设。
推测2:视频从同一地点有部分可见,类似一个堆叠卡。每个视频是概述的颜色代表的程度,它匹配查询。
寻找一个三维房屋模型及其周围提供了完全不同的角度比只看房屋模型本身。这也可以帮助提供明确的解决问题的方法,如改变海拔建筑基地,让它更好。
城市规划是一种新兴的计算机仿真应用。城市的快速增长的地方压力自然资源持续增长。水的管理,特别是,成为一个关键问题。
东谷论坛是一个区域合作水商东凤凰,这是设计一个水管理计划在未来100年。该地区水资源来自科罗多河,盐河工程,地下水,和其他地方和区域水资源。这些资源的直接影响和间接的地方和全球因素如人口,气候,地形,等。
为了更好地理解之间的关系,水资源和各种因素,亚利桑那州水资源部分析水文数据的地区使用美国地质调查软件,模拟地下水资源现状的地区。为更好的决策和有效的水管理,全面科学认识的输入,输出和不确定性是必要的。这些不确定性包括当地的因素,如干旱和城市增长。
看数字或二维图形理解之间的复杂关系的输入,输出和其他因素是不够的在大多数情况下。整合地理空间可视化与数值模拟,例如,产生的视觉效果,准确地代表了模型输入和输出的方式,以前未曾提出。
这种可视化,双水表面定位面到面从不同模拟轮廓线在上面。在这个早期的原型,一个简单的问题论证地理空间平面可移动垂直交互集为地理背景。这架飞机包括一个多分辨率地图与透明度。因为这些水层绘制在地理坐标,它完全匹配的空间平面。这使研究人员能够迅速看到水供应各种地点。
2、图像和视频分析
国防高级研究项目局启动了一个项目,图像和视频检索和分析工具(病毒),了解大型视频收藏。该项目的核心要求是添加视频分析能力,执行以下:
·过滤和优先考虑大量存档和视频流的基础上的事件。
·目前的高价值的情报内容清楚、直观的视频分析。
·减少工作量的同时,提高分析质量和准确情报产量。
可视化是一个不可分割的组成部分的病毒系统,它使用地理空间元数据描述和视频显示结果从数据库中检索。
分析师可能想看看检索结果集从一个特定的位置或在一个特定的时间范围。结果是短片段包含对象的利益和其最近的轨迹。通过嵌入这些成果在更大的时空背景,分析师可以决定是否检索结果是重要的。
3、科学可视化
美国陆军工程兵团的研究机构,研究开发中心的工程师,正在扩展功能的计算模型生成器(中巴)环境领域的仿真模型对沿海生态系统,重点是乞沙比克和特拉华海湾。
中巴环境包括了一套应用程序提供必要的能力来定义一个模型(包括几何和属性信息),适用于水文模拟。他们的模拟是用来确定的影响,环境条件,诸如人类活动,对水机构。
推测3:谷歌地球是用来显示乞沙比克湾的相对盐份(顶部)和氧份(底部)的内容(高浓度的红色区域)。
一个目标是可视化仿真数据后处理,由招商银行工具。时空信息,例如,包括氧含量和盐度资料。绘图数据在地理背景让用户或分析家认为该地点是附近的某些特点,给数据的方向和规模,可以很容易地理解。图3显示了氧和盐含量的切萨皮克湾,那里的红色显示高浓度和低浓度的蓝色显示。
展望未来:
可视化,可以理解在各级将是关键的政治,经济,国家安全,城市规划和无数的其他领域。随着信息变得越来越复杂,这将是困难的计算机提取和显示这些见解的方式可以理解。
更多的研究,必须在新的地理空间分析和可视化能力之前我们淹没在我们自己的数据。和它更重要的是教育人们如何使用和解释的丰富的分析工具已经提供,超出基本路线图。
高中,大学和媒体应该把信封新类型的视觉效果和动画显示数据丰富的方式。价格解释这些新的意见将偿还的时候,观众深入了解真正的问题,否则隐藏的简单总结。进步不是有限数量的现有资料,但它的消费能力。
Chapter 1 Passage 1 Human Body In this passage you will learn: 1. Classification of organ systems 2. Structure and function of each organ system 3. Associated medical terms To understand the human body it is necessary to understand how its parts are put together and how they function. The study of the body's structure is called anatomy; the study of the body's function is known as physiology. Other studies of human body include biology, cytology, embryology, histology, endocrinology, hematology, immunology, psychology etc. 了解人体各部分的组成及其功能,对于认识人体是必需的。研究人体结构的科学叫解剖学;研究人体功能的科学叫生理学。其他研究人体的科学包括生物学、细胞学、胚胎学、组织学、内分泌学、血液学、遗传学、免疫学、心理学等等。 Anatomists find it useful to divide the human body into ten systems, that is, the skeletal system, the muscular system, the circulatory system, the respiratory system, the digestive system, the urinary system, the endocrine system, the nervous system, the reproductive system and the skin. The principal parts of each of these systems are described in this article. 解剖学家发现把整个人体分成骨骼、肌肉、循环、呼吸、消化、泌尿、内分泌、神经、生殖系统以及感觉器官的做法是很有帮助的。本文描绘并阐述了各系统的主要部分。 The skeletal system is made of bones, joints between bones, and cartilage. Its function is to provide support and protection for the soft tissues and the organs of the body and to provide points of attachment for the muscles that move the body. There are 206 bones in the human skeleton. They have various shapes - long, short, cube - shaped, flat, and irregular. Many of the long bones have an interior space that is filled with bone marrow, where blood cells are made. 骨骼系统由骨、关节以及软骨组成。它对软组织及人体器官起到支持和保护作用,并牵动骨胳肌,引起各种运动。人体有206根骨头。骨形态不一,有长的、短、立方的、扁的及不规则的。许多长骨里有一个内层间隙,里面充填着骨髓,这即是血细胞的制造场所。 A joint is where bones are joined together. The connection can be so close that no movement is possible, as is the case in the skull. Other kinds of joints permit movement: either back and forth in one plane - as with the hinge joint of the elbow - or movement around a single axis - as with the pivot joint that permits the head to rotate. A wide range of movement is possible when the ball - shaped end of one bone fits into a socket at the end of another bone, as they do in the shoulder and hip joints. 关节把骨与骨连接起来。颅骨不能运动,是由于骨与骨之间的连接太紧密。但其它的关节可允许活动,如一个平面上的前后屈伸运动,如肘关节;或是绕轴心旋转运动,如枢轴点允许头部转动。如果一根骨的球形末端插入另一根骨的臼槽里,大辐度的运动(如肩关节、髋关节)即成为可能。 Cartilage is a more flexible material than bone. It serves as a protective, cushioning layer where bones come together. It also connects the ribs to the breastbone and provides a structural base for the nose and the external ear. An infant's skeleton is made of cartilage that is gradually replaced by bone as the infant grows into an adult. 软骨是一种比一般骨更具韧性的物质。它是骨连结的保护、缓冲层。它把肋骨与胸骨连结起来,也是鼻腔与内耳的结构基础。一个婴儿的骨骼就是由软骨组成,然后不断生长、
Historical Development of Matertials and Technology The common engineering materials include metals, cementing materials, concrete building stones, clay products, insulating materials, timber. Some of them are described here from the stand-point of occurrence, manufacture, properties, methods of testing, and use. The development of materials with improved properties is a vital phase of engineering. Progress in engineering construction has been dependent on the availability of materials of suitable physical properties in large quantities; for example, the development of the modern automobile was critically dependent on availability of high quality alloy steels, and the all-metal airplane was made possible by the development of light weight high-strength alloys. ◆Phase: 相;阶段。 ◆a distinct period or stage in a process of change or forming part of something's development Example: phase two of the development is in progress. ◆第二阶段开发正在进行中。 ◆Vital: 必要的,必不可少的。 ◆it is vital that the system is regularly maintained.这个系统有必要 经常维修。
Lesson 1 力学的基本概念 1、词汇: statics [st?tiks] 静力学;dynamics动力学;constraint约束;magnetic [m?ɡ'netik]有磁性的;external [eks't?:nl] 外面的, 外部的;meshing啮合;follower从动件;magnitude ['m?ɡnitju:d] 大小;intensity强度,应力;non-coincident [k?u'insid?nt]不重合;parallel ['p?r?lel]平行;intuitive 直观的;substance物质;proportional [pr?'p?:??n?l]比例的;resist抵抗,对抗;celestial [si'lestj?l]天空的;product乘积;particle质点;elastic [i'l?stik]弹性;deformed变形的;strain拉力;uniform全都相同的;velocity[vi'l?siti]速度;scalar['skeil?]标量;vector['vekt?]矢量;displacement代替;momentum [m?u'ment?m]动量; 2、词组 make up of由……组成;if not要不,不然;even through即使,纵然; Lesson 2 力和力的作用效果 1、词汇: machine 机器;mechanism机构;movable活动的;given 规定的,给定的,已知的;perform执行;application 施用;produce引起,导致;stress压力;applied施加的;individual单独的;muscular ['m?skjul?]]力臂;gravity[ɡr?vti]重力;stretch伸展,拉紧,延伸;tensile[tensail]拉力;tension张力,拉力;squeeze挤;compressive 有压力的,压缩的;torsional扭转的;torque转矩;twist扭,转动;molecule [m likju:l]分子的;slide滑动; 滑行;slip滑,溜;one another 互相;shear剪切;independently独立地,自立地;beam梁;compress压;revolve (使)旋转;exert [iɡ'z?:t]用力,尽力,运用,发挥,施加;principle原则, 原理,准则,规范;spin使…旋转;screw螺丝钉;thread螺纹; 2、词组 a number of 许多;deal with 涉及,处理;result from由什么引起;prevent from阻止,防止;tends to 朝某个方向;in combination结合;fly apart飞散; 3、译文: 任何机器或机构的研究表明每一种机构都是由许多可动的零件组成。这些零件从规定的运动转变到期望的运动。另一方面,这些机器完成工作。当由施力引起的运动时,机器就开始工作了。所以,力和机器的研究涉及在一个物体上的力和力的作用效果。 力是推力或者拉力。力的作用效果要么是改变物体的形状或者运动,要么阻止其他的力发生改变。每一种
外文翻译 英文原文 Belt Conveying Systems Development of driving system Among the methods of material conveying employed,belt conveyors play a very important part in the reliable carrying of material over long distances at competitive cost.Conveyor systems have become larger and more complex and drive systems have also been going through a process of evolution and will continue to do so.Nowadays,bigger belts require more power and have brought the need for larger individual drives as well as multiple drives such as 3 drives of 750 kW for one belt(this is the case for the conveyor drives in Chengzhuang Mine).The ability to control drive acceleration torque is critical to belt conveyors’performance.An efficient drive system should be able to provide smooth,soft starts while maintaining belt tensions within the specified safe limits.For load sharing on multiple drives.torque and speed control are also important considerations in the drive system’s design. Due to the advances in conveyor drive control technology,at present many more reliable.Cost-effective and performance-driven conveyor drive systems covering a wide range of power are available for customers’ choices[1]. 1 Analysis on conveyor drive technologies 1.1 Direct drives Full-voltage starters.With a full-voltage starter design,the conveyor head shaft is direct-coupled to the motor through the gear drive.Direct full-voltage starters are adequate for relatively low-power, simple-profile conveyors.With direct fu11-voltage starters.no control is provided for various conveyor loads and.depending on the ratio between fu11-and no-1oad power requirements,empty starting times can be three or four times faster than full load.The maintenance-free starting system is simple,low-cost and very reliable.However, they cannot control starting torque and maximum stall torque;therefore.they are
第二部分 控制理论 第1章 1.1控制系统的引入 人类控制自然力量的设计促进人类历史的发展,我们已经广泛的能利用这种量进行在人类本身力量之外的物理进程?在充满活力的20世纪中,控制系统工程的发展已经使得很多梦想成为了现实?控制系统工程队我们取得的成就贡献巨大?回首过去,控制系统工程主要的贡献在机器人,航天驾驶系统包括成功的实现航天器的软着陆,航空飞机自动驾驶与自动控制,船舶与潜水艇控制系统,水翼船?气垫船?高速铁路自动控制系统,现代铁路控制系统? 以上这些类型的控制控制系统和日常生活联系紧密,控制系统是一系列相关的原件在系统运行的基础上相互关联的构成的,此外控制系统存在无人状态下的运行,如飞机自控驾驶,汽车的巡航控制系统?对于控制系统,特别是工业控制系统,我们通常面对的是一系列的器件,自动控制是一个复合型的学科?控制工程师的工作需要具有力学,电子学,机械电子,流体力学,结构学,无料的各方面的知识?计算机在控制策略的执行中具有广泛的应用,并且控制工程的需求带动了信息技术的与软件工程的发展? 通常控制系统的范畴包括开环控制系统与闭环控制系统,两种系统的区别在于是否在系统中加入了闭环反馈装置? 开环控制系统 开环控制系统控制硬件形式很简单,图2.1描述了一个单容液位控制系统, 图2.1单容液位控制系统 我们的控制目标是保持容器的液位h 在水流出流量V 1变化的情况下保持在一定 可接受的范围内,可以通过调节入口流量V 2实现?这个系统不是精确的系统,本系 统无法精确地检测输出流量V 2,输入流量V 1以及容器液位高度?图2.2描述了这 个系统存在的输入(期望的液位)与输出(实际液位)之间的简单关系, 图2.2液位控制系统框图 这种信号流之间的物理关系的描述称为框图?箭头用来描述输入进入系统,以及
United 1 材料科学与工程 材料在我们的文化中比我们认识到的还要根深蒂固。如交通、房子、衣物,通讯、娱乐和食物的生产,实际上,我们日常生活中的每一部分都或多或少地受到材料的影响。历史上社会的发展、先进与那些能满足社会需要的材料的生产及操作能力密切相关。实际上,早期的文明就以材料的发展程度来命名,如石器时代,铜器时代。早期人们能得到的只有一些很有限的天然材料,如石头、木材、粘土等。渐渐地,他们通过技术来生产优于自然材料的新材料,这些新材料包括陶器和金属。进一步地,人们发现材料的性质可以通过加热或加入其他物质来改变。在这点上,材料的应用完全是一个选择的过程。也就是说,在一系列非常有限的材料中,根据材料的优点选择一种最适合某种应用的材料。直到最近,科学家才终于了解材料的结构要素与其特性之间的关系。这个大约是过去的 60 年中获得的认识使得材料的性质研究成为时髦。因此,成千上万的材料通过其特殊的性质得以发展来满足我们现代及复杂的社会需要。很多使我们生活舒适的技术的发展与适宜材料的获得密切相关。一种材料的先进程度通常是一种技术进步的先兆。比如,没有便宜的钢制品或其他替代品就没有汽车。在现代,复杂的电子器件取决于所谓的半导体零件. 材料科学与工程有时把材料科学与工程细分成材料科学和材料工程学科是有用的。严格地说,材料科学涉及材料到研究材料的结构和性质的关系。相反,材料工程是根据材料的结构和性质的关系来设计或操纵材料的结构以求制造出一系列可预定的性质。从功能方面来说,材料科学家的作用是发展或合成新的材料,而材料工程师是利用已有的材料创造新的产品或体系,和/或发展材料加工新技术。多数材料专业的本科毕业生被同时训练成材料科学家和材料工程师。“structure”一词是个模糊的术语值得解释。简单地说,材料的结构通常与其内在成分的排列有关。原子内的结构包括介于单个原子间的电子和原子核的相互作用。在原子水平上,结构包括原子或分子与其他相关的原子或分子的组织。在更大的结构领域上,其包括大的原子团,这些原子团通常聚集在一起,称为“微观”结构,意思是可以使用某种显微镜直接观察得到的结构。最后,结构单元可以通过肉眼看到的称为宏观结构。 “Property”一词的概念值得详细阐述。在使用中,所有材料对外部的刺激都表现出某种反应。比如,材料受到力作用会引起形变,或者抛光金属表面会反射光。材料的特征取决于其对外部刺激的反应程度。通常,材料的性质与其形状及大小无关。实际上,所有固体材料的重要性质可以概括分为六类:机械、电学、热学、磁学、光学和腐蚀性。对于每一种性质,其都有一种对特定刺激引起反应的能 力。如机械性能与施加压力引起的形变有关,包括弹性和强度。对于电性能,如电导性和介电系数,特定的刺激物是电场。固体的热学行为则可用热容和热导率来表示。磁学性质
2、应力和应变 在任何工程结构中独立的部件或构件将承受来自于部件的使用状况或工作的外部环境的外力作用。如果组件就处于平衡状态,由此而来的各种外力将会为零,但尽管如此,它们共同作用部件的载荷易于使部件变形同时在材料里面产生相应的内力。 有很多不同负载可以应用于构件的方式。负荷根据相应时间的不同可分为: (a)静态负荷是一种在相对较短的时间内逐步达到平衡的应用载荷。 (b)持续负载是一种在很长一段时间为一个常数的载荷, 例如结构的重量。这种类型的载荷以相同的方式作为一个静态负荷; 然而,对一些材料与温度和压力的条件下,短时间的载荷和长时间的载荷抵抗失效的能力可能是不同的。 (c)冲击载荷是一种快速载荷(一种能量载荷)。振动通常导致一个冲击载荷, 一般平衡是不能建立的直到通过自然的阻尼力的作用使振动停止的时候。 (d)重复载荷是一种被应用和去除千万次的载荷。 (e)疲劳载荷或交变载荷是一种大小和设计随时间不断变化的载荷。 上面已经提到,作用于物体的外力与在材料里面产生的相应内力平衡。因此,如果一个杆受到一个均匀的拉伸和压缩,也就是说, 一个力,均匀分布于一截面,那么产生的内力也均匀分布并且可以说杆是受到一个均匀的正常应力,应力被定义为 应力==负载 P /压力 A, 因此根据载荷的性质应力是可以压缩或拉伸的,并被度量为牛顿每平方米或它的倍数。 如果一个杆受到轴向载荷,即是应力,那么杆的长度会改变。如果杆的初始长度L和改变量△L已知,产生的应力定义如下: 应力==改变长△L /初始长 L 因此应力是一个测量材料变形和无量纲的物理量 ,即它没有单位;它只是两个相同单位的物理量的比值。 一般来说,在实践中,在荷载作用下材料的延伸是非常小的, 测量的应力以*10-6的形式是方便的, 即微应变, 使用的符号也相应成为ue。 从某种意义上说,拉伸应力与应变被认为是正的。压缩应力与应变被认为是负的。因此负应力使长度减小。 当负载移除时,如果材料回复到初始的,无负载时的尺寸时,我们就说它是具有弹性的。一特定形式的适用于大范围的工程材料至少工程材料受载荷的大部分的弹性, 产生正比于负载的变形。由于载荷正比于载荷所产生的压力并且变形正比于应变, 这也说明,当材料是弹性的时候, 应力与应变成正比。因此胡克定律陈述, 应力正比于应变。 这定律服从于大部分铁合金在特定的范围内, 甚至以其合理的准确性可以假定适用于其他工程材料比如混凝土,木材,非铁合金。 当一个材料是弹性的时候,当载荷消除之后,任何负载所产生的变形可以完全恢复,没有永久的变形。
Lathes Lathes are machine tools designed primarily to do turning, facing and boring, Very little turning is done on other types of machine tools, and none can do it with equal facility. Because lathes also can do drilling and reaming, their versatility permits several operations to be done with a single setup of the work piece. Consequently, more lathes of various types are used in manufacturing than any other machine tool. The essential components of a lathe are the bed, headstock assembly, tailstock assembly, and the leads crew and feed rod. The bed is the backbone of a lathe. It usually is made of well normalized or aged gray or nodular cast iron and provides s heavy, rigid frame on which all the other basic components are mounted. Two sets of parallel, longitudinal ways, inner and outer, are contained on the bed, usually on the upper side. Some makers use an inverted V-shape for all four ways, whereas others utilize one inverted V and one flat way in one or both sets, They are precision-machined to assure accuracy of alignment. On most modern lathes the way are surface-hardened to resist wear and abrasion, but precaution should be taken in operating a lathe to assure that the ways are not damaged. Any inaccuracy in them usually means that the accuracy of the entire lathe is destroyed. The headstock is mounted in a foxed position on the inner ways, usually at the left end of the bed. It provides a powered means of rotating the word at various speeds . Essentially, it consists of a hollow spindle, mounted in accurate bearings, and a set of transmission gears-similar to a truck transmission—through which the spindle can be rotated at a number of speeds. Most lathes provide from 8 to 18 speeds, usually in a geometric ratio, and on modern lathes all the speeds can be obtained merely by moving from two to four levers. An increasing trend is to provide a continuously variable speed range through electrical or mechanical drives. Because the accuracy of a lathe is greatly dependent on the spindle, it is of heavy construction and mounted in heavy bearings, usually preloaded tapered roller or ball types. The spindle has a hole extending through its length, through which long bar stock can be fed. The size of maximum size of bar stock that can be machined when the material must be fed through spindle. The tailsticd assembly consists, essentially, of three parts. A lower casting fits on the inner ways of the bed and can slide longitudinally thereon, with a means for clamping the entire assembly in any desired location, An upper casting fits on the lower one and can be moved transversely upon it, on some type of keyed ways, to permit aligning the assembly is the tailstock quill. This is a hollow steel cylinder, usually about 51 to 76mm(2to 3 inches) in diameter, that can be moved several inches longitudinally in and out of the upper casting by means of a hand wheel and screw. The size of a lathe is designated by two dimensions. The first is known as the swing. This is the maximum diameter of work that can be rotated on a lathe. It is approximately twice the distance between the line connecting the lathe centers and the nearest point on the ways, The second size dimension is the maximum distance between centers. The swing thus indicates the maximum work piece diameter that can be turned in the lathe, while the distance between centers indicates the maximum length of work piece that can be mounted between centers. Engine lathes are the type most frequently used in manufacturing. They are heavy-duty machine tools with all the components described previously and have power drive for all tool movements except on the compound rest. They commonly range in size from 305 to 610 mm(12 to 24 inches)swing and from 610 to 1219 mm(24 to 48 inches) center distances, but swings up to 1270 mm(50 inches) and center distances up
Table of Contents Uuit 1 What is Geomatics? (什么是测绘学) (2) Unit 2 Geodetic Surveying and Plane Surveying(大地测量与平面测量) (6) Unit 3 Distance Measurement(距离测量) (10) Unit 4 Angle and Direction Measurement(角度和方向测量) (14) Unit 5 Traversing (导线测量) (17) Unit 6 Methods of Elevation Determination(高程测量方法) (21) Unit 7 Robotic Total Station (智能型全站仪) (25) Unit 8 Errors in Measurement(测量工作中的误差) (29) Unit 9 Basic Statistical Analysis of Random Errors (32) Unit 10 Accuracy and Precision (准确度和精度) (35) Unit 11 Least-Squares Adjustment (38) Unit 12 Geodesy Concepts (40) Unit 13 Geoid and Reference Ellipsoid (42) Unit 14 Datums, Coordinates and Conversions (44) Unit 15 Map Projection (46) Unit 16 Gravity Measurment (48) Unit 17 Optimal Design of Geomatics Network (50) Unit 18 Construction Layout (施工放样) (53) Unit 19 Deformation Monitoring of Engineering Struvture (56) Unit 20 Understan ding the GPS(认识GPS) (59) Uuit 21 Understanding the GPS (II) 认识GPS(II) (62) Unit 22 Competition in Space Orbit(太空轨道上的竞争) (64) Unit 23 GIS Basics(GIS 的基础) (69) Unit 24 Data Types and Models in GIS GIS中的数据类型和模型 (75) Unit 25 Digital Terrain Modeling(数字地面模型) (79) Unit 26 Applications of GIS (83) Unit 27 Developments of photogrammetry (87) Unit 28 Fundamentals of Remote Sensing (遥感的基础) (90) Unit 29 Digital Image Processing and Its Applications in RS (94) Unit 30 Airborne Laser Mapping Technology(机载激光测图技术) (99) Unit 31 Interferometric SAR(InSAR) (102) Unit 32 Brief Introduction toApplied Geophysics (104) Unit 33 Origon of Induced Polarization (105) Unit 34 International Geoscience Organization (108) Unit 35 Prestigious Journals in Geomatics (110) Unit 36 Relevant Surveying Instrument Companies (115) Unit 37 Expression of Simple Equations and Scientific Formulsa (116) Unit 38 Professional English Paper Writing (119) Unit 39 Translation Techniques for EST (127)
1.2 总线互连 总线是连接两个或多个设备的通信通路。总线的关键特征是,它是一条共享传输介质。多个设备连接到总线上,任一个设备发出的信号可以为其他所有连接到总线上的设备所接收。如果两个设备同时传送,它们的信号将会重叠,引起混淆。因此,一次只能有一个设备成功地(利用总线)发送数据。 典型的情况是,总线由多条通信通路或线路组成,每条线(路)能够传送代表二进制1和0的信号。一段时间里,一条线能传送一串二进制数字。总线的几条线放在一起能同时并行传送二进制数字。例如, 一个8位的数据能在8条总线线上传送。 计算机系统包含有多种不同的总线,它们在计算机系统层次结构的各个层次提供部件之间的通路。连接主要计算机部件(处理机, 存储器, I/O)的总线称为系统总线。系统总线通常由50~100条分立的(导)线组成。每条线被赋予一个特定的含义或功能。虽然有许多不同的总线设计,但任何总线上的线都可以分成三个功能组:数据线、地址线和控制线。此外可能还有为连接的模块提供电源的电源线。 数据线提供系统模块间传送数据的路径,这些线组合在一起称为数据总线。典型的数据总线包含8、16或32根线,线的数量称为数据总线的宽度。因为每条线每次传送1位,所以线的数目决定了每次能同时传送多少位。数据总线的宽度是决定系统总体性能的关键因素。 地址线用于指定数据总线上数据的来源和去向。例如,如果处理机希望从存储器中读一个字的数据,它将所需要字的地址放在地址线上。显然,地址总线的宽度决定了系统最大可能的存储器容量。 控制线用来控制对数据线和地址线的访问和使用。由于数据线和地址线被所有部件共享,因此必须用一种方法来控制它们的使用。控制信号在系统模块之间传送命令和定时信息。定时信息指定了数据和地址信息的有效性,命令信号指定了要执行的操作。 大多数计算机系统使用多总线,这些总线通常设计成层次结构。图1.3显示了一个典型的高性能体系结构。一条局部总线把处理机连接到高速缓存控制器,而高速缓存控制器又连接到支持主存储器的系统总线上。高速缓存控制器集成到连接高速总线的桥中。这一总线支持连接到:高速LAN、视频和图形工作站控制器,以及包括SCSI 和FireWire的局部外设总线的接口控制器。低速设备仍然由分开的扩充总线支持,用一个接口来缓冲该扩充总线和高速总线之间的通信流量。 PCI 外部设备互连是流行的高带宽的、独立于处理机的总线,它能够作为中间层或外围设备总线。当前的标准允许在66MHz频率下使用多达64根数据线,其原始传输速率为528MB/s, 或4.224Gbps。PCI被设计成支持各种各样基于微处理机的配置,包括单处理机和多处理机的系统。因此,它提供了一组通用的功能。PCI使用同步时序以及集中式仲裁方案。 在多处理机系统中,一个或多个PCI配置可通过桥接器连接到处理机的系统总线上。系统总线只支持处理机/高速缓存单元、主存储器以及PCI桥接器。使用桥接器使得PCI独立于处理机速度,又提供快速接收和传送数据的能力。 2.1 光存储介质:高密度存储器 2.1.1 光盘 光盘技术最终可能使磁盘和磁带存储淘汰。用这种技术,磁存储器所用的读/写头被两束激光代替。一束激光通过在光盘上刻制微小的凹点,对记录表面进行写;而另一束激光用来从光敏感的记录表面读取数据。由于光束容易被偏转到光盘上所需要的位置,所以不需要存取臂。 对用户而言,光盘正成为最有吸引力的选择。它们(光盘)对环境变化不太敏感,并且它们以每兆字节比磁盘低得多的存储器价格提供更多的直接存取存储器。光盘技术仍在出现,并且还需要稳定;然而,目前有三种主要类型的光盘。它们是CD-ROM、WORM盘和磁光盘。 CD-ROM 1980年引入的,非常成功的CD,或紧密盘是设计来提高音乐的录音重放质量的光盘。为了制作一张CD,把音乐的模拟声音转换成等价的数字声音,并且存储在一张4.72英寸的光盘上。在每张光盘上可以用数字格式(用20亿数字位)记录74分钟的音乐。因为它的巨大存储容量,计算机工业的企业家们立刻认
机械制造专业英语文章 篇一:机械专业英语文章中英文对照 Types of Materials 材料的类型 Materials may be grouped in several ways. Scientists often classify materials by their state: solid, liquid, or gas. They also separate them into organic (once living) and inorganic (never living) materials. 材料可以按多种方法分类。科学家常根据状态将材料分为:固体、液体或气体。他们也把材料分为有机材料(曾经有生命的)和无机材料(从未有生命的)。 For industrial purposes, materials are divided into engineering materials or nonengineering materials. Engineering materials are those used in manufacture and become parts of products. 就工业效用而言,材料被分为工程材料和非工程材料。那些用于加工制造并成为产品组成部分的就是工程材料。 Nonengineering materials are the chemicals, fuels, lubricants, and other materials used in the manufacturing process, which do not become part of the product. 非工程材料则是化学品、燃料、润滑剂以及其它用于加工制造过程但不成为产品组成部分的材料。 Engineering materials may be further subdivided into: ①Metal ②Ceramics ③Composite ④Polymers, etc. 工程材料还能进一步细分为:①金属材料②陶瓷材料③复合材料④聚合材料,等等。 Metals and Metal Alloys 金属和金属合金 Metals are elements that generally have good electrical and thermal conductivity. Many metals have high strength, high stiffness, and have good ductility. 金属就是通常具有良好导电性和导热性的元素。许多金属具有高强度、高硬度以及良好的延展性。 Some metals, such as iron, cobalt and nickel, are magnetic. At low temperatures, some metals and intermetallic compounds become superconductors. 某些金属能被磁化,例如铁、钴和镍。在极低的温度下,某些金属和金属化合物能转变成超导体。 What is the difference between an alloy and a pure metal? Pure metals are elements which come from a particular area of the periodic table. Examples of pure metals include copper in electrical wires and aluminum in cooking foil and beverage cans. 合金与纯金属的区别是什么?纯金属是在元素周期表中占据特定位置的元素。 例如电线中的铜和制造烹饪箔及饮料罐的铝。 Alloys contain more than one metallic element. Their properties can be changed by changing the elements present in the alloy. Examples of metal alloys include stainless steel which is an alloy of iron, nickel, and chromium; and gold jewelry which usually contains an alloy of gold