
GDB调试器及调试方法
- 格式:pdf
- 大小:542.84 KB
- 文档页数:21


gdb编译方法GDB(GNU Debugger)是一款用于调试程序的开源调试器。
以下是使用 GDB 进行编译和调试的基本步骤:步骤:确保安装 GDB:在大多数 Linux 发行版中,你可以使用包管理工具安装 GDB。
例如,在 Ubuntu 中,可以使用以下命令安装:sudo apt-get install gdb在 macOS 中,可以使用 Homebrew 进行安装:brew install gdb对于其他系统,请参考相应的文档或使用适当的包管理工具。
编译程序时启用调试信息:在编译你的程序时,确保启用调试信息。
使用 -g 选项告诉编译器生成调试信息。
例如,在使用 GCC 编译 C 程序时:gcc -g -o my_program my_program.c启动 GDB:在命令行中输入 gdb 后跟可执行文件的路径:gdb ./my_program设置断点:使用 break 命令在程序的特定位置设置断点,使程序在该位置停止执行。
例如,在函数 main 的开头设置断点:break main运行程序:在 GDB 中使用 run 命令来运行你的程序:run调试:在程序运行时,你可以使用各种 GDB 命令进行调试,如 step, next, continue 等。
这些命令用于单步执行、跳到下一个断点、继续执行等。
查看变量和堆栈:使用 print 命令查看变量的值,使用 backtrace 或 bt 查看调用堆栈。
退出 GDB:在 GDB 中完成调试后,使用 quit 命令退出。
quit这些步骤提供了一个基本的 GDB 使用示例。
请注意,实际的调试可能会涉及更多的 GDB 命令和高级功能,具体取决于你的程序和调试需求。
GDB 的文档和在线资源可以提供更详细的信息和用法。
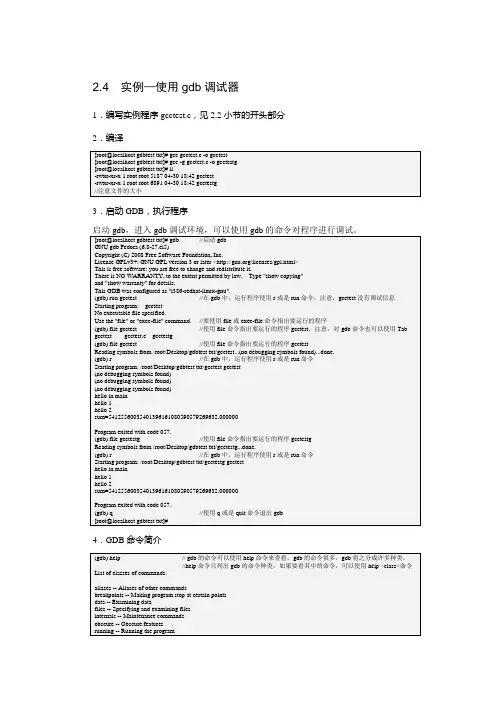
2.4 实例—使用gdb调试器1.编写实例程序gcctest.c,见2.2小节的开头部分2.编译3.启动GDB,执行程序启动gdb,进入gdb调试环境,可以使用gdb的命令对程序进行调试。
[root@localhost gdbtest txt]# gdb //启动gdbGNU gdb Fedora (6.8-27.el5)Copyright (C) 2008 Free Software Foundation, Inc.License GPLv3+: GNU GPL version 3 or later </licenses/gpl.html>This is free software: you are free to change and redistribute it.There is NO WARRANTY, to the extent permitted by law. Type "show copying"and "show warranty" for details.This GDB was configured as "i386-redhat-linux-gnu".(gdb) run gcctest //在gdb中,运行程序使用r或是run命令,注意,gcctest没有调试信息Starting program: gcctestNo executable file specified.Use the "file" or "exec-file" command. //要使用file或exec-file命令指出要运行的程序(gdb) file gcctest //使用file命令指出要运行的程序gcctest,注意,对gdb命令也可以使用Tab gcctest gcctest.c gcctestg(gdb) file gcctest //使用file命令指出要运行的程序gcctestReading symbols from /root/Desktop/gdbtest txt/gcctest...(no debugging symbols found)...done.(gdb) r //在gdb中,运行程序使用r或是run命令Starting program: /root/Desktop/gdbtest txt/gcctest gcctest(no debugging symbols found)(no debugging symbols found)(no debugging symbols found)hello in mainhello 1hello 2sum=54125560035401396161080590579269632.000000Program exited with code 057.(gdb) file gcctestg //使用file命令指出要运行的程序gcctestgReading symbols from /root/Desktop/gdbtest txt/gcctestg...done.(gdb) r //在gdb中,运行程序使用r或是run命令Starting program: /root/Desktop/gdbtest txt/gcctestg gcctesthello in mainhello 1hello 2sum=54125560035401396161080590579269632.000000Program exited with code 057.(gdb) q //使用q或是quit命令退出gdb[root@localhost gdbtest txt]#4.GDB命令简介support -- Support facilitiestracepoints -- Tracing of program execution without stopping the programuser-defined -- User-defined commandsType "help" followed by a class name for a list of commands in that class.Type "help all" for the list of all commands.Type "help" followed by command name for full documentation.Type "apropos word" to search for commands related to "word".Command name abbreviations are allowed if unambiguous.(gdb) help files //使用help <class>命令查看files类中的命令Specifying and examining files.List of commands:add-shared-symbol-files -- Load the symbols from shared objects in the dynamic linker's link mapadd-symbol-file -- Load symbols from FILEadd-symbol-file-from-memory -- Load the symbols out of memory from a dynamically loaded object filecd -- Set working directory to DIR for debugger and program being debuggedcore-file -- Use FILE as core dump for examining memory and registersdirectory -- Add directory DIR to beginning of search path for source filesedit -- Edit specified file or functionexec-file -- Use FILE as program for getting contents of pure memoryfile -- Use FILE as program to be debuggedforward-search -- Search for regular expression (see regex(3)) from last line listedgenerate-core-file -- Save a core file with the current state of the debugged processlist -- List specified function or lineload -- Dynamically load FILE into the running programnosharedlibrary -- Unload all shared object library symbolspath -- Add directory DIR(s) to beginning of search path for object filespwd -- Print working directoryremote -- Manipulate files on the remote systemremote delete -- Delete a remote fileremote get -- Copy a remote file to the local systemremote put -- Copy a local file to the remote system---Type <return> to continue, or q <return> to quit--- //一屏显示不完,敲回车键显示后面的内容reverse-search -- Search backward for regular expression (see regex(3)) from last line listedsearch -- Search for regular expression (see regex(3)) from last line listedsection -- Change the base address of section SECTION of the exec file to ADDRsharedlibrary -- Load shared object library symbols for files matching REGEXPsymbol-file -- Load symbol table from executable file FILEType "help" followed by command name for full documentation.Type "apropos word" to search for commands related to "word".Command name abbreviations are allowed if unambiguous.(gdb)5.显示源代码(gdb) file gcctestg //使用file命令指出要运行的程序gcctestgLoad new symbol table from "/root/Desktop/gdbtest txt/gcctestg"? (y or n) yReading symbols from /root/Desktop/gdbtest txt/gcctestg...done.(gdb) list //显示当前行后面的源程序1 #include <stdio.h>23 void print_hello1(char *p_str);4 void print_hello2(char *p_str);56 int main(int argc,char **argv)7 {8 double i,sum=0;9 char *pstr="hello in main";10 int arr[]={1,2,3,4,5};(gdb) list //显示当前行后面的源程序11 printf("%s\n",pstr);12 print_hello1("hello 1");13 print_hello2("hello 2");1415 for(i=1; i<=1020000020.01*1020000020.01*10100020.01*10100020.00202; i=i*1.0000016)16 sum=sum/1.0201809902203*1.000102101203*1.00006605+i*10.01016/1.0005;17 printf("sum=%f\n",sum);18 }1920 void print_hello1(char *p_str)(gdb) //敲回车键,继续执行list命令,显示当前行后面的源程序21 {22 printf("%s\n",p_str);23 }2425 void print_hello2(char *p_str)26 {27 printf("%s\n",p_str);28 }(gdb) list 8 //显示程序第8行的周围的源程序3 void print_hello1(char *p_str);4 void print_hello2(char *p_str);56 int main(int argc,char **argv)7 {8 double i,sum=0;9 char *pstr="hello in main";10 int arr[]={1,2,3,4,5};11 printf("%s\n",pstr);12 print_hello1("hello 1");(gdb) list 6,10 //显示程序第6-10行的源程序6 int main(int argc,char **argv)7 {8 double i,sum=0;9 char *pstr="hello in main";10 int arr[]={1,2,3,4,5};(gdb)gdb可以显示调试程序(编译程序时一定要加上-g参数,把源程序信息编译到执行文件中)的源代码。

gdb指定内存断点标题:GDB指定内存断点引言概述:GDB(GNU调试器)是一种功能强大的调试工具,可用于调试C、C++和其他编程语言的程序。
其中一个重要的功能是设置断点,使程序在指定的位置停止执行,以便进行调试。
本文将重点介绍GDB中如何指定内存断点,以帮助开发者更好地定位和解决内存相关的问题。
正文内容:1. 指定内存断点的基本概念1.1 内存断点的定义1.2 内存断点的作用和意义1.3 内存断点的分类和使用场景2. GDB中指定内存断点的方法2.1 使用“watch”命令指定内存断点2.2 使用“rwatch”命令指定读取内存断点2.3 使用“awatch”命令指定写入内存断点2.4 使用“hwatch”命令指定硬件内存断点2.5 使用“catch”命令指定异常断点3. 指定内存断点的注意事项3.1 内存断点的限制和性能影响3.2 避免设置过多的内存断点3.3 内存断点的调试技巧和经验分享4. 实例演示:在GDB中指定内存断点的步骤4.1 准备工作:编译和调试程序4.2 使用“watch”命令指定内存断点4.3 调试过程中的内存断点触发和处理4.4 结束调试和移除内存断点5. GDB中指定内存断点的扩展应用5.1 结合其他调试技术和工具使用内存断点5.2 在多线程和多进程程序中使用内存断点5.3 使用内存断点进行内存泄漏和内存溢出的调试总结:通过本文的介绍,我们了解了GDB中指定内存断点的基本概念和方法。
指定内存断点是调试过程中非常有用的工具,可以帮助开发者快速定位和解决内存相关的问题。
然而,在使用内存断点时需要注意一些限制和性能影响,并且可以结合其他调试技术和工具进行更深入的调试。
希望本文对读者在使用GDB进行调试时有所帮助。

经典的GDB调试命令,包括查看变量,查看内存经典的GDB调试命令,包括查看变量,查看内存在你调试程序时,当程序被停住时,你可以使⽤print命令(简写命令为p),或是同义命令inspect来查看当前程序的运⾏数据。
print命令的格式是:printprint /是表达式,是你所调试的程序的语⾔的表达式(GDB可以调试多种编程语⾔),是输出的格式,⽐如,如果要把表达式按16进制的格式输出,那么就是/x。
⼀、表达式print和许多GDB的命令⼀样,可以接受⼀个表达式,GDB会根据当前的程序运⾏的数据来计算这个表达式,既然是表达式,那么就可以是当前程序运⾏中的const常量、变量、函数等内容。
可惜的是GDB不能使⽤你在程序中所定义的宏。
表达式的语法应该是当前所调试的语⾔的语法,由于C/C++是⼀种⼤众型的语⾔,所以,本⽂中的例⼦都是关于C/C++的。
(⽽关于⽤GDB 调试其它语⾔的章节,我将在后⾯介绍)在表达式中,有⼏种GDB所⽀持的操作符,它们可以⽤在任何⼀种语⾔中。
@是⼀个和数组有关的操作符,在后⾯会有更详细的说明。
::指定⼀个在⽂件或是⼀个函数中的变量。
{}表⽰⼀个指向内存地址的类型为type的⼀个对象。
⼆、程序变量在GDB中,你可以随时查看以下三种变量的值:1. 全局变量(所有⽂件可见的)2. 静态全局变量(当前⽂件可见的)3. 局部变量(当前Scope可见的)如果你的局部变量和全局变量发⽣冲突(也就是重名),⼀般情况下是局部变量会隐藏全局变量,也就是说,如果⼀个全局变量和⼀个函数中的局部变量同名时,如果当前停⽌点在函数中,⽤print显⽰出的变量的值会是函数中的局部变量的值。
如果此时你想查看全局变量的值时,你可以使⽤::操作符:file::variablefunction::variable可以通过这种形式指定你所想查看的变量,是哪个⽂件中的或是哪个函数中的。
例如,查看⽂件f2.c中的全局变量x的值:gdb) p 'f2.c'::x当然,::操作符会和C++中的发⽣冲突,GDB能⾃动识别::是否C++的操作符,所以你不必担⼼在调试C++程序时会出现异常。