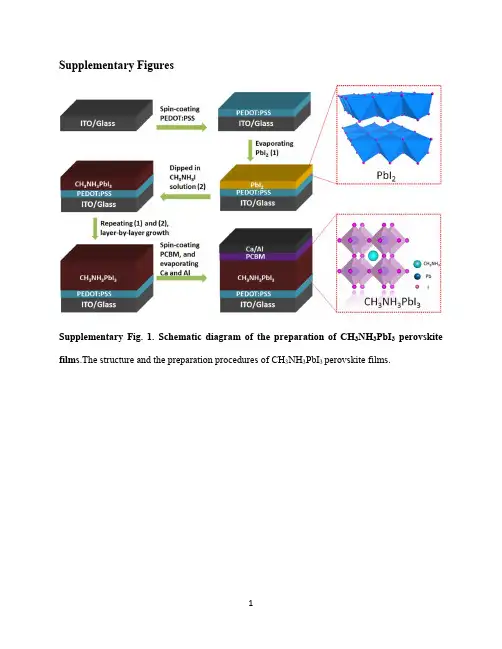
Supplementary FiguresSupplementary Fig. 1. Schematic diagram of the preparation of CH3NH3PbI3perovskite films.The structure and the preparation procedures of CH3NH3PbI3 perovskite films.Supplementary Fig. 2. Material characterization of PbI2 and CH3NH3PbI3 perovskite films.(a) XRD patterns of PbI2 and CH3NH3PbI3 perovskite film, (b) SEM image, (c) XRD pattern, and (d) UV-vis absorbance spectra of CH3NH3PbI3 film transformed from the dipping of 3-layered PbI2 with a total thickness of 375 nm in a solution of CH3NH3I.Supplementary Fig. 3. XPS spectra of the CH3NH3PbI3 perovskite film. (a) A XPS survey spectrum of CH3NH3PbI3 film; and high resolution XPS spectra of (b) C 1s, (c) I 3d, (d) Pb 4f and (e) N1s.Supplementary Fig. 4. IPCE spectrum of the CH3NH3PbI3perovskite film. The IPCE spectrum of the CH3NH3PbI3 perovskite film.Supplementary Fig. 5. Device performance for CH3NH3PbI3 perovskite solar cells (PSCs). J-V curves of randomly selected 14 single PSCs measured under 100 mW cm-2AM 1.5G illumination divided into four groups: (a) four single PSCs (No.1 - No.4, in group A) to be used for fabrication of the fabricated PSCs unit for cycling performance measurements at 0.5 C, (b) four single PSCs (No.5 - No.8, in group B) to be used for fabrication of the fabricated PSCs unit for rate capability measurements at various discharge C-rates, (c) four single PSCs (No.9 - No.12, in group C) to be used for fabrication of the fabricate PSCs unit for long-time rest for 720 hours, (d) single PSC (No. 13, Best) for long-time rest test for 720 hours; and the single PSC with the best η1 record (single PSC, No. 14, Rest) was also plotted in Supplementary Fig. 5d.Supplementary Fig. 6. The statistic of key parameters of randomly selected perovskite solar cells (PSCs) based on CH3NH3PbI3. (a) V oc, (b) J c, (c) FF and (d) η1 of randomly selected 14 single PSCs: four single PSCs (No.1 - No.4, in group A) for the fabrication of PSCs unit for cycling performance measurements at 0.5 C; four single PSCs (No.5 - No.8, in group B) for the fabrication of PSCs unit for rate capability measurements at various discharge C-rates; four single PSCs (No.9 - No.12, in group C) for the fabrication of PSCs unit for long-time rest test for 720 hours; single PSC (No. 13, Best) for long-time rest test for 720 hours; and single PSC (No. 14, Rest) with the best η1 recorded.Supplementary Fig. 7. Material characterization of electrode materials for LIB.XRD patterns of (a) LiFePO4 and (b) Li4Ti5O12, and SEM images of (c) LiFePO4 and (d) Li4Ti5O12.Supplementary Fig. 8. Comparison of photo-charge and galvanostatic charge time of the devices at the same C-rate. Photo-charged time at an photocharge current density of 0.5 C (Black, PSCs-LIB) and galvanostatic charged time at 0.5 C (Red, PS-LIB) vs. cycle number.Supplementary Fig. 9. Device performance of single PSC and fabricated PSCs unit after long time rest. (a) J-V curves, (b) V oc and Jc, (c) FF and η1 of a single PSC (No. 14); (d) J-V curves, (e) V oc and J c, (f) FF and η1of the fabricated PSCs unit (fabrication from four single PSCs (No. 9- NO.12 in group C)) after various hours. (g) PCE (η1) decay of the devices measured based on the single PSC/fabricated PSCs unit unencapsulated and stored in a high-purity Ar-filled glove box for 720 hours.Supplementary Fig. 10. Performance of connected PSCs device after the rate capability measurements with LFPO-LTO cell (four single PSCs (No. 9- NO.12, in group C) in the PSCs-LIB unit). (a) J-V curves of fabricated PSCs before and after different cycles, (b) V oc and J c and (c) fill factor (FF) and solar-to-electric power conversion efficiency (PCE, ɳ1, Method calculation 1).Supplementary Fig. 11. Electrochemical performance and energy conversion efficiency of PSCs-LIB and PS-LIB. (a) Discharge capacity of LFPO-LTO cell at various C-rates (Blue line in the 1-10th cycles: photo-charge at 0.5 C using PC and galvanostatically discharge at various C-rates using PS machine. Red line in the 11th-20th cycles: galvanostatically charged at 0.5 C and galvanostatically discharged at various C-rates using Land machine). Voltage-time (V-t) curves of photo-charged PSCs-LIB unit, followed by galvanostatically discharging at (b) 0.1 C, (c) 0.25 C. (d) 0.5 C. (e) 0.75 C (f) 1 C.(g) overall photo-electric conversion and storage efficiency of the entire PSCs-LIB unit (ɳ2) vs. C-rates.Supplementary Fig. 12.Discharge rate capability comparison between PSCs-LIB and PS-LIB. Capacity retention vs. C-rates of PSCs-LIB and PS-LIB.Supplementary TablesSupplementary Table 1. Reporetd integrated devices of solar-storage/conversion systems.LiPF 6 in a solution of EC:DMC (volume ratio 1:1), and aPVDF membrane. The device can be photo-charged under 1000 W m-2 of white light to an open-circuit voltage of 0.47 V with acapacity of 37.62 mC cm -2.respectively, which provided an open-circuit voltage of 3.39 Vand a short-circuit current density of 1.01 mA cm -2. The powerpack was solar-illumination charged and galvanostaticallydischarged between 0.75 and 3 V on a program-controlled testsystem. The power pack can be charged to about 3 V in about 8min, and the discharge capacity is about 38.89 μAh under thedischarge density of 100 μA.polymeric charge storage electrode and a ClO 4− doped polypyrrole counter electrode. A potentialvoltage range of 0.25-0.76 V of the cell at photo-charge underirradiation and electrochemical discharge at 8 μA cm −2 weredemonstrated. The discharge capacity calculated from theamount of the loaded PEDOT on the hybrid photo-anode wasabout 8.3 mAh g −1.discharge capacity of 0.200 mAh cm−2 in the first cycle.device can reach up to 5.41%. The device deliveredan area-specific capacitance of 3 mF cm -2 to 41 mF cm -2.discharge capacity obtained from the RFB was 53.3 mAhL -1,corresponding to a 47.9% utilization of the photochargecapacity.active species in aqueous electrolyte, LiI as cathode-activespecies in organic electrolyte, and LISICON lithium-ion-conducting glass ceramic film as membrane. The initialdischarge capacity of the battery was 0.0153 mA h mL-1, in thevoltage range of 0.2 -0.76 V. A discharge capacity of 0.0151mA h mL-1 was retained after 10 cycles.storage nanocomposite modified counter electrodes (CEs), The CEs ofDSSCs were modified by PVDF/ZnO nanowire arraynanocomposites for the energy storage function. The devicewith 25-nm-thick PVDF could provide a η of 3.70% while partof the photo-generated charge was stored in CE with a chargedensity of 2.14 C g-1which produced a η of 2.31%. The flexible integrated devicewas photocharged to 0.73 V in 183 s and then maintained. Thegalvanostatic discharge time was about 137 s at a dischargecurrent density of 1.4 mA cm-2. The specific capacitance was83 F g-1, and the energy storage efficiency was calculated to be34% with an entire energy conversion and storage efficiency of0.79%.photoelectric conversion efficiency achieved was 2.73%, whilethe energy storage efficiency reached 75.7% with specificcapacitances up to 0.156 mF cm-1 or 3.32 mF cm-2 and powerdensities up to 0.013 mW cm-1 or 0.27 mW cm-2.efficiency) was adopted as the photo-charging source. Thedevice was operated ideally to present that the supercapacitor,84% of the charge generated by the PV device can beeffectively stored by the supercapacitor.stability of the photo-supercapacitor was investigated for 100cycles at a discharge current density of 0.1 mAcm-2. The energydensity of the device was calculated to be 6.662 × 10⁻⁸ Wh cm-2.The device exhibited a maximum energy storage efficiency of51.60% and an overall photoelectric conversion and storage efficiency of 1.64%.photo-assisted charging. Due to the contribution of the photo-voltage, the charging over-potential is reduced from ~ 3.8 to ~ 3.40 V.fabricated. An entire photoelectric conversion and storage efficiency of 0.79% before bending, which was decreased significantly to 0.05% after bending for 100 cycles.efficiency of the integrated energy textile was calculated to be 68.4% for the CNT/PANI composite. The entire energy conversion efficiency was 2.1% for the integrate device.(PEDOT:PSS) and a porphyrin dye, which showed a capacitance of ~1.04 mF. The device was charged up to 430 mV (open circuit voltage) under a solar simulated illumination and stored the charge for more than 10 min in the dark.outstanding solar-to-electric power conversion efficiency (PCE) of 12.65%. The fabricated PSCs-LIB device demonstrated a high photo-electric conversion storage efficiency of 7.36% at 0.5 C and excellent cycling stability with a long illumination period of 17.8 hours. At a discharge C-rate of 0.1 C, t he PSCs-LIB exhibited even a higher photo-electric conversion storage efficiency of 7.80%.* η 1: Power conversion Efficiency of solar cell. η 2: Overall photo-electric conversion efficiency of the integrate device.Supplementary Table 2. XPS results of the CH3NH3PbI3 film.Atomic element C Pb I NPercentage (at. %) 41.612.836.59.1Supplementary Table 3. Performance parameters of the CH3NH3PbI3 perovskite solar cells for photo-charging LIBs at 0.5 C for 10 cycles.Cycle number(N)J c(mA cm-2)V oC(V)FF PCE-PSCs(η 1, %)Average PCE*(η 1, %)Before cycle 4.83 3.85 0.68 12.65 N/A1 4.75 3.84 0.68 12.40 12.522 4.69 3.84 0.68 12.24 12.323 4.64 3.83 0.68 12.08 12.164 4.59 3.84 0.68 12.00 12.045 4.52 3.82 0.69 11.91 11.956 4.46 3.82 0.68 11.60 11.767 4.38 3.80 0.68 11.31 11.458 4.38 3.83 0.67 11.23 11.279 4.37 3.81 0.67 11.20 11.2110 4.37 3.81 0.67 11.16 11.18* In order to calculate energy conversion of LIB (η3 = η2/η1, see calculation in Section 4 of SI) at each cycle, the power conversion efficiency of PSCs (PCE-PSCs, η1) for LIB in the whole charge process at n th cycle was assumed to be an average PCE, which was calcualted by the (PCE (n th-1) + PCE (n th))/2. For example, average PCE at 1st cycle = (12.65%+12.40%)/2=12.52%.fabricated PSCs-LIB unit (η2, %, PCE-PSCs-LIB) at each cycle with a galvanostatic discharge rate of 0.5 C and its corresponding power storage efficiency of LIB (η3, PCE-LIB).Cycle number(N) PCE-PSCs-LIB(η2, %)PCE-LIB(η3,%)1 7.08 56.572 7.31 59.403 7.36 60.624 6.92 57.665 6.92 58.176 6.98 59.647 6.74 57.208 6.76 60.129 6.73 60.0810 6.82 61.0911 - 66.25**12 - 66.32**13 - 66.29**14 - 65.97**15 - 66.02**** The effiency of PS-LIB was calculated based on Method calculation 4.PSCs-LIB device (η2, %, PCE-PSCs-LIB) at different discharge C-rates.C-rates (C) PCE-PSCs-LIB(η2, %)0.1 7.80 0.25 7.35 0.5 6.870.75 6.471 6.11Supplementary NoteTo demonstrate repeated fabrication of perovskite SCs and fabricated PSCs units without large statistic deviations for reliably photo-charging LIBs, we have prepared more new perovskite SCs and connected PSCs units for testing. Supplementary Figs. 5, 6 and 11 show reproducible and stable photovoltaic parameters, including J c, V oc, FF, and ɳ1, for all the single PSC and their connected units tested in this study. In order to determine the discharge rate capability of LFPO-LTO cell in the PSCs-LIB system, we photo-charged the LFPO-LTO LIB with the perovskite SC at 0.5 C and galvanostatically discharged at various C-rates from 0.1 to 1 C (black dots, Supplementary Fig. 11a). Supplementary Figs. 11b-f show typical charge-discharge behaviors of the photo-charged LFPO-LTO cell discharged at different C-rates, which agreed well with the results shown in Figure 2f. As can be seen, the PSCs-LIB cell delivered reversible capacities of 142.1, 131.9, 126.6, 113.7 and 101.2 mA h g−1 at discharge current densities of 0.1, 0.25, 0.5, 0.75, 1 C, respectively. As expected, the initial capacity of the PS-LIB cell at 0.1 C is very close to the initial reversible capacity of 140.4 mAh g-1 for the cell at 0.5 C (Figure 3e). Supplementary Fig. 11a (red dots) also shows the discharge rate capability at various C-rates from 0.1 to 1 C after galvanostatically charged at 0.5 C for the LFPO-LTO cell, which has been photo-charged and galvanostatically charged for 10 cycles (i.e., blue dots in Supplementary Fig. 11a). As can be seen in Supplementary Fig. 12, the photo-charged PSCs-LIB and the PS-LIB cell gavanostatically charged and discharged at 0.5 C both exhibited a similar rate capability from 0.1 - 1 C, further indicating a highly stable PSCs-LIB system.Supplementary MethodsMaterials preparationThe commercial LiFePO4cathode and Li4Ti5O12anode were purchased from the MTI Corporation (USA). The PEDOT:PSS, PbI2, and PC61BM were purchased from Clevious, Sigma Aldrich, and Nano-C, respectively. CH3NH3I was synthesized according to the reported procedures (Supplementary Ref. 1).Materials characterizationScanning electron microscopic (SEM) images were recorded on a Nova nano SEM 600. X-ray diffraction (XRD) was conducted on a Miniflex II Desktop X-ray diffractometer. UV-vis absorption was measured on a Shimadzu UV1800 spectrometer. The incident photon-to-current efficiency (IPCE) was measured on a Solar Cell Measurement System from PV measure ment Inc.PSCs-LIB device assembleThe cathode (anode) was fabricated by blending LiFePO4,LFPO, (Li4Ti5O12, LTO) with acetylene black carbon and PVDF, at a weight ratio of 90 : 5 : 5, respectively. N-methyl-2-pyrrolidone (NMP) was used as the blending solvent for the mixture. The slurries were stirred in a sealed glass bottle for 3 hours. The obtained LiFePO4 and Li4Ti5O12 slurries were coated on Al and Cu foils, respectively, and then dried at 90 °C for 12 h. Thereafter, the electrodes were vacuum-dried again at 90 °C for 12 h after having been punched into round disks (2 cm-2) with amass loading of 22 ~ 26 mg. The LIBs were then assembled using CR 2032 coin-type cells in an Ar-filled glove box. The LFPO-Li and LTO-Li half cells were assembled using LiFePO4or Li4Ti5O12 as the working electrode, Li foil as the counter electrode and reference electrode, porous polypropylene film as separator and 1 M LiPF6in a 1:1:1 (v/v/v) mixture of ethylene carbonate (EC), dimethyl carbonate (DMC) and diethyl carbonate (DEC) as the electrolyte. The LFPO-LTO full cell was assembled by using LFPO and LTO as the cathode and anode, respectively. The LFPO-Li, LTO-Li, and LFPO-LTO cells were measured using an automatic battery tester system (Land®, China) and photo-charged or galvanostatically charged and discharged at various current densities in the voltage ranges of 2.5 - 4.0, 1.0 - 3.0 and 1.0 - 2.6 V, respectively (1 C = 170 mA g-1 for all three samples).ITO glass substrates were cleaned sequentially with detergent, de-ionized water, acetone, and iso-propanol, followed by drying with N2flow and UV-ozone treatment for 15 minutes. The PEDOT:PSS solution (Al4083 from H. C. Starck) was spin-cast onto ITO electrodes at 5000 rpm for 40 s, followed by heating at 140 °C for 10 minutes. The PEDOT:PSS-coated ITO/Glass substrate was then transferred to an evaporator in an Ar-filled glovebox for PbI2evaporation (125 nm). Thereafter, the PbI2-deposited substrate was dipped into a solution of CH3NH3I in 2-propanol (10 mg ml-1) for 40 s to form the CH3NH3PbI3perovskite layer and rinsed with 2-propanol. Similarly, a second PbI2layer was thermally evaporated onto the CH3NH3PbI3 perovskite film, followed by dipping into the CH3NH3I solution to form the second layer of CH3NH3PbI3perovskite, and the process repeated for 3 times for a desired thickness was obtained. The CH3NH3PbI3 perovskite thus formed was then thermally annealed at 100 °C for 10 minutes in the glove box to complete crystallization of the perovskite and to eliminate the interface, if any, through the film thickness. After the annealing, PC61BM in chlorobenzenesolution (17 mg ml-1) was deposited onto the perovskite layer by spin-coating at 1000 rpm for 60 s. Finally, the device was transferred to the evaporator for thermal evaporation of Ca (20 nm) and Al (100 nm) at 10-7 Torr. The fabricted solar cell was kept in the glove box under high purity Ar gas and ready for further electrochemical measurements and long-time rest measurements.CalculationsThe energy-conversion efficiency of the peroveskite solar cell (PS C)(η1):η1(PSC) = J c × FF × V OC / P × 100 % (1)where FF , V OC , Jc , and P are fill factor, open-circuit voltage (V),short-circuit current density (mA cm-2), and incident light power density (100 mWcm−2 ), respectively.The energy conversion and storage efficiency of the entire perovskite solar cells (PSCs) - lithium ion battery (LIB) (PSCs-LIB) fabricated unitη2 (PSCs-LIB) = E d/ (P× S × t) × 100 % (2) where E d, P, S and t are discharge energy of LIB (mWh, from Land machine), light power density (100 mWcm−2 ), effective area of PSCs in series (cm-2) and photo-charge time (h), respectively.The energy storage efficiency for perovskite solar cells (PSCs) to photo-charge lithium ion battery (LIB) :η3 (PSCs-LIB)= η2/η1× 100 % (3)The energy storage efficiency for galvanostatically charging lithium ion battery with Land machine (PS-LIB)η3 (PS-LIB) = E d/E c× 100 % (4)where E d (Wh) and E c (Wh) are the discharge and charge energy (mWh) in which the LIB was galvanostatically charged using Land machine as power supply (PS).Supplementary References1. Xiao, Z. et al. Giant switchable photovoltaic effect in organometal trihalide perovskite devices. Nat. Mater. 14, 193-198 (2015).2. Lo, C.-W., Li, C. & Jiang, H. Direct solar energy conversion and storage through coupling between photoelectrochemical and ferroelectric effects. AIP Adv. 1, 042104 (2011).3. Guo, W., Xue, X., Wang, S., Lin, C. & Wang, Z.L. An integrated power pack of dye-sensitized solar cell and Li battery based on double-sided TiO2 nanotube arrays. Nano Lett. 12, 2520-2523 (2012).4. Liu, P., Yang, H.X., Ai, X.P., Li, G.R. & Gao, X.P. A solar rechargeable battery based on polymeric charge storage electrodes. Electrochem. Commun.16, 69-72 (2012).5. Yan, N.F., Li, G.R., Pan, G.L. & Gao, X.P. TiN nanotube arrays as electrocatalytic electrode for solar storable rechargeable battery. J. Electrochem. Soc.159, A1770-A1774 (2012).6. Fu, Y. et al. Integrated power fiber for energy conversion and storage. Energ. Environ. Sci.6, 805-812 (2013).7. Liu, P. et al. A solar rechargeable flow battery based on photoregeneration of two soluble redox couples. ChemSusChem6, 802-806 (2013).8. Yan, N.F., Li, G.R. & Gao, X.P. Solar rechargeable redox flow battery based on Li2WO4/LiI couples in dual-phase electrolytes. J. Mater. Chem. A1, 7012-7015 (2013).9. Zhang, X., Huang, X., Li, C. & Jiang, H. Dye-sensitized solar cell with energy storage function through PVDF/ZnO nanocomposite counter electrode. Adv. Mater.25, 4093-4096 (2013).10. Yang, Z. et al. An integrated device for both photoelectric conversion and energy storage based on free-standing and aligned carbon nanotube film. J. Mater. Chem. A 1, 954-958 (2013).11. Chen, X. et al. A novel "energy fiber" by coaxially integrating dye-sensitized solar cell and electrochemical capacitor. J. Mater. Chem. A2, 1897-1902 (2014).12. Westover, A.S. et al. Direct integration of a supercapacitor into the backside of a silicon photovoltaic device. Appl. Phys. Lett.104, 213905 (2014).13. Xu, J. et al. Integrated photo-supercapacitor based on Bi-polar TiO2 nanotube arrays with selective one-side plasma-assisted hydrogenation. Adv. Func. Mater.24, 1840-1846 (2014). 14. Yu, M., Ren, X., Ma, L. & Wu, Y. Integrating a redox-coupled dye-sensitized photoelectrode into a lithium–oxygen battery for photoassisted charging. Nature Commun.5, 5111, (2014).15. Zhang, Z. et al. Integrated polymer solar cell and electrochemical supercapacitor in a flexible and stable fiber format. Adv. Mater. 26, 466-470 (2014).16. Pan, S. et al. Wearable solar cells by stacking textile electrodes. Angew. Chem. Int. Ed. 24, 6224-6228. (2014).17. Takshi, A., Yaghoubi, H., Tevi, T. & Bakhshi, S. Photoactive supercapacitors for solar energy harvesting and storage. J. Power Sources275, 621-626 (2015).18. Xu, X. et al. A power pack based on organometallic perovskite solar cell and supercapacitor. ACS Nano9, 1782-1787 (2015).19. Shi, C. et al. An “all-in-one” mesh-typed integrated energy unit for both photoelectric conversion and energy storage in uniform electrochemical system. Nano Energy. doi:10.1016/j.nanoen.2015.03.032 (2015).。