山西社会发展经济数据:6-7 主要年份煤炭消费量(1980-2018)
- 格式:xls
- 大小:31.50 KB
- 文档页数:2
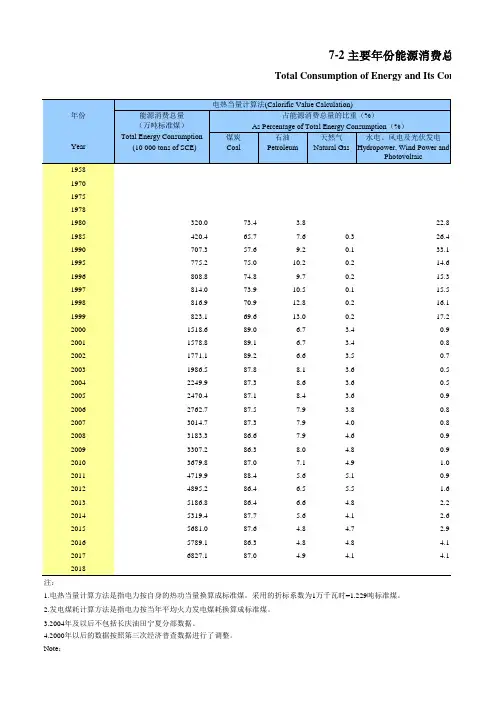
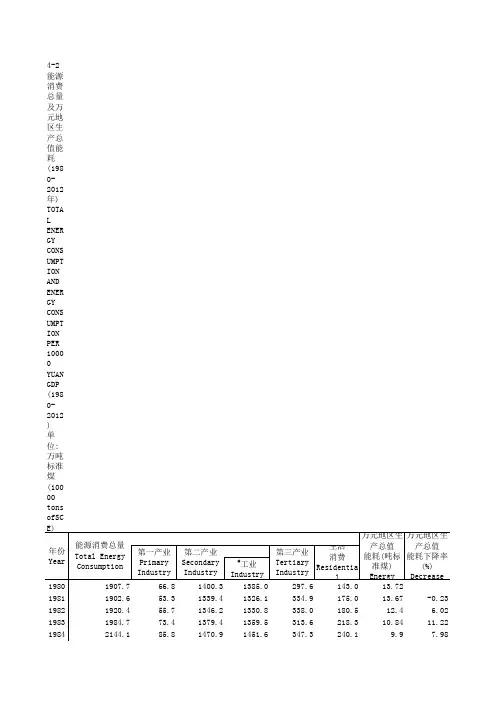
4-2能源消费总量及万元地区生产总值能耗(1980-2012年)TOTAL ENERGY CONSUMPTION AND ENERGY CONSUMPTIONPER 10000 YUAN GDP (1980-2012)单位:万吨标准煤注:1.本表能源消费量指标按等价值计算,万元地区生产总值能耗下降率按可比价计算2.2000年及以前万元地区生产总值能耗按当年价格计算;2000年以后按可比价格计算,可比价格每五年调整一次基期,更换基年份计算两个可比价数据,括号内数据是按新基期价格计算Note: a) The index of enery consumption in this table is at equalance prices.Rate of Energy Consumption perat comparable prices.b) Energy Consumption per 10000 yuan GDP befor 2000 was calculated at the price of that year; figures after comparable price. The base period of comparable price is changed every five years. Two figures at comparabl for the year in which the base period is changed.Figures in brackets were calculated at the price of new ba一次基期,更换基期Energy Consumption per 10000 yuan GDP were calculatedfigures after 2000 were calculated at o figures at comparable price were calculated at the price of new base period.。
单位:万吨
(10 000 tons)
1980
43263378727642948
1985
55664539102811691027
1990
7292645116922383841
1995
133731275727177264616
2000
127041217931286298525
2005
2263121811655011208820
2010
28180270989968116401082
2011
308962970210980124981194
2012
310852984011547118001245
2013
330623204312271123341019
2014
32056310781159711971978
2015
29428284971024810914931
2016
30061291241032410969937
2017
32171311931211211161978
注:本表煤炭
消费量包括终
#发 电ElectricityGenerationNote:Data of coal consumption in this table includes end-use consumption and consumption during the process of energy convers6-7 主要年份煤炭消费量COAL CONSUMPTION IN MAJOR YEARS年 份Year总 计Total生产建设消费Production andConstructionConsumption生活用LivingConsumption#炼 焦
Coking
udes end-use consumption and consumption during the process of energy conversion.