工程建筑给排水外文文献翻译1
- 格式:doc
- 大小:4.40 MB
- 文档页数:38

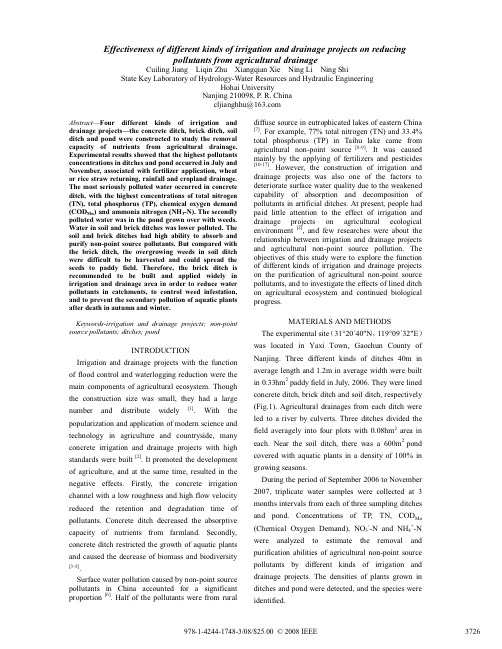
外文原文:Sealed building drainage and vent systems—an application of active air pressure transient control and suppression AbstractThe introduction of sealed building drainage and vent systems is considered a viable proposition for complex buildings due to the use of active pressure transient control and suppression in the form of air admittance valves and positive air pressure attenuators coupled with the interconnection of the network's vertical stacks.This paper presents a simulation based on a four-stack network that illustrates flow mechanisms within the pipework following both appliance discharge generated, and sewer imposed, transients. This simulation identifies the role of the active air pressure control devices in maintaining system pressures at levels that do not deplete trap seals.Further simulation exercises would be necessary to provide proof of concept, and it would be advantageous to parallel these with laboratory, and possibly site, trials for validation purposes. Despite this caution the initial results are highly encouraging and are sufficient to confirm the potential to provide definite benefits in terms of enhanced system security as well as increased reliability and reduced installation and material costs.Keywords: Active control; Trap retention; Transient propagationNomenclatureC+-——characteristic equationsc——wave speed, m/sD——branch or stack diameter, mf——friction factor, UK definition via Darcy Δh=4fLu2/2Dgg——acceleration due to gravity, m/s2K——loss coefficientL——pipe length, mp——air pressure, N/m2t——time, su——mean air velocity, m/sx——distance, mγ——ratio specific heatsΔh——head loss, mΔp——pressure difference, N/m2Δt——time step, sΔx——internodal length, mρ——density, kg/m3Article OutlineNomenclature1. Introduction—air pressure transient control and suppression2. Mathematical basis for the simulation of transient propagation in multi-stack building drainage networks3. Role of diversity in system operation4. Simulation of the operation of a multi-stack sealed building drainage and vent system5. Simulation sign conventions6. Water discharge to the network7. Surcharge at base of stack 18. Sewer imposed transients9. Trap seal oscillation and retention10. Conclusion—viability of a sealed building drainage and vent system1.Air pressure transients generated within building drainage and vent systems as a natural consequence of system operation may be responsible for trap seal depletion and cross contamination of habitable space [1]. Traditional modes of trap seal protection, based on the Victorian engineer's obsession with odour exclusion [2], [3] and [4], depend predominantly on passive solutions where reliance is placed on cross connections and vertical stacks vented to atmosphere [5] and [6]. This approach, while both proven and traditional, has inherent weaknesses, including the remoteness of the vent terminations [7], leading to delays in the arrival of relieving reflections, and the multiplicity of open roof level stack terminations inherent within complex buildings. The complexity of the vent system required also has significant cost and space implications [8].The development of air admittance valves (AAVs) over the past two decades provides the designer with a means of alleviating negative transients generated as random appliance discharges contribute to the time dependent water-flow conditions within the system. AAVs represent an active control solution as they respond directly to the local pressure conditions, opening as pressurefalls to allow a relief air inflow and hence limit the pressure excursions experienced by the appliance trap seal [9].However, AAVs do not address the problems of positive air pressure transient propagation within building drainage and vent systems as a result of intermittent closure of the free airpath through the network or the arrival of positive transients generated remotely within the sewer system, possibly by some surcharge event downstream—including heavy rainfall in combined sewer applications.The development of variable volume containment attenuators [10] that are designed to absorb airflow driven by positive air pressure transients completes the necessary device provision to allow active air pressure transient control and suppression to be introduced into the design of building drainage and vent systems, for both ‘standard’ buildings and those requiring particular attention to be paid to the security implications of multiple roof level open stack terminations. The positive air pressure attenuator (PAPA) consists of a variable volume bag that expands under the influence of a positive transient and therefore allows system airflows to attenuate gradually, therefore reducing the level of positive transients generated. Together with the use of AAVs the introduction of the PAPA device allows consideration of a fully sealed building drainage and vent system.Fig. 1 illustrates both AA V and PAPA devices, note that the waterless sheath trap acts as an AA V under negative line pressure.Fig. 1. Active air pressure transient suppression devices to control both positive and negative surges.Active air pressure transient suppression and control therefore allows for localized intervention to protect trap seals from both positive and negative pressure excursions. This hasdistinct advantages over the traditional passive approach. The time delay inherent in awaiting the return of a relieving reflection from a vent open to atmosphere is removed and the effect of the transient on all the other system traps passed during its propagation is avoided.2.Mathematical basis for the simulation of transient propagation in multi-stack building drainage networks.The propagation of air pressure transients within building drainage and vent systems belongs to a well understood family of unsteady flow conditions defined by the St Venant equations of continuity and momentum, and solvable via a finite difference scheme utilizing the method of characteristics technique. Air pressure transient generation and propagation within the system as a result of air entrainment by the falling annular water in the system vertical stacks and the reflection and transmission of these transients at the system boundaries, including open terminations, connections to the sewer, appliance trap seals and both AAV and PAPA active control devices, may be simulated with proven accuracy. The simulation [11] provides local air pressure, velocity and wave speed information throughout a network at time and distance intervals as short as 0.001 s and 300 mm. In addition, the simulation replicates local appliance trap seal oscillations and the operation of active control devices, thereby yielding data on network airflows and identifying system failures and consequences. While the simulation has been extensively validated [10], its use to independently confirm the mechanism of SARS virus spread within the Amoy Gardens outbreak in 2003 has provided further confidence in its predictions [12].Air pressure transient propagation depends upon the rate of change of the system conditions. Increasing annular downflow generates an enhanced entrained airflow and lowers the system pressure. Retarding the entrained airflow generates positive transients. External events may also propagate both positive and negative transients into the network.The annular water flow in the ‘wet’ stack entrains an airflow due to the condition of ‘no slip’ established between the annular water and air core surfaces and generates the expected pressure variation down a vertical stack. Pressure falls from atmospheric above the stack entry due to friction and the effects of drawing air through the water curtains formed at discharging branch junctions. In the lower wet stack the pressure recovers to above atmospheric due to the traction forces exerted on the airflow prior to falling across the water curtain at the stack base.The application of the method of characteristics to the modelling of unsteady flows was first recognized in the 1960s [13]. The relationships defined by Jack [14] allows the simulation to model the traction force exerted on the entrained air. Extensive experimental data allowed the definition of a ‘pseudo-friction factor’ applicable in the wet stack and operable across the water annular flow/entrained air core interface to allow combined discharge flows and their effect on airentrainment to be modelled.The propagation of air pressure transients in building drainage and vent systems is defined by the St Venant equations of continuity and momentum [9],(1)(2)These quasi-linear hyperbolic partial differential equations are amenable to finite difference solution once transformed via the Method of Characteristics into finite difference relationships, Eqs. (3)–(6), that link conditions at a node one time step in the future to current conditions at adjacent upstream and downstream nodes, Fig. 2.Fig.2. St Venant equations of continuity and momentum allow airflow velocity and wave speed to bepredicted on an x-t grid as shown. Note , .For the C+ characteristic:(3)when(4)and the C- characteristic:(5)when(6)where the wave speed c is given byc=(γp/ρ)0.5. (7) These equations involve the air mean flow velocity, u, and the local wave speed, c, due to the interdependence of air pressure and density. Local pressure is calculated as(8)Suitable equations link local pressure to airflow or to the interface oscillation of trap seals.The case of the appliance trap seal is of particular importance. The trap seal water column oscillates under the action of the applied pressure differential between the transients in the network and the room air pressure. The equation of motion for the U-bend trap seal water column may be written at any time as(9)It should be recognized that while the water column may rise on the appliance side, conversely on the system side it can never exceed a datum level drawn at the branch connection.In practical terms trap seals are set at 75 or 50 mm in the UK and other international standards dependent upon appliance type. Trap seal retention is therefore defined as a depth less than the initial value. Many standards, recognizing the transient nature of trap seal depletion and the opportunity that exists for re-charge on appliance discharge allow 25% depletion.The boundary equation may also be determined by local conditions: the AAV opening and subsequent loss coefficient depends on the local line pressure prediction.Empirical data identifies the AAV opening pressure, its loss coefficient during opening and at the fully open condition. Appliance trap seal oscillation is treated as a boundary condition dependent on local pressure. Deflection of the trap seal to allow an airpath to,or from, the appliance or displacement leading to oscillation alone may both be modelled. Reductions in trap seal water mass during the transient interaction must also be included.3. Role of diversity in system operationIn complex building drainage networks the operation of the system appliances to discharge water to the network, and hence provide the conditions necessary for air entrainment and pressure transient propagation, is entirely random. No two systems will be identical in terms of their usage at any time. This diversity of operation implies that inter-stack venting paths will be established if the individual stacks within a complex building network are themselves interconnected. It is proposed that this diversity is utilized to provide venting and to allow serious consideration to be given to sealed drainage systems.In order to fully implement a sealed building drainage and vent system it would be necessary for the negative transients to be alleviated by drawing air into the network from a secure space andnot from the external atmosphere. This may be achieved by the use of air admittance valves or at a predetermined location within the building, for example an accessible loft space.Similarly, it would be necessary to attenuate positive air pressure transients by means of PAPA devices. Initially it might be considered that this would be problematic as positive pressure could build within the PAPA installations and therefore negate their ability to absorb transient airflows. This may again be avoided by linking the vertical stacks in a complex building and utilizing the diversity of use inherent in building drainage systems as this will ensure that PAPA pressures are themselves alleviated by allowing trapped air to vent through the interconnected stacks to the sewer network.Diversity also protects the proposed sealed system from sewer driven overpressure and positive transients. A complex building will be interconnected to the main sewer network via a number of connecting smaller bore drains. Adverse pressure conditions will be distributed and the network interconnection will continue to provide venting routes.These concepts will be demonstrated by a multi-stack network.4. Simulation of the operation of a multi-stack sealed building drainage and vent systemFig. 3 illustrates a four-stack network. The four stacks are linked at high level by a manifold leading to a PAPA and AAV installation. Water downflows in any stack generate negative transients that deflate the PAPA and open the AAV to provide an airflow into the network and out to the sewer system. Positive pressure generated by either stack surcharge or sewer transients are attenuated by the PAPA and by the diversity of use that allows one stack-to-sewer route to act as a relief route for the other stacks.The network illustrated has an overall height of 12m. Pressure transients generated within thenetwork will propagate at the acoustic velocity in air . This implies pipe periods, from stack base to PAPA of approximately 0.08s and from stack base to stack base of approximately 0.15s.In order to simplify the output from the simulation no local trap seal protection is included—for example the traps could be fitted with either or both an AAV and PAPA as examples of active control. Traditional networks would of course include passive venting where separate vent stacks would be provided to atmosphere, however a sealed building would dispense with this venting arrangement.Fig.3.Four stack building drainage and vent system to demonstrate the viability of a sealed building system.Ideally the four sewer connections shown should be to separate collection drains so that diversity in the sewer network also acts to aid system self venting. In a complex building this requirement would not be arduous and would in all probability be the norm. It is envisagedthat the stack connections to the sewer network would be distributed and would be to a below ground drainage network that increased in diameter downstream. Other connections to the network would in all probability be from buildings that included the more traditional open vent system design so that a further level of diversity is added to offset any downstream sewer surcharge events of long duration. Similar considerations led to the current design guidance for dwellings.It is stressed that the network illustrated is representative of complex building drainage networks. The simulation will allow a range of appliance discharge and sewer imposed transient conditions to be investigated.The following appliance discharges and imposed sewer transients are considered:1. w.c. discharge to stacks 1–3 over a period 1–6s and a separate w.c. discharge to stack 4 between 2 and 7s.2. A minimum water flow in each stack continues throughout the simulation, set at 0.1L/s, to represent trailing water following earlier multiple appliance discharges.3. A 1s duration stack base surcharge event is assumed to occur in stack 1 at 2.5s.4. Sequential sewer transients imposed at the base of each stack in turn for 1.5s from 12 to 18s.The simulation will demonstrate the efficacy of both the concept of active surge control and inter-stack venting in enabling the system to be sealed, i.e. to have no high level roof penetrations and no vent stacks open to atmosphere outside the building envelope.The imposed water flows within the network are based on ‘real’ system values, being representative of current w.c. discharge characteristics in terms of peak flow, 2l/s, overall volume, 6l, and duration, 6s. The sewer transients at 30mm water gauge are representative but not excessive. Table 1 defines the w.c. discharge and sewer pressure profiles assumed.Table1. w.c. discharge and imposed sewer pressure characteristicsw.c. discharge characteristic Imposed sewer transient at stack baseTime Discharge flow Time PressureSeconds l/s Seconds Water gauge (mm)Start time 0.0 Start time 0.0+2 2.0 +0.5 30.0+4 2.0 +0.5 30.0+6 0.0 +0.5 0.05. Simulation conventionsIt should be noted that heights for the system stacks are measured positive upwards from the stack base in each case. This implies that entrained airflow towards the stack base is negative. Airflow entering the network from any AAVs installed will therefore be indicated as negative. Airflow exiting the network to the sewer connection will be negative.Airflow entering the network from the sewer connection or induced to flow up any stack will be positive.Water downflow in a vertical is however regarded as positive.Observing these conventions will allow the following simulation to be better understood.6. Water discharge to the networkTable 1 illustrates the w.c. discharges described above, simultaneous from 1s to stacks 1–3 and from 2s to stack 4. A base of stack surcharge is assumed in stack 1 from 2.5 to 3s. As a result it will be seen from Fig. 4 that entrained air downflows are established in pipes 1, 6 and 14 asexpected. However, the entrained airflow in pipe 19 is into the network from the sewer. Initially, as there is only a trickle water flow in pipe 19, the entrained airflow in pipe 19 due to the w.c. discharges already being carried by pipes 1, 6 and 14, is reversed, i.e. up the stack, and contributes to the entrained airflow demand in pipes 1, 6 and 14. The AAV on pipe 12 also contributes but initially this is a small proportion of the required airflow and the AAV flutters in response to local pressure conditions.Fig.4.Entrained airflows during appliance discharge.Following the w.c. discharge to stack 4 that establishes a water downflow in pipe 19 from 2 s onwards, the reversed airflow initially established diminishes due to the traction applied by the falling water film in that pipe. However, the suction pressures developed in the other three stacks still results in a continuing but reduced reversed airflow in pipe 19. As the water downflow in pipe 19 reaches its maximum value from 3 s onwards, the AAV on pipe 12 opens fully and an increased airflow from this source may be identified. The flutter stage is replaced by a fully open period from 3.5 to 5.5 s.Fig. 5 illustrates the air pressure profile from the stack base in both stacks 1 and 4 at 2.5 s into the simulation. The air pressure in stack 4 demonstrates a pressure gradient compatible with the reversed airflow mentioned above. The air pressure profile in stack 1 is typical for a stack carrying an annular water downflow and demonstrates the establishment of a positive backpressure due to the water curtain at the base of the stack.Fig.5.Air pressure profile in stacks 1 and 4 illustrating the pressure gradient driving the reversed airflow in pipe 19.The initial collapsed volume of the PAPA installed on pipe 13 was 0.4l, with a fully expanded volume of 40l, however due to its small initial volume it may be regarded as collapsed during this phase of the simulation.7. Surcharge at base of stack 1Fig. 6 indicates a surcharge at the base of stack 1, pipe 1 from 2.5 to 3 s. The entrained airflow in pipe 1 reduces to zero at the stack base and a pressure transient is generated within that stack, Fig.6. The impact of this transient will also be seen later in a discussion of the trap seal responses for the network.Fig.6.Air pressure levels within the network during the w.c. discharge phase of the simulation. Note surcharge at base stack 1, pipe 1 at 2.5s.It will also be seen, Fig. 6, that the predicted pressure at the base of pipes 1, 6 and 14, in the absence of surcharge, conform to that normally expected, namely a small positive back pressure as the entrained air is forced through the water curtain at the base of the stack and into the sewer. In the case of stack 4, pipe 19, the reversed airflow drawn into the stack demonstrates a pressure drop as it traverses the water curtain present at that stack base.The simulation allows the air pressure profiles up stack 1 to be modelled during,and following, the surcharge illustrated in Fig. 6. Fig. 7(a) and (b) illustrate the air pressure profiles in the stack from 2.0 to 3.0 s, the increasing and decreasing phases of the transient propagation being presented sequentially. The traces illustrate the propagation of the positive transient up the stack as well as the pressure oscillations derived from the reflection of the transient at the stack termination at the AAV/PAPA junction at the upper end of pipe 11.Fig.7.(a) Sequential air pressure profiles in stack 1 during initial phase of stack base surcharge. (b) Sequential air pressure profiles in stack 1 during final phase of stack base surcharge.8. Sewer imposed transientsTable 2 illustrates the imposition of a series of sequential sewer transients at the base of eachstack. Fig. 8 demonstrates a pattern that indicates the operation of both the PAPA installed on pipe 13 and the self-venting provided by stack interconnection.Fig.8.Entraind airflows as a result of sewer imposed pressure transients.As the positive pressure is imposed at the base of pipe 1 at 12 s, airflow is driven up stack 1 towards the PAPA connection. However, as the base of the other stacks have not a yet had positive sewer pressure levels imposed, a secondary airflow path is established downwards to the sewer connection in each of stacks 2–4, as shown by the negative airflows in Fig. 8.As the imposed transient abates so the reversed flow reduces and the PAPA discharges air to the network, again demonstrated by the simulation, Fig. 8. This pattern repeats as each of the stacks is subjected to a sewer transient.Fig. 9 illustrates typical air pressure profiles in stacks 1 and 2. The pressure gradient in stack 2 confirms the airflow direction up the stack towards the AAV/PAPA junction. It will be seen that pressure continues to decrease down stack 1 until it recovers, pipes 1 and 3, due to the effect of the continuing waterflow in those pipes.The PAPA installation reacts to the sewer transients by absorbing airflow, Fig. 10. The PAPA will expand until the accumulated air inflow reaches its assumed 40 l volume. At that point the PAPA will pressurize and will assist the airflow out of the network via the stacks unaffected by the imposed positive sewer transient. Note that as the sewer transient is applied sequentially from stacks 1–4 this pattern is repeated. The volume of the high level PAPA, together with any others introduced into a more complex network, could be adapted to ensure that no system pressurization occurred.Fig.9.Air pressure profile in stack 1 and 2 during the sewer imposed transient in stack 2, 15s into the simulation.Fig.10.PAPA volume and AAV throughflow during simulation.The effect of sequential transients at each of the stacks is identifiable as the PAPA volume decreases between transients due to the entrained airflow maintained by the residual water flows in each stack.9. Trap seal oscillation and retentionThe appliance traps connected to the network monitor and respond to the local branch air pressures. The model provides a simulation of trap seal deflection, as well as final retention. Fig. 11(a,b) present the trap seal oscillations for one trap on each of the stacks 1 and 2, respectively. As the air pressure falls in the network, the water column in the trap is displaced so that the appliance side water level falls. However, the system side level is governed by the level of the branch entry connection so that water is lost to the network. This effect is illustrated in both Fig. 11(a) and (b).Transient conditions in the network result in trap seal oscillation, however at the end of the event the trap seal will have lost water that can only be replenished by the next appliance usage. If the transient effects are severe than the trap may become totally depleted allowing a potential cross contamination route from the network to habitable space. Fig. 11(a) and (b) illustrate the trap seal retention at the end of the imposed network transients.Fig.11.(a) Trap seal oscillation, trap 2. (b) Trap seal oscillation, trap 7.Fig. 11(a), representing the trap on pipe 2, illustrates the expected induced siphonage of trap seal water into the network as the stack pressure falls. The surcharge event in stack 1 interrupts this process at 2s. The trap oscillations abate following the cessation of water downflow in stack 1. The imposition of a sewer transient is apparent at 12s by the water surface level rising in the appliance side of the trap. A more severe transient could ha ve resulted in ‘bubbling through’ at this stage if the trap system side water surface level fell to the lowest point of the U-bend.The trap seal oscillations for traps on pipes 7, Fig. 11(b) and 15, are identical to each other until the sequential imposition of sewer transients at 14 and 16s. Note that thesurcharge in pipe 1 does not affect these traps as they are remote from the base of stack 1. The trap on pipe 20 displays an initial reduction in pressure due to the delay in applied water downflow. The sewer transient in pipe 19 affects this trap at around 18s.As a result of the pressure transients arriving at each trap during the simulation there will be a loss of trap seal water. This overall effect results in each trap displaying an individual water seal retention that depends entirely on the usage of the network. Trap 2 retains 32mm water seal while traps 7 and 15 retain 33mm. Trap 20 is reduced to 26mm water seal. Note that the traps on pipes 7 and 15 were exposed to the same levels of transient pressure despite the time difference in arrival of the sewer transients. Fig. 11(a) and (b) illustrate the oscillations of the trap seal column as a result of the solution of the trap seal boundary condition, Eq. (10), with the appropriate C+ characteristic. This boundary condition solution continually monitors the water loss from the trap and at the end of the event yields a trap seal retention value. In the example illustrated the initial trap seal values were taken as 50mm of water, common for appliances such as w.c.'s and sinks.10. Conclusion—viability of a sealed building drainage and vent systemThe simulation presented confirms that a sealed building drainage system utilizing active transient control would be a viable design option. A sealed building drainage system would offer the following advantages:• System s ecurity would be immeasurably enhanced as all high-level open system terminations would be redundant.• System complexity would be reduced while system predictability would increase.• Space and material savings would be achieved within the construction ph ase of any installation.These benefits would be realized provided that active transient control and suppression was incorporated into the design in the form of both AAV to suppress negative transients and variable volume containment devices (PAPA) to control positive transients.The diversity inherent in the operation of both building drainage and vent systems and the sewers connected to the building have a role in providing interconnected relief paths as part of the system solution.The method of characteristics based finite difference simulation presented has provided output consistent with expectations for the operation of the sealed system studied. The accuracy of the simulation in other recent applications, including the accurate corroboration of the SARS spread mechanism within the Amoy Gardens complex in Hong Kong in 2003, provides a confidence level in the results presented.。
Effectiveness of different kinds of irrigation and drainage projects on reducingpollutants from agricultural drainageCuiling Jiang Liqin Zhu Xiangqian Xie Ning Li Ning ShiState Key Laboratory of Hydrology-Water Resources and Hydraulic EngineeringHohai UniversityNanjing 210098, P . R. China cljianghhu@Abstract —Four different kinds of irrigation anddrainage projects—the concrete ditch, brick ditch, soil ditch and pond were constructed to study the removal capacity of nutrients from agricu l tura l drainage. Experimental results showed that the highest pollutants concentrations in ditches and pond occurred in July and November, associated with fertil izer appl ication, wheat or rice straw returning, rainfall and cropland drainage. The most seriously polluted water occurred in concrete ditch, with the highest concentrations of total nitrogen (TN), total phosphorus (TP), chemical oxygen demand (COD Mn ) and ammonia nitrogen (NH 3-N). The secondly polluted water was in the pond grown over with weeds. Water in soil and brick ditches was lower polluted. The soil and brick ditches had high abil ity to absorb and purify non-point source poll utants. But compared with the brick ditch, the overgrowing weeds in soi ditch were difficu t to be harvested and cou d spread the seeds to paddy fie l d. Therefore, the brick ditch is recommended to be bui l t and app l ied wide ly in irrigation and drainage area in order to reduce water pol utants in catchments, to control weed infestation, and to prevent the secondary pollution of aquatic plants after death in autumn and winter.Keywords-irriga ion and drainage projec s; non-poinsource pollutants; ditches; pondINTRODUCTIONIrrigation and drainage projects with the function of flood control and waterlogging reduction were the main components of agricultural ecosystem. Though the construction size was small, they had a large number and distribute widely [1]. With the popularization and application of modern science and technology in agriculture and countryside, many concrete irrigation and drainage projects with high standards were built [2]. It promoted the development of agriculture, and at the same time, resulted in the negative effects. irstly, the concrete irrigation channel with a low roughness and high flow velocity reduced the retention and degradation time of pollutants. Concrete ditch decreased the absorptive capacity of nutrients from farmland. Secondly, concrete ditch restricted the growth of aquatic plants and caused the decrease of biomass and biodiversity [3-5].Surface water pollution caused by non-point source pollutants in China accounted for a significant proportion [6]. Half of the pollutants were from ruraldiffuse source in eutrophicated lakes of eastern China [7]. For example, 77% total nitrogen (TN) and 33.4% total phosphorus (TP) in Taihu lake came from agricultural non-point source [8-9]. It was caused mainly by the applying of fertilizers and pesticides [10-17]. However, the construction of irrigation and drainage projects was also one of the factors to deteriorate surface water quality due to the weakened capability of absorption and decomposition of pollutants in artificial ditches. At present, people had paid little attention to the effect of irrigation and drainage projects on agricultural ecological environment [2], and few researches were about the relationship between irrigation and drainage projects and agricultural non-point source pollution. The objectives of this study were to explore the function of different kinds of irrigation and drainage projects on the purification of agricultural non-point source pollutants, and to investigate the effects of lined ditch on agricultural ecosystem and continued biological progress.MATERIALS AND METHODS The experimental site ˄31°20´40"N ˈ119°09´32"E ˅ was located in Yaxi Town, Gaochun County of Nanjing. Three different kinds of ditches 40m in average length and 1.2m in average width were built in 0.33hm 2 paddy field in July, 2006. They were lined concrete ditch, brick ditch and soil ditch, respectively (Fig.1). Agricultural drainages from each ditch were led to a river by culverts. Three ditches divided the field averagely into four plots with 0.08hm 2 area in each. Near the soil ditch, there was a 600m 2 pond covered with aquatic plants in a density of 100% in growing seasons.During the period of September 2006 to November 2007, triplicate water samples were collected at 3 months intervals from each of three sampling ditches and pond. Concentrations of TP , TN, COD Mn (Chemical Oxygen Demand), NO 3--N and NH 4+-N were analyzed to estimate the removal and purification abilities of agricultural non-point source pollutants by different kinds of irrigation and drainage projects. The densities of plants grown in ditches and pond were detected, and the species were identified.Wheat and rice were grown in rotation in field. The wheat growing season was from October 25th to May 20th of the next year and the rice was from June 15th to October 15th. Wheat and rice straws were returned to the soil after harvest. There were 649 kg/hm2 of N and 174 kg/hm2of P in every year used on the croplands (Table 1).Fig. 1 Sketch of experimental siteTable 1. Fertilizers used in croplands˄kg/hm2˅Wheat Rice Fertilizerapplicationtime urea 1˅compoundfertilizer 2˅ammoniabicarbonate3˅Fertilizerapplicationtime ureacompoundfertilizerammoniabicarbonateOctober375 750 June 375 750 January 262.5 July 225 225August 187.5 Total 262.5 375 750 225 787.5 7501˅˖45% N in urea2˅˖15% N and 15% P in compound fertilize3˅˖17% N in ammonia bicarbonateChemical analyses were conducted based on standard methodology (China Standard Press, 1998). TN was determined by alkaline potassium persulfate digestion-UV spectrophotometer method. NH4+-N was analyzed using Nessler’s reagent colorimetric method, and NO3--N concentration was measured using spectrophotometer with phenol disulfonic acid. TP was determined by ammonium molybdate spectrophotometer method. The COD Mn concentrations were analyzed by permanganate index method.RESULTS AND DISCUSSION(1) TNThe concentrations of TN ranged from 1.50 to 103.15mg/L in concrete ditch, 0.85 to 35.31mg/L in pond, 0.08 to 13.79mg/L in soil ditch and 0.10 to 11.28mg/L in brick ditch (ig.2). The lowest concentration in each ditch appeared in September 2006. The highest concentration in each ditch occurred in November 2006. It was as high as 103.15mg/L TN in concrete ditch, 51 times higherthan the V-class water quality standard according tothe Surface Water Quality Standards of China, GB3838-2002. The seriously pollution of TN in ditches and pond was related to the continuous rainfall after half month of the application of 184kg/hm2 nitrogen and 56 kg/hm2 phosphorus in the wheat field on 25th October. Above result showed that TN concentrations in ditches and pond varied with rainfall and fertilizer utilization. The concrete ditch accumulated higher concentration TN compared with soil and brick ditches.(2) NH3-NThe highest NH3-N concentrations in different water bodies beyond the -class water quality standard occurred in July 2007 (F ig.3). NH3-N concentration was as high as 14.3mg/L in the pond. The application of base and topdressing fertilizers and the decomposition of returning straw of wheat resulted in the release of ammonia in July. NH3-N concentrations ranged from 2.21 to 6.27mg/L in the concrete ditch, which were higher than that in the others except in the pond in July.Fig.2 Temporal variations of TN concentrations indifferent water bodies3in different water bodies(3) NO3--NThe highest NO3--N concentrations in different waters occurred in November 2006, just as TN. They were all lower than 2mg/L in other seasons (F ig.4).The order of NO3--N concentrations from large to small was in the soil ditch, in the brick ditch, in the pond and in the concrete ditch, just opposite to the order of TN and NH3-N. Therefore, nitrogen was decomposed and oxygenized more easily in soil ditch than in the others.(4) TPPhosphorus in ditches was originated from compound fertilizer applied in the cropland and decomposition of plants residues. The highest TP concentrations in different water bodies appeared in July 2007 (F ig.5). TP was obviously higher and varied more largely in the concrete ditch than in the others. It exceeded the -class water quality standard (0.4mg/L) in September 2006, July 2007 and September 2007. However, TP concentrations were entirely below the-class standard level over the whole year in other waters.Above phenomenon indicated that phosphorus was drained more easily from farmland to ditches and ponds in wet season than in dry season. The concrete ditch with poor absorbing and transforming ability of phosphorus resulted in the high concentration and the large possibility of pollution to the surface water. However, the soil and brick ditches with porous matrix were helpful for pollutants absorbing and3in different water bodiesFig.5 Temporal variations of TP concentrationsin different water bodies (5) COD Mn COD Mn concentration in each kind of water body was highest in July 2007 when the paddy was just in young seedling period (ig.6), which exceeded the -class water quality standard (15mg/L). After wheat harvested and straw returned into field, organic matter was decomposed and released under the following submerged condition. In water of paddy field, COD Mn concentration achieved to 23.1mg/L. The concrete ditch accumulated higher COD Mn than Mn in different water bodies(6) Aquatic PlantsIn rice growing season, Lept ochloa chinensis andMonochoria vaginalis were two of main kinds ofweed growing in the soil ditch, and covered morethan 95% of its surface. Besides, Monochoriavaginalis , Fimbristylis dichotoma , Cyperus difformis ,Al ernan hera philoxeroides and Najas minor , etc were found. Aquatic animals seldom lived in the soilditch because of the high coverage degree of plants.There were Lep ochloa chinensis , Monochoriavaginalis , Monochoria vaginalis , Cyperus difformis ,Hydrilla ver icilla a , Spirogyra communis , Lemnaminor , etc living in the slots and sediment of thebrick ditch. Though with low density of about 10individual plants per square meter, the brick ditch hadhigh biodiversity. Some aquatic animals such as smallfry, leeches and frogs were found in it.There were seldom root plants survived in theconcrete ditch. Only a little amount of floating vegetation such as Spirogyra communis andSpirodela polyrhiza existed in it. What’s more,several leeches and snails attached on the bank.The pond was filled with Alternanthera philoxeroides and Polygonum hydropiper . Theycovered nearly 100% of the water surface, which made the aquatic animals hardly survive in it. CONCLUSIONSThe highest pollutants concentrations in ditchesand pond occurred in July and November, associated with fertilizer application, wheat or rice straw returning and rainfall and cropland drainage. In last of June and middle of July, 319kg/hm 2 N and 90kg/hm 2 P as base and topdressing fertilizers were usedin paddy field (Table 1). In the last of October, 184 kg/hm 2 N and 56 kg/hm 2 P were applied in wheatfield as base fertilizer. July and November were alsothe decomposition period of returning straws. Theagricultural drainage and rainfall caused the discharge of nutrients from farmland and resulted in the degradation of water quality in ditches and pond. The concentrations of TN, NH 3-N, TP , COD Mn in the concrete ditch were higher obviously than that in the brick ditch, soil ditch and pond because of the lack of aquatic plants and porous matrix that were helpful to the decomposition and transformation of non-point source pollutants. The pond was almost no aquatic animals because of the 100% coverage of water surface by the aquaticplants. In autumn and winter, plants died and decomposed, and then the nutrients were released. The concentrations of TN, NH 3-N, TP , COD Mn in pond were lower than that in concrete ditch and higher than in soil and brick ditches. Most of pollutants concentrations in the soil and brick ditches were lower than the others and only the NO 3--N in November 2006 was high due to the easily transformation of TN and ammonium [18]. To sum up, the soil and brick ditches were polluted not as seriously as concrete ditches because of thegreat capability to absorb and transform non-point source pollutants. There were many species and high density of plants in soil ditch. But the great coverage of plants influenced the survival of aquatic animals such as fry, frogs and snails, and caused the lack of aquatic animals. Lep t ochloa chinensis and Monochoria vaginalis flourished in soil ditch were also two of major indigenous weeds in rice field. The high growth density of them made the soil ditch become the spread source of the weed seeds and washarmful to rice [19]. In autumn, weeds harvested difficultly. When they died and started to decompose, the nutrients would be released and deteriorated the water quality. Comparatively, in spite of not having large biomass of plants and animals in the brick ditch, the species of plants and animals grown in it were plentiful and the ecosystem were steady [20-21]. Furthermore, the brick ditch cost lower in construction and managed easily, it can reduce the leaking of water. Therefore, compared to soil and concrete ditches, the brick ditch is worthy of popularized and applied in irrigation regions.ACKNOWLEDGEMENT This study was supported by the National NaturalScience Foundation of China (No. 50579018).REFERENCES[1] Chen Ping, Liu Zheng-xiang, Jiang Xiao-hong,“Discussion on harmoniousdevelopments of irrigation and drainage engineering and ecological system”, China RuralWater and Hydropower 2004, (6): 1-4 (inChinese)[2] Cai Yong,F an Jun-jiang, “Rural waterconservancy modernization in Jiangsu province based on sustainable development”,China Rural Water and Hydropower, 2001,(11): 5-7 (in Chinese)[3] Liu Rui-huang, Chen Yi-chang, Zhang Song-lin,“The method of ecological conservation inTaiwan farm land consolidation”, Research ofSoil and Water Conservation, 2001, 8(4):100-105 (in Chinese)[4] Dong Zhe-ren, “Stress of hydraulic engineeringon ecosystem”,Water Resources and Hydropower , 2003, (7): 1-5 (in Chinese)[5] Chen Yi-chang, Zhang Jun-bin, Yan Zheng-ping,“Study on ditches and ecological engineering inTaiwan farmland”, Research of Soil and WaterConservation, 2001, 8(4): 53-59 (in Chinese)[6] Si you-bin, Wang Shen-qiang, Chen Huai-man,“The loss of nitrogen and phosphorus infarmland and water eutrophication”, Soils, 2000,(4): 188-193 (in Chinese)[7] Yin Cheng-qing, Mao Zhan-po, “Non-pointpollution control for rural areas of China withecological engineering technologies”, ChineseJournal of Applied Ecology, 2002, 13(2):229-232 (in Chinese)[8] Fan Cheng-xin, “The countermeasure research onburthen of non-point source pollution in TaihuLake”, Journal of Hohai University, 1996, 24,Qceanologia et Liminologia Special Issue, 64-69(in Chinese)[9] Gao Chao, Zhu Jian-guo , Dou Yi-jian,“Contribution of agricultural non-pointsource pollution”, Resources and environment inthe yangtza basin, 2002, 11(3): 260-263 (in Chinese)[10] Chen Li-ding, F u Bo-jie, “F arm ecosystemmanagement and control ofnon-point source pollution”, EnvironmentalScience, 2000, (2): 98-100 (in Chinese)[11] Zhu Tie-qun, “Prevention and control of waterpollution caused by agricultural non-pointsources in China”, Journal of Ecology and RuralEnvironment, 2000, 16(3): 55-57 (in Chinese)[12] M. Borin, G. Bonaiti and L. Giardini.“Controlled drainage and wetlands to reduceagricultural pollution”, Alysimetric Study. J.Environ. Qual., 2001, 30: 1330-1340[13] G. M. Chescheir, R. W. Skaggs and J. W. Gilliam,“Evaluation of wetland buffer areas fortreatment of pumped agricultural drainagewater”, Transactions of the American Society ofAgricultural Engineers, 1992, 35: 175-182[14] T. C. Jacobs and J. M. Gilliam, “Riparian lossesof nitrate from agricultural drainage waters”,J.Environ. Qual., 1985, 14: 472-478[15] B.C. Braskerud, “Reducing Nonpoint SourcePollution Through Collaboration: Policies andPrograms Across the U.S. States ”, EcologicalEngineering, 2002,18: 351-370[16] L. Nguyen, J. Sukias, “ Phosphorus fractionsand retention in drainage ditch sedimentsreceiving surface runoff and subsurface drainagefrom agricultural catchments in the North Island,New Zealand”, Agriculture, Ecosystems andEnvironment, 2002, 92: 49-69[17] G. D. Agrawal, “Diffuse agricultural waterpollution in India”, Wat. Sci. Tech. 1999, 39(3):33-47[18] Lu Bing-you, Wang Ru-song, Zhang Ren-wu,“Relationship between populations diversity andits mcro-environments in farmland ecosystemevaluation for diversity of several farmlandsecosystems”, Chinese Journal of Ecology, 2001,20(2): 5- 7 (in Chinese)[19] Zuo Ran-ling, Qiang Sheng, Li Ru-hai,“Relationship between weed seeds dispersed by irrigation water and soil weedseed-bank of paddy field in rice-growing region”,Chinese Journal of Rice Science, 2007,21(4):417-424 (in Chinese)[20] J. P. T. Dalsgaard, C. Lightfoot, V. Christensen,“Towards quantification of ecologicalsustainability in farming systems analysis”,Ecological Engineering, 1995, 4: 181-189[21] S. E. Jørgensen, S. N. Nielsen, “Application ofecological engineering principles in agriculture”,Ecological Engineering, 1996, 7: 373-381。

《给水排水专业英语》译文:(第一课)给水工程我们知道,水的供应对生命的生存至关重要。
人类需要喝水,动物需要喝水,植物也需要喝水。
社会的基本功能需要水:公共卫生设施的冲洗,工业生产过程耗水,电能生产过程的冷却用水。
在这里,我们从两方面讨论水的供给:)1、地下水供给2、地表水供给地下水是通过打井而得到的重要直接供水水源,也是一种重要的间接供水水源,因为地表溪流(或小河)会经常得到地下水的补给。
在靠近地表的通气层中,土壤孔隙内同时包含着空气和水。
这一地层,其厚度在沼泽地可能为零,在山区则可能厚达数百英尺,蕴涵三种类型的水分。
重力水,是在暴雨过后进入较大的土壤孔隙中的水。
毛细水是在毛细作用下进入较小的土壤孔隙中的水,它能够被植物吸收。
吸湿水是在不是最干燥的气候条件下由于分子间引力而被土壤稳定下来的水。
地表通气层的湿气是不能通过凿井方式作为供水水源的。
位于通气层以下的饱和层,土壤孔隙中充满着水,这就是我们通常所说的地下水。
包含大量地下水的地层称为含水层。
通气层和含水层之间的水面称为地下水位或浅层地下水面,地下水静压力与大气压力相等。
含水层可延伸相当深度), but because the weight of overburden material generally closes pore spaces(但因为地层负荷过重会压缩(封闭、关闭)土壤孔隙,深度超过600m,即2000英寸,就基本找不到地下水了。
能够含水层中自由流出的水量称为单位产水量。
The flow of water out of a soil can be illustrated using Figure 1(土壤中水流如图1所示). The flow rate must be proportional to the area through which flow occurs times the velocity(流量与流水面积成比例,流经该土壤面积的流量等于面积与速率成的乘积), orQ=AvWhere(此式中)Q=flow rate , in m3/sec(流量,单位为m3/s)【cubic meter per second】A=area of porous material through which flow occurs, in m2(渗透性土壤的流水断面,单位为m2)v=superficial velocity, in m/sec(表观流速(表面流速),单位为m/s)表观流速当然不是水在土壤中流动的真实速度,因为土壤固体颗粒所占据的体积大大地降低了水流通过的空间。
附录C:外文文献及其译文外文文献:Removal of Pharmaceuticals during Drinking Water Treatment The elimination of selected pharmaceuticals (bezafibrate, clofibric acid, carbamazepine, diclofenac) during drinking water treatment processes was investigated at lab and pilot scale and in real waterworks. No significant removal of pharmaceuticals was observed in batch experiments with sand under natural aerobic and anoxic conditions, thus indicating low sorption properties and high persistence with nonadapted microorganisms. These results were underscored by the presence of carbamazepine in bankfiltrated water with anaerobic conditions in a waterworks area. Flocculation using iron(III) chloride in lab-scale experiments (Jar test) and investigations in waterworks exhibited no significant elimination of the selected target pharmaceuticals. However, ozonation was in some cases very effective in eliminating these polar compounds. In labscale experiments, 0.5 mg/L ozone was shown to reduce the concentrations of diclofenac and carbamazepine by more than 90%, while bezafibrate was eliminated by 50% with a 1.5 mg/L ozone dose. Clofibric acid was stable even at 3 mg/L ozone. Under waterworks conditions, similar removal efficiencies were observed. In addition to ozonation, filtration with granular activated carbon (GAC) was very effective in removing pharmaceuticals. Except for clofibric acid, GAC in pilot-scale experiments and waterworks provided a major elimination of the pharmaceuticals under investigation.IntroductionIn Germany, some pharmaceuticals are used in quantities of more than 100 t/yr (1). Pharmacokinetic studies exhibit that an appreciable proportion of the administered pharmaceuticals are excreted via feces and urine (2) and thus are present in the domestic wastewater. A further source for the contamination of wastewater is assumed to be the disposal of (expired) medicine via toilets. However, this portion is very difficult to estimate because reliable data are not available. After passing through sewage treatment plants (STPs), pharmaceutical residues enter receiving waters. Point discharges from pharmaceutical manufacturers can also contribute to contamination of rivers and creeks (3). First results concerning environmental occurrence of pharma-ceuticals are reported by Garrison et al. (4) and Hignite and Azarnoff (5), who detected clofibric acid in the lower micrograms per liter range in treated sewage in the United States. Further studies in 1981 in Great Britain revealed that pharmaceuticals are present in rivers up to 1 íg/L (6). On Iona Island (Vancouver, Canada) Rogers et al. (7) identified the two antiphlogistics ibuprofen and naproxen in waste-water. Recent investigations showed the exposure of a wide range of pharmaceuticals from many medicinal classes (e.g,betablockers, sympathomimetics, antiphlogistics, lipid regu-lators, antiepileptics, antibiotics, vasodilators) to rivers and creeks. Reviews from Halling-Sørensen et al. (8), Daughton and Ternes (9), and Jørgensen et al. (10) summarize most of the literature in this new emerging field about the environ-mental relevance of pharmaceuticals.Furthermore, Mohle et al. (11), Alder et al. (12), Ternes et al. (3), and Zuccato et al. (13) have reported the identification of pharmaceuticals in the aquatic environment.Contamination is influenced by the relative portions of raw and treated wastewater (14) such that even small rivers and creeks can be highly contaminated. Groundwater is contaminated with pharmaceuticals primarily by infiltration of surface water containing pharmaceutical residues as well as by leaks in landfill sites and sewer drains. Because of the widespread occurrence of pharmaceuticals in the aquatic environment and sometimes also in the raw water of waterworks, a few cases surfaced where pharmaceuticals were detected in drinking water in the lower nanograms per liter range (15, 16). Although up to now no adverse health effects can be attributed to the consumption of pharmaceuticals at these low concentration levels, based on precautionary principles, drinking water should be free of such anthro-pogenic contaminants.Currently, few papers have been published dealing with the removal of pharmaceuticals in drinking water treatment. Ozonation and especially advanced oxidation processes seem to be very effective in removal of diclofenac, while clofibric acid and ibuprofen were oxidized in lab-scale experiments mainly by ozone/H2O2 as shown by Zwiener and Frimmel (17). Heberer et al. (18) exhibited that reverse osmosis is appropriate to remove a variety of different pharmaceuticals from highly contaminated surface waters.The objective of the work presented here was to study the efficiency of different treatment steps to remove the anti-phlogistic diclofenac, the antiepileptic carbamazepine, and the lipid regulators clofibric acid and bezafibrate during drinking water treatment. Therefore, the primary elimination of the selected pharmaceuticals was investigated under laboratory, pilot, and real waterworks conditions. In addition to processes such as bank filtration and artificial groundwater recharge, widely used techniques for surface water treatment such as activated carbon filtration, ozonation, and floccula-tion were investigated. The monitoring results of two German waterworks are extended by lab- and pilot-scale experiments to obtain more generalized results.Experimental SectionSelected Pharmaceuticals.For all lab- and pilot-scale spiking experiments, four relevant pharmaceuticals (the antiphlo-gistic diclofenac, the antiepileptic carbamazepine, the lipid regulators clofibric acid and bezafibrate) have been selected as target compounds. Their molecular structures are shown in Table 1. These compounds have been chosen because of their predominant occurrence in German feeding waters for waterworks such as rivers, bank filtrates, and ground-water (14, 19). Additionally, the antiepileptic primidone was included in oxidation experiments and a waterworks survey.TABLE1.Selected Target PharmaceuticalsAnalytical Methods.The determination of the pharma-ceuticals was performed using different analytical methods (see Table 2). All methods were based on a solid-phase extraction of the analytes on to RP-C18 or Lichrolute EN material. After solid-phase extraction (SPE) and an elution step with methanol or acetone, the compounds were derivatized using different agents. Either a methylation with diazomethane (20) or a silylation with a mixture of N,O-bis(trimethylsilyl)acetamide (BSA) and 5% trimethylchlo-rosilane (TMCS) (Fa. Fluka, Buchs, Schweiz) were used (60 min at 120 °C) (21). Carbamazepine was determined aftersilylation either by a mixture of MSTFA/TMSI/DTE(N-methyl-N-(trimethylsilyl) trifluoroacetamide/trimethylsilylim-idazol/dithioerytrit; 1000 íL/2 íL/2 íg) (22) or by a mixture of BSA/TMCS. For primidone, an acetylation by acetanhy-dride and ethanolamine was used (22). In all cases, GC-MS was used for the detection of the analytes. Further details of the methods are reported in refs 19-22.All methods enable the precise determination of the target pharmaceuticals in river water and drinking water. An interlaboratory comparison exercise (ICE) between the three participating laboratories at the beginning and the end of the study confirmed the quality of the analytical methods. Groundwater and surface water samples were spiked with the selected pharmaceuticals and analyzed by all three laboratories to confirm the recoveries of the analytes in the respective matrixes. The mean recovery of the spiked concentrations always exceeded 70% through different spiking levels:0.40-0.90 íg/L in surface water and 0.030-0.20 íg/L in drinking water. The relative standard deviations between the three participating laboratories were in general below 25%. Thus, it could be shown that (i) the difference of found concentrations was minor between the threelaboratories and (ii) the spiked concentration could be detected in the groundwater and surface water accuratel.Limits of Quantification (LOQ) and Calibration.The LOQ was calculated according to the German DIN 32645 (23) with a confidence interval of 99% using the standard deviation of a linear regression curve. Calibration ranges from 0.005 to 0.050 íg/L and from 0.05 to 1 íg/L were used with at least seven concentration levels by spiking groundwater. LOQ is another term for limit of determination (LOD) mentioned in DIN 32645. Since the calculated LOQ values were always between the first and the second calibration points, the LOQ used was setas the second lowest calibration point of the linear correlation to ensure a precise quantification. Hence, the LOQ were at least 20 ng/L for diclofenac, carbamazepine, primidone, and clofibric acid and down to 50 ng/L for bezafibrate. However, with a final volume of 100 íL instead of 1 mL, LOQ down to 2 ng/L were achieved for clofibric acid, primidone, diclofenac, and carbamazepine and down to 10 ng/L for bezafibrate. The calibration was performed over the whole procedure after spiking groundwater with the standard mixture of the selected pharmaceuticals. The calculation of the concentrations in native samples was carried out using surrogate standards (see Table 2) and a linear 7-10 point calibration curve.Reference Standards.The reference standards clofibric acid, bezafibrate, carbamazepine, diclofenac,and primidone as well as the surrogate standards meclofenamic acid and 2,3-dichlorophenoxyacetic acid (2,3-D) were purchased from Sigma, Germany; dihydrocarbamazepine was purchased from Alltech, Germany. All standards were dissolved in methanol (1 mg/mL) and diluted with methanol to the final stock solution of 10 íg/mL.Treatment Processes Used in Waterworks.(a) Study of Biodegradation in Batch Experiments with Native Surface Water, Groundwater, and Different Filter Materials. Bio-degradation is one of the crucial factors that determine the elimination of organic compounds during artificial ground-water recharge and bank filtration. To assess the general biodegradability of pharmaceuticals in aquatic environmental matrixes, batch experiments were carried out according to the OECD guidelines for testing chemicals (24). The inoc-culum used consisted of 400 mL of surface water and 400 mL of groundwater mixed with 2 L of MITI basal medium. The MITI basal medium was prepared by mixing 1 L of sterile deionized water with 3 mL of sterilized solutions A-D. Solution A was a solution of 21.75 g of K2HPO4, 8.5 g of KH2PO4, 44.6 g of Na2HPO4â12H2O, and 1.7 g of NH4Cl in 1000 mL of deionized water at pH 7.2. Solutions B-D were solutions of 22.5 g of MgSO4â7H2O, 27.5 g of CaCl2, and 0.25 g of FeCl3, respectively, in 1000 mL of deionized water. The groundwater was taken from a German water catchment area with artificial groundwater recharge using slow sand filtration and bank filtration. The individual concentrations of bezafibrate, carbamazepine, clofibric acid, diclofenac, and ibuprofen were in the batch experiments adjusted to 0.1 and 100 íg/L. The batch experiments were exposed to either individual or a mixture of the selected pharmaceuticals. In stock solutions with ethanol, the concentrations of the tested pharmaceuticals were 0.5 mg/mL or 0.5 íg/mL, respectively. After being diluted (480 íL of stock solution in 2.4 L of culture solution), the concentration of ethanol in batch cultures was 0.02% (v:v). The cultures were always incubated in the dark for 28 d at 14 °C (in situ temperature). For anoxic conditions, 25 mg/L nitrate was added as an alternative electron acceptor. The bottles used were gastight. For aerobic sorption experi-ments, 400 g of sand or 400 g of gravel taken from the underground of a groundwater catchment area was used as inocculum and mixed with 2 L of MITI basal medium (solid phase/liquid phase ) 1:5). Sand that is also used for the slow sand filters of a waterworks consists of a mean grain size range of 0.2-0.6 mm. This filter material showed a moderate permeability with a K f coefficient of 4.3 10-4 m/s. The gravel (natural aquifer sediment) was very heterogeneous with a predominant fraction of 2-10 mm grain size and a K f coefficient of 2.9 10-3m/s. Sterile controls (sterilization for 1 h) were prepared to differentiate between sorption and microbial degradation. The sand contains 3.2 mg/g iron and 0.056 mg/g manganese. Coatings with iron and manganese hydroxides were detected in the gravel but were not quanti-fied.Esterase activities were measured to control the physi-ological status of microbial communities during the incuba-tion of batch cultures. The hydrolysis of fluorescein diacetate (FDA) by esterase enzymes was determined according to the procedure of Schnu¨rer andRosswall (25). A 20-íL volume of FDA solution (20 mg/10 mL acetone, stored at -18 °C) was mixed with 3 mL of sample and 0.5 mL of HEPES buffer (0.1 M N-2-hydroxyethylpiperazine -N¢-2-ethansulfonic acid so-dium salt in deionized water, adjusted to pH 7.5; Merck). After being incubated (sterile conditions, 90 min at 20 °C, darkness), the fluorescein formation was immediately mea-sured with a Perkin-Elmer fluorescence spectrometer LC (excitation at 480 nm, emission at 505 nm).(b) Flocculation.For flocculation experiments in lab-scale experiments, a noncontinual procedure, the so-called “Jar test”, was performed. Spiking concentrations, stirring velocity, and reaction times were selected according to parameters of the two waterworks monitored in parallel. The lab device used consists of glass beakers (v) 2 L) with stator, a stirrer with standardized stirrer geometry, and defined submerged stirring depths. The stirring velocity was adjusted according to the mean velocity gradient (G value), which is proportional to the introduced energy and thus to the aggregation of colloids (26). Under stirring (rpm: 400 min-1), 0.1 mL of iron(III) chloride solution (40%) was added to 1.8 L of raw water (spiked with 1 ig/L pharmaceuticals). After a stirring time of 1 min, pH 7.5 was attained by adding Ca(OH)2 (1 mol/L). Then, the aggregation to microflocs was achieved by stirring slowly for 20 min under 30 min-1. After sedimentation for 20 min, a sample was taken from under the water surface,and the turbidity was measured. These measurements showed that the turbidity was always below 1.5 turbidity units of formazine (TU/F).(c) Activated Carbon Adsorption.Adsorption Isotherms.For the determination of the adsorption isotherms, the following parameters have been used: (i) 200 mL of deionized water or groundwater spiked with initial concentrations of 100 íg/L of the pharmaceuticals under investigation, (ii) pulverized granular activated carbon based on coal, (iii) quantities of activated carbon varied to achieve a final concentration of the pharmaceuticals in the solution that is at least 2 orders of magnitudes smaller than the initial one, (iv) small portions of activated carbon (<0.2 g/L) added as suspension, (v) batches with activated carbon tumbled in250-mL flasks for 24 h, (vi) finally all samples were filtered with 0.45-ím polycarbonate filter and analyzed according to the analytical method described before. Evaluation of the isotherms was performed in double logarithmic scale ac-cording to Freundlich (27, 28). For a single compound, the Freundlich equation q ) Kc n describes the relation between the loading q of the activated carbon and the equilibrium concentration c in the solution. K and n denote the Freundlich parameters.Operation of a Granulated Activated Carbon(GAC) Ad-sorber in Pilot Scale.A pilot plexiglass filter was operated in down flow mode to investigate the removal of the selected pharmaceuticals by GAC filtration. The empty bed contact time was about 10 min with a flow velocity of 10 m/h. The filter was filled with fresh granular carbon based on coal, which is often used in drinking water facilities. The filter was operated with groundwater from a waterworks, which was before aerated and filtered to remove iron precipitations. The influent was spiked with bezafibrate, carbamazepine, diclofenac, and clofibric acid. The pilot filter was operated for nearly 9 months. In intervals of 14 d, the concentrations of the pharmaceuticals were analyzed in the filter influent, at five different heights and in the final filter effluent at a bed depth of about 160 cm. The mean influent concentrations of the pharmaceuticals were 1.8 íg/L for clofibric acid, 1.0 íg/L for carbamazepine, 0.26íg/L for bezafibrate and 0.04íg/L for diclofenac. The different spiked concentrations were due to the limited solubility of the target compounds in the feeding water.(d) Ozonation.In a lab-scale device, water was ozonated in 2-L glass bottles by bubbling ozone through the samples in order to simulate real waterworks conditions. By varying the bubbling time, definite ozone doses in the range of 0.5-3.0 mg/L were introduced into the water. The water was continuously stirred at 900 rpm min-1. After a reaction time of 20 min, the remaining ozone was quenched by adding sufficient sodium thiosulfate solution (c ) 2.2 g/L) to the sample. To determine the transferred ozone doses as a function of the bubbling time, Milli-Q water was ozonated, and the dissolved ozone was measured (external calibration of the ozone doses) according to DIN 38408 using N,N-diethyl-p-phenylendiamine (DPD) purchased from Sigma, Germany (29). The transferred ozone doses through the system into Milli-Q water was further confirmed by the indigo method (30). Flocculated water of a waterworks was spiked with the selected pharmaceuticals (dissolved in 50 íL of methanol) prior to ozonation. Afterwards the ozone was bubbled through the spiked water sample for specific times corresponding to desired ozone doses. The half-life of ozone in the post-flocculated water was approximately 12 min.Sampling Procedure.Water samples were collected in brown glass bottles that had been prewashed with successive rinses of Milli-Q water and acetone and were dried for 8 h at 250 °C. Samples were either extracted immediately or stored at 4 °C for a maximum period of 3 d.Grab samples of the waterworks were taken before and after crucial treatment processes of two German waterworks with different treatment trains. All cooled water samples (4 °C) were analyzed as soon as possible (latest after 3 d).(e) Treatment Trains of the Selected Waterworks.The following treatment processes were applied in the two waterworks selected in the current study.Waterworks I (WW-I).Pre-ozonation (ozone dose: 0.7-1.0 mg/L; contact time: ca. 3 min), flocculation with iron(III) chloride, main ozonation (ozone dose: 1.0-1.5 mg/L; contact time: ca. 10 min), multiple layer filter, and a final GAC filtration.Waterworks II (WW-II).Sedimentation, flocculation with FeCl3/CaOH2, GAC filtration, underground passage, bank filtration, and slow sand filtration.Results and DiscussionStudy of Biodegradation in Batch Experiments with Native Surface Water, Groundwater, and Filter Materials.Experi-ments with batch cultures could provide the first clues on the general potential for biodegradation of pharmaceuticals under different environmental conditions. The relative concentrations (C/C0) of the spiked pharmaceuticals in the batch experiments with surface water and groundwater were nearly constant during the whole exposure time of 28 d (Table 3). All variations of elimination rates were within the relative standard deviation (RSD), which was between 6 and 39%.Thus, it can be ruled out that significant sorption effects and biodegradation occurred in the waters and materials used under anoxic and aerobic conditions. These results suggest that the sorption properties of the selected phar-maceuticals can be expected to be low and that their persistence should be relatively high under real conditions such as slow sand filtration or subsoil passage. However, in complex habitats, the bioavailability and the sorption behavior are determined by various biotic and abiotic parameters that were not simulated in the described batch cultures. Parameters such as the species and physiological status of occurringmicroorganisms, the percentage of humic substances, percentage of iron and manganese hydroxides, pH, etc. can differ significantly according to the actual field conditions. The standardized test used according to the OECD guidelines (24), delivers comparable results for the biode-gradability of substances but cannot be transferred to all natural conditions and account for the various parameters. Therefore, on the basis of the described results, (bio)-degradation or sorption of the selected pharmaceuticals under field conditions cannot be ruled out in general, but they should be relatively low. Sorption of the selected pharmaceuticals on iron hydroxides seems to be insignificant since in the flocculation experiments with precipitated iron hydroxides no reduction of the spiked concentrations was found (see flocculation section below). Furthermore, it was observed that the established microbial activity in the test system was high enough for degradation of dissolved organic matter (DOC) and could not be inhibited by the spiked pharmaceuticals as it can be seen by the esterase activity (Figure 1).Removal after Flocculation with Iron(III) Chloride.Floc-culation in lab-scale (Jar test) with iron(III) chloride exhibited no significant elimination of the pharmaceuticals from raw water. The relative concentration levels (C/C0) after floc-culation were 96 ( 11% for diclofenac, 87 ( 10% for clofibric acid, 111 ( 15% for bezafibrate, 87 ( 12% for carbamazepine, and 110 ( 14% for primidone. Thus, c/c0 of the spiked compounds varied without exception within the RSD. The transference of these results from lab-scale to waterworks conditions was shown by a monitoring of up-scaled floc-culation processes in two waterworks (WW-I, WW-II; see section below: behavior in waterworks) yielding similar results.Activated Carbon Adsorption.Adsorption Isotherms.The assessment of the adsorption properties of single compounds onto activated carbon is often performed by recording adsorption isotherms. Freundlich adsorption isotherms with fresh activated carbon were performed for each of the four selected pharmaceuticals. The isotherms are given in Figure 2. Bezafibrate, carbamazepine, and diclofenac exhibited over the whole concentration range (0.1-100 íg/L) a higher activated carbon loading q than did clofibric acid. Hence, clofibric acid has the lowest sorption affinity on activated carbon. In addition to the selected pharmaceuticals, the isotherm of tetrachloroethene is shown in Figure 2. Tetra-chloroethene was used because its removal by adsorption onto activated carbon in full-scale treatment plants is known to be efficient (31). In a concentration range below 10 íg/L, the isotherms of the pharmaceuticals selected exhibited higher loads on carbon as compared to tetrachloroethene. Thus, it can be concluded that the four selected pharma-ceuticals can be removed efficiently under real conditions by activated carbon filtration in waterworks.Nevertheless, sorption efficiencies are always relying on the competition with other occurring organic compounds. As expected, the adsorption capacity for the pharmaceuticals is lower on activated carbon if other compounds such as natural organic substances compete for the adsorption sites. That can be underscored by a comparison of the Freundlich parameters for the adsorption with deionized water and with natural groundwater (DOC ) 2.0 mg/L; SAC at 254 nm ) 5.8 m-1) given in Table 4. The shift toward lower K values is equivalent to a lower sorption capacity. Especially for clofibric acid the slope of the isotherm (n value) is relatively high in groundwater, which can be interpreted as a low adsorption capacity in the low concentration range. On the basis of the isotherms with natural groundwater, it can be expected that the capacity reduction of activated carbon might be signifi-cant due to competitive adsorption of natural groundwater constituents. Hence, the adsorption capacity of the activated carbon in a fixed bed adsorber in waterworks is expected to be lower for pharmaceuticals than in the isotherm experi-ments performed with deionized water.GAC Filtration in Pilot Scale.In pilot-scale experiments,an activated carbon adsorber filled with activated carbon was operated according to the previous description. The breakthrough curves in different filter bed depths of about 80 cm and 160 cm (end of filter) are shown in Figures 3 and 4. These results coincide very well with the data of the isotherm tests listed in Table 4. Carbamazepine showed the highest adsorption capacity of the selected pharma-ceuticals and can be removed at a specific throughput of about 50 m3/kg in a carbon layer of 80 cm and more than 70 m3/kg in a layer of 160 cm even at a relatively high initial concentration of about 1 íg/L. Clofibric acid, with an initial concentration of about 1,8 íg/L, showed a significantly lower adsorption capacity in the isotherm test and in the pilot-scale experiment. An initial breakthrough of clofibric acid could be observed at a height of 80 and 160 cm at a specific throughput of 10 and 17 m3/kg, respectively. Although lower adsorption capacities in the isotherm test are observed for bezafibrate and diclofenac as compared to carbamazepine, both compounds were removed in a bed depth of 160 cm to a specific throughput of at least 70 m3/kg. The differences between the results obtained in isotherm and the pilot plant experiments might be influenced by the lower initial con-centrations applied in the pilot plant experiments Ozonation.For lab-scale ozonation experiments, floc-culated WW-II water was used. The DOC of the flocculated water was 1.3 mg/L, the pH was 7.8, alkalinity was 2 mmol/L, and temperature was 23°C. The initial concentration of the pharmaceuticals under investigation was 1 íg/L. The ef-ficiency of the ozonationprocess for the removal of the pharmaceuticals turned out to be very product specific. At a small ozone dose of 0.5 mg/L, the concentrations of diclofenac and carbamazepine were reduced by more than 97% while clofibric acid decreased by only 10-15% for the same ozone dose (Figure 5). Even extremely high ozone doses up to 2.5-3.0 mg/L led to a reduction of e40% for clofibric acid. Primidone and bezafibrate were reduced by 50% at ozone concentrations of about 1.0 and 1.5 mg/L, respectively. While applying 3.0 mg/L ozone, still 10% of primidone and 20% of bezafibrate remained. Because of the presence of methanol (used for dissolving the spiked pharmaceuticals), ozone was partly transformed into OH radicals. Thus, the direct ozone reaction was probably underestimated, and the oxidation efficiency under waterworks conditions should be even slightly higher than found in lab scale. Although we did no additional work to elucidate the reactivity of the selected pharmaceuticals with ozone or OH radicals, we can rational-ize these observations based on the chemical structures (Table 1). The reactivity of diclofenac and carbamazepine with ozone is expected to be very high. Rate constants k O3 > 105 M-1 s-1can be expected for deprotonated secondary aromatic amines (diclofenac) and molecules containing nonaromatic double bonds (carbamazepine) (32, 33). For diclofenac, a main oxidation product was detected with a mass spectrum showing an increase of the molecular weight of 16 amu, which is an evidence for substitution of a hydrogen by a hydroxy moiety. A hydroxylation of the secondary amino group is likely but has to be confirmed (e.g., by NMR). Because of missing active sites susceptible to ozone attack (34), reactions of ozone with clofibric acid are expected to be very slow. Thus, OH radical reactions should be predominant with k OH 5 109 M-1 s-1(35). Considering the OH radical activity taken from the prediction for clofibric acid, ozone rate constants for bezafibrate and primidone should result in the middle range (k O3 102-103 M-1 s-1). The reactivity of these pharmaceuticals with ozone can be based on their reactive mono- and disubstituted benzene rings (32). It has to be noted that in the current study only the primary target degradation was investigated, thus further research is es-sential to identify and confirm the structures of metabolites formed by ozonation and to clarify the kinetic behavior.。
中英文资料外文翻译文献外文文献:Evaluating Water Conservation Measures For Green Building InTaiwanGreen Building evaluation is a new system in which water conservation is prioritized as one of its seven categories for saving water resources through building equipment design in Taiwan. This paper introduces the Green Building program and proposes a water conservation index with quantitative methodology and case study. This evaluation index involves standardized scientific quantification and can be used in the pre-design stage to obtain the expected result. The measure of evaluation index is also based on the essential researchin Taiwan and is a practical and applicable approach.Keywords: Green Building; Evaluation system; Water conservation; Building equipment1. IntroductionThe environment was an issue of deep global concern throughout the latter half of the 20th century. Fresh water shortages and pollution are becoming one of the most critical global problems. Many organizations and conferences concerning water resource policy and issues have reached the consensus that water shortages may cause war in the 21st century[1],if not a better solution .Actually, Taiwan is already experiencing significant discord over water supply. Building new dams is no longer an acceptable solution to the current water shortage problems, because of the consequent environmental problems. Previous studies have concludedthat water savings are necessary not only for water conservation but also for reducing energy consumption [2,3].Taiwan is located in the Asian monsoon area and has an abundant supply of rainwater. Annual precipitation averages around 2500mm. However, water shortages have recently beena critical problem during the dry season. The crucial, central issue is the uneven distribution of torrential rain, steep hillsides, and short rivers. Furthermore, the heavy demand for domestic water use in municipal areas, and the difficulties in building new reservoirs are also critical factors. Government departments are endeavoring to spread publicly the concept of water-conservation. While industry and commerce have made excellent progress in water conservation, progress among the public has been extremely slow.Due to this global trend, the Architecture and Building Research Institute (ABRI), Ministry of Interior in Taiwan, proposed the “Green Building” concept and built the evaluation system. In order to save water resources through building equipment design, this system prioritizes water conservation as one of its seven categories. This paper focuses on the water conservation measures for Green Building in Taiwan and a quantitative procedure for proving water-saving efficiency. The purpose of this work is not only aimed at saving water resources, but also at reducing the environmentalimpact on the earth.2. Water conservation indexThe water conservation index is the ratio of the actual quantity of water consumed in a building to the average water-consumption in general. The index is also called, “the water saving rate”. Evaluations of the water-consumption quantity include the evaluation to the water-saving efficiency within kitchens, bathrooms and all water taps, as well as the recycling of rain and the secondhand intermediate water.2.1. Goal of using the water conservation indexAlthough Taiwan has plenty of rain, due to its large population, the average rainfall for distribution to each individual is poor compared to the world average as shown in Fig. 1.Thus, Taiwan is reversely a country short of water. Yet, the recen t improvements in citizens’ standards of living have led to a big increase in the amount of water needed in cities, as shown in Fig. 2, which, accompanied by the difficulty of obtaining new water resources, makes the water shortage problem even worse. Due to the improper water facilities designs in the past, the low water fee, and the usual practical behavior of people when using water, Taiwanesepeople have tended to use a large quantity of tap water. In 1990,the average water-consumption quantity in Taiwan was 350l per person per day, whereas in Germany it is about 145l per person per day, and in Singapore about 150l per person per day. These statistics reveal the need for Taiwanese people to save water.The promotion of better-designed facilities which facilitate water-saving will become a new trend among the public and designers, because of concerns for environmental protection. The water conservation index was also designed to encourage utilization of the rain, recycling of water used in everyday life and use of water-saving equipment to reduce the expenditure of water and thus save water resources.2.2. Methodology for efficient use of water resourcesSome construction considerations and building system designs for effective use of water resources are described below.2.2.1. Use water-conservation equipmentA research of household tap-water consumption revealed that the proportion of the water used in flushing toilets and in bathing, amounts to approximately 50% of the total household water consumption, as given in Table 1. Many construction designers have tended to use luxurious water facilities in housing, and much water has thus been wasted. The use of water-saving equipment to replace such facilities is certain to save a large amount of water. For example, the amounts of water used in taking a shower and having a bath is quite different.A single shower uses around 70l of water, whereas a bath uses around 150l. Furthermore, current construction designs for housing in Taiwan tend to put two sets of bathtubs and toilets, and quite a few families have their own massage bathtubs. Such a situation can be improved only by removing the tubs and replacing them with shower nozzles, so that more water can be possibly saved. The commonly used water-saving devices in Taiwan now include new-style water taps, water-saving toilets, two-sectioned water closets, water-saving shower nozzles, and auto-sensor flushing device systems, etc. Water-saving devices can be used not only for housing, but also in other kinds of buildings. Public buildings, in particular, should take the lead in using water-saving devices.2.2.2. Set up a rain-storage water supply deviceThe rain-storage water supply device stores rain using natural landforms or man-made devices, and then uses simple water-cleaning procedures to make it available for use in houses. Rain can be used not only as a substitute water supply, but also for re control. Its use also helps to decrease the peak-time water load in cities. The annual average rainfall in Taiwan is about 2500 mm, almost triple better than the global average. However, due to geographic limitations, we could not build enough water storage devices, such as dams, to save all the rain. It is quite a pity that annually about 80% of the rain in Taiwan is wasted and flows directly into the sea, without being saved and stored. The rain-storage water supply system is used with a water-gathering system, water-disposal system, water-storage system and water-supply system. First, the water-gathering system gathers the rain. Then, the water flows to the water-disposal system through pipes, before being sent to the water-storage system. Finally, it is sent to the users’equipment through another set of pipes. Using the drain on the roof of a building, leading to the underground water-storage trough, is considered an effective means of gathering rain. The water, after simple water-disposal processes, can be used for chores such as house cleaning, washing floors, air-conditioning or watering plants.2.2.3. Establishing the intermediate water systemIntermediate water is that gathered from the rain in cities, and includes the recycled waste-water which has already been disposed of and can be used repeatedly only within a certain range, but not for drinking or human contact. Flushing the toilet consumes 35% of all water. If everyone were to use intermediate water to flush toilets, much water could be efficiently saved. Large-scale intermediate water system devices are suggested to be built up regularly with in a big area. Each intermediate water system device can gather, dispose and recycle a certain quantity of waste-water from nearby government buildings, schools, residences, hotels, and other buildings. The obtained water can be used for flushing toilets, washing cars, watering plants and cleaning the street, or for garden use and to supplement the water of rivers or lakes. A small-scale intermediate water system gathers waste-water from everyday use, and then, through appropriate water-disposal procedures, improves the water quality to a certain level, so that finally it can be repeatedly used for non-drinking water. Thereare extensive ways to use the intermediate water. It can be used for sanitary purposes, public fountains, watering devices in gardens and washing streets. In order to recycle highly polluted waste-water, a higher cost is needed for setting up the associated water-disposal devices, which are more expensive and have less economic benefits than the rain-utilization system. Except for the intermediate water-system set within a single building, if we build them within large-scale communities or major construction development programs, then it is sure to save more water resources efficiently and positively for the whole country as well as improve the environmental situation.4. Method for assessing the recycling of rainSystems for recycling rain and intermediate water are not yet economic beneficial, because of the low water fee and the high cost of water-disposal equipment. However, systems for recycling rain are considered more easily adoptable than those for recycling intermediate water. Herein, a method for assessing the recycling of rain is introduced to calculate the ratio (C) of the water-consumption quantity of the recycled rainwater to the total water-consumption.4.1. Calculation basis of recycling rainwaterThe designer of a system for recycling rainwater must first determine the quantity of rainwater and the demand, which will determine the rainwater collection device area and the storage tank volume. Rainwater quantity can actually be determined by a simple equation involving precipitation and collection device area. However, precipitation does not fall evenly spread over all days and locations. In particular, rain is usually concentrated in certain seasons and locations. Consequently, the critical point of the evaluation is to estimate and assess meteorological precipitation. Meteorological records normally include yearly, monthly, daily and hourly precipitation. Yearly and monthly precipitation is suitable for rough estimates and initial assessment. However, such approximation creates problems in determining the area of the rainwater collection device and the volume of the storage tank. Thus, daily precipitation has been most commonly considered. Hourly precipitation could theoretically support a more accurate assessment. However, owing to the increasing number of parameters and calculation data increases, the complexity of the process and the calculation time, result in inefficiencies. Herein, daily precipitation is adoptedin assessing rainwater systems used in buildings [4,7].4.3. Case study and analysisFollowing the above procedure, a primary school building with a rainwater use system is taken as an example for simulation and to verify the assessment results. This building is located in Taipei city, has a building area of 1260 m and a total floor area of 6960 m ; it is a multi-discipline teaching building. Roofing is estimated to cover 80% of the building area, and the rainwater collection area covers 1008 m .Rainwater is used as intermediate water for the restrooms, and the utilization condition is set at 20 m per day, whilethe out flow coefficient (Y) is 0.9. A typical meteorological precipitation in Taipei in 1992 was adopted as a database. The rainwater storage tank was set to an initial condition before the simulation procedure. Herein, four tank volumes were considered in the simulations of rainwater utilization—15, 25, 50, 100 m. The results indicate that increased storage tank volume reduces overflow and increases the utilization of rainwater. Given a 50 m storage tank, the quantity of rainwater collection closely approaches the utilization quantity of rainwater. Consequently, this condition obtains a storage tank with a roughly adequate volume. When the volume of the storage tank is 100 m, the utilization rate is almost 100% and the overflow quantity approaches zero. Despite this result being favorable with respect to utilization, such a tank may occupy much space and negatively impact building planning. Consequently, the design concept must balance all these factors. The building in this case is six floors high, and the roof area is small in comparison to the total floor area. The water consumption of the water closet per year, but the maximum rainwater approaches 7280 m collection is 2136 m per year. Thus, significant replenishment from tap water is required. This result also leads to a conclusion that high-rise buildings use rainwater systems less efficiently than other buildings. Lower buildings (e.g. less than three floors) have highly efficient rainwater utilization and thus little need for replenishment of water from the potable water system.The efficiency of rainwater storage tanks is assessed from the utilization rate of rainwater and the substitution rate of tap water. Differences in annual precipitation and rainfall distribution yield different results. Figs. 5 and 6 illustrate the results of the mentioned calculation procedure, to analyze differences in rainwater utilization and efficiency assessment.The simulation runs over a period often years, from 1985 to 1994, and includes storage tanks with four different volumes. When the volume of the rainwater tank is 50 m, the utilization rate of rainwater exceeds 80% with about 25% substitution with tap water. Using this approach and the assessment procedure, the volume of rainwater storage and the performance of rainwater use systems in building design, can be determined.In the formula of the water conservation index, C is a special weighting for some water recycling equipment that intermediates water or rain, and is calculated as the ratio of the water-consumption quantity of the recycled rainwater to the total water-consumption. Therefore, this assessment procedure can also offer an approximate value of C for the water conservation index.5. Green building label and policy“Green Building” is called “Environmental Co-Habitual Architecture” in Japan, “Ecological Building” or “Sustainable Building” in Europe and “Green Build ing in North American countries. Many fashionable terms such as “Green consumption”, “Green living”, “Green illumination” have been broadly used. In Taiwan, currently, “Green” has been used as a symbol of environmental protection in the country. The Construction Research Department of the Ministry of the Interior of the Executive Yuan has decided to adopt the term “Green Building” to signify ecological and environmental protection architecture in Taiwan.5.1. Principles of evaluationGreen Building is a general and systematic method of design to peruse sustainable building. This evaluation system is based on the following principles:(1) The evaluation index should accurately reflect environmental protection factors such as material, water, land and climate.(2) The evaluation index should involve standardized scientific quantification.(3) The evaluation index should not include too many evaluation indexes; some similar quality index should be combined.(4) The evaluation index should be approachable and consistent with real experience.(5) The evaluation index should not involve social scientific evaluation.(6) The evaluation index should be applicable to the sub-tropical climate of Taiwan.(7) The evaluation index should be applicable to the evaluation of community or congregate construction.(8) The evaluation index should be usable in the pre-design stage to yield the expected result.According to these principles, the seven-index system shown in Table 4 is the current Green Building evaluation system use d in Taiwan. The theory evaluates buildings’ impacts on the environment through the interaction of “Earth Resource Input” and “Waste Output”. Practically, the definition of Green Building in Taiwan is “Consume the least earth resource and create the least construction waste”.Internationally, each country has a different way of evaluating Green Building. This system provides only the basic evaluation on “Low environment impact”. Higher level issues such as biological diversity, health and comfort and community consciousness will not be evaluated. This system only provides a basic, practical and controllable environmental protection tool for inclusion in the government’s urgent construction environment protection policy. The “Green Building” logo is set to a ward Green Building design and encourage the government and private sector to pay attention to Green Building development. Fig. 7 is the logo of Green Building in Taiwan [6,8].5.2. Water conservation measureThis paper focuses on water conservation index in green building evaluation system. Water conservation is a critical category of this evaluation system, and is considered in relation to saving water resources through building equipment design. This evaluation index contains standardized scientific quantification and can be used in the pre-design stage to obtain the desired result. The evaluation index is also based on research in Taiwan and is practically applicable. Using water-saving equipment is the most effective way of saving water; using two-sectioned water-saving toilets and water-saving showering devices without a bathtub are especially effective. Various other types of water-recycling equipment for reusing intermediate water and rain are also evaluated. In particular, rainwater-use systems in building designs areencouraged. When a candidate for a Green Building project introduces water recycling system or a rainwater use system, the applicant should propose an appropriate calculation report to the relevant committee to verify its water-saving efficiency. This guideline actually appears to be a reasonable target for performing Green Building policy in Taiwan.A new building can easily reach the above water conservation index. This evaluation system is designed to encourage people to save more water, even in existing buildings. All this amounts to saying that large-scale government construction projects should take the lead in using such water-saving devices, as an example to society.6. ConclusionThis paper introduces the Green Building program and proposes a water conservation index with standardized scientific quantification. This evaluation index contains standardized scientific quantification and can be used in the pre-design stage to obtain the expected results. The measure of evaluation index is also based on the essential research on Taiwan and is a practical and applicable approach. The actual water-saving rate (WR) for Green Building projects should be <0.8, and the AR of the water-saving equipment should be higher than 0.8. Thus, qualified Green Building projects should achieve a water saving rate of over 20%. For the sustainable policy, this program is aimed not only at saving water resources, but also at reducing the environmental impact on the earth.The Green Building Label began to be implemented from 1st September 1999, and over twenty projects have already been awarded the Green Building Label in Taiwan, while the number of applications continues to increase. For a country with limited resources and a high-density population like Taiwan, the Green Building policy is important and represents a positive first step toward reducing environmental impact and promoting sustainable development.中文译文:台湾的绿色建筑节约用水评价措施在台湾绿色建筑评价是一个新的制度,在它的一个7个类别中,通过建筑设备设计节省水资源,使水资源保护置于优先地位。

建筑给排水专业英语English:In the field of architectural plumbing, professionals are responsible for designing, installing, and maintaining systems that ensure the safe and efficient flow of water within buildings. This includes both supply systems, which bring clean water into the building for drinking, cooking, and sanitation purposes, as well as drainage systems, which remove wastewater and sewage. Architectural plumbing specialists must have a comprehensive understanding of building codes, regulations, and standards related to plumbing to ensure compliance and safety. They also need to possess knowledge of various materials and technologies used in plumbing systems, such as pipes, fittings, valves, pumps, and water heaters. Additionally, they must consider factors such as building layout, occupancy, water pressure, and environmental impact when designing plumbing systems to meet the specific needs of each project. Furthermore, professionals in this field often collaborate with architects, engineers, and construction teams throughout the design and construction process to integrate plumbing systems seamlessly into overall building plans. Regular maintenance and inspection of plumbingsystems are also essential to identify and address potential issues before they escalate, ensuring the continued functionality and safety of the building.中文翻译:在建筑给排水领域,专业人士负责设计、安装和维护系统,确保建筑内水的安全和高效流动。
给排水外文翻译【概述】外文名称:Water Supply and Drainage【引言】给排水是指人类为了满足生活、生产和环境需求,采集、利用和排放水资源的活动和系统。
随着城市化进程的加速和人们对舒适生活品质的要求不断提高,给排水工程在城市规划和建设中起到至关重要的作用。
本文将介绍给排水外文翻译的重要性、翻译技巧和注意事项,为给排水工程相关专业人员提供参考。
【翻译重要性】给排水工程涉及大量外文文献和技术资料,而国内外水利工程界的发展迅猛,相关外文文献的翻译对于我国的给排水工程建设具有重要意义。
通过翻译,我们可以了解国外先进的给排水技术和管理经验,为我国的工程建设提供参考和借鉴。
同时,翻译还有助于加强国际间的交流合作,促进我国在给排水领域的影响力和地位的进一步提升。
【翻译技巧】1. 理解专业术语:给排水领域涉及大量专业术语,翻译者应对这些术语进行准确理解。
可以通过查阅外文词典或专业词汇表对其进行翻译,避免出现术语误译的情况。
2. 深入研究上下文:在翻译过程中,翻译者应该深入研究原文上下文,理解全文的语境和主旨,以确保翻译结果的准确性和一致性。
3.注意句子结构:外文论文的句子结构和汉语差异较大,翻译者应根据汉语表达习惯进行适当调整,保证译文通顺。
【注意事项】1. 外文翻译要准确传达论文内容,不得随意增删原文内容。
2. 翻译过程中应注意句子结构的转换,确保译文的准确性和流畅性。
3. 注意专业术语翻译的准确性,可以参考国内外相关词汇表和标准进行翻译。
4. 翻译过程中应注意时间和质量的把握,提前制定翻译计划,并进行分段、分步翻译,以确保高质量的翻译成果。
【结论】给排水外文翻译对于我国给排水工程建设和国际交流具有重要意义。
翻译者需要具备扎实的专业知识和翻译技巧,通过深入研究与准确翻译,为我国的工程建设和国际交流贡献力量。
同时,加强对外文文献和技术的翻译工作,不断提高我国在给排水领域的创新能力和核心竞争力,助力我国以科技创新引领未来社会发展的目标实现。
Oxidize ditch craft in dirty water handle of application and development Summary: This text expatiated primarily the Carrousel oxidizes the construction, craft mechanism of the ditch and circulate the problem exsited in the process with the homologous the method of solution.Finally, introduce the Carrousel oxidize the latest research progress of the ditch and pointed out the future and main research direction.Key phrase: The Carrousel oxidizes ditch divideds by the phosphor takes off the nitrogen construction mechanism Application and Development of Carrousel Oxidation Ditch Process on Wastewater TreatmentAbstract: The structure and the techniques of carrousel oxidation ditch process on nitrogen and phosphor removal are introduced in this paper. The problems inrunning and their corresponding resolvent are also pointed. At last, The authorshowed the up to date research improvement and the mainly future research dire-ction.Key words: Carrousel; oxidation ditch; nitrogen and phosphor removal; structure;techniques1. ForewordOxidize the ditch( oxidation ditch) again a continuous circulation spirit pond( Continuous loop reactor), is a live and dirty mire method a kind of to transform.Oxidizing the dirty water in ditch handles the craft be researched to manufacture by the hygiene engineering graduate school of Holland in the 50's of 20 centuries success.Since in 1954 at Dutch throw in the usage for the very first time.Because its a water fluid matter good, circulate the stability and manage convenience etc. technique characteristics, already at domestic andinternational and extensive application in live the dirty water to is dirty to manage aqueously with the industry[1].Current application than oxidize extensively the ditch type include:The ( Pasveer) oxidizes the ditch, the ( Carrousel) oxidizes the ditch, ( Orbal) oxidizes the ditch, the type of T oxidizes the ditch( three ditch types oxidize the ditch), the type of DE oxidizes the ditch to turn to oxidize the ditch with the integral whole.These oxidize the ditch because of the difference of esse in construction with circulating, therefore each characteristics[2].This text will introduce construction, mechanism, existent problem and its latest developments that Carrousel oxidize ditches primarily.2. The Carrousel oxidizes the construction of the ditchThe Carrousel oxidize the ditch to be researched to manufacture by Dutch DHV company development in 1967.Oxidize the last the company of DHV in foundation of the ditch in the original Carrousel to permited specially the company EIMCO to invent again with its patent in the United States Carrousel 2000 system( see the figure ), realizes the living creature of the higher request takes off the nitrogen with divided by the function of .There has been in the world up to now more than 850 Carrousels oxidize the ditch with the Carrousel 2000 system are circulating[3].From diagram therefore, the Carrousel oxidizes the ditch the usage the spirit of that definite direction control with shake up the device, face to mix with the liquid deliver the level speed, from but make drive the liquid of admixture that shake up is in oxidize ditch shut match outlet circulate flow.Therefore oxidize the ditch have the special hydraulics flows the , current complete mix with the characteristics of the type reactor, have the characteristics that push the flow type reactor again, the ditch inside exsits obviously of deliquescence oxygen density steps degree.Oxidizing the ditch crosssection is rectangle or trapezoids, the flat surface shape is many for oval, the ditch internal water is deep general for 2.5 ~4.5 m, the breadth is deep compare for 2:1, also have the deep water amount to 7 ms of, ditch inside average speed in water current is 0.3 ms/ s.Oxidize ditch spirit admixture equipments contain surface spirit machine, the spirit of turn to brush or turn the dish and shoot to flow the spirit machine, pipe type spirit machine with promote take care of type spirit machine etc., match with in recent years usage still contain underwater push machine[4~6].3. The Carrousel oxidizes the mechanism of the ditch3.1 The Carrousel oxidizes the ditch handles dirty and aqueous principleThe at the beginning common Carrousel oxidizes the dirty water in inside in craft of the ditch direct with dirty mire in reflux together enter oxidize the ditch system.The surface spirit machine makes fuse in the liquid of admixture the density of the oxygen DO increases about 2 the 3 mgs/ L.Under this kind of well the term of the oxygen , the microorganism gets the enough deliquescence oxygen comes and go to divided by the BOD;At the same time, the ammonia were too oxidized nitrate with second nitrate, this time, mix with the liquid be placed in the oxygen appearance.In the spirit machine downstream, after water current be become by the swift flow appearance of the spirit District of even flow the appearance, the water current maintains in the minimum current velocity, guaranteeing the live and dirty mire be placed in the floats the appearance.( average current velocity>0.3 ms/ s)Oxidize microbially the process consumed to fuse the oxygen in the water, until the value of DO declines for zero, mixing with the liquid report the anoxia appearance.Versa nitric that turn the function through anoxia area, mix with the liquid enter to have the oxygen area, completing once circulating.That system inside, theBOD declines the solution is a continuous process, the nitric turns the function to turn with the versa nitric the function take place in same pond.Because of structural restrict, this kind of oxidize the ditch although can then valid whereabouts BOD, divided by the phosphorus take off the nitrogenous ability limited[7].For the sake of the acquisition better divided by the phosphorus take off the nitrogenous result, Carrousel 2000 systems increased a oxygen District before common Carrousel oxidize ditch with the unique oxygen area.( call again that the versa nitric in front turns the area)The dirty mire in all refluxes enters the anaerobic District with 10-30% dirty water, can under the anoxia with 10-30% carbon source term complete remaining of dirty mire in reflux inside nitric acid nitrogen to versa nitric to turn, creates for the unique oxygen pond of hereafter unique oxygen term.At the same time, anaerobic District inside of concurrently the sex germs convert the dissolubility BOD VFA, the germ acquire the VFA its assimilation PHB, the energy source needed solves in the phosphoric water and cause phosphatic releasing.The anaerobic District a water enters the inner part installs the unique oxygen area that have the mixer, the so-called unique oxygen is a pond inside to mix with liquid since have no the numerator oxygen, also have no the compound oxygen( nitric acid root), the here unique oxygen environment is next,70-90% dirty water can provide the enough carbon source, can make the germ of released the phosphorus well.The unique oxygen area connects behind the common Carrousel oxidizes the ditch system, further completing to do away with the BOD and take off the nitrogen with divided by the phosphorus .Finally, mix with the liquid transfer the dirty mire inside in oxidize ditch enrich oxygen area eject, while enriching the oxygen environment germ surfeit, phosphorus from the water, ejecting the system with the dirty mire in surplus.Like this, in Carrousel 2000systems, than completed to do away with the BOD, COD with take off at the same time goodly the nitrogen divided by the phosphorus .Synthesizing and dirty water in the river City , long sand City decontamination center[s of the dirty the factory of water in the first in Kunming of adoption that crafts handles the movement result of the factory therefore:Through Carrousel 2000 system after handling, the BOD, COD, SS does away with the rate to all come to a 90% above, the TN does away with the rate comes to a 80%, the TP does away with the rate to also come to a 90%.3.2 The Carrousel oxidizes the ditch divideds by the phosphorus takes off the nitrogenous influence factor.Affecting the Carrousel oxidizes the ditch divideds by the phosphoric factor is dirty mire , nitrate density and quality densities primarily.The research expresses, being total and dirty mire as 11% that a hour biggest phosphorus 4% with deal is its fuck dirty mire deal within live and dirty mire, keep for the the germ physical endowment measures, but when dirty mire over 15 d hour dirty mire the inside is biggest to contain the obvious descent in deal in phosphorus , canning not reach the biggest divideding by the result of phosphorus on the contrary.Therefore, prolong persistently the dirty mire ( for example 20ds,25ds,30ds) is to have no necessary, proper choose to use within the scope of 8~15 d.At the same time, high nitrate density with low quality density disadvantage in divided by the process of phosphorus .Affecting the Carrousel oxidizes the ditch takes off the nitrogenous and main factor is DO, nitrate density and carbon source densities.The research expresses, oxidizing the ditch inside exsits deliquescence oxygen density steps degree namely the good oxygen area DO attains 3~3.5 mgs/ L, the anoxia area DO attains 0~0.5 mgs/ L is a prior condition to take place nitric turn reaction and versa nitricsturn the reaction.At the same time, ample carbon source and higher C/ the N ratio benefits to take off to complete nitrogenously[7].4. The Carrousel oxidizes problem and solution methods of the ditch esse.Though the Carrousel oxidizes the ditch has a water fluid matter good, the anti- pounds at the burthen ability strong, divided by the phosphorus take off the nitrogen efficiency. But, in physically of movement process, still exsits a series of problem.4.1 Dirty mire inflation problemWhen discard the aquatic carbohydrate more, the N, P contains the unbalance of deal, the pH value is low, oxidizing the dirty mire in inside in ditch carries high, fuse the oxygen density the shortage, line up the mire not etc. causes easily dirty mire in germ in form in silk inflation;Not the dirty mire in germ in form in silk inflation takes place primarily at the waste water water temperature is lower but the dirty mire carries higher hour.The microbial burthen is high, the germs absorbed the large quantity nourishment material, is low because of the temperature, metabolism the speed is slower, accumulating the rises large quantity is high to glue sexual and many sugar materials, making the surface of the live and dirty mire adhere to the water to increase consumedly, SVI the value is very high, becoming the dirty mire inflation.Cause that aim at the dirty mire inflation, can adopt the different counterplan:From the anoxia, water temperature high result in of, can enlargement tolerance or lower into the water measures to alleviate burthen, or the adequacy lowers the MLSS( control dirty mire reflux measure), making need the oxygen measures decrease;If the dirty mire carries high, can increase MLSS, to adjust the burthen, necessity the hour can stop into the water, stuffy a period of time;Can pass the hurl add the nitrogen fertilizer, phosphorus fatty, adjust the admixturenourishment in the liquid material equilibrium( BOD5:N:P=100:5:1);The value of pH over low, can throw to add the lime regulate;Bleach the powder with the liquid chlorin( press to fuck 0.3% of the dirty mire~0.6% the hurl adds), can repress the silk form germ breed, controling the dirty mire in combinative water inflation[11].4.2 Foam problemBecause entering to take the grease of large quantity in the water, handling system can't completely and availably its obviation, parts of greases enriches to gather in in the dirty mire, through turn to brush the oxygen agitation, creation large quantity foam;The mire is partial to long, the dirty mire is aging, and also easy creation foam.Spray to pour the water or divided by with the surface the of do away with the foam, in common use divided by the an organism oil, kerosene, the oil of silicon, throw deal as 0.5~1.5 mgs/ L.Pass to increase dirty mire in pond in spirit in density or adequacies let up the tolerance of , also can control the foam creation effectively.When contain the live material in surface in the waste water more, separate with the foam easily and in advance method or other methods do away with.Also can consider to increase to establish a set of divideding by the oil device moreover.But enhance most importantly the headwaters manage, reducing to contain the oil over the high waste water and other poisonous waste water of into[12].4.3 Float the problem on the dirty mireWhen contain in the waste water the oil measures big, whole system mire quality become light, can't like to control very much in operate process its at two sink the pond stop over time, resulting in the anoxia easily, producing the corrupt and dirty mire ascend to float;When spirit time over long, take place in pond the high degree nitric turn the function, making nitrate density high, at two sink theversa nitric in easy occurrence in pond turn the function, creation nitrogen spirit, make dirty mire ascend float;Moreover, contain the oil in the waste water?Take place the dirty mire ascend after floating should pause enter water, broke off or dirty mire in clearance, judge the clear reason, adjust the operation.The dirty mire sinks to decline the sex bad, can throw to add of oagulate or sloth materials, the improvement precipitates the sex;Such as enter the water carries big let up into the water measures or the enlargement reflux measures;Such as the dirty mire grain small lower the spirit machine turn soon;If discovers versa nitric turning, should let up the toerance , enlarge the reflux or row the mire measures;If discover the dirty mire is corrupt, should enlargement tolerance, the clearance accumulates the mire, and try the ameliorative pond internal water dint term[12].4.4 Current velocity is not all and the dirty mire sinks to accumulate the problemIn Carrousel oxidize ditch, for acquiring its special admixture with handles result, mix with liquid must with certain current velocity is in ditch circulate flow.Think generally, the lowest current velocity should should attain for an average current velocity for, doing not take place sinking accumulating 0.3~0.5 ms/ s.The spirit equipments that oxidize the ditch is general to turn to brush for the spirit of to turn the dish with the spirit of , turning to brush of immerse to have no depth for 250~300 mms, turn the dish immerse to have no depth for 480~530 mms.With oxidize the ditch water the deep(3.0~3.6 ms) comparing, turn to brush occupied the deep 1/10~ in water 1/12, turned the dish to also occupy the 1/6~ only 1/7, therefore result in to oxidize the ditch upper part current velocity bigger( roughly 0.8~1.2 ms, even larger), but the bottom current velocity is very small( especially at the water is deep 2/3 or 3/4 below, mix with theliquid has no current velocity almost), causing ditch bottom large quantity accumulate the mire( sometimes accumulate the mire thickness amount to a 1.0 ms), the valid capacity that reduced to oxidize the ditch consumedly, lowered to handle result, affected a water fluid matter.Adding the top, downstream leads to flow the plank is a valid method that ameliorative current velocity distribute, increases the oxygen ability with the most convenient measure.The upper stream leads to flow the plank installs at be apart from to turn the 4.0 places( upper stream) :dish( turn to brush) axis, lead to flow plank high degree as the deep 1/5~ in water 1/6, combine the perpendicularity install in the surface;The downstream leads to flow the plank installs at be apart from to turn dish( turn to brush) axis 3.0 ms.Leading to flow knothole material can use metals or glass steels, but regard glass steel as good.Lead to flow the plank compares with other ameliorative measure, can't not only increase the motive consumes with revolves cost, but also can still than significantly exaltation 充oxygen ability with theories motive efficiency[13].Moreover, pass in the spirit on board swim to establish the underwater push machine can also turn to the spirit of the liquid of admixture that brush the bottom low speed area circulates to flow to rise positive push function, from but the solution oxidizes the problem that low and dirty mire in current velocity in bottom in ditch sink accumulates.Establish the underwater push machine useds for exclusively the push mixs with the liquid can make movement method that oxidize the ditch much more vivid, this for economy energy, lift the high-efficiency having the very important meaning[14].5. The Carrousel oxidizes the development of the ditchBecause the dirty water handles standard inside to divided by the phosphorus take off the nitrogenous request more and more strict,the development that Carrousel further oxidized the ditch to also get.Current, the research and application includes morely below two category type:Tiny bore spirit type Carrousel 2000 systems, Carrousel 3000 system.5.1 Tiny bore spirit type Carrousel 2000 systemTiny bore spirit type Carrousel 2000 tiny bore in adoption in system spirit( provide oxygen equipments as the drum breeze machine), the tiny bore spirit machine can produce the diameter of large quantity as a surface for or so and small spirit steeping, this consumedly increases spirit bubble accumulates, undering the certain circumstance in capacity in pond make the oxygen transfer the gross measures aggrandizement.( if deep increment in pond, its spread the quality efficiency will be higher)Produce the technique ability of the factory house according to the current drum breeze machine, the valid water of the pond is deep biggest amounting to a 8 ms, therefore can select by examinations according to the different craft request the fit water is deep.The tradition oxidizes the ditch pushes to flow is to make use of to turn to brush, turn a disc or pour the umbrella type form machine realizes of, its equipments utilization is low, the motive consumes big.Tiny bore spirit type Carrousel 2000 systems then adopted the underwater pushes the way that flow, rises to dive the propeller the leaf the motivation that round creation the direct function namely in the of water, at push to flow the function to can keep dirty mire from sinking to decline effectively again at the same time.As a result, the adoption dives the propeller since lower the motive consume, making mire water got again to mixs with adequately.Seeing from water power characteristic, tiny bore spirit type Carrousel 2000 systems are wreaths form the fold flows the pond type, concurrently pushing the flow type with complete mix with the typeflows .In regard to whole oxidize ditch, can think that oxidize the ditch is a complete mix with spirit pond, its density variety coefficient smallest even can neglect to do not account, enter the water will get the dilution quickly, therefore it have the very strong anti- pounds at the burthen ability.But have oxidize ditch inside of a certain very much the some pushing the characteristic of the flow type, in the nearby district in downstream in machine in spirit inDO density higher, but along with increase with spirit machine distance continuously then the density of DO lowers continuously.( appear the anoxia area)This kind of structure method makes friendly oxygen in area in anoxia area exsited to build the thing inside , making use of its water power characteristic well, coming to an efficiently the living creature takes off the nitrogenous purpose.Tiny bore spirit type Carrousel 2000 system though have the oxygen ability strong, divided by the phosphorus take off the nitrogen effective, cover the area little with can consume low etc. advantage, it also exsits at the same time the problem that tiny bore spirit equipments maintain.Current, the service life of the local and tiny bore spirit machine is 5 years in 4~, can amount to 10 years in 8~ goodly, but with import the tiny bore spirit machine compare to still have the certain margin.The spirit machine maintains unlike the form equipments is so convenient, it need to fuck the pond talent fixs, and also is to say once the tiny bore spirit machine appears the problem to need the adoption parallel two inconvenience for or third sets to solving problem, or adopting promoting device waiting to resolving, this too will giving production with managing bringing biggest[15 16].5.2 Carrousel 3000 systemCarrousel 3000 systems are in the Carrousel 2000 systems are ex- to plus a living creature the choice the area.That living creaturechoice area is a craft to make use of high organism carries to sieve germ grow, repress silk form germ increase, increase each pollutant do away with the rate, afterward principle together Carrousel 2000 system.Carrousel 3000 system of bigger increases to express at:An is to increased the pond deep, can amount to 7.5~8 ms, united at heart circle type, the pond wall uses totally, reducing to cover the area, lowering to build the price to increases to bear the low temperature ability at the same time;( can amount to 7 ℃ )Two is the liquid of admixture that spirit equipments that skillful design, the form machine descends to install to lead to flow , the anoxia of take out , adopt the underwater propeller solution current velocity problem;Three is to used the advanced spirit controller QUTE.( it adopt the much aer kind of changing the deal control mode)Four is to adopt the integral whole turn the design, starting from the center, including below wreath form consecution craft unit:Enter the well of water with the cent water machine that used for the live and dirty mire in reflux;Difference from four-part the choice pond that cent constitute with 厌oxygen pond.This outside is a Carrousel to have three spirit machine with a prepare versa nitric turn the pond 2000 system.( such as figure 2 show)Five is tube line that the design that the circular integral whole turn to make oxidize the ditch do not need additionally, can immediately realize dirty mire in reflux allotment in different craft unit[17].6. ConclusionThe Carrousel oxidizes the ditch because of having the good a phosphorus takes off the nitrogen ability, anti- pounds at the burthen ability with circulate to manage the convenience etc. the advantage, having got the extensive application.But because of technological development with social advance, that craft is necessarily willexaltation getting further.The author thinks:The Carrousel oxidizes the future research direction of the ditch will now of main below several aspects.1 Combination living creature method, research with develop the living creature model Carrousel oxidize the ditch.Like this can not only increases the microorganism gross of the unit reactor measures, from but increases the organism carries, but also living creature oneself the inside that have places the A/ the system of O enhances to take off the nitrogen result[18].2 Increases continuously the Carrousel oxidize the microbial activity in inside in ditch.For example throw to add the EM in oxidize ditch with single mind the germ grow, throws in that the salt of iron make the microorganism tame the live char in iron, devotion in living creature to become the formation to strengthen the germ gum regiment and increases to bear the toxicity pound at etc..3 Increasing the Carrousel oxidizes the ditch equipments function with supervise and control the technique.Function that increases form machine, underwater propeller, reduce to maintain the workload;Making use of DO, etc. of ORP many targets supervises and control the technique and changes the technique of is from now on the Carrousel oxidizes ditch science circulate necessarily from it road.4 Increasing the Carrousel oxidizes the ditch resistant to cold and bear toxicity can, reduce to cover the area to build the price with the engineering.Theoretical application, deep pond in water power term with the research of the craft function is to lowers the engineering builds the price and increases resistant to cold bear the toxicity can wait to provide the possible direction.氧化沟工艺在污水处理中的应用与发展摘要:本文主要阐述了Carrousel氧化沟的结构、工艺机理、运行过程中存在的问题和相应的解决方法。
UASB厌氧生物反应器中的苯胺和对氨基苯磺酸下在反硝化条件下的命运Raquel Pereira, Luciana Pereira*, Frank P. van der Zee, M. Madalena Alves文章信息文章历史:收稿2010年3月31日在收到经修订的形式2010年6月22日2010年8月15日网上提供2010年8月25日关键词:生物降解芳香胺厌氧生物反应器脱氮摘要我们用两个升流式厌氧污泥床(USAB)去调查苯胺磺化酸在脱氮条件下的命运。
用料是由包含苯胺和对氨基苯磺酸的废水和挥发性脂肪酸所组成的。
挥发性脂肪用作初级电子接收器。
反应器1中包含一定化学计量数浓度的硝酸盐,反应器2中包含一定化学计量数的硝酸盐和亚硝酸盐混合物作为最终电子接收器。
反应器1的结果证实了苯胺在脱氮条件下会被降解,但对氨基苯磺酸会保留。
在反应器2中的流入溶液,由于亚硝酸盐的存在,促使了一个化学反应使芳香胺快速消失,同时生成一些黄色溶液。
对流入溶液进行HPLC分析,显示出3个产物峰,主要的一个是在滞留时间(Rt)为14.3min,两个次要的是在Rt为17.2和21.5min。
在污水中,Rt为14.3和17.2min的峰的强度十分低,而21.5min处的峰却增加到3倍。
根据质谱仪分析,我们提出一些和产物相似的一些化合物的结构,这些化合物主要都是含氮化合物。
脱氮活性鉴定显示出生物量是需要去适应有色产物的。
但是经过3天的迟滞期,活性会恢复,甚至最终的N2和N2O产量比对照组还要高。
1 介绍芳香胺是一种重要的工业化学物品。
它在自然界中是一种重要的资源,同时也是工业化学中重要的产品。
在油品精炼,多聚物分析,染料,粘合剂,橡胶,配药学,杀虫剂和炸药等领域有着重要的作用。
他的范围包括从最简单的苯胺到复杂的共轭芳香烃或是杂环结构和多重置换产物。
在有氧情况下,微生物会通过还原切割氮氮双键来生物分解含氮化合物从而产生芳香胺。
((Pinheiro et al., 2004; van der Zee and Villaverde, 2005)由于传统的污水处理技术不能处理它,不可避免的,它会保留在污水中,在处理过程中它潜在的毒性也需要考虑进去。
附录C:外文文献及其译文外文文献:Removal of Pharmaceuticals during Drinking Water Treatment The elimination of selected pharmaceuticals (bezafibrate, clofibric acid, carbamazepine, diclofenac) during drinking water treatment processes was investigated at lab and pilot scale and in real waterworks. No significant removal of pharmaceuticals was observed in batch experiments with sand under natural aerobic and anoxic conditions, thus indicating low sorption properties and high persistence with nonadapted microorganisms. These results were underscored by the presence of carbamazepine in bankfiltrated water with anaerobic conditions in a waterworks area. Flocculation using iron(III) chloride in lab-scale experiments (Jar test) and investigations in waterworks exhibited no significant elimination of the selected target pharmaceuticals. However, ozonation was in some cases very effective in eliminating these polar compounds. In labscale experiments, 0.5 mg/L ozone was shown to reduce the concentrations of diclofenac and carbamazepine by more than 90%, while bezafibrate was eliminated by 50% with a 1.5 mg/L ozone dose. Clofibric acid was stable even at 3 mg/L ozone. Under waterworks conditions, similar removal efficiencies were observed. In addition to ozonation, filtration with granular activated carbon (GAC) was very effective in removing pharmaceuticals. Except for clofibric acid, GAC in pilot-scale experiments and waterworks provided a major elimination of the pharmaceuticals under investigation.IntroductionIn Germany, some pharmaceuticals are used in quantities of more than 100 t/yr (1). Pharmacokinetic studies exhibit that an appreciable proportion of the administered pharmaceuticals are excreted via feces and urine (2) and thus are present in the domestic wastewater. A further source for the contamination of wastewater is assumed to be the disposal of (expired) medicine via toilets. However, this portion is very difficult to estimate because reliable data are not available. After passing through sewage treatment plants (STPs), pharmaceutical residues enter receiving waters. Point discharges from pharmaceutical manufacturers can also contribute to contamination of rivers and creeks (3). First results concerning environmental occurrence of pharma-ceuticals are reported by Garrison et al. (4) and Hignite and Azarnoff (5), who detected clofibric acid in the lower micrograms per liter range in treated sewage in the United States. Further studies in 1981 in Great Britain revealed that pharmaceuticals are present in rivers up to 1 íg/L (6). On Iona Island (Vancouver, Canada) Rogers et al. (7) identified the two antiphlogistics ibuprofen and naproxen in waste-water. Recent investigations showed the exposure of a wide range of pharmaceuticals from many medicinal classes (e.g,betablockers, sympathomimetics, antiphlogistics, lipid regu-lators, antiepileptics, antibiotics, vasodilators) to rivers and creeks. Reviews from Halling-Sørensen et al. (8), Daughton and Ternes (9), and Jørgensen et al. (10) summarize most of the literature in this new emerging field about the environ-mental relevance of pharmaceuticals.Furthermore, Mohle et al. (11), Alder et al. (12), Ternes et al. (3), and Zuccato et al. (13) have reported the identification of pharmaceuticals in the aquatic environment.Contamination is influenced by the relative portions of raw and treated wastewater (14) such that even small rivers and creeks can be highly contaminated. Groundwater is contaminated with pharmaceuticals primarily by infiltration of surface water containing pharmaceutical residues as well as by leaks in landfill sites and sewer drains. Because of the widespread occurrence of pharmaceuticals in the aquatic environment and sometimes also in the raw water of waterworks, a few cases surfaced where pharmaceuticals were detected in drinking water in the lower nanograms per liter range (15, 16). Although up to now no adverse health effects can be attributed to the consumption of pharmaceuticals at these low concentration levels, based on precautionary principles, drinking water should be free of such anthro-pogenic contaminants.Currently, few papers have been published dealing with the removal of pharmaceuticals in drinking water treatment. Ozonation and especially advanced oxidation processes seem to be very effective in removal of diclofenac, while clofibric acid and ibuprofen were oxidized in lab-scale experiments mainly by ozone/H2O2 as shown by Zwiener and Frimmel (17). Heberer et al. (18) exhibited that reverse osmosis is appropriate to remove a variety of different pharmaceuticals from highly contaminated surface waters.The objective of the work presented here was to study the efficiency of different treatment steps to remove the anti-phlogistic diclofenac, the antiepileptic carbamazepine, and the lipid regulators clofibric acid and bezafibrate during drinking water treatment. Therefore, the primary elimination of the selected pharmaceuticals was investigated under laboratory, pilot, and real waterworks conditions. In addition to processes such as bank filtration and artificial groundwater recharge, widely used techniques for surface water treatment such as activated carbon filtration, ozonation, and floccula-tion were investigated. The monitoring results of two German waterworks are extended by lab- and pilot-scale experiments to obtain more generalized results.ExperimentalSectionSelectedPharmaceuticals.For all lab- and pilot-scale spikingexperiments, four relevant pharmaceuticals (the antiphlo-gistic diclofenac, the antiepileptic carbamazepine, the lipid regulators clofibric acid and bezafibrate) have been selected as target compounds. Their molecular structures are shown in Table 1. These compounds have been chosen because of their predominant occurrence in German feeding waters for waterworks such as rivers, bank filtrates, and ground-water (14, 19). Additionally, the antiepileptic primidone was included in oxidation experiments and a waterworks survey.TABLE1.SelectedTargetPharmaceuticalsAnalyticalMethods.The determination of the pharma-ceuticals was performed using different analytical methods (see Table 2). All methods were based on a solid-phase extraction of the analytes on to RP-C18 or Lichrolute EN material. After solid-phase extraction (SPE) and an elution step with methanol or acetone, the compounds were derivatized using different agents. Either a methylation with diazomethane (20) or a silylation with a mixture of N,O-bis(trimethylsilyl)acetamide (BSA) and 5% trimethylchlo-rosilane (TMCS)(Fa. Fluka, Buchs, Schweiz) were used (60 min at 120 °C)(21). Carbamazepine was determined aftersilylation either by a mixture of MSTFA/TMSI/DTE(N-methyl-N-(trimethylsilyl) trifluoroacetamide/trimethylsilylim-idazol/dithioerytrit; 1000 íL/2 íL/2 íg)(22) or by a mixture of BSA/TMCS. For primidone, an acetylation by acetanhy-dride and ethanolamine was used (22). In all cases, GC-MS was used for the detection of the analytes. Further details of the methods are reported in refs 19-22.All methods enable the precise determination of the target pharmaceuticals in river water and drinking water. An interlaboratory comparison exercise (ICE) between the three participating laboratories at the beginning and the end of the study confirmed the quality of the analytical methods. Groundwater and surface water samples were spiked with the selected pharmaceuticals and analyzed by all three laboratories to confirm the recoveries of the analytes in the respective matrixes. The mean recovery of the spiked concentrations always exceeded 70% through different spiking levels:0.40-0.90 íg/L in surface water and 0.030-0.20 íg/L in drinking water. The relative standard deviations between the three participating laboratories were in general below 25%. Thus, it could be shown that (i) the difference of found concentrations was minor between the threelaboratories and (ii) the spiked concentration could be detected in the groundwater and surface water accuratel.LimitsofQuantification(LOQ)andCalibration.The LOQwas calculated according to the German DIN 32645 (23) with a confidence interval of 99% using the standard deviation of a linear regression curve. Calibration ranges from 0.005 to 0.050 íg/L and from 0.05 to 1 íg/L were used with at least seven concentration levels by spiking groundwater. LOQ is another term for limit of determination (LOD) mentioned in DIN 32645. Since the calculated LOQ values were always between the first and the second calibration points, the LOQ used was setas the second lowest calibration point of the linear correlation to ensure a precise quantification. Hence, the LOQ were at least 20 ng/L for diclofenac, carbamazepine, primidone, and clofibric acid and down to 50 ng/L for bezafibrate. However, with a final volume of 100 íL instead of 1 mL, LOQ down to 2 ng/L were achieved for clofibric acid, primidone, diclofenac, and carbamazepine and down to 10 ng/L for bezafibrate. The calibration was performed over the whole procedure after spiking groundwater with the standard mixture of the selected pharmaceuticals. The calculation of the concentrations in native samples was carried out using surrogate standards (see Table 2) and a linear 7-10 point calibration curve.ReferenceStandards.The reference standards clofibricacid, bezafibrate, carbamazepine, diclofenac,and primidone as well as the surrogate standards meclofenamic acid and 2,3-dichlorophenoxyacetic acid (2,3-D) were purchased from Sigma, Germany; dihydrocarbamazepine was purchased from Alltech, Germany. All standards were dissolved in methanol (1 mg/mL) and diluted with methanol to the final stock solution of 10 íg/mL.TreatmentProcessesUsedinWaterworks.(a)StudyofBiodegradationinBatchExperimentswi thNativeSurfaceWater, Groundwater, andDifferentFilterMaterials.Bio-degradation is one of the crucial factors that determine the elimination of organic compounds during artificial ground-water recharge and bank filtration. To assess the general biodegradability of pharmaceuticals in aquatic environmental matrixes, batch experiments were carried out according to the OECD guidelines for testing chemicals (24). The inoc-culum used consisted of 400 mL of surface water and 400 mL of groundwater mixed with 2 L of MITI basal medium. The MITI basal medium was prepared by mixing 1 L of sterile deionized water with 3 mL of sterilized solutions A-D. Solution A was a solution of 21.75 g of K2HPO4, 8.5 g of KH2PO4, 44.6 g of Na2HPO4â12H2O, and 1.7 g of NH4Cl in 1000 mL of deionized water at pH 7.2. Solutions B-D were solutions of 22.5 g of MgSO4â7H2O, 27.5 g of CaCl2, and 0.25 g of FeCl3, respectively, in 1000 mL of deionized water. The groundwater was taken from a German water catchment area with artificial groundwater recharge using slow sand filtration and bank filtration. The individual concentrations of bezafibrate, carbamazepine, clofibric acid, diclofenac, and ibuprofen were in the batch experiments adjusted to 0.1 and 100 íg/L. The batch experiments were exposed to either individual or a mixture of the selected pharmaceuticals. In stock solutions with ethanol, the concentrations of the tested pharmaceuticals were 0.5 mg/mL or 0.5 íg/mL, respectively. After being diluted (480 íL of stock solution in 2.4 L of culture solution), the concentration of ethanol in batch cultures was 0.02% (v:v). The cultures were always incubated in the dark for 28 d at 14 °C (in situ temperature). For anoxic conditions, 25 mg/L nitrate was added as an alternative electron acceptor. The bottles used were gastight. For aerobic sorption experi-ments, 400 g of sand or 400 g of gravel taken from the underground of a groundwater catchment area was used as inocculum and mixed with 2 L of MITI basal medium (solid phase/liquid phase ) 1:5). Sand that is also used for the slow sand filters of a waterworks consists of a mean grain size range of 0.2-0.6 mm. This filter material showed a moderate permeability with a K f coefficient of 4.3 10-4m/s. The gravel (natural aquifer sediment) was very heterogeneous with a predominant fraction of 2-10 mm grain size and a K f coefficient of 2.9 10-3m/s. Sterile controls (sterilization for 1 h) were prepared to differentiate between sorption and microbial degradation. The sand contains 3.2 mg/g iron and 0.056 mg/g manganese. Coatings with iron and manganese hydroxides were detected in the gravel but were not quanti-fied.Esterase activities were measured to control the physi-ological status of microbial communities during the incuba-tion of batch cultures. The hydrolysis of fluorescein diacetate (FDA) by esterase enzymes was determined according to the procedure of Schnu¨rer and Rosswall (25). A 20-íL volume of FDA solution (20 mg/10 mL acetone, stored at -18 °C) wasmixed with 3 mL of sample and 0.5 mL of HEPES buffer(0.1 M N-2-hydroxyethylpiperazine -N¢-2-ethansulfonic acid so-dium salt in deionized water, adjusted to pH 7.5; Merck). After being incubated (sterile conditions, 90 min at 20 °C, darkness), the fluorescein formation was immediately mea-sured with a Perkin-Elmer fluorescence spectrometer LC (excitation at 480 nm, emission at 505 nm).(b)Flocculation.For flocculation experiments in lab-scaleexperiments, a noncontinual procedure, the so-called “Jar test”, was performed. Spiking concentrations, stirring velocity, and reaction times were selected according to parameters of the two waterworks monitored in parallel. The lab device used consists of glass beakers (v) 2 L) with stator, a stirrer with standardized stirrer geometry, and defined submerged stirring depths. The stirring velocity was adjusted according to the mean velocity gradient (G value), which is proportional to the introduced energy and thus to the aggregation of colloids (26). Under stirring (rpm: 400 min-1), 0.1 mL of iron(III) chloride solution (40%) was added to 1.8 L of raw water (spiked with 1 ig/L pharmaceuticals). After a stirring time of 1 min, pH 7.5 was attained by adding Ca(OH)2(1 mol/L). Then, the aggregation to microflocs was achieved by stirring slowly for 20 min under 30 min-1. After sedimentation for 20 min, a sample was taken from under the water surface,and the turbidity was measured. These measurements showed that the turbidity was always below 1.5 turbidity units of formazine (TU/F).(c)ActivatedCarbonAdsorption.AdsorptionIsotherms.For the determination of the adsorption isotherms, the following parameters have been used:(i) 200 mL of deionized water or groundwater spiked with initial concentrations of 100 íg/L of the pharmaceuticals under investigation, (ii) pulverized granular activated carbon based on coal, (iii) quantities of activated carbon varied to achieve a final concentration of the pharmaceuticals in the solution that is at least 2 orders of magnitudes smaller than the initial one, (iv) small portions of activated carbon (<0.2 g/L) added as suspension, (v) batches with activated carbon tumbled in 250-mL flasks for 24 h, (vi) finally all samples were filtered with 0.45-ím polycarbonate filterand analyzed according to the analytical method described before. Evaluation of the isotherms was performed in double logarithmic scale ac-cording to Freundlich (27, 28). For a single compound, the Freundlich equation q)Kc n describes the relation between the loading q of the activated carbon and the equilibrium concentration c in the solution. K and n denote the Freundlich parameters.OperationofaGranulatedActivatedCarbon(GAC)Ad-sorberinPilotScale.A pilot plexiglass filter was operated indown flow mode to investigate the removal of the selected pharmaceuticals by GAC filtration. The empty bed contact time was about 10 min with a flow velocity of 10 m/h. The filter was filled with fresh granular carbon based on coal, which is often used in drinking water facilities. The filter was operated with groundwater from a waterworks, which was before aerated and filtered to remove iron precipitations. The influent was spiked with bezafibrate, carbamazepine, diclofenac, and clofibric acid. The pilot filter was operated for nearly 9 months. In intervals of 14 d, the concentrations of the pharmaceuticals were analyzed in the filter influent, at five different heights and in the final filter effluent at a bed depth of about 160 cm. The mean influent concentrations of the pharmaceuticals were 1.8 íg/L for clofibric acid, 1.0 íg/L for carbamazepine, 0.26íg/L for bezafibrate and 0.04íg/L for diclofenac. The different spiked concentrations weredue to the limited solubility of the target compounds in the feeding water.(d)Ozonation.In a lab-scale device, water was ozonatedin 2-L glass bottles by bubbling ozone through the samples in order to simulate real waterworks conditions. By varying the bubbling time, definite ozone doses in the range of 0.5-3.0 mg/L were introduced into the water. The water was continuously stirred at 900 rpm min-1. After a reaction time of 20 min, the remaining ozone was quenched by adding sufficient sodium thiosulfate solution (c) 2.2 g/L) to the sample. To determine the transferred ozone doses as a function of the bubbling time, Milli-Q water was ozonated, and the dissolved ozone was measured (external calibration of the ozone doses) according to DIN 38408 using N,N-diethyl-p-phenylendiamine (DPD) purchased from Sigma, Germany (29). The transferred ozone doses through the system into Milli-Q water was further confirmed by the indigo method (30). Flocculated water of a waterworks was spiked with the selected pharmaceuticals (dissolved in 50 íL of methanol) prior to ozonation. Afterwards the ozone was bubbled through the spiked water sample for specific times corresponding to desired ozone doses. The half-life of ozone in the post-flocculated water was approximately 12 min.Sampling Procedure.Water samples were collected inbrown glass bottles that had been prewashed with successive rinses of Milli-Q water and acetone and were dried for 8 h at 250 °C. Samples were either extracted immediately or stored at 4 °C for a maximum period of 3 d.Grab samples of the waterworks were taken before and after crucial treatment processes of two German waterworks with different treatment trains. All cooled water samples (4 °C) were analyzed as soon as possible (latest after 3 d).(e)TreatmentTrainsoftheSelectedWaterworks.Thefollowing treatment processes were applied in the two waterworks selected in the current study.WaterworksI(WW-I).Pre-ozonation (ozone dose: 0.7-1.0 mg/L; contact time: ca. 3 min), flocculation with iron(III) chloride, main ozonation (ozone dose: 1.0-1.5 mg/L; contact time: ca. 10 min), multiple layer filter, and a final GAC filtration.WaterworksII(WW-II).Sedimentation, flocculation withFeCl3/CaOH2, GAC filtration, underground passage, bank filtration, and slow sand filtration.ResultsandDiscussionStudyofBiodegradationinBatchExperimentswithNativeSurfaceWater, Groundwater, andFilterMaterials.Experi-ments with batch cultures could provide the first clues on the general potential for biodegradation of pharmaceuticals under different environmental conditions. The relative concentrations (C/C0) of the spiked pharmaceuticals in the batch experiments with surface water and groundwater were nearly constant during the whole exposure time of 28 d (Table 3). All variations of elimination rates were within the relative standard deviation (RSD), which was between 6 and 39%.Thus, it can be ruled out that significant sorption effects and biodegradation occurred in the waters and materials used under anoxic and aerobic conditions. These results suggest that the sorption properties of the selected phar-maceuticals can be expected to be low and that their persistence should be relatively high under real conditions such as slow sand filtration or subsoil passage. However, in complex habitats, the bioavailability and the sorption behavior are determined by various biotic and abiotic parameters that were not simulated in the described batch cultures. Parameters such as the species and physiological status of occurringmicroorganisms, the percentage of humic substances, percentage of iron and manganese hydroxides, pH, etc. can differ significantly according to the actual field conditions. The standardized test used according to the OECD guidelines (24), delivers comparable results for the biode-gradability of substances but cannot be transferred to all natural conditions and account for the various parameters. Therefore, on the basis of the described results, (bio)-degradation or sorption of the selected pharmaceuticals under field conditions cannot be ruled out in general, but they should be relatively low. Sorption of the selected pharmaceuticals on iron hydroxides seems to be insignificant since in the flocculation experiments with precipitated iron hydroxides no reduction of the spiked concentrations was found (see flocculation section below). Furthermore, it was observed that the established microbial activity in the test system was high enough for degradation of dissolved organic matter (DOC) and could not be inhibited by the spiked pharmaceuticals as it can be seen by the esterase activity (Figure 1).RemovalafterFlocculationwithIron(III)Chloride.Floc-culation in lab-scale (Jar test) with iron(III) chloride exhibited no significant elimination of the pharmaceuticals from raw water. The relative concentration levels (C/C0) after floc-culation were 96 ( 11% for diclofenac, 87 ( 10% for clofibric acid, 111 ( 15% for bezafibrate, 87 ( 12% for carbamazepine, and 110 ( 14% for primidone. Thus, c/c0 of the spiked compounds varied without exception within the RSD. The transference of these results from lab-scale to waterworks conditions was shown by a monitoring of up-scaled floc-culation processes in two waterworks (WW-I, WW-II; see section below: behavior in waterworks) yielding similar results.ActivatedCarbonAdsorption.AdsorptionIsotherms.Theassessment of the adsorption properties of single compounds onto activated carbon is often performed by recording adsorption isotherms. Freundlich adsorption isotherms with fresh activated carbon were performed for each of the four selected pharmaceuticals. The isotherms are given in Figure 2. Bezafibrate, carbamazepine, and diclofenac exhibited over the whole concentration range (0.1-100 íg/L) a higher activated carbon loading q than did clofibric acid. Hence, clofibric acid has the lowest sorption affinity on activated carbon. In addition to the selected pharmaceuticals, the isotherm of tetrachloroethene is shown in Figure 2. Tetra-chloroethene was used because its removal by adsorption onto activated carbon in full-scale treatment plants is known to be efficient (31). In a concentration range below 10 íg/L, the isotherms of the pharmaceuticals selected exhibited higher loads on carbon as compared to tetrachloroethene. Thus, it can be concluded that the four selected pharma-ceuticals can be removed efficiently under real conditions by activated carbon filtration in waterworks.Nevertheless, sorption efficiencies are always relying on the competition with other occurring organic compounds. As expected, the adsorption capacity for the pharmaceuticals is lower on activated carbon if other compounds such as natural organic substances compete for the adsorption sites. That can be underscored by a comparison of the Freundlich parameters for the adsorption with deionized water and with natural groundwater (DOC ) 2.0 mg/L; SAC at 254 nm ) 5.8 m-1) given in Table 4. The shift toward lower K values is equivalent to a lower sorption capacity. Especially for clofibric acid the slope of the isotherm (n value) is relatively high in groundwater, which can be interpreted as a low adsorption capacity in the low concentration range. On the basis of the isotherms with natural groundwater, it can be expected that the capacity reduction of activated carbon might be signifi-cant due to competitive adsorption of natural groundwater constituents. Hence, the adsorption capacity of the activated carbon in a fixed bed adsorber in waterworks is expected to be lower for pharmaceuticals than in the isotherm experi-ments performed with deionized water.GACFiltrationinPilotScale.In pilot-scale experiments,an activated carbon adsorber filled with activated carbon was operated according to the previous description. The breakthrough curves in different filter bed depths of about 80 cm and 160 cm (end of filter) are shown in Figures 3 and 4. These results coincide very well with the data of the isotherm tests listed in Table 4. Carbamazepine showed the highest adsorption capacity of the selected pharma-ceuticals and can be removed at a specific throughput of about 50 m3/kg in a carbon layer of 80 cm and more than 70 m3/kg in a layer of 160 cm even at a relatively high initial concentration of about 1 íg/L. Clofibric acid, with an initial concentration of about 1,8 íg/L, showed a significantly lower adsorption capacity in the isotherm test and in the pilot-scale experiment. An initial breakthrough of clofibric acid could be observed at a height of 80 and 160 cm at a specific throughput of 10 and 17 m3/kg, respectively. Although lower adsorption capacities in the isotherm test are observed for bezafibrate and diclofenac as compared to carbamazepine, both compounds were removed in a bed depth of 160 cm to a specific throughput of at least 70 m3/kg. The differences between the results obtained in isotherm and the pilot plant experiments might be influenced by the lower initial con-centrations applied in the pilot plant experiments Ozonation.For lab-scale ozonation experiments, floc-culated WW-II water was used. The DOC of the flocculated water was 1.3 mg/L, the pH was 7.8, alkalinity was 2 mmol/L, and temperature was 23°C. The initial concentration of the pharmaceuticals under investigation was 1 íg/L. The ef-ficiency of the ozonationprocess for the removal of the pharmaceuticals turned out to be very product specific. At a small ozone dose of 0.5 mg/L, the concentrations of diclofenac and carbamazepine were reduced by more than 97% while clofibric acid decreased by only 10-15% for the same ozone dose (Figure 5). Even extremely high ozone doses up to 2.5-3.0 mg/L led to a reduction of e40% for clofibric acid. Primidone and bezafibrate were reduced by 50% at ozone concentrations of about 1.0 and 1.5 mg/L, respectively. While applying 3.0 mg/L ozone, still 10% of primidone and 20% of bezafibrate remained. Because of the presence of methanol (used for dissolving the spiked pharmaceuticals), ozone was partly transformed into OH radicals. Thus, the direct ozone reaction was probably underestimated, and the oxidation efficiency under waterworks conditions should be even slightly higher than found in lab scale. Although we did no additional work to elucidate the reactivity of the selected pharmaceuticals with ozone or OH radicals, we can rational-ize these observations based on the chemical structures (Table 1). The reactivity of diclofenac and carbamazepine with ozone is expected to be very high. Rate constants k O3> 105 M-1 s-1 can be expected for deprotonated secondary aromatic amines (diclofenac) and molecules containing nonaromatic double bonds (carbamazepine)(32, 33). For diclofenac, a main oxidation product was detected with a mass spectrum showing an increase of the molecular weight of 16 amu, which is an evidence for substitution of a hydrogen by a hydroxy moiety. A hydroxylation of the secondary amino group is likely but has to be confirmed (e.g., by NMR). Because of missing active sites susceptible to ozone attack (34), reactions of ozone with clofibric acid are expected to be very slow. Thus, OH radical reactions should be predominant with k OH 5 109 M-1 s-1(35). Considering the OH radical activity taken from the prediction for clofibric acid, ozone rate constants for bezafibrate and primidone should result in the middle range (k O3 102-103 M-1 s-1). The reactivity of these pharmaceuticals with ozone can be based on their reactive mono- and disubstituted benzene rings (32). It has to be noted that in the current study only the primary target degradation was investigated, thus further research is es-sential to identify and confirm the structures of metabolites formed by ozonation and to clarify the kinetic behavior.。
. . .专业. .专注. 本科毕业设计 外文文献及译文 文献、资料题目:Sealed building drainage
and vent systems 文献、资料来源:国道数据库
文献、资料发表(出版)日期:2016.6 院 (部):市政与环境工程学院 专 业: 给水排水工程 班 级:水工122
姓 名:涛
学 号: 指导教师:谭凤训 . . .专业. .专注. 翻译日期: 2016.6 . .
.专业. .专注. 外文文献: Sealed building drainage and vent systems —an application of active air pressure transient control and suppression Abstract The introduction of sealed building drainage and vent systems is considered a viable proposition for complex buildings due to the use of active pressure transient control and suppression in the form of air admittance valves and positive air pressure attenuators coupledwith the interconnection of the network's vertical stacks. This paper presents a simulation based on a four-stack network that illustrates flow mechanisms within the pipework following both appliance discharge generated, and sewer imposed, transients. This simulation identifies the role of the active air pressure control devices in maintaining system pressures at levels that do not deplete trap seals. Further simulation exercises would be necessary to provide proof of concept, and it would be advantageous to parallel these with laboratory, and possibly site, trials for validation purposes. Despite this caution the initial results are highly encouraging and are sufficient to confirm the potential to provide definite benefits in terms of enhanced system security as well as increased reliability and reduced installation and material costs. Keywords:Active control; Trap retention; Transient propagation Nomenclature C+-——characteristic equations c——wave speed, m/s D——branch or stack diameter, m f——friction factor, UK definition via Darcy Δh=4fLu2/2Dg g——acceleration due to gravity, m/s2 K——loss coefficient . . .专业. .专注. L——pipe length, m p——air pressure, N/m2 t——time, s u——mean air velocity, m/s x——distance, m γ——ratio specific heats Δh——head loss, m Δp——pressure difference, N/m2 Δt——time step, s Δx——internodal length, m ρ——density, kg/m3 Article Outline Nomenclature 1. Introduction—air pressure transient control and suppression 2. Mathematical basis for the simulation of transient propagation in multi-stack building drainage networks 3. Role of diversity in system operation 4. Simulation of the operation of a multi-stack sealed building drainage and vent system 5. Simulation sign conventions 6. Water discharge to the network 7. Surcharge at base of stack 1 8. Sewer imposed transients 9. Trap seal oscillation and retention 10. Conclusion—viability of a sealed building drainage and vent system 1.Air pressure transients generated within building drainage and vent systems as a natural consequence of system operation may be responsible for trap seal depletion and cross contamination of habitable space [1]. Traditional modes of trap seal protection, based on the Victorian engineer's obsession with odour exclusion [2], [3] and [4], depend predominantly on passive solutions where reliance is placed . . .专业. .专注. on cross connections and vertical stacks vented to atmosphere [5] and [6]. This approach, while both proven and traditional, has inherent weaknesses, including the remoteness of the vent terminations [7], leading to delays in the arrival of relieving reflections, and the multiplicity of open roof level stack terminations inherent within complex buildings. The complexity of the vent system required also has significant cost and space implications [8]. The development of air admittance valves (AAVs) over the past two decades provides the designer with a means of alleviating negative transients generated as random appliance discharges contribute to the time dependent water-flow conditions within the system. AAVs represent an active control solution as they respond directly to the local pressure conditions, opening as pressure falls to allow a relief air inflow and hence limit the pressure excursions experienced by the appliance trap seal [9]. However, AAVs do not address the problems of positive air pressure transient propagation within building drainage and vent systems as a result of intermittent closure of the free airpath through the network or the arrival of positive transients generated remotely within the sewer system, possibly by some surcharge event downstream—including heavy rainfall in combined sewer applications. The development of variable volume containment attenuators [10] that are designed to absorb airflow driven by positive air pressure transients completes the necessary device provision to allow active air pressure transient control and suppression to be introduced into the design of building drainage and vent systems, for both ‘standard’ buildings and those requiring particular attention to be paid to the security implications of multiple roof level open stack terminations. The positive air pressure attenuator (PAPA) consists of a variable volume bag that expands under the influence of a positive transient and therefore allows system airflows to attenuate gradually, therefore reducing the level of positive transients generated. Together with the use of AAVs the introduction of the PAPA device allows consideration of a fully sealed building drainage and vent system. Fig. 1 illustrates both AAV and PAPA devices, note that the waterless sheath