HVDC系统仿真模型
- 格式:pdf
- 大小:832.84 KB
- 文档页数:9
论文初稿海上风能具有风速大、较稳定等特点,但是海上风电场与电网的连接距离远,容量大,因此采用直流输电具有一定的优势。
基于电压源换流器(VSC)的高压直流输电(HVDC)能够实现有功功率和无功功率的灵活控制,广泛应用于远距离、大容量输电、交流系统连接和电力系统潮流控制等方面。
基于VSC的HVDC技术有别于基于电流型相控技术的传统高压直流输电,它是一种基于全控型电力电子器件(如绝缘栅双极型晶体管、可关断晶闸管等)和脉冲宽度调制(PWM)的新型直流输电技术。
该技术能够有效解决传统HVDC中存在的换向困难、谐波含量多及占地面积大等缺点。
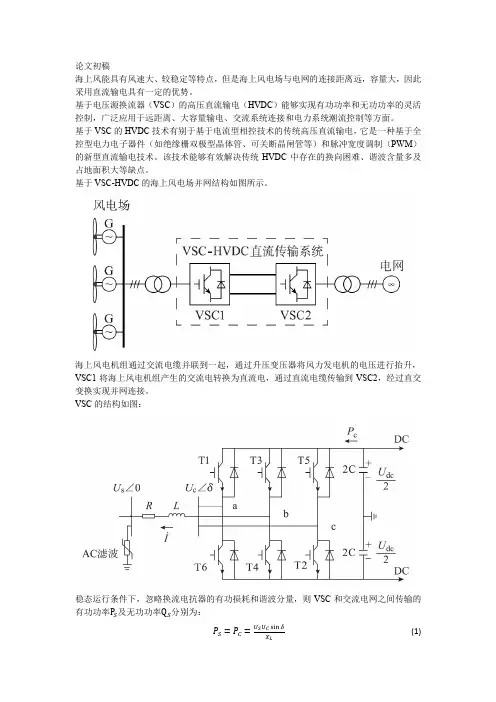
基于VSC-HVDC的海上风电场并网结构如图所示。
海上风电机组通过交流电缆并联到一起,通过升压变压器将风力发电机的电压进行抬升,VSC1将海上风电机组产生的交流电转换为直流电,通过直流电缆传输到VSC2,经过直交变换实现并网连接。
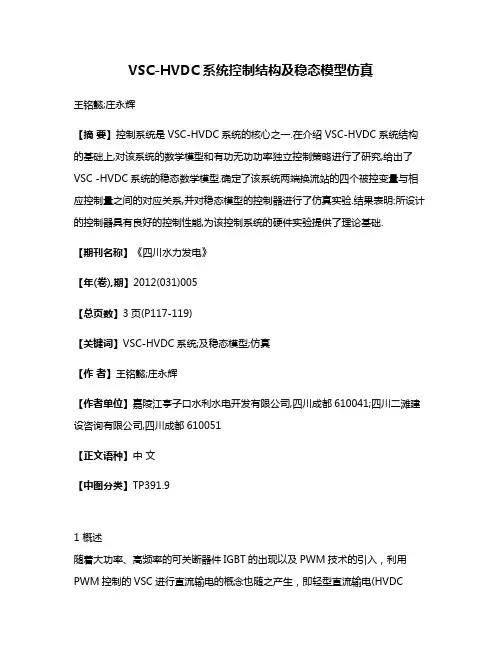
VSC的结构如图:稳态运行条件下,忽略换流电抗器的有功损耗和谐波分量,则VSC和交流电网之间传输的有功功率P S及无功功率Q S分别为:P S=P C=U S U C sinδ(1)X LQ S=U S(U C cosδ−U S)(2)X L式中:U C为VSC输出电压的基波分量;U S为交流母线电压基波分量;δ为U C与U S的相角差;X L为换流电抗器的电抗。
在式(1)、式(2)中,X L和U S为常数,其值不变。
当δ>0时,VSC吸收有功功率;当δ<0时,VSC 发出有功功率。
无功功率主要取决于(U C cosδ−U S),当(U C cosδ−U S)<0时,VSC发出无功功率;当(U C cosδ−U S)>0时,VSC吸收无功功率。
因此,通过对δ的控制就可以控制直流电流的方向及输送功率的大小,VSC系统还可以发或吸收一定无功功率,能够起到静止同步补偿器(STATOM)的作用,动态补偿交流母线的无功功率。
仿真分析为验证VSC-HVDC控制系统,按照图1在Matlab的Simulink环境下建立VSC-HVDC系统和控制系统模型。
VSC-HVDC系统控制结构及稳态模型仿真王铭懿;庄永辉【摘要】控制系统是VSC-HVDC系统的核心之一.在介绍VSC-HVDC系统结构的基础上,对该系统的数学模型和有功无功功率独立控制策略进行了研究,给出了VSC -HVDC系统的稳态数学模型.确定了该系统两端换流站的四个被控变量与相应控制量之间的对应关系,并对稳态模型的控制器进行了仿真实验.结果表明:所设计的控制器具有良好的控制性能,为该控制系统的硬件实验提供了理论基础.【期刊名称】《四川水力发电》【年(卷),期】2012(031)005【总页数】3页(P117-119)【关键词】VSC-HVDC系统;及稳态模型;仿真【作者】王铭懿;庄永辉【作者单位】嘉陵江亭子口水利水电开发有限公司,四川成都610041;四川二滩建设咨询有限公司,四川成都610051【正文语种】中文【中图分类】TP391.91 概述随着大功率、高频率的可关断器件IGBT的出现以及PWM技术的引入,利用PWM控制的VSC进行直流输电的概念也随之产生,即轻型直流输电(HVDCLight,亦称 VSC-HVDC)技术。
VSC-HVDC采用脉宽调制(PWM)控制技术,以全控型的功率器件如IGBT等作为开关器件,使得VSC-HVDC具有可独立调节有功和无功功率的优点,可以向无源网络送电,克服了传统HVDC的固有缺陷,把HVDC的优势扩展到配电网,极大地拓宽了HVDC的应用范围,在远距离、大功率输电、海底电缆送电、不同额定频率或相同额定频率交流系统之间的非同步联网等方面得到了广泛应用,具有广阔的应用前景。
2 VSC-HVDC系统结构及运行原理典型的三相二电平VSC结构如图1所示。
忽略谐波分量,抽流器吸收的有功功率和感性无功功率分别为:图1 电压源换流器示意图式中 Us为交流母线线电压基波分量;Uc为换流器输出电压的线电压基波分量;X为换流电抗器的等效电抗;δ为换流器输出基波电压滞后交流母线基波电压的相角。
基于向无源系统供电的VSC-HVDC输电系统仿真分析从振摘要:本文通过对VSC-HVDC系统向无源网络系统供电的仿真分析,并引入了滑膜控制策略,通过对非线性系统的线性化解耦,实现有功功率和无功功率独立控制,提升了系统控制的稳态性,通过Matlab/Simulink的仿真结果表明本文所提出的控制策略具有较好的动态性能。
关键词: VSC-HVDC;相对阶;滑膜变结构0引言近年来随着大功率电力电子技术的发展,电压源换流技术的高压直流输电(VSC-HVDC)获得了新的进展。
ABB首先提出了VSC-HVDC输电技术,并且已经得到了实际的应用,目前在法国、瑞典、挪威等多个国家建立了VSC-HVDC工程。
瑞典ABB公司电压源换流器的高压直流输电技术较为成熟,目前电压源换流器的高压直流输电传输的功率达到350MW,直流电压达到150KW,直流电流大于700A。
国外第一个投入商业运用的基于电压源换流器的高压直流输电是在瑞典进行的,就是将Gotland的风能发电通过地下电缆送到Visby,传输容量为50MW,传输线路的长度为70KM,在随后的几年内,基于电压源型换流器的高压直流输电在世界各地得到推广和应用VSC-HVDC输电系统的VSC可以工作在无源逆变方式并实现自我关断,不需要外加换向电压,克服了传统的HVDC受电端是有源网络的根本缺陷,消除了发生换向失败的可能性,使用VSC-HVDC为远距离的孤立负荷输电提供了可能性。
VSC-HVDC系统向无源网络供电主要应用在两个方面,一方面是作为小型的电厂向远距离负荷供电,另一个方面是用在向一些偏远的负荷比较小的小城镇供电,由于其输电距离超出了交流输电技术性和经济性的可行范围,且传统的HVDC不能向无源网络供电。
所以从技术角度上看,VSC-HVDC是向远距离负荷供电的理想选择,而从经济角度上看,VSC-HVDC的经济输电范围比较广泛,也是完全符合要求的。
所以,无论是从技术上还是从经济上,VSC-HVDC都是向远距离负荷供电的一种理想选择。
Detailed Modeling of CIGRÉHVDC Benchmark System Using PSCAD/EMTDC and PSB/SIMULINK M.O.Faruque,Student Member,IEEE,Yuyan Zhang,and Venkata Dinavahi,Member,IEEEAbstract—This paper focuses on a comparative study of the mod-eling and simulation of thefirst CIGRÉHVDC benchmark system using two simulation tools PSCAD/EMTDC and PSB/SIMULINK; an interface between them(PSCAD-SIMULINK)has also been im-plemented and used as a simulator.The CIGRÉHVDC system and its controller has been carefully modeled in all three simulation environments so that the differences are parison of steady-state and transient situations have been carried out,and a high degree of agreement in most of the cases has been observed. Index Terms—HVDC transmission,modeling,simulation.I.I NTRODUCTIONT HE DESIGN,analysis,and operation of complex ac-dc systems require extensive simulation resources that are accurate and reliable.Analog simulators,long used for studying such systems,have reached their physical limits due to the increasing complexity of modern systems.Currently,there are several industrial grade digital time-domain simulation tools available for modeling ac-dc power systems.Among them,some have the added advantages of dealing with power electronics apparatus and controls with more accuracy and efficiency.PSCAD/EMTDC[1]and PSB/SIMULINK[2]are such two simulators that are being increasingly used in the industry as well as in the universities.Both programs allow the user to construct schematic diagram of electrical networks, run the simulation,and produce the results in a user-friendly graphical environment.Furthermore,several real-time digital simulators use models or the graphical front-end that are similar to PSCAD/EMTDC and PSB/SIMULINK.The objective of this paper is to report a detailed compar-ison between PSCAD/EMTDC and PSB/SIMULINK for the modeling and simulation of ac-dc power systems.In a digital simulator,the system model and the algorithm used to solve that model directly affect the accuracy and consistency of the sim-ulation results.Therefore,based on the objective of the study, careful attention should be given to the selection of the model, the numerical solver,and the algorithm.A comparative study among simulation tools will help in identifying the pros and cons that the programs inherit.For the last two decades,digital simulators have been widely used for the simulation of HVDCManuscript received September1,2004;revised December4,2004.This work was supported by the Natural Sciences and Engineering Research Council (NSERC)of Canada and the University of Alberta.Paper no.TPWRD-00406-2004.The authors are with the Electrical and Computer Engineering Depart-ment,University of Alberta,Edmonton,AB T6G2V4,Canada(e-mail: faruque@ece.ualberta.ca;yuyan@ece.ualberta.ca;dinavahi@ece.ualberta.ca). Digital Object Identifier10.1109/TPWRD.2005.852376and its control system.However,to compare the performance of any two simulators,similar circuit topology with control is a prerequisite.To achieve that goal,a benchmark system for HVDC,known as the CIGRÉBenchmark Model,was proposed in1985[3].It provided a common reference system for HVDC system ter in1991,a comparison of four digital models has been carried out by the CIGRÉWorking Group[4],[5],and a benchmark system for HVDC control study was also proposed.A detailed comparison between ATP and NETOMAC for the simulation of HVDC system wasfirst reported in[6],where the fundamental differences between the two software and their effects on simulation results have been discussed.The study found a good agreement between the two simulation results.More recently,custom power con-trollers such as DSTATCOM and DVR have been simulated [7]using PSCAD/EMTDC and SIMULINK to compare their performance.However,for a rigorous comparison between simulation tools and to gain insight into their capabilities and limitations,the modeled system should be able to offer the highest degree of difficulty.The main motivation for using the CIGRÉBenchmark HVDC System in this paper is that not only is it a widely used test system but also it is complex enough, with deliberate difficulties introduced for a comprehensive performance evaluation of the two simulation tools.Section II of this paper gives a brief introduction about the two simulation tools highlighting their solution techniques, and Section III introduces the CIGRÉHVDC benchmark system.Sections IV–VI present the detailed model of HVDC system and its controller in three simulation environments: PSCAD/EMTDC,PSB/SIMULINK,and PSCAD-SIMULINK interface.Results are presented in Section VII,followed by conclusions in Section VIII.II.PSCAD/EMTDC AND PSB/SIMULINK PSCAD/EMTDC is a powerful time-domain transient sim-ulator for simulating power systems and its controls.It uses graphical user interface to sketch virtually any electrical equip-ment and provide a fast andflexible solution.PSCAD/EMTDC represents and solves the differential equations of the entire power system and its control in the time domain(both elec-tromagnetic and electromechanical systems)[8].It employs the well-known nodal analysis technique together with trapezoidal integration rule withfixed integration time-step.It also uses in-terpolation technique with instantaneous switching to represent the structural changes of the system[9],[10].MATLAB/SIMULINK is a high-performance multifunc-tional software that uses functions for numerical computation,0885-8977/$20.00©2006IEEEFig.1.Single-line diagram of the CIGRÉbenchmark HVDC system.system simulation,and application development.Power System Blockset(PSB)is one of its design tools for modeling and simulating electric power systems within the SIMULINK environment[2],[11].It contains a block library with common components and devices found in electrical power networks that are based on electromagnetic and electromechanical equations.PSB/SIMULINK can be used for modeling and simulation of both power and control systems.PSB solves the system equations through state-variable analysis using either fixed or variable integration time-step.The linear dynamics of the system are expressed through continuous or discrete time-domain state-space equations.It also offers theflexibility of choosing from a variety of integration algorithms.III.F IRST CIGRÉHVDC B ENCHMARK S YSTEMThefirst CIGRÉHVDC benchmark system shown in Fig.1 was proposed in[3].The system is a mono-polar500-kV, 1000-MW HVDC link with12-pulse converters on both rec-tifier and inverter sides,connected to weak ac systems(short circuit ratio of2.5at a rated frequency of50Hz)that provide a considerable degree of difficulty for dc controls.Damped filters and capacitive reactive compensation are also provided on both sides.The power circuit of the converter consists of the following subcircuits.A.AC SideThe ac sides of the HVDC system consist of supply net-work,filters,and transformers on both sides of the converter. The ac supply network is represented by a Thévénin equivalent voltage source with an equivalent source impedance.ACfilters are added to absorb the harmonics generated by the converter as well as to supply reactive power to the converter.B.DC SideThe dc side of the converter consists of smoothing reactors for both rectifier and the inverter side.The dc transmission line is represented by an equivalent T network,which can be tuned to fundamental frequency to provide a difficult resonant condition for the modeled system.C.ConverterThe converter stations are represented by12-pulse configura-tion with two six-pulse valves in series.In the actual converter, each valve is constructed with many thyristors in series.Each valve hasa limiting inductor,and each thyristor has par-allel RC snubbers.IV.CIGRÉHVDC S YSTEM M ODEL IN PSCADThe full three-phase model of the CIGRÉHVDC benchmark system is available as an examplefile in PSCAD/EMTDC Ver-sion4.0.1.Data for the CIGRÉHVDC benchmark system[4],[5]is given in Table V.A.Power Circuit Modeling1)Converter Model:The converters(rectifier and inverter) are modeled using six-pulse Graetz bridge block,which in-cludes an internal Phase Locked Oscillator(PLO),firing and valve blocking controls,andfiringangle/extinctionangle measurements.It also includes built-in RC snubber circuits for each thyristor.Thyristor valves are modeled as ideal devices, and therefore,negative turn-off andfiring due tolargeor are not considered.2)Converter Transformer Model:Two transformers on the rectifier side are modeled by three-phase two winding trans-former,one with grounded Wye–Wye connection and the other with grounded Wye–Delta connection.The model uses satura-tion characteristic and tap setting arrangement.The inverter side transformers use a similar model.3)DC Line Model:The dc line is modeled using an equiva-lent-T network with smoothing reactors inserted on both sides.4)Supply Voltage Source:The supply voltages on both rec-tifier and inverter sides have been represented through three-phase ac voltage sources.5)Filters and Reactive Support:Tunedfilters and reactive support are provided at both the rectifier and the inverter ac sides,as shown in Fig.1.B.Control System ModelThe control model mainly consistsof measurements and generation offiring signals for both the rectifier and inverter. The PLO is used to build thefiring signals.The output signal of the PLO is a ramp,synchronized to the phase-A commutatingbus line-to-ground voltage,which is used to generate the firing signal for Valve 1.The ramps for other valves are generated by adding 60to the Valve 1ramp.As a result,an equidistant pulse is realized.The actual firing time is calculated by comparingthe order to the value of the ramp and using interpolation [10]technique.At the same time,if the valve is pulsed but its voltage is still less than the forward voltage drop,this model has a logic to delay firing until the voltage is exactly equal to the forward voltage drop.The firing pulse is maintained across each valve for 120.Theand measurement circuits use zero-crossing informa-tion from commutating bus voltages and valve switching times and then convert this time difference to an angle (using mea-sured PLO frequency).Firingangle (in seconds)is the time when valve turns on minus the zero crossing time for valve .Extinctionangle (in seconds)for valve is the time at which the commutation bus voltage for valve crosses zero (negative to positive)minus the time valve turns off.The control schemes for both recti fier and inverter of the CIGR ÉHVDC system are available in the example file in PSCAD/EMTDC Version 4.0.1.Following are the controllers used in the control schemes:•ExtinctionAngleController;•dc Current Controller;•V oltage Dependent Current Limiter (VDCOL).1)Rectifier Control:The recti fier control system uses Con-stant Current Control (CCC)technique.The reference for cur-rent limit is obtained from the inverter side.This is done to en-sure the protection of the converter in situations when inverter side does not have suf ficient dc voltage support (due to a fault)or does not have suf ficient load requirement (load rejection).The reference current used in recti fier control depends on the dc voltage available at the inverter side.Dc current on the recti fier side is measured using proper transducers and passed through necessary filters before they are compared to produce the error signal.The error signal is then passed through a PI controller,which produces the necessary firing angleorder .The firing circuit uses this information to generate the equidistant pulses for the valves using the technique described earlier.2)Inverter Control:The Extinction Angle Controlor con-trol and current control have been implemented on the inverter side.The CCC with V oltage Dependent Current Order Limiter (VDCOL)have been used here through PI controllers.The ref-erence limit for the current control is obtained through a com-parison of the external reference (selected by the operator or load requirement)and VDCOL (implemented through lookup table)output.The measured current is then subtracted from the reference limit to produce an error signal that is sent to the PI controller to produce the required angle order.The control uses another PI controller to produce gamma angle order for the inverter.The two angle orders are compared,and the minimum of the two is used to calculate the firing instant.V .CIGR ÉHVDC S YSTEM M ODEL IN PSBThe CIGR ÉHVDC system model developed using PSB/SIMULINK Version 6.5release 13is shown in Fig.9.To implement this model,a total of 106states,37inputs,112outputs,and 31switches were used.A.Power Circuit ModelingThe recti fier and the inverter are 12-pulse converters con-structed by two universal bridge blocks connected in series.The converter transformers are modeled by one three-phase two winding transformer with grounded Wye –Wye connection,the other by three-phase two winding transformer with grounded Wye –Delta connection.The converters are interconnected through a T-network.1)Universal Bridge Block:The universal bridge block im-plements a universal three-phase power converter that consists of six power switches connected as a bridge.The type of power switch and converter con figuration can be selected from the di-alog box.Series RC snubber circuits are connected in parallel with each switch device.The vector gating signals are six-pulse trains corresponding to the natural order of commutation.Theand measurements are not realized in this model.2)Three Phase Source:A three-phase ac voltage source in series with a R-L combination is used to model the source,and its parameters are set as in Table V .3)Converter Transformer Model:The three-phase two winding transformers models have been used where winding connection and winding parameters can be set through mask parameters.The tap position is at a fixed position determined by a multiplication factor applied on the primary nominal voltage of the converter transformers (1.01on recti fier side;0.989on inverter side).The saturation has been simulated.The saturation characteristic has been speci fied by a series of current/flux pairs (in p.u.)starting with the pair (0,0).The dc line,ac filters,and reactive support are similar to the ones used in the PSCAD/EMTDC model.B.Control System ModelThe control blocks available in SIMULINK have been used to emulate the control algorithm described in Section IV-B,and enough care has been taken to ensure that exact parameters as in PSCAD/EMTDC simulation are used.Some control param-eters required conversion to their proper values due to differ-ences in units.The recti fier side uses current control with a ref-erence obtained from the inverter VDCOL output (implemented through a lookup table),and the inverter control has both cur-rent controland control operating in parallel,and the lower output of the two is used to generate the firing pulses.Unlike PSCAD/EMTDC,theangle is not provided directly from the converter valve data.It needed to be implemented through mea-surements taken from valve data.The control block diagrams are shown in Fig.2.VI.PSCAD-SIMULINK I NTERFACEPSCAD Version 4.0.1has the capability of interfacing with MATLAB/SIMULINK commands and toolboxes through a special interface.MATLAB programs or block-sets that would be interfaced,with PSCAD needing to be designed and saved as a MATLAB program file or as a SIMULINK block file.Then,a user-de fined block must be provided in PSCAD,with the neces-sary inputs and outputs,to interface the MATLAB/SIMULINK file.In this paper,the power circuit of CIGR ÉHVDC system has been modeled in the PSCAD/EMTDC environment whileFig.2.CIGR ÉHVDC control system in SIMULINK.(a)Recti fier control.(b)Gamma measurement.(c)Inverter control.the control system has been modeled using block-sets from PSB and the SIMULINK Control Library.An interfacing block has been created in PSCAD/EMTDC that linked the SIMULINK files through FORTRAN scripts de fined within the block.A reverse scenario,where the power circuit is mod-eled in PSB/SIMULINK and the control system is modeled in PSCAD/EMTDC,is also feasible.Fig.3shows the block diagram of PSCAD-SIMULINK interface used to simulate CIGR ÉHVDC system.The time step used for the simulation is50;the two programs exchange information between them continuously at every time step.VII.S IMULATION R ESULTSWith the goal of performing a rigorous comparative study among the simulation tools,the CIGR ÉHVDC system has been simulated in three environments:1)using PSCAD/EMTDC only;2)using PSB/SIMULINK only;3)using the PSCAD-SIMULINK Interface.Steady-state and transient results (created through various faults)were recorded and then compared.The comparison reveals a high degree of similarity among the results obtained through the three simulation environments with minor discrep-ancies.A.Steady StateFor steady-state analysis,the system has been simulated for a duration of 2s in all three simulation environments.There were some initial transients that subsided within about 0.5s and the system reached steady state.1)DC Voltages and Currents:Fig.4shows the results where the first column is produced by PSCAD/EMTDC,the second from PSB/SIMULINK,and the third by the PSCAD-SIMULINK interface.Row-wise,the first row shows the recti fier dc voltage produced by the three simulation tools;the second and fourth row are the magni fied view of dc voltages on both the recti fier and inverter side;the third and fifthrowFig.3.PSCAD-SIMULINK interface.show the harmonic spectrum.The following observations can be made from Fig.4.•For both inverter and recti fier,the dc voltages show small oscillations around the reference value (1p.u);however,they are almost identical,except for minor differences at start-up.During initialization,PSCAD/EMTDC and PSCAD-SIMULINK interface do not show any negative dc voltage,whereas PSB/SIMULINK shows a negativetransientp.u .However,all three simulation tools have produced identical waveforms in terms of phase and magnitude in steady state,and there is hardly any discrep-ancy among them.The zoomed view of their steady-state waveforms re flects that fact.•The mean of output dc voltage produced by PSCAD/EMTDC and PSCAD-SIMULINK interface falls short of reference outputs by (1–2)%(0.99p.u.for PSCAD/EMTDC and 0.98p.u.for PSCAD-SIMULINK interface),whereas it is 1.0p.u.for PSB/SIMULINK.•The Fourier spectrum of the corresponding waveforms have very few differences.The dc component is close to 1.0for all environments,but in the plot,it is not shown in full magnitude,for the sake of highlighting the harmonicsFig.4.Steady-state results for dc voltage.TABLE IC OMPARISON OF THD(%),M EAN,AND MAD FOR DC V OLTAGES AND C URRENTS P RODUCED BY D IFFERENT S IMULATION TOOLSpresent in the signal.The THDs found in the three cases for different waveforms are also very close.•Table I shows further information about thefine differ-ences in terms of mean value,THD,and Mean Absolute Deviation(MAD).Close results have also been observed for dc currents on both the rectifier and inverter sides. 2)AC Voltages and Currents:All ac side waveforms on both the rectifier and inverter sides have also been compared. The results were found to be similar,and only the ac current waveforms and their harmonic spectrum are shown in Fig.5. Both rectifier and inverter ac currents are similar in terms of phase angle and their magnitude;their spectrum is identical, which reaffirms the accuracy of all three simulation techniques. The11th and13th harmonics are the dominant harmonics on both rectifier and inverter sides;their THDs have been found to be close for all simulation environments.Table II compares other control outputs(,inverter,and rectifier). PSCAD-SIMULINK shows the maximum rectifier(17.28), while PSB/SIMULINK shows the minimum(14.44).This result agrees with the mean value of the dc voltage produced on the rectifier side by the three simulation environments.Sim-ilarly,for,PSCAD-SIMULINK shows the highest(15.72), and PSB/SIMULINK shows the lowest(14.95).However, these differences are small,and the produced results are con-sistent.B.TransientsDc and ac faults have been simulated in the three simula-tion environments.The instant and duration of faults have beenFig.5.Steady-state results for ac currents on the recti fier and inverter side.TABLE IIC OMPARISON OF O UTPUTS P RODUCED BY C ONTROL SYSTEMSmaintained the same for all types of faults,i.e.,the fault is ap-plied at 1.0s and cleared after 0.15s.The fault resistance hasbeen chosen as0.1and1for fault-on and fault-off situa-tions,respectively.Clearing of the fault has been allowed,even when there is a fault current flowing.1)Dc Fault:This fault has been located at the midpoint of the dc line.Fig.6illustrates different output parameters of the system.The transient response in all three simulation environ-ments has been found almost similar.During the fault,the dc voltage has gone down to zero (the small oscillation is due to the energy stored in the capacitor),and a momentary transient dc current has been observed.However,control response forces recti fier andinverter to reach maximum andinverter to reach minimum,thereby reducing the current flow.VDCOL forces the current to stay minimum until the dc voltage situation is improved.Once the fault is cleared,the dc voltage is recov-ered,and the control system brings the system back to normal operation.The transient response for all three simulation envi-ronments has been compared in terms of Rise Time (RT),Set-tling Time (ST),and Overshoot (OS)in Table III.2)AC Faults:Two cases of ac faults have been simulated:One is a single line-to-ground fault (see Fig.7),and the other is a three-phase to ground fault (see Fig.8).Both are applied on the inverter side of the system.During fault,the dc voltage has gone down to zero (neglecting oscillation due to capacitor energy storage),the dc current faces a momentary overshoot,and then goes to minimum limit with some oscillation present (due to the oscillation of dc voltage).Recti fier ,inverter ,andinverter reach to maximum value,thereby blocking the system for the fault duration.Once the fault is cleared,the system comes back to its normal operation.During an ac fault,commutation failures happen,resulting in a momentary drop-down of dc voltage.This causes the VDCOL to limit the dc current to a minimum,and ac voltages also get disturbed (not shown in the figure).The voltage and current waveforms for the three environments are similar;however,the following minor discrepancies were observed.•In all three cases,the rise-time for inverter dc voltage for ac faults is shorter than that for the dc fault.Even though PSCAD/EMTDC and PSCAD-SIMULINK showFig.6.V oltages and currents under a short duration dc fault.a faster rise than PSB/SIMULINK case,PSB/SIMULINKreaches steady state before the other two cases.•The highest transient values of inverter dc currents during the phase-to-ground fault are 2.58p.u.for PSCAD/EMTDC, 2.4p.u.for PSB/SIMULINK,and2.39p.u.for PSCAD-SIMULINK.•The peak value of inverter ac current for the single phase-to-ground fault is13.2kA for PSCAD/EMTDC, 14kA for PSB/SIMULINK,and13kA for PSCAD-SIMULINK.•In case of the three-phase to ground fault,when the faultis clearedat,in all the three environments,thesystem is brought back to normal operation within0.05 s;however,PSCAD/EMTDC and PSCAD-SIMULINK could not stabilize the system,i.e.,after a small over-shoot,the system collapses again,though it regains the control very fast,and the system stability is restored.PSB/SIMULINK,however,does not show this behavior.C.Execution Time and MemoryAll three environments were run on a Pentium IV1.5–GHz processor running Windows2000operating system.The ex-ecution time was recorded from the Time Summary shown on the output window in PSCAD/EMTDC and by using the cputime function at the start and end of the simulation in PSB/rmation on memory usage was collected from the System Performance Monitor on Windows2000. Although resource requirements for both programs may not be the same,attempts have been made to allow no other programs except the systemfiles to run while the simulations were performed.Table IV shows the execution time and memory usage for the three environments.PSCAD/EMTDC was found to be the fastest environment,while PSCAD-SIMULINK Interface was the slowest.For a simulation duration of2s, PSCAD/EMTDC took30.5s with a memory usage of42 MB,whereas PSB/SIMULINK took72.2s with a memory usage of107MB.In comparison to these two environments, PSCAD-SIMULINK took a much longer execution time;using a50sampling period in both PSCAD and SIMULINK environments,the execution time was found to be12503.58s with a memory usage of63MB(24MB for PSCAD and39MB for SIMULINK).The reason for such a long simulation time is the necessity of data exchange between the two programs at every50;the memory usage for the interface was less than the other two environments due to the task partition(electrical system in PSCAD and control system in SIMULINK).A higher control sampling period reduced the execution time by a very small margin(2.5%for100);however,it also reduced the accuracy of the simulation.TABLE IIIC OMPARISON OF R ISE T IME (RT)(S ),S ETTLING T IME (ST)(S ),AND O VERSHOOT (OS)(P .U .)D URING R ECOVERY F ROM A DC FAULTFig.7.V oltages and currents under a short duration ac fault (phase-A to ground)on the inverter side.D.General RemarksBoth PSCAD/EMTDC and PSB/SIMULINK provides user-friendly graphics for modeling power and control systems through simple functional blocks.However,the following minor differences particular to this case study,are worth men-tioning.•PSCAD/EMTDC is a specialized software designed mainly for the analysis of ac/dc systems.Therefore,it has added advantages such as built-in PLO-based firingcontrol and the measurementofangles embedded inside the six-pulse Garetz bridge .On the other hand,PSB/SIMULINK requires these blocks and the measure-ment system to be developed by the user.•PSB/SIMULINK offers more flexibility in terms of choice of the solution techniques:fixed or variable time-step-based solutions.However,for this study,a fixed step-size trapezoidal rule has been used to be consistent with PSCAD/EMTDC.•The error debugging system in PSCAD/EMTDC is quite complex.In some cases,instead of locating the exact source of error,it returned general error messages.VIII.C ONCLUSIONSA detailed comparison of the performance of three simu-lation environments (PSCAD/EMTDC,PSB/SIMULINK,and PSCAD-SIMULINK Interface)has been demonstrated by mod-eling the CIGR ÉHVDC Benchmark System.All three environ-ments produced almost identical and consistent results during steady-state and transients situations,validating the accuracy of the modeling and solution algorithms.In terms of computationalFig.8.V oltages and currents under a short duration ac fault(three-phase to ground)on the inverter side.Fig.9.CIGRÉHVDC benchmark system model in PSB/SIMULINK.TABLE IVE XECUTION T IME (ET)(S )AND M EMORY U SAGE (MU)(MB)FORAS IMULATION D URATION OF 2S W ITH A T IME S TEP OF 50sTABLE VCIGR ÉHVDC B ENCHMARK S YSTEM DATAspeed and memory usage,PSCAD/EMTDC was found to be the most ef ficient environment.A PPENDIXTable V shows the CIGR ÉHVDC benchmark system data.R EFERENCES[1] D.A.Woodford,A.M.Gole,and R.W.Menzies,“Digital simulationof DC links and AC machines,”IEEE Trans.Power App.Syst.,vol.102,no.6,pp.1616–1623,Jun.1983.[2]L.-A.Dessaint,H.Le-Huy,G.Sybille,and P.Brunelle,“A power systemsimulation tool based on SIMULINK,”IEEE Trans.Ind.Electron.,vol.46,no.6,pp.1252–1254,Dec.1999.[3]J.D.Ainsworth,“Proposed benchmark model for study of HVDC con-trols by simulator or digital computer,”in Proc.CIGRE SC-14Colloq.HVDC With Weak AC Systems ,Maidstone,U.K.,Sep.1985.[4]M.Szechtman,T.Wess,and C.V .Thio,“First benchmark model forHVDC control studies,”Electra ,no.135,pp.54–67,Apr.1991.[5],“A benchmark model for HVDC system studies,”in Proc.Int.Conf.AC/DC Power Transmission ,Sep.17–20,1991,pp.374–378.[6]P.Lehn,J.Rittiger,and B.Kulicke,“Comparison of the ATP versionof the EMTP and the NETOMAC program for simulation of HVDC systems,”IEEE Trans.Power Del.,vol.10,no.4,pp.2048–2053,Oct.1995.[7]W.Freitas and A.Morelato,“Comparative study between power systemblockset and PSCAD/EMTDC for transient analysis of custom power devices based on voltage source converter,”in Proc.Int.Conf.Power Systems Transients ,New Orleans,LA,2003,pp.91–96.[8] F.Jurado,N.Acero,J.Carpio,and M.Castro,“Using various computertools in electrical transient studies,”in Proc.Int.Conf.30th ASEE/IEEE Frontiers in Education ,Kansas City,MO,Oct.18–21,2000,pp.F4E17–F4E22.[9]PSCAD/EMTDC User ’s Manual ,Manitoba HVDC Research Centre,2001.[10]G.D.Irwin,D.A.Woodford,and A.Gole,“Precision simulation ofPWM controller,”in Proc.Int.Conf.Power System Transients ,Rio de Janeiro,Brazil,2001,pp.301–306.[11]Power System Blockset User ’s Guide ,TEQSIM International,Inc.,2001.M.O.Faruque (S ’03)received the B.Sc.Engg degree in 1992from Chittagong University of Engineering and Technology (CUET),Chittagong,Bangladesh,and M.Eng.Sc.degree in 1999from the University of Malaya,Kuala Lumpur,Malaysia,in the area of power engineering.He is working toward the Ph.D.degree from the Department of Electrical and Computer Engineering,University of Alberta,Edmonton,AB,Canada.For the last ten years,he has been working in both academia and industry,and his research interests include FACTS,HVDC,and real-time digital simulation of power electronics and power systems.Yuyan Zhang received the Bachelor ’s degree in electrical engineering from South-East University,Nanjing,China,in 1990and the M.E.degree from the University of Alberta,Edmonton,AB,Canada in 2003.Since then,she has worked as an Electrical Engineer for a variety of indus-tries,including the Beijing Chemical Plant,Hongkong Well fine Ltd.,Motorola China Ltd.,and Siemens Ltd.,China,in the power generation group.Her re-search interests are in the area of power distribution systems,HVDC,and digital simulation.Venkata Dinavahi (M ’00)received the B.Eng.degree in electrical engineering from Nagpur University,Nagpur,India,in 1993,the M.Tech.degree from the Indian Institute of Technology,Kanpur,India,in 1996,and the Ph.D.degree in electrical and computer engineering from the University of Toronto,Toronto,ON,Canada,in 2000.Presently,he is an Assistant Professor at the University of Alberta,Edmonton,AB,Canada.His research interests include electromagnetic transient analysis,power electronics,and real-time simulation and control.Dr.Dinavah is a member of CIGR Éand a Professional Engineer in the Province of Alberta,Canada.。

直流高压输电系统设计及仿真摘要: 本设计分析了直流高压输电的背景,对单极HVDC结构进行了分析,并对它的组成进行了分析,并进行了建模以及数据采集,最终对高压直流输电的优势进行了总结。
关键词:直流输电,HVDC,仿真1.前言我国的电网正处在快发展的时期,现阶段正在建设覆盖全中国的电网。
由于我国能源分布的问题,在近些年来,咱们国家利用高压进行直流输电已经取得的很大的进步。
这些成绩另全世界都感觉到很是惊叹啊。
使用高压进行直流输电更是有着很大的输电优势。
优势还是很明显的,但困难还是存在的。
而与此同时,利用高压进行直流输电技术也带了一些科学技术上的难以解决的问题。
科学技术能以满足其对这一块的需求。
通过建立模型来了解学习。
HVDC的稳态特性和相较于交流输电系统的优点。
并对他经常出现的故障进行仿真。
通过得到与之相关的仿真图片,来予以检测模型的有效性。
1.直流高压的结构和原理直流高压输电单极系统的构造如图1所示,一般情况下是使用非正极性的导线,地面或是水为其提供回路。
但是考虑到成本,一般会使用这种系统,对电缆传输来说尤其如此。
同时,单季系统也是建立双极系统的基础。
有时候遇到地面的电阻率太高的时候,或无法对地下的金属结构造成干扰时,我们可以使用金属环回路来代替接地回路,处于低压的状态是由金属性回路的导体所形成的。
图1 单极HVDC联络线换流站是HVDC输电系统的重要组成成份,在这里,我们就开始介绍基于晶闸管换流站的基本结构,如图2。
它主要有一下几个方面构成。
(1)换流变压器:它是由晶闸管构成,用于逆变或者是整流。
(2)换流器C1、C2:它是交流系统电压整流桥,将变频器输出的电压为所需电压为交流系统。
(3)滤波器:直流侧滤波器是一个正常的情况下按装在直流线路两端,基本上是用可以用的用有源滤波器广拼消除谐波。
(4)平波电抗器:平波电抗器它的功能是当它遇到干预时可以对抑制直流电流的上升速度起到重要的作用,于此差不多的时间也可以降低直流电压、电流的变化情况。
高压直流输电系统建模与仿真【摘要】本文介绍了高压直流输电系统的基本原理,整流测采用定电流控制方式,建立了基于MATLAB/Simulink的高压直流输电系统仿真模型,对高压直流输电系统正常运行时电压、电流进行仿真分析,同时通过对交流系统以及直流线路短路故障的仿真分析,验证了所建立仿真模型的合理性。
仿真结果表明,该方法能较准确地观测暂态过程高压直流输电系统的动态性能。
【关键词】高压直流输电HVDC MATLAB建模与仿真暂态分析一、引言高压直流输电技术是电力电子技术在电力系统输电领域中应用最早同时也是较为成熟的技术。
高压直流输电由整流器、高压直流输电线路以及逆变器三部分构成。
到目前为止,工程上绝大部分直流输电的换流器由半控型的晶闸管器件组成,称采用这种换流器的直流输电为常规高压直流输电。
在高压直流输电系统中有三个原因使得他的暂态过程变的非常复杂:工程实际中每个换流阀的触发角为离散变量;触发角和换相电压在高压直流输电系统的暂态过程中不断变化;长距离直流输电线路具有分布参数特性,需要考虑他的电压、电流过程。
所以,如果要准确的计算直流输电系统的暂态过程,就必须要求解包含连续变量和离散变量的常微分方程和偏微分方程。
这个过程原理很简单,但是计算的工作量却非常大[1]。
传统的仿真软件主要包括微分方程和差分方程,MATLAB 软件中的Simulink 给用户提供了用方框图进行建模的模型接口,和传统的仿真软件相比具有更直观、灵活和方便的优点。
Simulink中的电力系统模块库包含了多种交/直流电源、大量电工测量仪表和电元器件以及各种分析工具等。
利用这些模块我们就可以模拟电力系统运行和故障的每个状态,从而进行仿真和分析。
[2]本文建立了基于MATLAB 的HVDC 仿真模型,整流侧采用定电流调节方式,并附加了最小触发角限制,对高压直流输电系统正常运行模式进行仿真分析,并针对逆变器交流侧发生单相接地、两相接地、三相短路故障以及直流线路发生接地故障的情形,分别进行了仿真和分析。
VSC-HVDC输电系统的电磁暂态建模与仿真郑超;盛灿辉;魏强;盛浩【期刊名称】《高电压技术》【年(卷),期】2007(33)11【摘要】基于电压源换流器(VSC)的新型直流输电(VSC-HVDC)系统技术优点很多,建立能够准确描述VSC-HVDC动态特性的详细模型及仿真算法对该项输电技术的深入研究具有重要意义,还可为含有VSC-HVDC的电力系统机电、电磁混合仿真奠定基础。
为此首先分析了VSC-HVDC的工作原理;利用隐式梯形积分法建立了双端VSC-HVDC的详细电磁暂态仿真模型,并利用一阶惯性环节模拟锁相环测量了VSC 交流母线电压相位的动态特性;鉴于对应VSC-HVDC电磁暂态模型的差分方程为右端项含有待求变量的隐式方程,提出了相应的迭代求解数值计算算法。
在VSC交流母线电压幅值和相位突变的条件下,通过与PSCAD/EMTDC中所建VSC-HVDC仿真电路电磁暂态响应的对比,验证了VSC-HVDC电磁暂态模型及其数值计算算法的正确性。
【总页数】6页(P94-99)【关键词】电压源换流器;新型直流输电;锁相环;隐式梯形积分;电磁暂态建模;电磁暂态仿真【作者】郑超;盛灿辉;魏强;盛浩【作者单位】中国电力科学研究院;河南电力试验研究院;北京四方继保自动化股份有限公司【正文语种】中文【中图分类】TM721.1;TM76【相关文献】1.基于RTDS的直流输电系统电磁暂态建模和实时仿真研究 [J], 赵学强2.基于 ADPSS 的高压直流输电系统机电暂态-电磁暂态混合仿真研究 [J],3.大规模交直流电网电磁暂态数模混合仿真平台构建及验证\r(二)直流输电工程数模混合仿真建模及验证 [J], 朱艺颖;于钊;李柏青;郭强;谢国平;林少伯4.MMC柔性直流输电系统电磁暂态仿真建模 [J], 黄贤睿5.MMC柔性直流输电系统电磁暂态仿真建模 [J], 黄贤睿因版权原因,仅展示原文概要,查看原文内容请购买。
Advances in Energy and Power Engineering 电力与能源进展, 2013, 1, 39-44 /10.12677/aepe.2013.12007Published Online June 2013 (/journal/aepe.html) The Simulation of HVDC Transmission System Based onMATLABYuanshuo FengSchool of Electrical and Electronic Engineering, Shandong University of Technology, ZiboEmail:************************Received: Mar.19th, 2013; revised: Apr. 11th, 2013; accepted: Apr. 28th, 2013Copyright © 2013 Yuanshuo Feng. This is an open access article distributed under the Creative Commons Attribution License, which permits unre-stricted use, distribution, and reproduction in any medium, provided the original work is properly cited.Abstract: HVDC (High V oltage Direct Current) transmission takes an increasingly important position in the long dis-tance and high-power transmission project, for its large power of transmission, low cost and good performance advan-tages of control. The research of high voltage dc transmission system has important significance. The principle of high- voltage direct current (HVDC) transmission system is introduced briefly. Then a simulation model of HVDC system using Matlab/Simulink is established. We can observe the dynamic performance of the high voltage dc transmission system accurately.Keywords: HVDC; Matlab/Simulink; Simulation基于MATLAB的高压直流输电系统的仿真冯媛硕山东理工大学电气与电子工程学院,淄博Email:************************收稿日期:2013年3月19日;修回日期:2013年4月11日;录用日期:2013年4月28日摘要:高压直流输电以其传输功率大、线路造价低、控制性能好等优点,在远距离、大功率输电中占有越来越重要的地位,对于高压直流输电系统的研究有重要意义。
基于LCC-HVDC和VSC-HVDC的混合双极直流输电系统的建模及仿真分析高淑萍;朱航舰;张保会;宋国兵【摘要】近年来,我国传统换相型高压直流输电(LCC-HVDC)技术在电力系统中已经发展成熟;由于电力电子器件在实际工程应用中越来越成熟甚至达到完美状态,电压源换流器型高压直流输电(VSC-HVDC)也应用到了现代电网中.由于LCC-HVDC 和VSC-HVDC有各自的优点与不足,为了发挥两者的优势,对由LCC-HVDC和VSC-HVDC两个子系统分别位于上下两极所组成的混合双极直流输电系统(Hybrid Bipolar-HVDC)进行了进一步的分析.文章介绍了Hybrid Bipolar-HVDC 系统内部包含的一些基本结构,对LCC和VSC的主电路和其控制电路、在PSCAD 环境下正极LCC-HVDC和负极VSC-HVDC的主电路和控制电路分别进行了具体分析,最后用PSCAD对Hybrid Bipolar-HVDC进行了仿真,并分析了其稳定运行的状态.【期刊名称】《河南机电高等专科学校学报》【年(卷),期】2018(026)002【总页数】6页(P1-6)【关键词】换相型高压直流输电;电压源换流器型高压直流输电;混合双极直流输电;PSCAD软件;仿真模型建立【作者】高淑萍;朱航舰;张保会;宋国兵【作者单位】西安科技大学电气与控制工程学院,陕西西安710054;西安科技大学电气与控制工程学院,陕西西安710054;西安交通大学电气工程学院,陕西西安710049;西安交通大学电气工程学院,陕西西安710049【正文语种】中文【中图分类】TM721.1我国资源分布的特点决定了西电东输的模式,而西电东输要求传输的容量很大,传输距离很远,所以比较依赖直流输电[1,2]。
自1980以来,我国开始建立传统换相型高压直流(Line Commutated Converter High Voltage Direct Current,LCC-HVDC)输电系统,并成功应用于实际电网中[3,4]。
高压直流输电控制系统的MATLAB仿真HVDC就是高压直流输电的缩写,不同于传统的交流输电,采用高压直流输电具有许多交流输电不具备的特性。
比如说,高压输电带来的线路损耗更小、线路允许输送的容量更大。
加之其系统没有交流输电那样复杂,所以相比之下造价更低,经济性较直流输电也有很大优势。
因此。
HDVC 更适用于远距离大容量送电。
并且由于高压直流输电具有经济性好、造价低的特点,远距离大功率输电更有优势。
综上所述,高压直流输电的发展虽然么有交流输电那样顺利,但后来者居上,在未来的输电系统中高压直流输电必将发挥着不可替代的作用。
西电东送呈现继续发展的趋势,各个区域之间的电网联通也是一种趋势,直流输电工程在这一系列趋势中占据主导地位。
所以,在这篇文章中,首先对高压直流输电的背景和近些年来国内外的发展讲解一番,然后大致了解HDVC的特性,包括对结构、原理和控制方法进行了解,再者使用Matlab中的Simulink功能对HDVC系统建模,模拟系统的运行状态,对可能发生的故障进行仿真,然后从仿真波形再研究高压输电特性。
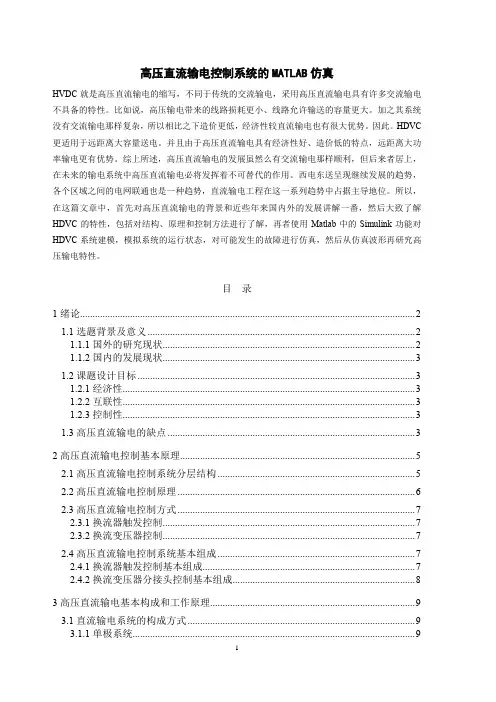
目录1绪论 (2)1.1选题背景及意义 (2)1.1.1国外的研究现状 (2)1.1.2国内的发展现状 (3)1.2课题设计目标 (3)1.2.1经济性 (3)1.2.2互联性 (3)1.2.3控制性 (3)1.3高压直流输电的缺点 (3)2高压直流输电控制基本原理 (5)2.1高压直流输电控制系统分层结构 (5)2.2高压直流输电控制原理 (6)2.3高压直流输电控制方式 (7)2.3.1换流器触发控制 (7)2.3.2换流变压器控制 (7)2.4高压直流输电控制系统基本组成 (7)2.4.1换流器触发控制基本组成 (7)2.4.2换流变压器分接头控制基本组成 (8)3高压直流输电基本构成和工作原理 (9)3.1直流输电系统的构成方式 (9)3.1.1单极系统 (9)3.1.2双极系统 (10)3.1.3背靠背直流系统 (11)3.2高压直流输电的基本结构与工作原理 (11)3.2.1高压直流输电的基本结构与工作原理 (11)3.2.2基于晶闸管的12脉动换流单元 (12)4高压直流输电仿真模型的建立与结果分析 (14)4.1高压直流输电仿真模型的建立 (14)4.1.1线路的参数 (14)4.1.2整流环节简介 (15)4.1.3逆变环节简介 (15)4.1.4滤波器子系统简介 (15)4.2仿真结果分析 (16)4.2.1稳态系统波形 (16)4.2.2 HDVC系统直流线路故障 (17)4.2.3 HDVC系统交流侧故障 (19)5结论 (20)1绪论1.1选题背景及意义随着时代的进步,人们对于电力的需求日益加深,电力工业的发展也愈来愈快,这就使得人们需要更高质量,更大量的电能,于是在输电的过程中,线路可承载的输电容量以及输电效率也愈加重要。
高压直流输电系统稳定性分析与建模随着电力需求的增加和远距离跨地区输电的需求,高压直流输电(High Voltage Direct Current Transmission,简称HVDC)系统作为一种可靠的高效率输电方式受到了越来越广泛的关注。
然而,HVDC系统的输电稳定性问题一直是研究的热点和难点。
本文从 HVDC 系统的稳定性入手,对 HVDC 系统的建模和稳定性分析进行探讨。
一、HVDC系统的基本结构HVDC系统由直流输电电源、两端换流阀、电缆或架空线路和两端的交流系统组成。
其中,直流输电电源可以是直流发电机组、直流电压源逆变器或者电压源换流器;两端换流阀则由大量的晶体管或者IGBT模块组成;电缆或架空线路则是用来进行高压输电的主要组成部分;交流系统主要是为了改变水平或垂直的交流电压,以符合整个直流系统的运行规格要求。
二、HVDC系统的稳定性问题HVDC系统的稳定性一直是研究的热点。
主要体现在两个方面:1、稳态稳定性HVDC系统在长期稳定性方面是非常重要的。
稳定状态是指系统在一定运行电压和功率条件下的稳定运行能力,例如等效电阻和容性等,长时间的稳定运行需要良好的控制环节和维护措施。
2、动态稳定性HVDC系统在正常运行及外部故障条件下的动态稳定性也是非常关键的。
其中,动态稳定性指系统在内部或外部干扰下的稳定运行能力,如电源波动、故障断电等情况下,整个系统是否能够保持稳定的运行状态。
三、HVDC系统的稳定性分析方法基于上述稳定问题,针对 HVDC 系统的两种稳定性问题,我们需要采用一种可靠的方法来进行稳定性分析。
以下是常见的两个方法:1、线性化模型法线性化模型法是一种较为常用的 HVDC 系统稳定性分析方法。
该方法通过对系统相应模型的特征进行线性化,从而使系统在应变的同时能够稳定运行。
线性化模型一般可以在不同的电压和功率下运行,并且可适应各种干扰,如负载变化、故障关闭等。
2、非线性模型法非线性模型法作为另一种常用的 HVDC 系统稳定性分析方法,其所使用的模型具有更高的精度和逼真性。
VSC-HVDC系统换流器故障仿真研究党常亮(宝鸡文理学院电子电气工程系,陕西宝鸡721007)摘要基于电压源变换器的新型高压直流输电(VSC-HVDC)技术近年来得到了快速发展。
与传统的直流输电相比,具有能够实现有功功率、无功功率的独立调节,并能够方便控制潮流的特点。
本文在PSCAD/EMTDC软件环境下建立了VSC-HVDC 系统仿真模型,在此基础上对常见的五种故障进行仿真研究。
分析故障仿真的结果,包括故障时直流侧电压、电流波形,整流、逆变侧电压、电流波形等,这对进一步的故障诊断和保护策略的研究提供了有效依据。
关键词电压源变换器换流器故障仿真故障诊断保护策略Research on Fault Simulation of VSC-HVDC Converter SystemDANG Changliang(Department of Electronics & Electric Engineering, Baoji University of Arts and Science, Bao ji 721007, China ) Abstract:In recent years, voltage source converter based HVDC transmission system (VSC-HVDC) has been rapidly developed. Compared with the conventional HVDC, VSC-HVDC takes the advantage of independent regulation of active and reactive power, and convenient flow control. In this paper, the fault simulation model of VSC-HVDC was established, including 5 typical faults. Then the simulation of these faults was performed under PSCAD/EMTDC environment. Simulation results were analyzed, including DC voltage, current wave, voltage and current on both sides, which provided reliable basis for search of fault diagnosis and protection strategy.Key words:V oltage Source Converter; Fault Simulation; Fault Diagnosis; Protection Strategy1.引言目前,高压直流输电技术(HVDC)凭借其相对于交流输电所特有的线路造价低、年电能损失小及适用于长距离输电等特点从而得到了越来越广泛的应用。
向有源网络供电的HVDC系统仿真研究肖述强深圳大学机电与控制工程学院摘要:通过分析在dq0坐标系下引入PI控制的高压直流输电(HVDC)系统,获知HVDC中有功和无功功率可以分别由解耦控制后的d轴电流分量和q轴电流分量独立控制,并基于此设计了定直流电压、定交流电压控制器。
建立HVDC向有源网络输电的Matlab仿真模型,仿真结果表明,建立的HVDC系统能较好地向无源网络供电,且控制方式灵活、简便。
关键词:高压直流输电(HVDC);解耦;有源网络;Matlab仿真0引言城市工商业的发展和人们生活水平的提高,对城市电网的供电能力和供电质量提出了更高的要求。
人口密集地区的大型城市电网受到了前所未有的挑战,如输电走廊不足、供电电压不稳等问题亟待解决。
高压直流输电(HVDC)与交流输电相比,在输电走廊宽度相同情况下其输送能力是交流的1.5倍[1],HVDC是缓解输电走廊不足的有力措施。
但由于环境因素的制约,许多城市电网是无源网络,而传统的基于线换相电流源换流器的HVDC无法向无源网络供电[2],从而限制了HVDC的应用。
鉴于HVDC的诸多优势,近年来许多学者对这一技术进行了深入研究。
文献[3]提出了一种优化控制策略,研究了该控制策略下HVDC 在系统发生故障时的阻尼特性,并考察了该系统在该控制方式下的稳定性;文献[4]建立了 HVDC的稳态模型,并设计了该模型与比例积分(PI)控制相结合的非线性控制方案;文献[5]提出了基于dq0坐标的HVDC稳态模型,并设计了相应的PI控制器;文献[6]提出了混合仿真技术,还以HVDC的暂态数学模型为基础建立了等效仿真模型。
虽然这些文献都针对HVDC技术给出了一种或几种控制方案并进行了相应的仿真研究,但对于应用 HVDC技术向有源网络供电却没有进行过详尽的分析和研究。
本文首先通过分析在dq0坐标系下引入PI控制的换流器数学模型,得到了由d轴电流分量i d和q轴电流分量i q独立控制有功功率和无功功率的关系式,然后设计了向有源网络供电的定直流电压和定交流电压控制器,并利用Matlab/Simulink仿真软件建立的向有源网络供电的HVDC仿真系统的输电情况进行了仿真分析。
老力工歿技术2020 年 7 月Electric Power EngineeringTechnology第 39 卷第 4 期 48 D01:10.12158/j.^096-3203.2020.04.008基于电池储能的MMC-HVDC系统的建模与仿真刘耀\吴佳玮\赵小令\肖晋宇\侯金鸣\余敬秋2!徐雨哲2!徐政2(1.全球能源互联网集团有限公司,北京100031;2.浙江大学电气工程学院,浙江杭州310027)摘要:由于交直流混联电网中的交流系统和直流系统之间存在有功功率耦合,因此基于模块化多电平换流器(MMC)的高压直流输电(HVDC)系统无法完全隔离故障时交直流侧之间的相互影响。
文中提出将基于电池储能系统(BESS)的MMC应用于HVDC系统以实现交直流侧功率解耦控制的方法。
首先分析了基于BESS的MMC-HVDC系统的基本结构和工作原理。
然后,基于数值积分和嵌套的快速仿真方法,推导了基于BESS的子模块和基于BESS的MMC换流器的戴维南等效电路。
最后,搭建了 ±400 k V的两端MMC-HVDC系统对所提建模方法和系统的解耦效果进行了验证。
结果表明,基于BESS的MMC-HVDC系统交流侧有功功率和直流侧功率可以彼此解耦,在交流或直流故障期间可以保持功率的正常输送。
关键词:模块化多电平换流器(MMC);高压直流输电(HVDC)系统;电池能量储存系统(BESS);故障特性;有功解耦中图分类号:TM72 文献标志码:A文章编号:2096-3203 (2020) 04-0048-07〇引言近年来,随着电力电子技术的发展,模块化多 电平转换器(modular multilevel converter!M M C)凭 借其低功耗和输出谐波少而成为高压大功率输电 的首选拓扑[1—5]。
作为一种新型的电压源换流器 (voltage source converter,VSC),MMC-高压直流输电 (high voltage direct current!HVDC)系统没有换相失 败问题,这是与传统的基于晶闸管的电网换相换流 器(line commutated converter,LCC)相比最重要的优 势之一[6—9]。
MATLAB/Simulink
电力系统建模与仿真
题 目:单极12脉冲的HVDC仿真模型
专 业: 电气工程及自动化
班 级: 电气201303
姓 名: 白 辉
学 号: 201309611
单极12脉冲的HVDC仿真模型
仿真题目:
通过1000MW(500kv,2kA)的直流输电线路从一个500KV、5000MV·A、50Hz
的电力系统EM向另一个345KV、10000MV·A、50Hz的电力系统EN输送电力,
整流桥和逆变桥由两个通用6脉冲桥搭建而成,交流滤波器直接接在交流母线
上,它包括11次、13次和更高次谐波等单调支路,总共提供600Mvar的容量。
线路的参数:
直流输电线路的参数如下:
线路电阻R=0.015Ω/km;
线路电感L=0.792MH/km;
线路电容C=14.4NF/km;
线路长度300km;
电力系统EM侧交流输电线的参数如下:
线路电阻R=26.07Ω;
线路电感L=48.86MH;
电力系统EN交流输电线的参数如下:
线路电阻R=6.205Ω;
线路电感L=13.96MH;
平波电抗器的电感L=0.5H;
单极12脉冲的HVDC仿真模型系统图
整流环节
整流环节子系统结构
整流器子系统结构
逆变环节
逆变环节子系统结构
逆变器子系统结构
滤波器子系统
滤波器子系统结构
系统主控模块
模型主控模块
整流器控制模块
逆变器控制模块
逆变器控制模块
数据测量模块
数据测量模块
系统控制参数随时间变化表
序号 时刻/s 动作
1 0 电压参考值为1pu
2 0.02 变换器导通,电流增大到最小稳态电流参考值
3 0.4 电流按指定的斜率增大到设定值
4 0.7 参考电流下降0.2pu
5 0.8 参考电流恢复到设定值
6 1.0 参考电压由1pu降低到0.9pu
7 1.1 参考电压恢复到1pu
8 1.4 变换器关断
9 1.6 强迫设置触发延迟角到指定值
10 1.7 关断变换器
整流侧得到的相关波形
逆变侧得到的波形
仿真结果分析
1) 晶体管在0.02s是导通,电流开始增大,在0.3s时达到最小稳定参考值
0.1p.u,同时直流线路开始充电,使得直流电压为1.0p.u,整流器和逆变器
均为电流控制状态。
2) 在0.4s时,参考电流从0.1p.u斜线上升到1.0p.u,0.58s时直流电流到达稳
定值,整流器为电流控制状态,逆变器为电压控制状态,直流侧维持在
1.0p.u。在稳态状态下,整流器的触发延迟角在16.5°附近,逆变器的触发
延迟角在143°附近,逆变器子系统还对两个6脉冲桥的各个晶体管的熄弧
角进行测量,熄弧角参考值为12°,稳态时,最小熄弧角在22°附近。
3) 在0.7s时,参考电流出现-0.2p.u的变化,在0.8s时恢复到设定值。
4) 在1.0s时,参考电压出现-0.1p.u的偏移,在1.1s时恢复到设定值,此时逆
变器的熄弧角仍大于参考值。
5) 在1.4s时,触发信号关断,使得电流斜线下降到0.1p.u。
6) 在1.6s时,整流器侧的触发延迟角被强制设置为166°,逆变器侧的触发延
迟角被强制为92°,使得直流线路放电。
7) 在1.7s时,两个变换器均关断,变换器控制状态为零。