2015 Photoacoustics---Sono-photoacoustic imaging of gold nanoemulsions, part I. exposure thresholds
- 格式:pdf
- 大小:2.12 MB
- 文档页数:8
A PPLIED AND E NVIRONMENTAL M ICROBIOLOGY, 0099-2240/99/$04.00ϩ0Feb.1999,p.489–498Vol.65,No.2Copyright©1999,American Society for Microbiology.All Rights Reserved.Effect of O-Side-Chain-Lipopolysaccharide Chemistry onMetal BindingNGLEY AND T.J.BEVERIDGE*Department of Microbiology,College of Biological Sciences,University of Guelph,Guelph,Ontario,Canada N1G2W1Received18September1998/Accepted13November1998Pseudomonas aeruginosa PAO1produces two chemically distinct types of lipopolysaccharides(LPSs),termed A-band LPS and B-band LPS.The A-band O-side chain is electroneutral at physiological pH,while the B-band O-side chain contains numerous negatively charged sites due to the presence of uronic acid residues in the repeat unit structure.Strain PAO1(A؉B؉)and three isogenic LPS mutants(A؉B؊,A؊B؉,and A؊B؊)were studied to determine the contribution of the O-side-chain portion of LPS to metal binding by the surfaces of gram-negative cells.Transmission electron microscopy with energy-dispersive X-ray spectroscopy was used to locate and analyze sites of metal deposition,while atomic absorption spectrophotometry and inductively coupled plasma-mass spectrometry were used to perform bulk quantitation of bound metal.The results indicated that cells of all of the strains caused the precipitation of gold as intracellular,elemental crystals witha d-spacing of2.43Å.This type of precipitation has not been reported previously for gram-negative cells andsuggests that in the organisms studied gold binding is not a surface-mediated event.All four strains bound similar amounts of copper(0.213to0.222mol/mg[dry weight]of cells)at the cell surface,suggesting that the major surface metal-binding sites reside in portions of the LPS which are common to all strains(perhaps the phosphoryl groups in the core-lipid A region).However,significant differences were observed in the abilities of strains dps89(A؊B؉)and AK1401(A؉B؊)to bind iron and lanthanum,respectively.Strain dps89caused the precipitation of iron(1.623mol/mg[dry weight]of cells)as an amorphous mineral phase(possibly iron hydroxide)on the cell surface,while strain AK1401nucleated precipitation of lanthanum(0.229mol/mg[dry weight]of cells)as apiculate,surface-associated crystals.Neither iron nor lanthanum precipitates were observed on the cells of other strains,which suggests that the combination of A-band LPS and B-band LPS produced by a cell may result in a cell surface which promotes the formation of metal-rich precipitates.We therefore propose that the negatively charged sites located in the O-side chains are not directly responsible for the binding of metallic ions;however,the B-band LPS molecule as a whole may contribute to overall cell surface properties which favor the precipitation of distinct metal-rich mineral phases.Bacteria express a wide variety of complex molecules on their surfaces,which,at physiological pH values,contain nu-merous charged chemical groups(such as phosphoryl,car-boxyl,and amino groups)that usually give the cell surface a net anionic(negative)charge density(15).Since the cell surface is in direct contact with the environment,the charged groups within the surface layers are able to interact with ions or charged molecules present in the external milieu.As a result, metal cations can become electrostatically attracted and bound to the cell surface(3,4,26).Numerous studies have examined the metal ion-cell wall interactions of gram-positive bacteria(particularly members of the genus Bacillus)(3,4,6,9).The sites responsible for metal binding in this organism are probably the carboxyl sites within the peptidoglycan,as well as the phosphoryl groups of the teichoic and teichuronic acid secondary polymers(3,4,6,9). Although it appears that most of the metal-binding capacity of gram-positive organisms is generated by the thick peptidogly-can layer,it is unlikely that the same layer provides the same binding capacity in a gram-negative organism,since gram-neg-ative peptidoglycan is much thinner than gram-positive pepti-doglycan and is shielded by an outer membrane(7,12).How-ever,the lipopolysaccharide(LPS)layer can be highly anionic and extends beyond the outer membrane proteins;this layer has been implicated as the major source of metal binding in gram-negative bacteria(5,10).One of the most-studied gram-negative organisms(with re-spect to metal binding)is Escherichia coli K-12,probably be-cause it is a common laboratory strain and its LPS is well-characterized.In this organism,exogenous metal ions bind primarily to the polar head groups of phospholipids and LPS in the outer membrane(5,29).Ferris and Beveridge(11)dem-onstrated that the phosphoryl residues in these molecules were the most probable binding sites for metal cations in the E.coli K-12outer membrane.Unfortunately,E.coli K-12does not produce an O-polysaccharide side chain,so the contribution of this portion of LPS to gram-negative bacterial metal binding has not been examined in detail yet.The LPS of Pseudomonas aeruginosa PAO1does contain an O-side chain and is also well-characterized(1,18).This LPS is composed of two chemically and antigenically distinct forms, termed A-band LPS and B-band LPS(28).B-band LPS is responsible for determining the serotype specificity of a strain, while A-band LPS is a more conserved structure that is found in most P.aeruginosa strains and is referred to as“common antigen”(21).The core regions are composed primarily of neutral sugars but do contain some negatively charged sites (e.g.,on the2-keto-3-deoxyoctulosonic acid residues,as well as several phosphate groups in the inner core).Sulfate groups have also been found in the core region of A-band LPS.The A-band LPS O-side chain is neutrally charged and is composed*Corresponding author.Mailing address:Department of Microbi-ology,College of Biological Sciences,University of Guelph,Guelph, ON,Canada N1G2W1.Phone:(519)824-4120,ext.3366.Fax:(519) 837-1802.E-mail:tjb@micro.uoguelph.ca.489of up to20trisaccharide repeating units consisting of D-rham-nose linked by␣132and␣133bonding in each trimeric unit(1). In contrast,the B-band LPS O-side chain of strain PAO1is composed of a trisaccharide repeating unit consisting of two res-idues of an amino derivative of manuronic acid and one residue of N-acetyl-D-fucosamine(18)and varies in length from30to50 repeat units(20).It therefore contains more electronegative(i.e., carboxyl)sites than the A-band LPS O-side chain contains.A number of isogenic mutant strains have been isolated which are deficient in either one or both of the LPS types. Strain AK1401(2)does not express B-band LPS(i.e.,its phe-notype is AϩBϪ).Strain rd7513(23)is an A-band-deficient mutant derived from strain AK1401(i.e.,its phenotype is AϪBϪ).Finally,strain dps89(17)is a revertant strain of rd7513 which expresses B-band LPS but not A-band LPS(i.e.,its phenotype is AϪBϩ).Using these mutants in conjunction with the wild-type strain PAO1(AϩBϩ)in this study,we attempted to define the role of the O-side-chain portion of LPS in metal binding by gram-negative bacteria.MATERIALS AND METHODSMetals.The four metal salts used in this study were AuCl3(Sigma Chemical Co.,St.Louis,Mo.),Cu(NO3)2⅐3H2O,Fe(NO3)3⅐9H2O,and La(NO3)3⅐6H2O (all from Fisher Scientific,Unionville,Ontario,Canada).Metal solutions were prepared by dissolving the metal salts in ultrapure deionized water(UDW)(18 M⍀⅐cm).When possible,all materials(glassware,plasticware,centrifuge tubes, etc.)were acid leached in50%(vol/vol)HNO3for at least24h prior to use and then rinsed in UDW.Bacterial strains and culture conditions.The bacterial strains used are de-scribed in Table1.Cultures were maintained on Trypticase soy agar slants at 22°C.Cells were grown in Trypticase soy broth at22°C on a rotating shaker at 125rpm.Sodium dodecyl sulfate-polyacrylamide gel electrophoresis and Western im-munoblotting.LPS from the four strains were prepared as described by Hitch-cock and Brown(14).For Western immunoblot analysis,electrophoresis of LPS samples was carried out as described previously(19,21).The bands were then transferred onto nitrocellulose sheets by electrophoresis at100V for60min,and immunoblots were prepared by using a modification of the method originally described by Towbin et al.(30).Following transfer,the blots were rinsed briefly in Tris-buffered saline(TBS)(0.9%[wt/vol]NaCl,10mM Tris;pH7.4)and placed in blocking buffer(3%skim milk in TBS)for60min at22°C.They were then rinsed briefly in TBS and reacted with either monoclonal antibody N1F10 (anti-A-band LPS monoclonal antibody)(21)or monoclonal antibody MF15-4 (anti-B-band LPS monoclonal antibody)(19)for60min at22°C and then over-night at4°C.The bound monoclonal antibodies were then reacted with0.05% (vol/vol)horseradish-conjugated goat anti-mouse antibody(in TBS)for2h at 22°C.The bands werefinally developed for30min in TBS containing25g of 4-chloro-1-naphthol per ml and0.01%(vol/vol)H2O2.Development was stopped by repeatedly rinsing the blots in UDW.Preparation of samples for metal-binding analyses.Cells were grown to the mid-exponential phase(optical density at600nm,0.2),and5-ml portions of each cell suspension were transferred to sterile centrifuge tubes and centrifuged at 6,000ϫg for10min.The supernatantfluid was removed,and the cell pellets were resuspended in1-ml portions of UDW and transferred to sterile1.5-ml microcentrifuge tubes.The cells were then washed three times in1ml of UDW with centrifugation at16,000ϫg for1min for each wash.The washed cells were resuspended in1ml of a1mM metal solution for15 min at22°C.Following incubation with the metal,the cells were centrifuged at 16,000ϫg for1min,and the supernatant solutions(still containing some metal) were removed,acidified with either0.2%(vol/vol)HNO3(copper-,iron-,or lanthanum-treated samples)or0.2%(vol/vol)HCl(gold-treated samples),and stored atϪ20°C.The cell pellets were then washed four times in UDW,and the supernatantfluid from each wash was acidified and stored as described above. Finally,the cell pellets were dried at60°C,their dry weights were determined, and then the cell pellets were resuspended in1-ml portions of either concen-trated(71%,vol/vol)HNO3or concentrated(35%,vol/vol)HCl.These acid-treated samples were then heated to100°C until only viscous pastes remained in the bottoms of the tubes.The pastes were then dissolved in1ml(final volume) of0.2%(vol/vol)HNO3or0.2%(vol/vol)HCl.The amounts of metal in these samples represented the amounts of metal bound by the cells during the15-min incubation period.These amounts,when combined with the amounts recovered from the fractions which were saved after incubation,should equal the total amounts of metal present in1-ml portions of the original metal stock solutions used to treat the cells.Three replicates consisting of three samples each were prepared,in addition to controls which consisted of cells which were not treated with any metal(cellular controls)and samples of metal solutions which were allowed to precipitate chemically for15min at22°C(acellular controls).The analysis of variance test was used to test the significance of the differences between replicates,while the two-tailed t test was used to test the significance of the differences between the average amounts of metal bound by different strains.Atomic absorption spectrophotometry and inductively coupled plasma-mass spectrometry.Samples which contained gold,copper,or iron were analyzed to determine their metal contents by using a Perkin-Elmer model2380atomic absorption spectrophotometer operating in the graphite furnace mode with a model HGA-400heated graphite atomizer.The apparatus was calibrated to the manufacturer’s specifications for each metal and was standardized by using Baker Instra-Analyzed atomic spectral standards(J.T.Baker Chemical Co., Phillipsburg,N.J.).This method has detection limits of0.761,1.574,and1.791 nM for gold,copper,and iron,respectively(27).Triplicate readings were ob-tained for each sample,and the averages and standard deviations are reported below.Unfortunately,this apparatus could not be calibrated for detection of lantha-num.Therefore,the lanthanum samples were analyzed at the Geoscience Lab-oratories(Ministry of Northern Development and Mines)in Sudbury,Ontario, Canada,by using a Perkin-Elmer model Elan5000inductively coupled plasma-mass spectrometer.This method has a detection limit of0.004nM for lanthanum (27).As described above for atomic absorption spectrophotometry,triplicate readings were obtained for each sample and averaged.TEM and EDS.To examine thin sections,cells were prepared and treated as described above and then processed for transmission electron microscopy (TEM)and energy-dispersive X-ray spectroscopy(EDS)as describedpreviouslyFIG.1.Western immunoblots of LPS antigens reacted with anti-A-band LPS monoclonal antibody(A)and anti-B-band LPS monoclonal antibody(B).Lane 1,strain PAO1(AϩBϩ);lane2,strain AK1401(AϩBϪ);lane3,strain dps89 (AϪBϩ);lane4,strain rd7513(AϪBϪ).The blots confirmed that each strain produced the correct LPS chemotype.TABLE1.Bacterial strains and surface characteristicsStrain Surface characteristics Reference P.aeruginosa PAO1Produces A-band LPS and B-band LPS(AϩBϩ)28 P.aeruginosa AK1401Produces only A-band LPS(AϩBϪ)2 P.aeruginosa dps89Produces only B-band LPS(AϪBϩ)17 P.aeruginosa rd7513Produces neither A-band LPS nor B-band LPS(AϪBϪ)23 490LANGLEY AND BEVERIDGE A PPL.E NVIRON.M ICROBIOL.(3,4),except no electron microscopy stains (such as uranyl acetate,osmium tetroxide,or lead citrate)were used;thus,any contrast observed in the sections was due solely to the metal bound by the cells during treatment.Non-metal-treated control samples were prepared in the same way.All electron micrographs were taken with a Philips model EM300TEM op-erating at 60kV with a liquid nitrogen cold trap in place.EDS and selected area electron diffraction (SAED)were performed with a Philips model EM400T TEM operating at 100kV with a liquid nitrogen cold trap in place.This machine was coupled to a Link Analytical model LZ-5X-ray detector which allowed EDSspectra to be collected over 100s (live count time)when a beam diameter of approximately 400nm at 100kV was used.RESULTSPolyacrylamide gel electrophoresis and Western immuno-blotting.As shown in Fig.1,LPSs from both strain PAO1(A ϩB ϩ)and strain AK1401(A ϩB Ϫ)reacted with theanti-A-bandFIG.2.Transmission electron micrograph of a thin section of an untreated strain PAO1cell.The cell (whose surface is indicated by arrows)is difficult to distinguish from the embedding resin due to the lack of electron-dense elements in the sample.Bar ϭ200nm.(Inset)EDS spectrum obtained from an untreated PAO1cell,showing peaks for oxygen,phosphorus,chlorine,iron,and copper.The first four peaks correspond to elements present in the sample.The large copper peaks were generated by the supporting grid.Similar results were obtained for all fourstrains.FIG.3.Transmission electron micrograph of a copper-treated strain pared to the control,this cell was easier to distinguish as copper bound to it and provided contrast at the cell surface (arrows).Bar ϭ200nm.(Inset)EDS spectrum generated by a copper-treated cell.The expected position of the copper peak is indicated,although the peak itself is small.The large nickel peaks were generated by the supporting grid,and all of the other peaks (O,P,Cl,and Fe)were also present in controls.Similar results were obtained for all four strains.V OL .65,1999EFFECT OF LPS ON METAL BINDING 491LPS monoclonal antibody,while LPSs from both strain PAO1 (AϩBϩ)and strain dps89(AϪBϩ)reacted with the anti-B-band LPS monoclonal antibody.LPS from strain rd7513(AϪBϪ)did not react with either monoclonal antibody. Analysis of controls.Figure2shows a typical example of a thin section of a control(untreated)cell.The cells exhibited little,if any,electron density compared to the surrounding embedding resin and consequently were very difficult to distin-guish.EDS of the surfaces of these cells failed to generate energy peaks corresponding to energy peaks of any metal other than iron(presumably from iron in the growth medium).How-ever,oxygen,phosphorus,and chlorine were common.Al-though the cell shown in Fig.2is a strain PAO1(AϩBϩ)cell, thin sections of cells of all of the other strains exhibited similar electron densities,and the cells produced similar X-ray spectra (data not shown).Some strains reacted similarly following metal treatment,and below wefirst describe thefindings which were common to all strains and then describe the results which were exceptional.Analysis of copper binding.Copper-treated cells of all strains were very similar in appearance to the control cells(Fig.3). Since copper does not easily precipitate from solution and since it reacts stoichiometrically with exposed reactive surface groups,the level of metal binding is relatively low,and binding sites are difficult to identify by TEM.The bacterial surfaces were occasionally more sharply defined than the control cell surfaces,but in general,the contrast between the bacterial surfaces and the embedding resin was poor.The X-ray peaks generated by copper-treated cells corresponded to the X-ray peaks generated by control cells,although a very small copper peak was sometimes observed.The amount of copper bound by each of the strains is shown in Table2.No significant differences in the amounts of copper bound by the strains were found.Furthermore,no chemical precipitation of copper dur-ing the15-min treatment period was detected.Analysis of iron binding.Quantitation of bound iron by atomic absorption spectrophotometry revealed that three of the four strains(PAO1[AϩBϩ],AK1401[AϩBϪ],and rd7513 [AϪBϪ])bound equal amounts of the metal,while strain dps89(AϪBϩ)bound significantly more(Table3).Thin sec-tions of cells of strains PAO1,AK1401,and rd7513exhibited increased electron densities(compared to controls)that were localized at the cell surface(Fig.4).In addition,the outer membranes typically appeared to be ruffled as a result of iron treatment.Analysis of the electron-dense surfaces of these cells by EDS resulted in spectra which were similar to the spectra of the controls,except the iron peak was slightly larger and,interestingly,there was also a silicon peak. However,iron treatment of strain dps89(AϪBϩ)resulted in macroscopically visible changes to the cells.Within2min fol-lowing addition of the iron solution the cells began tofloc and sediment out of suspension.Furthermore,centrifugation of the cells resulted in a cell pellet which was yellow-orange instead of the characteristic white-pink color(data not shown).Micro-scopic analysis of iron-treated dps89(AϪBϩ)cells clearly showed that the dps89iron binding differed from the iron binding in the other three strains(Fig.5).Electron-dense pre-cipitates of different thicknesses were present around the sur-faces of the cells,and in some instances the faces of membrane bilayers were visible.SAED of the precipitates failed to gen-erate a diffraction pattern,indicating that the precipitates were amorphous.However,EDS analysis revealed that the precip-itates generated strong iron peaks.Analysis of gold binding.Table4shows the amounts of gold bound by the different strains.It appeared that strains PAO1 (AϩBϩ)and rd7513(AϪBϪ)bound equal amounts of gold and that strains AK1401(AϩBϪ)and dps89(AϪBϩ)also bound equal amounts,although the amounts of gold bound by strains AK1401and dps89were greater than the amounts bound by strains PAO1and rd7513.However,electron micros-TABLE2.Amount of copper bound aPrepnAmt of copper bound(mol/mg[dry wt]of cells)Replicate1b Replicate2Replicate3MeanP.aeruginosa PAO1(AϩBϩ)0.215Ϯ0.0250.232Ϯ0.0160.206Ϯ0.0190.218Ϯ0.013 P.aeruginosa AK1401(AϩBϪ)0.207Ϯ0.0410.214Ϯ0.0360.244Ϯ0.0470.222Ϯ0.020 P.aeruginosa dps89(AϪBϩ)0.230Ϯ0.0060.203Ϯ0.0130.206Ϯ0.0280.213Ϯ0.015 P.aeruginosa rd7513(AϪBϪ)0.233Ϯ0.0370.211Ϯ0.0130.213Ϯ0.0330.219Ϯ0.012 Acellular control c0000a Whole cells were treated with a1mM solution of Cu(NO3)2⅐3H2O for15min at22°C.b Data are values from separate measurements of three whole-cell–metal interactions.c Amount of metal which precipitated chemically during the15-min treatment period.TABLE3.Amount of iron bound aPrepnAmt of iron bound(mol/mg[dry wt]of cells)Replicate1b Replicate2Replicate3MeanP.aeruginosa PAO1(AϩBϩ) 1.097Ϯ0.127 1.077Ϯ0.142 1.044Ϯ0.187 1.073Ϯ0.027 P.aeruginosa AK1401(AϩBϪ) 1.043Ϯ0.148 1.067Ϯ0.168 1.026Ϯ0.106 1.045Ϯ0.021 P.aeruginosa dps89(AϪBϩ) 1.681Ϯ0.107 1.571Ϯ0.125 1.618Ϯ0.253 1.623Ϯ0.055d P.aeruginosa rd7513(AϪBϪ) 1.038Ϯ0.037 1.022Ϯ0.208 1.052Ϯ0.026 1.037Ϯ0.015 Acellular control c0000a Whole cells were treated with a1mM solution of Fe(NO3)3⅐9H2O for15min at22°C.b Data are values from separate measurements of three whole-cell–metal interactions.c Amount of metal which precipitated chemically during the15-min treatment period.d The value for dps89is significantly different from all other values,as determined by the two-tailed t test.492LANGLEY AND BEVERIDGE A PPL.E NVIRON.M ICROBIOL.copy of gold-treated cells of all four strains revealed that the gold did not bind to the cell surface,as the iron and copper had.Rather,the gold appeared to precipitate within the cyto-plasm of the cells as electron-dense,colloidal aggregates (Fig.6).The sizes,shapes,and locations of the precipitates in the cytoplasm were all random.EDS spectra generated by the precipitates contained few peaks other than the peaks corre-sponding to gold and phosphorus,while SAED of the aggre-gates produced diffraction patterns with lattice or d -spacings of approximately 2.43Å,which are indicative of metallic gold (Fig.7).Analysis of lanthanum binding.The inductively coupled plasma-mass spectrometry data (Table 5)revealed that of the four strains examined,strain AK1401(A ϩB Ϫ)bound the most lanthanum,followed by dps89(A ϪB ϩ);smaller amounts were bound by strains PAO1(A ϩB ϩ)and rd7513(A ϪB Ϫ),whichFIG.4.Transmission electron micrograph of an iron-treated strain PAO1cell.The iron bound to the cell surface,providing increased electron density.In addition,the cell surface appeared to be ruffled in some areas (arrow).Bar ϭ200nm.(Inset)EDS spectrum for the surface of an iron-treated cell,showing large iron peaks and the presence of silicon (probably from the glassware),which suggested that binding of the metal was accompanied by binding of silicon.Similar results were obtained for all of the strains exceptdps89.FIG.5.Thin section of an iron-treated strain dps89cell.The iron bound to such an extent that membranes were sometimes visible (open arrow),and amorphous precipitates (solid arrows)formed on the cell surface.Bar ϭ100nm.(Inset)EDS spectra of the precipitates confirmed that they were iron rich.The lack of other high-atomic-number elements suggested that the precipitate might be an iron hydroxide.These results were obtained only for strain dps89.V OL .65,1999EFFECT OF LPS ON METAL BINDING 493bound similar amounts.Once again,the differences in metal binding among the strains were apparent when TEM was nthanum-treated strain PAO1(A ϩB ϩ)and rd7513(A ϪB Ϫ)cells exhibited greater cell surface electron densities than the controls (Fig.8);however,EDS spectra contained only minor energy peaks corresponding to lanthanum.In contrast,lanthanum-treated dps89(A ϪB ϩ)cells showed good contrast,with the lanthanum binding not only to the surfaces of the cells but also to sites within the cytoplasm,giving the cells a con-ventionally stained appearance (Fig.9).However,EDS anal-ysis of lanthanum-treated dps89(A ϪB ϩ)cells failed to detect significant energy peaks corresponding to lanthanum.Finally,the appearance of thin sections of strain AK1401(A ϩB Ϫ)cells,which bound significantly more lanthanum than cells of the other three strains,was different.The cells were surrounded by clumps of electron-dense apiculate precipitates which varied in size and projected outward from the cell surface (Fig.10).EDS of the precipitates generated several strong energy peaks corresponding to lanthanum.In addition,the lanthanum-rich precipitates weakly diffracted the electron beam (data not shown).Treatment of each strain with lanthanum resulted in a ruffling of the cell surface which was similar to,but more pro-nounced than,the ruffling observed with iron treatment.DISCUSSIONMetal binding and the subsequent fine-grained mineral de-velopment on bacterial surfaces are complex issues.Bacteria have many ionizable groups on their surfaces,and metal ions can have complex reactivities;all such chemical interactions are influenced by pH,redox potential,environmental electro-lytes,and cell gradients.In this study we attempted to simplify environmental factors by suspending bacteria in single-metal solutions.The metals were chosen because of their binding and precipitation characteristics;iron forms amorphous hydrated precipitates,lanthanum forms more anhydrous microcrystals,and gold forms metallic colloids (3).Copper does not form sur-face precipitates in our system.Because P.aeruginosa PAO1had two separate types of LPS on its surface (28)and because we had isogenic LPS mutants (17),we could control LPS ex-pression,thereby altering the surface charge in order to estab-lish how this charge influences metal binding and precipitation.Because copper did not form precipitates,the amount of copper taken up by the cells was small.The lack of abiotic chemical precipitation by the acellular controls indicated that copper ions were removed from solution only when bacterial cells were added to the system.However,analysis of the atomicTABLE 4.Amount of gold bound aPrepnAmt of gold bound (mol/mg [dry wt]of cells)Replicate 1bReplicate 2Replicate 3MeanP.aeruginosa PAO1(A ϩB ϩ)0.430Ϯ0.0090.388Ϯ0.0500.417Ϯ0.0190.412Ϯ0.022P.aeruginosa AK1401(A ϩB Ϫ)0.532Ϯ0.0580.562Ϯ0.0320.522Ϯ0.0560.539Ϯ0.021d P.aeruginosa dps89(A ϪB ϩ)0.592Ϯ0.0160.524Ϯ0.0170.527Ϯ0.0550.548Ϯ0.038d P.aeruginosa rd7513(A ϪB Ϫ)0.410Ϯ0.0350.446Ϯ0.0100.425Ϯ0.0610.427Ϯ0.018Acellular control c0000a Whole cells were treated with a 1mM solution of AuCl 3for 15min at 22°C.bData are values from separate measurements of three whole-cell–metal interactions.cAmount of metal which precipitated chemically during the 15-min treatment period.dThe values for AK1401and dps89are significantly different from the values for rd7513andPAO1.FIG.6.Thin section of a gold-treated strain PAO1cell.The cell (whose surface is indicated by open arrows)is filled with numerous electron-dense precipitates of different sizes (solid arrows).Bar ϭ200nm.(Inset)EDS analysis of the electron-dense precipitates produced only a peak for gold and a broadening of the phosphorus peak (which overlapped a secondary gold peak).Similar results were obtained for all four strains.494LANGLEY AND BEVERIDGEA PPL .E NVIRON .M ICROBIOL .absorption data revealed that there were no significant differ-ences in the amounts of copper bound by the strains (Table 2).In addition,all of the copper-treated cells appeared to be similar in thin section;the metal apparently bound to the cell surface,which resulted in slight increases in electron density.These findings were at first surprising.Intuitively,we hypoth-esized that either strain PAO1(A ϩB ϩ)or strain dps89(A ϪB ϩ)would bind more copper,since these strains have more negatively charged sites in their outer membranes (as a result of the B-band LPS).Since this was not the case (the B Ϫstrains bound equal amounts of copper),it is probable that the O-side chains did not affect the extent of copper binding.Perhaps the copper was preferentially bound by other sites (such as phos-phoryl groups)within the core-lipid A regions of the LPS (which are common to all strains),while sites within the B-band O-side chain were thermodynamically unfavorable for binding.However,our findings suggest that the explanations for the remaining three metals examined are somewhat different.Atomic absorption data clearly indicated that three of the four strains (PAO1[A ϩB ϩ],AK1401[A ϩB Ϫ],and rd7513[A ϪB Ϫ])bound equal amounts of iron.This finding was supported by the fact that these three strains appeared to be similar toeach other when thin sections were examined;the cell surfaces exhibited increased electron density compared to the respec-tive controls (Fig.4).The increased iron EDS signals of the electron-dense areas confirmed that the sites where iron bind-ing occurred were limited to the cell surfaces.Since these findings were obtained for three of the four strains and since the ligand affinity of the Fe 3ϩion is greatest for phosphate and polyphosphate groups (8),it seemed reasonable to suggest that the major binding sites were common to all of the cells tested and that these sites might be the phosphoryl groups of the core-lipid A molecules in the LPS.However,the iron binding of the fourth strain,dps89(A ϪB ϩ),was significantly greater (approximately 1.5times greater)than the iron binding of the other strains.This was apparent as iron treatment caused the cells to clump together and take on a yellow-orange color.The initial pH values of the iron stock solutions were typically ϳ3.At these values,the predominant precipitate formed would be an insoluble,amorphous (hydrat-ed)iron hydroxide,Fe(OH)3(8).Once cells were added,the pH increased,and the production of precipitates by dps89(A ϪB ϩ)cells was clearly revealed by TEM.(An increase in pH also occurred in the other metal systems once the cells were added.)Most dps89cells were surrounded by precipitates which pro-duced significant iron signals when the preparations were an-alyzed by EDS.In addition,these precipitates did not diffract the electron beam,suggesting that they had an amorphous structure.We propose that the precipitates observed on the surfaces of dps89were indeed iron hydroxide.Since oxygen and hydrogen are light elements which only produce low-en-ergy X-rays (less than 200eV),only the iron portion of the precipitate would be expected to produce an easily discernible EDS signal.Indeed,the precipitates produced clustered low-electron-volt spectra,as expected for low-atomic-number ele-ments,such as H and O (Fig.5).Therefore,the observed clumping of cells may have been due to iron hydroxide precip-itates which cross-linked or entrapped neighboring cells,caus-ing them to floc and sediment,like iron-treated cell walls of Bacillus subtilis (25).Interestingly,peaks corresponding to silicon were also some-times observed in the EDS spectra.The source of the silicon was probably the glassware in which the cells were grown.It is likely that if present,silicate ions (SiO 32Ϫ),like OH Ϫions,are incorporated into an iron precipitate as it grows.Iron precipitates are especially efficient at this incorporation,and Urrutia and Beveridge (31,32)have found that silicon can be deposited on cell surfaces through amine ion bridging,in which a multivalent metal ion (such as iron)cross-links silicate anions to carboxylate or phosphate groups on the cell surface via electrostatic interaction.This is presumably the mechanismbyFIG.7.SAED pattern obtained from the intracellular gold precipitates.The diffraction pattern indicated that the precipitates were crystalline and had a lattice d -spacing value of 2.43Å,which is similar to the d -spacing value of metallic gold (2.36Å).TABLE 5.Amount of lanthanum bound aPrepnAmt of lanthanum bound (mol/mg [dry wt]of cellsReplicate 1bReplicate 2Replicate 3MeanP.aeruginosa PAO1(A ϩB ϩ)0.041Ϯ0.0040.043Ϯ0.0040.033Ϯ0.0060.039Ϯ0.005d P.aeruginosa AK1401(A ϩB Ϫ)0.240Ϯ0.0260.210Ϯ0.0280.236Ϯ0.0070.229Ϯ0.016d P.aeruginosa dps89(A ϪB ϩ)0.052Ϯ0.0050.057Ϯ0.0040.066Ϯ0.0120.058Ϯ0.007d P.aeruginosa rd7513(A ϪB Ϫ)0.031Ϯ0.0040.033Ϯ0.0060.038Ϯ0.0040.034Ϯ0.004dAcellular control c0000a Whole cells were treated with a 1mM solution of La(NO 3)3⅐6H 2O for 15min at 22°C.bData are values from separate measurements of three whole-cell–metal interactions.cAmount of metal which precipitated chemically during the 15-min treatment period.dThe values for PAO1and dps89are significantly different from each other,and the value for AK1401is significantly different from all other values.The values for PAO1and rd7513are not significantly different from one another.V OL .65,1999EFFECT OF LPS ON METAL BINDING 495。
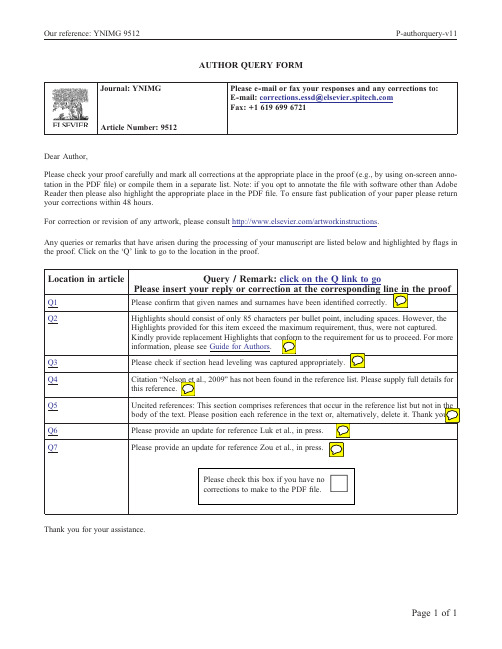

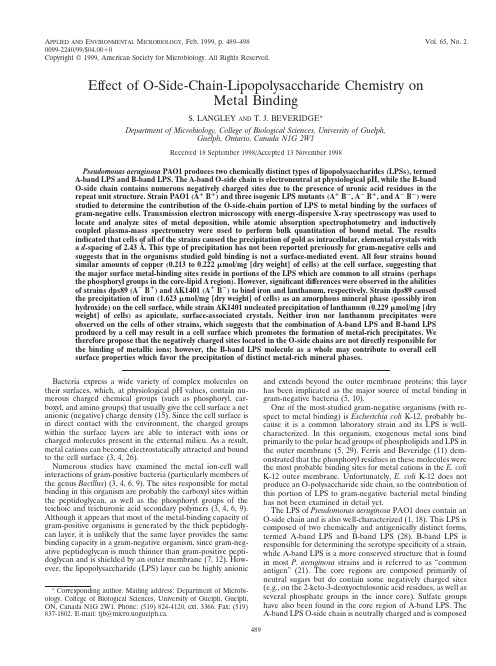
Calibration of a Ti-in-muscovite geothermometer for ilmenite-and Al 2SiO 5-bearing metapelitesChun-Ming Wu ⁎,Hong-Xu ChenCollege of Earth Science,University of Chinese Academy of Sciences,P.O.Box 4588,Beijing 100049,Chinaa b s t r a c ta r t i c l e i n f o Article history:Received 27March 2014Accepted 10November 2014Available online 18November 2014Keywords:Ti-in-muscovite Geothermometry Calibration MetapelitesThe Ti-in-muscovite geothermometer was empirically calibrated as ln[T (o C)]=7.258+0.289ln(Ti)+0.158[Mg/(Fe +Mg)]+0.031ln[P (kbar)]using ilmenite-and Al 2SiO 5-bearing assemblages in metapelites under P –T conditions of 450–800°C and 0.1–1.4GPa.The calibration was conducted for muscovites containing Ti =0.01–0.07,Fe =0.03–0.16,Mg =0.01–0.32and Mg/(Fe +Mg)=0.05–0.73,respectively,on the basis of 11ox-ygen per formula unit.Such compositional range covers more than 90%natural muscovites,and the random error of this thermometer is estimated to be of ±65°C.The geothermometer was validated against a set of indepen-dently determined temperature conditions between different degrees in samples from different prograde,inverted and contact metamorphic terranes.Application of this thermometer beyond the calibration conditions is not encouraged.©2014Elsevier B.V.All rights reserved.1.IntroductionAccurately retrieving the metamorphic P –T conditions is a funda-mental issue in understanding the tectono-thermal evolution of a meta-morphic terrane or an orogenic belt.For this regard,metapelites are important study targets due to their sensitivity in re flecting metamor-phic P –T conditions and their ubiquitous occurrence.Muscovite occurs in almost all the low-to medium-grade metapelites;thus it has been used in calibrating the garnet-muscovite Fe –Mg exchange thermometer (e.g.,Wu and Zhao,2006),the plagioclase-muscovite K –Na exchange thermometer (e.g.,Green and Usdansky,1986)and even the topaz-muscovite F –OH exchange thermometer (e.g.,Halter and Williams-Jones,1999).However,such thermometers are useless when garnet and/or plagioclase are absent from the rocks,which is not uncommon in metapelites.Therefore,calibrating a thermometer based solely on the chemical composition of metapelitic muscovite coexisting with il-menite and an Al 2SiO 5polymorphs,is not only compensatory but also easier to use.In recent years,some (nominally)single-mineral geothermometers based on trace or minor elements have been calibrated and applied in deciphering metamorphic temperature conditions in recent years,such as the Ti-in-zircon (e.g.,Watson et al .,2006;Ferry and Watson,2007),Zr-in-rutile (e.g.,Degeling,2002;Ferry and Watson,2007;Tomkins et al .,2007;Watson et al.,2006;Zack et al.,2004),Ti-in-quartz (e.g.,Wark and Watson,2006;Thomas et al .,2010),Y-in-garnet (e.g.,Pyle and Spear,2000)and Ti-in-biotite (e.g.,Henry and Guidotti,2002;Henry et al.,2005)geothermometers.The effect of pressure on Ti content of phengite in eclogites has been drawn much attention.For example,Auzanneau et al .(2010)experi-mentally calibrated a Ti-in-phengite geobarometer based on the buffer reaction among phengite,rutile and quartz or coesite,but the experi-mental P –T conditions (800–1050°C/1.5–8.0GPa)are too high for most metamorphic rocks formed in the crustal level.Furthermore,the chemical compositions of the phengites in eclogites are different from metapelitic muscovites.To investigate the temperature dependence of the intracrystalline coupled exchange Ti VI Al IV =Si VI Al IV in muscovite,the model buffer reaction (1)among muscovite,rutile and quartz 2K Al 2ðÞAlSi 3ðÞO 10OH ðÞ2þTiO 2¼K AlTi ðÞAl 2Si 2ðÞO 10OH ðÞ2þSiO 2Ms Rt Ti −Ms Qzð1Þhas been extensively studied by Chambers and Kohn (2012)for meta-pelitic muscovites in the temperature range of 400–1000°C,but it is concluded that at least this model reaction (Reaction 1)cannot be used as a thermometer (Chambers and Kohn,2012).On the contrary,we find that the Ti contents of the metapelitic muscovites coexisting with ilmenite and Al 2SiO 5polymorphs are temperature dependent.In this paper,we have empirically calibrated a Ti-in-muscovite thermometer considering natural ilmenite-and Al 2SiO 5-bearing metapelites metamorphosed at 450–800°C and 0.1–1.4GPa,based on a model buffer reaction among muscovite,ilmenite,Al 2SiO 5and quartz.The validity of this thermometer has been demonstrated by applying it to different prograde,inverted and thermal contact metamorphic terranes.Symbols of the minerals used in this paper are after Whitney and Evans (2010).Lithos 212–215(2015)122–127⁎Corresponding author.Tel.:+861088256312;fax:+861088256012.E-mail address:wucm@ (C.-M.Wu)./10.1016/j.lithos.2014.11.0080024-4937/©2014Elsevier B.V.All rightsreserved.Contents lists available at ScienceDirectLithosj o ur n a l h o m e p a g e :w ww.e l s e v i e r.c om /l o c a t e /l i t h os2.CalibrationThe concentration of Ti atoms in muscovites in ilmenite-and Al 2SiO 5-bearing metapelites gradually increases with temperature in prograde metamorphic terranes (e.g.,Lang and Rice,1985;Ríos et al .,2003;di Vincenzo et al .,2004;Weller et al .,2013),inverted metamor-phic terranes (e.g.,Dasgupta et al.,2004;Stephenson et al .,2000)and thermal contact aureoles (e.g.,Delor et al.,1984;Holdaway et al .,1988).These observations suggest the possibility of calibrating the Ti-in-muscovite geothermometer.It is found that the net-transfer reaction (Reaction 2)2K Al 2ðÞAlSi 3ðÞO 10OH ðÞ2þFeTiO 3þSiO 2¼K AlTi ðÞAl 2Si 2ðÞO 10OH ðÞ2Ms Ilm Qz Ti ‐MsþK FeAl ðÞSi 4O 10OH ðÞ2þAl 2SiO 5Fe ‐Ms And =Sil =kyð2Þmay constitute the basis of the Ti-in-muscovite geothermometer.The most reliable method to calibrate geothermometers and geobarometers is conducting reversed phase equilibrium experiments.In fact,earlier workers have done some experiments concerning the systematic change of the chemical compositions of phengite or musco-vite with changing P –T conditions.Hermann and Spandler (2008)con-ducted melting experiments of synthetic metapelites to discover the mineralogic change of subducted metapelites under P –T conditions of 600–1050°C at 2.5–4.5GPa,and found the negative relation between the Si content and temperature and the positive relation between the Si atoms and pressure (as suggested by Massonne and Schreyer,1987,1989)of the product phengite.Auzanneau et al .(2006)made melting experiments on a natural metagreywacke at P –T conditions of 800–900°C and 0.5–5GPa,to locate the eclogite –amphibolite facies transition ter,Auzanneau et al .(2010)did crystallization experiments on natural metagreywacke and metapelite and found that Ti content in the produced phengite is strongly inversely correlated with pressure,thus they concluded that Ti content of phengite may be used as a geobarometer for high temperature eclogites.Meanwhile,they found that the Ti content in phengite is positively correlated to temperature.However,the above mentioned experimental data are not ideal in constructing the Ti-in-muscovite geothermometer because (1)in most cases the produced mica is phengite,not muscovite;(2)the exper-imental temperatures of most of the runs are too high for common metapelites (Fig.1a);(3)the produced phengite is quite dissimilar in composition with the common metapelitic muscovite (Fig.1a,b)and (4)these experiments are not strictly reversed.Therefore,we calibrated this thermometer using an empirical cali-brating method,and overall considering 90ilmenite-and Al 2SiO 5-bearing metapelitic samples from the literature (Supplementary Table 1and references therein).Among these samples,48samples con-tain ilmenite but no rutile,whereas the other 42samples contain both ilmenite and rutile.These rocks were metamorphosed under P –T condi-tions of 450–800°C and 0.1–1.4GPa,respectively,determined simulta-neously by applying the garnet-biotite geothermometer (Holdaway,2000)and the GASP geobarometer (Holdaway,2001)as suggested by Wu and Cheng (2006).The cation ranges are Ti =0.01–0.07,Fe =0.04–0.16,Mg =0.01–0.32and Mg/(Fe +Mg)=0.05–0.73,respective-ly,for muscovites on the basis of 11oxygen per formula unit.It should be stated that such compositional range covers more than 90%natural muscovites (Supplementary Table 1and references therein).Selection of calibration samples fits the following criteria:(a)there is clear de-scription of textural equilibria among the mineral assemblage musco-vite +Al 2SiO 5+ilmenite +quartz +garnet +biotite +plagioclase for every sample in the literature;(b)no retrograde reaction textures are found in these rocks;(c)at least nine components (SiO 2,TiO 2,Al 2O 3,FeO,MnO,MgO,CaO,Na 2O and K 2O)were analyzed by electronicmicrobe and the high quality data are available;and (d)if there is chem-ical zoning pro file in a garnet,only chemical composition of the rims was used to determine metamorphic P –T conditions.These criteria en-sure that the muscovites used in the calibration grew simultaneously with the other minerals and thermodynamic equilibria of the assem-blages have attained.Rocks containing only rutile but no ilmenite were discarded from the calibration data set,because the rutile-related buffer reaction (Eq.1)cannot be calibrated as a thermometer (Chambers and Kohn,2012).The Ti-in-muscovite geothermometer is empirically calibrated through three dimensional surface fitting asln T o C ÀÁÂü7:258Æ0:04ðÞþ0:289Æ0:01ðÞln Ti ðÞþ0:158Æ0:03ðÞÂMg =Fe þMg ðÞ½ þ0:031Æ0:01ðÞln P kbar ðÞ½ ð3Þin which Ti,Mg and Fe are the respective cation numbers per formulaunit of the muscovites on the 11oxygen basis,and T is in °C.The multiple correlation coef ficient of the regression is R =0.932in the calibration.This formulation is similar in format to the Ti-in-biotite thermometer (Henry and Guidotti,2002;Henry et al .,2005).Errors in the parentheses in Eq.(3)are fitting but not analytical errors.(a)0.000.030.060.090.120.150.18T (°C)(b)0.000.030.060.090.120.150.18Mg/(Mg+Fe)of MsT i a t o m s i n M sT i a t o m s i n M spositional variations between the natural (Supplementary Table 1)and the ex-perimental muscovites (Tropper et al.,2005;Auzanneau et al .,2006;Hermann and Spandler,2008;Auzanneau et al .,2010).(a)Temperature versus Ti atom of the musco-vites;(b)Mg/(Mg +Fe)ratio versus Ti atom of the muscovites.123C.-M.Wu,H.-X.Chen /Lithos 212–215(2015)122–127This Ti-in-muscovite geothermometer reproduces the input garnet-biotite temperatures (Holdaway,2000)within error of ±50°C for most of the calibration samples (Supplementary Table 1;Fig.2a),although the precision of this thermometer cannot be determined due to insuf fi-cient experimental data suitable for calibrating the thermometer.Here we try to estimate the random error of the present Ti-in-muscovite thermometer,based on the calibration samples (Supplementary Table 1).An input pressure error of ±3kbar may propagate to temper-ature errors of ±4–20°C.If we assume that the analytical errors of the Ti 4+,Fe 2+and Mg 2+cations in the muscovites are as high as ±10%,then the translated temperature errors are ±13–22°C,±1–3°C and ±2–3°C,respectively.If the analytical errors of these cations are about ±5%,then the propagated temperature errors will be reduced to ±7–12°C,±0–1°C and ±0–1°C,respectively.Therefore,it seems that the random error of the Ti-in-muscovite thermometer resulted from the above error sources may be below ±45°C.In recognizing that the absolute precision of the input garnet-biotite temperatures is ±25°C when compared to the experimental temperatures (Holdaway,2000),the total random error of the present Ti-in-muscovite geothermometer can be roughly estimated to be of ±65°C.It is noticed that the random error of this thermometer is independent of either temperature (Supplementary Table 1;Fig.2b)or composition of muscovites (Supplementary Table 1;Fig.2c,d),suggesting that ithas no systematic errors and is thus valid at least over the calibration ranges.3.ApplicationThe validity of the Ti-in-muscovite geothermometer may be esti-mated through applying it to the prograde and inverted metamorphic terranes as well as the thermal contact aureoles,to see if the thermom-eter may faithfully re flect the gradual,systematic temperature changes.In the following descriptions,muscovites with Ti cation less than 0.01are discarded although such muscovites are in fact very minor in quantity.All the samples (Supplementary Table 2)used hereafter are not in-cluded in calibrating the Ti-in-muscovite geothermometer,thus they can act as independent criteria for estimating the accuracy of the pres-ent Ti-in-muscovite geothermometer.The mineral assemblages of the metamorphic terranes are summarized in Table 1.All the samples con-tain ilmenite but some samples of the lower grade zones are lack of Al 2SiO 5polymorphs.In the application,input pressures for the rocks containing plagioclase are determined by the GASP barometer (Holdaway,2001);otherwise the input pressures are designated for the samples without plagioclase,according to the pressure conditions of the metamorphic terranes.400500600700800400500600700800(a)T (T i -M s , °C )400500600700800d e l t a T (°C )(b)-100-50501000.010.020.030.040.050.060.07d e l t a T (°C )(c)-100-500501000.00.20.40.60.8d e l t a T (°C )(d)Ti atoms in Ms Mg/(Mg+Fe) of Ms-100-50050100T(GB, °C)T(GB, °C)Fig.2.Reproduction of the Ti-in-muscovite geothermometer of the input temperature (a)and random error distribution of the Ti-in-muscovite temperature versus the garnet-biotite tem-perature (b),Ti atoms of muscovite (c)and Mg/(Fe +Mg)ratio of muscovite (d).T(Ti-Ms),temperatures determined by the present Ti-in-muscovite geothermometer;T(GB),temper-atures determined by the garnet-biotite geothermometer (Holdaway,2000).Delta T,temperature difference between the present Ti-in-muscovite geothermometer and the garnet-biotite geothermometer (Holdaway,2000).124 C.-M.Wu,H.-X.Chen /Lithos 212–215(2015)122–1273.1.Prograde metamorphic terranes3.1.1.The Snow Peak prograde sequenceIn the Snow Peak area,northern Idaho,U.S.A.,Barrovian type meta-morphic sequences have been found in the metapelites(Lang and Rice, 1985):from NE to SW,the metamorphic grade progressively changes sequentially from the chlorite–biotite zone to the garnet,staurolite, transition,staurolite–kyanite and kyanite zones.During the second re-gional metamorphic event(M2),minerals formed in thefirst metamor-phic event(M1)were replaced or completely re-equilibrated;thus the mineral assemblages presently observed in the rocks are attributed to M2(Lang and Rice,1985).In these metapelites,muscovite coexists with ilmenite,kyanite,quartz,biotite and garnet.Rutile is absent in all the samples.Applying the Ti-in-muscovite and the garnet-biotite (Holdaway,2000)geothermometers to these different zone rocks dem-onstrates that these thermometers all successfully reflect the expected systematic temperature change(Supplementary Table2,Fig.3a).It is noted that Al2SiO5minerals are not present in the chlorite–biotite,gar-net and staurolite zones,although the resulting Ti-in-Ms temperatures of these zones gradually increase.3.1.2.The Danba prograde zoneExposed in the Danba area,Sichuan Province,southwest China,a typical Barrovian-type metamorphic terrane underwent metamor-phism in the early Jurassic(Weller et al.,2013).This metamorphic com-plex exposes as a dome-like sequence and the chlorite,biotite,garnet, staurolite,kyanite,kyanite–sillimanite and sillimanite zones concentri-cally gradually crop out toward the metamorphic peak area of Danba. Rutile is absent in all the samples and no Al2SiO5minerals are found in the staurolite zone.The representative kyanite,kyanite–sillimanite and sillimanite zone metapelites contain ilmenite and the Ti-in-muscovite geothermometer confirms the systematic temperature in-creasing of these zones(Supplementary Table2,Fig.3b),quite similar to the results retrieved from the garnet-biotite geothermometer (Holdaway,2000).3.2.Inverted metamorphic terrane3.2.1.The Juneau inverted zoneThis inverted metamorphic terrane is preserved in the western metamorphic belt near Juneau,Alaska,U.S.A.Thermal peak metamor-phic conditions have been reported to increase structurally upward over a distance of about8km(Himmelberg et al.,1991).Rutile is absent in all the samples.The Al2SiO5minerals are absent in the garnet and staurolite–biotite zones.Both the Ti-in-muscovite geothermometer and the garnet-biotite thermometer(Holdaway,2000)indicate similar temperature increasing progressively from the lower to the higher grade zones(Supplementary Table2,Fig.3c).3.3.Thermal contact aureoles3.3.1.The thermal contact aureole of the Augusta quadrangleField relations and micropetrographic observations indicate that both the progressive and retrogressive metamorphism of the thermal contact aureole,Augusta quadrangle,south-central Maine,U.S.A.,are closely associated with the emplacement of felsic plutonic bodies (Novak and Holdway,1981).Rutile is reported as accessory mineral but not clearly indicated to be present in which samples.The metapelitic samples all contain ilmenite and Al2SiO5minerals and thus are suitable for the Ti-in-muscovite geothermometer.Both the Ti-in-muscovite geothermometer and the garnet-biotite thermometer (Holdaway,2000)successfully discriminate the gradual temperature changes of the three metamorphic zones,i.e.,the staurolite,lower silli-manite and upper sillimanite zones(Supplementary Table2,Fig.3d).3.3.2.The regional thermal contact aureoles of the west-central MaineHoldaway et al.(1988)reported onfive regional contact metamor-phic events(M1–M5)occurred during the Devonian and Carboniferous in west-central Maine,U.S.A.,among which the M3and M5events are the two most prevalent.Each metamorphic event is closely associated with the emplacement of S-type granites,and the isograd patterns pro-duced in the surrounding pelitic schists generally mirror the geometry of the plutonic intrusive contacts.Rutile is absent in all the samples.From north to south,the metamorphic grade increases gradually and these zones are referred from lower to higher grade as Grades3,4,5,6(M3) and Grades6.5,7and8(M5),respectively(Holdaway et al.,1988).Ex-cept for the Grades3and4zones,all the other samples contain ilmenite and sillimanite.Both the present Ti-in-muscovite geothermometer and the garnet-biotite thermometer(Holdaway,2000)reflect the systematic temperature changes through the progressive metamorphic grade zones (Supplementary Table2,Fig.3e).4.DiscussionThe computed temperatures always show large deviations from the garnet-biotite temperatures(Holdaway,2000)when the present Ti-in-muscovite geothermometer are applied to metapelites which contain no ilmenite.However,these ilmenite-free samples are not listed for clarity.This,in turn,suggests that perhaps only the Ti atoms of the mus-covites buffered by ilmenite can truthfully record the metamorphic temperature conditions.Therefore,the present Ti-in-muscovite geothermometer cannot be applied to ilmenite-absent metapelites.Titanium in muscovite is a minor element and sometimes it is very di-lute.In fact,it is found that the Ti atoms of the muscovites are in the range of0.02–0.05for about70%of the natural metapelites.In some metapelitic muscovites(e.g.,Delor et al.,1984;Whitney et al.,1996)the Ti contents are negligible even if the rocks contain rutile and/or ilmenite.It seems that such metapelitic muscovites contain much fewer Ti contents as ex-pected.However,we anticipate that this is possibly because the mainTable1Summary of mineral assemblages of the metapelites in different metamorphic terranes. Cross stands for presence of the corresponding mineral.Zone Qz Chl Ms Bt Grt St Ky Sil And Ilm Gr Pl KfsThe Snow Peak prograde sequence,USA(Lang and Rice,1985)Chl-Bt××××××××Grt××××××××St×××××××××Trans.××××××××××St-Ky×××××××××Ky××××××××The Danba prograde zone,China(Weller et al.,2013)St××××××××Ky×××××××××Ky-Sil×××××××××Sil××××××××The Juneau inverted zone,USA(Himmelberg et al.,1991)Grt×××××××St-Bt×××××××L.Ky-Bt×××××××××H.Ky-Bt××××××××Sil××××××××The thermal contact aureole of Augusta,USA(Novak and Holdway,1981)St××××××××××L.Sil××××××××××U.Sil×××××××××The regional thermal contact aureoles of west-central Maine,USA(Holdawayet al.,1988)Grade3××××××××Grade4××××××××Grade5×××××××××Grade6××××××××Grade6.5××××××××Grade7×××××××××Grade8××××××××125C.-M.Wu,H.-X.Chen/Lithos212–215(2015)122–127components (e.g.,Al,Si)of muscovite might be at equilibrium with other coexisting minerals,but not Ti.However,this is highly speculative and hard to demonstrate at present.Under such circumstances (Ti b 0.01apfu)the present Ti-in-muscovite geothermometer cannot be applied.In ilmenite-and/or rutile-bearing metapelites,ilmenite and/or rutile extract the majority contents of Ti of the rock,leaving the remaining small amounts of Ti contents partitioned into biotite and muscovite.Furthermore,biotite contains more Ti contents than muscovite in metapelites.For example,X Ti [=Ti/(Fe +Mg +Al VI +Ti)]of biotite ranges between 3and 7mol.%when considering the representative metapelitic biotite listed in Supplementary Table 1.On the contrary,X Ti [=Ti/(Fe +Mg +Al VI +Ti)]of muscovite ranges between 1and 3mol %(Supplementary Table 1).Metamorphic zone (a)T (°C)Metamorphic zone(b)T (°C)500600700Metamorphic zone (c)T (°C )(e)420520620720Metamorphic gradeT (°C)(d)Metamorphic zoneT (°C )St U. SilL. Sil Fig.3.Application of the present Ti-in-muscovite geothermometer to the typical metamorphic terranes (Supplementary Table 2).All these samples are not used in calibrating the Ti-in-muscovite geothermometer.T(Ti-Ms),temperatures determined by the present Ti-in-muscovite geothermometer;T(GB),temperatures determined by the garnet-biotite geothermometer (Holdaway,2000).(a)The Snow Peak prograde sequence (Lang and Rice,1985).Trans.,transition zone;(b)The Danba prograde zones (Weller et al .,2013).Ky –Sil,ky-anite –sillimanite transition zone;(c)The Juneau inverted metamorphic zones (Himmelberg et al .,1991).L.Ky –Bt,lower kyanite –biotite transition zone;H.Ky –Bt,higher kyanite –biotite transition zone;(d)The thermal contact aureole,Augusta quadrangle,south-central Maine,U.S.A.(Novak and Holdway,1981).L.Sil,lower sillimanite zone;U.Sil,upper sillimanite zone;(e)The regional thermal contact aureoles of west-central Maine (Holdaway et al .,1988).The metamorphic Grade 6.5refers to the transition zone between Grades 6and 7.126 C.-M.Wu,H.-X.Chen /Lithos 212–215(2015)122–127It is found that the following two competitive reactions (3)and (4)may possibly explain the mechanism of Ti contents entering the muscovite and biotite,respectively.K Fe 3ðÞAlSi 3ðÞO 10OH ðÞ2þK Al 2ðÞAlSi 3ðÞO 10OH ðÞ2þ3TiO 2AnninBt Ms Rt¼K AlTi ðÞAl 2Si 2ðÞO 10OH ðÞ2þK FeAl ðÞSi 4O 10OH ðÞ2þ2FeTiO 3Ti ‐Ms Fe ‐Ms Ilm ð3ÞK Fe 3ðÞAlSi 3ðÞO 10OH ðÞ2þK Al 2ðÞAlSi 3ðÞO 10OH ðÞ2þFeTiO 3þTiO 2Ann inBt Ms Ilm RtþAl 2SiO 5¼2K Fe 2Ti ðÞAl 3Si ðÞO 10OH ðÞ2þ5SiO 2And =Sil =Ky Fe ‐Ti ‐Bt Qzð4ÞBut unfortunately,it remains unclear to what extent that biotite changes the whole partitioning of the Ti content in the rock and the ef-fective Ti content of muscovite,because this depends on different molar quantities of biotite and muscovite in the rock,which are different from rock to rock.Therefore,it should be stated that although the Ti-in-muscovite geothermometer is not as precise as expected,it is still an empirical,complementary tool when the garnet-biotite (Holdaway,2000)or garnet-muscovite (Wu and Zhao,2006)thermometers lose their usage due to absence of garnet or biotite.5.ConclusionThe Ti-in-muscovite geothermometer can be applied to TiO 2-saturat-ed,ilmenite-and Al 2SiO 5-bearing natural metapelites in the temperature range of 450–800°C to muscovites within the cation ranges of Ti =0.01–0.07,Fe =0.04–0.16,Mg =0.01–0.32and Mg/(Mg +Fe)=0.05–0.73of muscovites for estimating the metamorphic temperature conditions of low-to medium-grade metapelites.The total random error of this thermometer is estimated to be around ±65°C.The application of the present Ti-in-muscovite geothermometer is encouraged to neither metapelites beyond the calibration range nor to metapelites containing no ilmenite.Supplementary data to this article can be found online at /10.1016/j.lithos.2014.11.008.AcknowledgmentsDetailed reviews by Prof.Robin Of fler,an anonymous referee and the editorial review by Prof.Marco Scambelluri have substantially im-proved both the science and the English of the original manuscript.This research was supported by the National Natural Science Founda-tion of China (41225007).ReferencesAuzanneau,E.,Vielzeuf,D.,Schmidt,M.W.,2006.Experimental evidence of decompres-sion melting during exhumation of subducted continental crust.Contributions to Mineralogy and Petrology 152,125–148.Auzanneau,E.,Schmidt,M.W.,Vielzeuf,D.,Connolly,J.A.D.,2010.Titanium in phengite:ageobarometer for high temperature eclogites.Contributions to Mineralogy and Pe-trology 159,1–24.Chambers,J.A.,Kohn,M.J.,2012.Titanium in muscovite,biotite,and hornblende:model-ing,thermometry,and rutile activities of metapelites and amphibolites.American Mineralogist 97,543–555.Dasgupta,S.,Ganguly,J.,Neogi,S.,2004.Inverted metamorphic sequence in the SikkimHimalayas:crystallization history,P –T gradient and implications.Journal of Meta-morphic Geology 22,395–412.Degeling,H.S.,2002.Zircon equilibria in metamorphic rocks.Unpublished Ph.D.disserta-tion,Australian National University,Canberra,231pp.Delor, C.P.,Burg,J.P.,Leyreloup, A.F.,1984.Staurolite producing reactions andgeothermobarometry of a high pressure thermal aureole in the French Massif Central.Journal of Metamorphic Geology 2,55–72.Di Vincenzo,G.,Carosi,R.,Palmeri,R.,2004.The relationship between Tectono –metamor-phic evolution and argon isotope records in white mica:constraints from in situ 40Ar –39Ar laser analysis of the Variscan basement of Sardinia.Journal of Petrology 45,1013–1043.Ferry,J.M.,Watson,E.B.,2007.New thermodynamic models and revised calibrations forthe Ti-in-zircon and Zr-in-rutile thermometers.Contributions to Mineralogy and Pe-trology 154,429–437.Green,N.L.,Usdansky,S.I.,1986.Toward a practical plagioclase –muscovite thermometer.American Mineralogist 71,1109–1117.Halter,W.E.,Williams-Jones,A.E.,1999.Application of topaz-muscovite F –OH exchangeas a geothermometer.Economic Geology 94,1249–1258.Henry,D.J.,Guidotti,C.V.,2002.Titanium in biotite from metapelitic rocks:temperatureeffects,crystal-chemical controls,and petrologic applications.American Mineralogist 87,375–382.Henry,D.J.,Guidotti,C.V.,Thomson,J.A.,2005.The Ti-saturation surface for low-to-medium pressure metapelitic biotites:implications for geothermometry and Ti-saturation mechanisms.American Mineralogist 90,316–328.Hermann,J.,Spandler,C.J.,2008.Sediment melts at sub-arc depths:an experimentalstudy.Journal of Petrology 49,717–740.Himmelberg,G.R.,Brew,D.A.,Ford,A.B.,1991.Development of inverted metamorphicisograds in the western metamorphic belt,Juneau,Alaska.Journal of Metamorphic Geology 9,165–180.Holdaway,M.J.,2000.Application of new experimental and garnet Margules data to thegarnet-biotite geothermometer.American Mineralogist 85,881–892.Holdaway,M.J.,2001.Recalibration of the GASP geobarometer in light of recent garnetand plagioclase activity models and versions of the garnet-biotite geothermometer.American Mineralogist 86,1117–1129.Holdaway,M.J.,Dutrow,B.L.,Hinton,R.W.,1988.Devonian and carboniferous metamor-phism in west –central Maine:the muscovite –almandine geobarometer and the stau-rolite problem revisited.American Mineralogist 73,20–47.Lang,H.M.,Rice,J.M.,1985.Regression modelling of metamorphic reactions inmetapelites,Snow Peak,Northern Idaho.Journal of Petrology 26,857–887.Massonne,H.-J.,Schreyer,W.,1987.Phengite geobarometry based on the limiting assem-blage with K-feldspar,phlogopite,and quartz.Contributions to Mineralogy and Pe-trology 96,212–224.Massonne,H.-J.,Schreyer,W.,1989.Stability field of the high-pressure assemblage talc +phengite and two new phengite barometers.European Journal of Mineralogy 1,391–410.Novak,J.M.,Holdway,M.J.,1981.Metamorphic petrology,mineral equilibria,andpolymetamorphism in the Augusta quadrangle,south-central Maine.American Min-eralogist 66,51–69.Pyle,J.M.,Spear,F.S.,2000.An empirical garnet (YAG)–xenotime thermometer.Contribu-tions to Mineralogy and Petrology 138,51–58.Ríos,C.,García,C.,Takasu,A.,2003.Tectono –metamorphic evolution of the SilgaráForma-tion metamorphic rocks in the southwestern Santander Massif,Colombian Andes.Journal of South American Earth Sciences 16,133–154.Stephenson,B.J.,Waters,D.J.,Searle,M.P.,2000.Inverted metamorphism and the MainCentral Thrust:field relations and thermobarometric constraints from the Kishtwar Window,NW Indian Himalaya.Journal of Metamorphic Geology 18,571–590.Thomas,J.B.,Watson,E.B.,Spear,F.S.,Shemella,P.T.,Nayak,S.K.,Lanzirotti,A.,2010.TitaniQ under pressure:the effect of pressure and temperature on the solubility of Ti in quartz.Contributions to Mineralogy and Petrology 160,743–759.Tomkins,H.S.,Powell,R.,Ellis,D.J.,2007.The pressure dependence of the zirconium-in-rutile thermometer.Journal of Metamorphic Geology 25,703–713.Tropper,P.,Konzett,J.,Finger,F.,2005.Experimental constraints on the formation of high-P/high-T granulites in the Southern Bohemian Massif.European Journal of Mineralo-gy 17,343–356.Wark,D.A.,Watson,E.B.,2006.TitaniQ:a titanium-in-quartz geothermometer.Contribu-tions to Mineralogy and Petrology 152,743–754.Watson,E.B.,Wark,D.A.,Thomas,J.B.,2006.Crystallization thermometers for zircon andrutile.Contributions to Mineralogy and Petrology 151,413–433.Weller,O.M.,St-Onge,M.R.,Waters,D.J.,Rayner,N.,Searle,M.P.,Chung,S.L.,Palin,R.M.,Lee,Y.H.,Xu,X.,2013.Quantifying Barrovian metamorphism in the Danba Structural Culmination of eastern Tibet.Journal of Metamorphic Geology 31,909–935.Whitney,D.L.,Evans,B.W.,2010.Abbreviations for names of rock-forming minerals.American Mineralogist 95,185–187.Whitney,D.L.,Mechum,T.A.,Kuehner,S.M.,Dilek,Y.R.,1996.Progressive metamorphismof pelitic rocks from protolith to granulite facies,Dutchess County,New York,USA:constraints on the timing of fluid in filtration during regional metamorphism.Journal of Metamorphic Geology 14,163–181.Wu,C.M.,Cheng,B.H.,2006.Valid garnet –biotite (GB)geothermometry and garnet –alu-minum silicate –plagioclase –quartz (GASP)geobarometry in metapelitic rocks.Lithos 89,1–23.Wu,C.M.,Zhao,G.C.,2006.Recalibration of the garnet –muscovite (GM)geothermometerand the garnet –muscovite –plagioclase –quartz (GMPQ)geobarometer for metapelitic assemblages.Journal of Petrology 47,2357–2368.Zack,T.,Moraes,R.,Kröner,A.,2004.Temperature dependence of Zr in rutile:empiricalcalibration of a rutile thermometer.Contributions to Mineralogy and Petrology 148,471–488.127C.-M.Wu,H.-X.Chen /Lithos 212–215(2015)122–127。

中国环境科学 2021,41(1):151~160 China Environmental Science 单原子Co-C-N催化过一硫酸盐降解金橙Ⅱ徐劼1,2,王柯晴1,田丹1,吴梅1,李思佳1,鲍秀敏1,许晓毅1*(1.苏州科技大学环境科学与工程学院,江苏苏州215009;2.中钢集团天澄环保科技股份有限公司,湖北武汉 430080)摘要:采用模板蚀刻法合成单原子Co-C-N催化剂并催化过一硫酸盐(PMS)降解偶氮染料金橙(AO7).Ⅱ考察了催化剂投加量、PMS浓度、pH值和染料废水中常见的Cl-对Co-C-N/PMS体系去除AO7的影响,探讨了体系的反应机理,分析了矿化能力和催化剂重复利用性能.结果表明,在Co-C-N/PMS 体系中,反应随着催化剂投加量和PMS浓度的升高而加快,pH=3.0~9.0的范围内均能有效去除AO7.中性条件下,当Co-C-N投加量50mg/L、PMS浓度1.0mmol/L、AO7浓度0.05mmol/L时,AO7可在10min内被完全去除.非均相体系活化产生的SO4·-是降解AO7的主要活性物种,基于C基诱导PMS产生的1O2也通过非自由基体系参与了降解反应,反应主要发生在催化剂表面.Co-C-N/PMS体系对AO7具有优良的去除能力和矿化效果.相较于单独Co-C-N吸附AO7过程,Co-C-N/PMS体系在提高反应速率的同时极大提升了催化剂的重复利用性能.关键词:单原子;硫酸根自由基(SO4·-);氧化;单线态氧(1O2)中图分类号:X703 文献标识码:A 文章编号:1000-6923(2021)01-0151-10Degradation of AO7 with peroxymonosulfate catalyzed by Co-C-N single atom. XU Jie1,2, WANG Ke-qing1, TIAN Dan1, WU Mei1, LI Si-jia1, BAO Xiu-min1, XU Xiao-yi1* (1.School of Environmental Science and Engineering, Suzhou University of Science and Technology, Suzhou 215000, China;2.Sinosteel Tiancheng Environmental Protection Science & Technology Co., Ltd, Wuhan 430080, China). China Environmental Science, 2021,41(1):151~160Abstract:M onoatomic Co-C-N catalyst was synthesized by a template etching method and then was used to activate peroxymonosulfate (PMS) for degradation of decolorize azo dye orange 7 (AO7). The effects of catalyst dosage, PMS concentration, pH value of reaction medium and Cl- commonly exists in dye wastewater on the removal of AO7 in Co-C-N/PM S system were systematically evaluated. The reaction mechanism was inferred, the mineralization ability and the reuse of catalyst were investigated. Experimental results showed that Co-C-N can effectively activate PMS to degrade AO7, and the reaction rate for AO7 removal can be accelerated with an increase in Co-C-N dosage and PMS concentration. AO7 can be removed effectively in the range of pH=3.0 to 9.0. When the concentration of Co-C-N dosage、the PM S and AO7 concentration were 50mg/L、1.0mmol/L and 0.05mmol/L respectively, AO7 can be completely removed within 10min under a neutral condition. SO4·- produced by PM S activation of heterogeneous system was the main active species for the degradation of AO7, and 1O2 produced by C-induced PM S was also involved in the degradation reaction through non-free radical system. The oxidation reaction mainly occurs on the surface of the catalyst. Co-C-N/PM S system has excellent removal ability and strong mineralization effect for AO7. Compared with the single Co-C-N adsorption process of AO7, Co-C-N/PM S system not only can increases the reaction rate, but also greatly improves the recyclability of the catalyst.Key words:monoatom;sulfate radical;oxidation;singlet oxygen人工合成染料已经广泛应用于制造业等领域,其中绝大多数都为偶氮染料.偶氮染料具有生物毒性和致癌风险[1],而常见的物理吸附、化学混凝沉淀和生物好氧厌氧等处理工艺并不能有效去除偶氮染料[2-3].基于活化过一硫酸盐(PMS)进行高级氧化的技术近年来引起了人们的广泛关注.在中性条件下,SO4·-的还原电位高于羟基自由基(·OH),同时SO4·-比·OH的pH值适应范围更广[4].UV[5]、热[5]、过渡族金属离子[7]等活化PMS进行高级氧化的技术已被广泛报道.Co2+被认为是活化PMS的最佳金属催化剂之一[8],为了克服溶解态Co2+有毒、均相体系pH值适用范围窄等缺点,研究人员开发出含有Co及其氧化物的材料来对PMS进行活化[9-10].碳质材料是金属催化剂理想的载体,不含杂质金属,且比表面积较高[11],近年来通过碳制材料诱导PMS以非自由基方式降解污染物的高级氧化体系已见诸报道[12].但碳制材料负载非均相活化方式仍然存在反收稿日期:2020-05-15基金项目:国家自然科学基金资助项目(51778391);水体污染控制与治理科技重大专项(2017ZX07201001)* 责任作者, 教授,********************.cn152 中国环境科学 41卷应速度较低的问题,如何提升催化反应速率仍值得深入探究.本文通过化学键键合将Co分散在碳质材料上,在提高催化剂的稳定性减少金属离子浸出的同时,提高催化剂的催化效率.单原子催化剂(通常称为M-C-N)因其能够最大限度地暴露具有催化活性的金属反应位点,碳氮骨架提供基于非自由反应催化途径,进而提高催化反应速度,成为催化领域的研究热点.作为催化反应活性中心的金属以原子方式分散在碳氮骨架上使单原子催化剂在许多催化反应中表现出高活性,如C-H键的选择性氧化[13]、氧还原反应[14]和硝基芳烃的加氢偶联反应[15].但单原子催化剂在高级氧化中的应用研究尚少,本文采用Co 合成单原子催化剂Co-C-N并以偶氮染料AO7为目标污染物对Co-C-N/PMS体系在降解反应中的各种影响因素和反应机理进行了探讨.研究结果可为Co-C-N/PMS体系氧化降解有机污染物的过程特性研究提供参考.1材料和方法1.1实验材料与试剂乙酸钴(Co(CH3COO)2·4H2O)、1,10-菲罗啉(C12H8N2·H2O)、无水乙醇(CH3CH2OH)和氢氧化镁(Mg(OH)2)购于上海阿拉丁生化科技股份有限公司;金橙Ⅱ(AO7)购于国药集团化学试剂有限公司;过一硫酸盐(KHSO5·0.5KHSO4·0.5K2SO4,PMS)、5,5-二甲基-1-吡咯啉-N-氧化物(DMPO)、4-氨基-2,2,6,6-四甲基哌啶(TEMP)购于西格玛奥德里奇中国有限公司;硫酸(H2SO4)、氢氧化钠(NaOH)、亚硝酸钠(NaNO2)、氯化钠(NaCl)、甲醇(CH3OH)、叔丁醇(C4H9OH)、苯酚(C6H5OH)、糠醇(C5H6O2)、抗坏血酸(C6H8O6)和腐殖酸(HA)均为分析纯,硝酸(HNO3)为优级纯.1.2实验方法1.2.1模板蚀刻法合成Co-C-N催化剂采用改进的模板蚀刻法合成单原子Co-C-N催化剂[15].在100mL无水乙醇中加入0.6mmol Co (CH3COO)2·4H2O,完全溶解后加入 1.8mmol C12H8N2·H2O,继续搅拌至完全溶解后进行超声.超声作用15min后继续加入5.0g M g(OH)2,再超声20min.然后将烧杯转移至油浴锅中,杯中混合物在50℃油温下磁力搅拌10h.待乙醇完全蒸发后,将干燥的固体使用研钵研磨成粉并过100目筛.粉末加入样品舟转移至气氛炉中,以2℃/min的升温速度升温至700℃后保持2.0h.冷却至室温后将产物在1.0mol/L的H2SO4中搅拌4.0h并重复2次,以完全溶解作为模板的Mg(OH)2和未稳定负载的Co.酸洗后用乙醇和DI水洗涤催化剂3次,经抽滤后将固体在60℃下真空干燥即得到Co-C-N.使用相同方法合成无金属的C-N.1.2.2 AO7去除实验 AO7去除实验在25℃室温下,于玻璃反应瓶中进行,反应液的总体积为100mL.先加入一定量的AO7和PMS,使用50mmol/L磷酸盐缓冲液、1%浓度的H2SO4和NaOH调节反应pH 值到预设值后加入Co-C-N启动反应,并在反应过程中使用酸碱微调保持设定pH值不变.在预定时间取样并使用0.20mol/L的NaNO2猝灭终止反应.迅速用0.45µm水相针式过滤器过滤,采用紫外可见光分光度计(M apuda UV 1600),于AO7最大吸收波长484nm处测定样品的吸光度,代入标准曲线计算对应浓度C,去除率P=(C0-C)/C0×100%,每组反应设置2个平行.1.2.3分析方法采用WTW inLab pH7110型pH 计测定pH值;采用ThermoFischer-ESCALAB 250Xi 型X射线光电子能谱仪(XPS)、S-4800型扫描电子显微镜(SEM)、JEOL-2100型透射电子扫描镜(TEM),Rigaku-TTRAX III型X射线粉末衍射仪(XRD)和Micromeritics-ASAP 2460比表面与孔隙度分析仪(BET)对材料进行表征;采用JEOL-FA200型电子自旋共振顺磁波谱仪(EPR)对反应过程中产生的自由基进行鉴定;采用岛津TOC-L总有机碳分析仪测定总有机碳的变化;采用Tthermofisher iCAP Qc电感耦合等离子体质谱(ICP-MS)对反应过程中金属离子的渗出量进行检测.2结果与讨论2.1Co-C-N表征分析Co-C-N的SEM图像见图1,Co-C-N颗粒呈破碎多孔的胶囊状,表面具有卷曲片状结构,卷曲片表面有许多蚀刻褶皱,有利于Co-C-N比表面积的提升和钴离子的分散.Co-C-N的HR-TEM图1期 徐 劼等:单原子Co -C -N 催化过一硫酸盐降解金橙Ⅱ 153像见图2,显示出卷曲水波纹状的片状结构和空心破碎的胶囊轮廓,这与SEM 的形貌相同;更高倍率下发现颗粒外壳由4~6层石墨烯组成,这些结构特点使得Co - C -N 的比表面积达到806.71m 2/g,有利于对污染物的吸附并为降解反应提供充足的反应位点.(a) ×20000(b) ×100000图1 Co -C -N 的SEM 图 Fig.1 SEM diagram of Co -C -N图2 Co -C -N 的HR -TEM 图 Fig.2 HR -TEM diagram of Co -C -NCo -C -N 的XRD 图谱如图3,反应前仅在25°处有一个带宽较宽的峰,这对应还原态石墨烯(rGO) 002面的衍射峰,计算得层间距为0.341nm,这与HR -TEM 中展现的石墨烯层间距相同,而43°处峰高较小的衍射峰对应101峰面.Co -C -N 反应后在11°和33°处新增衍射峰,可能是反应过程中催化剂表面吸附了污染物和降解中间产物,反应后Co -C -N 的比表面积下降到590.66m 2/g 印证了这一观点.反应前后均未观察到钴金属及其氧化物的特征衍射峰,表明钴在反复的酸洗后如果仍然存在于材料上,那么这些钴是高度分散和无定形的状态[15].XPS 半定量分析表明Co 的存在约为0.33at%,这一负载与一些已报道的单原子催化剂类似[13-14].204060 80 100反应前2θ(°)反应后图3 Co -C -N 的XRD 图谱 Fig.3 XRD patterns of Co -C -Nρ(Co -C -N)=50mg/L, c (AO7)=0.05mmol/L, c (PMS)=0.50mmol/L, pH=7.00,T =25℃2.2 AO7在不同体系下的去除效果及机理154中 国 环 境 科 学 41卷0 10 2030 40 50t (min) C /C 0图4 不同体系去除AO7的效果Fig.4 Removal effect of AO7 in different Systems固定催化剂质量浓度为50mg/L,PMS 浓度为1.0mmol/L,AO7浓度为0.05mmol/L,pH=7.00的条件下,研究不同体系对AO7的去除效果,实验结果如图4.由图可知,单独的PMS 对AO7没有降解效果,常见的Co 3O 4/PMS 体系在45min 反应时间内仅能去除47.5%的AO7.当单独投加Co -C -N 时对AO7有明显的吸附作用,相同时间内可吸附57.5%的AO7,这与C -N 对AO7的吸附效果相似.45min 内C -N/PMS 体系对AO7的去除率为76.4%,而Co -C -N/PMS 体系在10min 内即可完全去除AO7,在所有的体系中效果最佳.C -N和Co -C -N 对AO7良好的吸附效果因为其比表面积大;C -N/PMS 体系中可能存在基于C 基的非自由基氧化降解[16],从而提升了对AO7的去除效果,这一猜想在后文进一步印证.而Co -C -N/ PMS 体系良好的去除效果则得益于分散负载在石墨烯表面的Co 2+活化PMS 产生强氧化性的自由基[式(1)和式(2)].由图5(a)中Co 2p 的XPS 光谱扫描可知,反应前后Co -C -N 中Co 元素化学价的变化情况.Co 2p 分别在780.2和781.8eV 处分别对应Co3+和Co 2+,在Co -C -N 催化剂使用前分别占比55.22%和44.78%,而使用后变化为48.96%和51.04%.由图5(b)中C 1s 光谱可知,在284.6,285.8和288.35eV 处分别对应碳碳键、碳氧单键和碳氧双键.反应前3种C 的含量分别为57.19%、25.68%和16.23%;而反应后变为62.68%、24.87%和12.45%,即C=O 减少而C -C 增多.Co -C -N 体系中,反应后具有催化活性的Co 2+含量较反应前上升了6.26%,可能是因为在C -N 载体上Co 3+被HSO 5-还原生成Co 2+[式(3)和式(4)][17-18],这一反应过程也是C=O 减少的原因.2+3+-54Co +HSO Co +SO +OH −⋅−→ (1) -244SO + OH SO +OH ⋅−−⋅→ (2) 3+2++55Co +HSO Co +SO H −⋅−→+ (3)2-542SO +O SO +O ⋅−⋅−→ (4)770780790 800 810结合能(eV)280284288 292 296结合能(eV)图5 反应前后Co -C -N 中Co 2p 和C 1s 的XPS 光谱 Fig.5 XPS spectra of Co 2p and C 1s in Co -C -N before andafter reactionρ(Co -C -N)=50mg/L, c (AO7)=0.05mmol/L, c (PMS)=0.50mmol/L, pH=7.00,T =25℃2.3 催化剂投加量的影响AO7浓度为0.05mmol/L,PMS 浓度为0.50mmol/L,pH=7.00时,催化剂投加量对AO7去除速度的影响结果如图6(a).当不投加PMS 时,AO7的去除仅依靠催化剂的吸附作用.Co -C -N 投加量为20,50和100mg/L 时,在60min 反应时长内,AO7的吸附去除率分别为27.5%、55%和85%;当投加150mg/L 的Co -C -N 时,可以在45min 内完全吸附AO7.1期 徐 劼等:单原子Co -C -N 催化过一硫酸盐降解金橙Ⅱ 155同时投加Co -C -N 和PMS 时,随Co -C -N 投加量的增大,AO7的去除速度明显加快.当Co -C -N 投加量为20,50,100和150mg/L 时,去除AO7的一级反应速率常数K abs 分别为0.1145,0.2231,0.4825和0.6785min -1,相比单纯吸附作用对AO7的去除速度明显加快,且反应速率的增长与催化剂投加量线性相关(R 2=0.996). 2.4 PMS 投加量的影响AO7浓度为0.05mmol/L,Co -C -N 质量浓度为50mg/L,pH=7.00时,PMS 投加量对AO7去除反应速度的影响结果如图6(b).当PMS 浓度为AO7的5,10,20和40倍时,一级反应速率常数K abs 分别为0.078,0.2295,0.4735和0.963min -1,AO7的去除速度随PMS 浓度的增大明显加快,且反应速率的增长与PMS 投加量线性相关(R 2=0.999).相较不投加PMS 的吸附体系,对AO7去除效能优势明显. 2.5 反应体系中pH 值的影响保持反应体系中AO7(0.05mmol/L)、Co -C -N (50mg/L)和PMS(0.50mmol/L)的浓度不变,分析不同pH 值对AO7的吸附与降解效果的影响,结果如图6(c).Co -C -N 对AO7的吸附作用受pH 值的影响不大,30min 内吸附率为45%~55%.在Co -C -N/PMS 体系中,酸性条件下反应速度受到轻微抑制,完全去除AO7的反应时长增加到30min.为了解释这一现象,使用质量滴定法测得Co -C -N 材料零电荷点(pH pzc )=8.21.在酸性条件下催化剂表面会携带正电荷,此时HSO 5-基团中的O -O 容易形成氢键从而携带正电,阻碍了HSO 5-与催化剂表面的接触和反应[19],从而抑制了反应进行.在pH=9.0时,PMS 会被碱活化生成单线态氧(1O 2)去除AO7[20],提升了反应速度.在不同pH 值下Co -C -N/PMS 体系对AO7的去除速度均未受到明显影响,有效克服了均相高级氧化过程对pH 值的依赖.2.6 Cl -离子和腐殖酸(HA)对反应体系的影响在实际的印染废水中往往存在大量Cl -,Cl -对硫酸根自由基高级氧化的反应过程有一定影响[21].当ρ(Co -C -N)=50mg/L,c (AO7)=0.05mmol/L,c (PMS)=0.50mmol/L,pH=7.00时,图6(d)为不同Cl-浓度对去除AO7的影响.随着溶液中Cl -浓度升高,AO7的去除速度也显著提高.这是因为HSO 5-和SO 4·-可以与Cl -反应生成具有强氧化性的HOCl [式(5)~式(10)][22-24],而HOCl 是一种优秀的偶氮染料漂白剂,对AO7具有良好的降解效果[25],从而加快AO7的去除速度.实际生产废水中含有天然有机质(NOM)也会对高级氧化过程产生影响,在反应体系中添加HA 以模拟NOM 对Co -C -N/PMS 体系的影响.由图6(e)可知,当HA 投加量为5mg/L 和20mg/L 时,完全去除AO7所需反应时长提升到30min 和45min.这主要是因为NOM 会阻碍污染物与催化剂反应位点的接触,影响其吸附与氧化的速度,并与AO7竞争反应体系中的自由基,从而延长反应时间.Co -C -N/PMS 体系在较高的HA 浓度下依旧在45min 内实现了对AO7的完全去除,具有较好的环境适应性. 2-54Cl +HSO SO +HOCl −−→ (5) -244Cl Cl +SO SO ⋅−⋅−↔+ (6)-2Cl +Cl Cl −⋅⋅→ (7)-222Cl +Cl Cl +2Cl ⋅−⋅−→ (8) -+254222Cl +HSO +H SO +Cl +H O −−→ (9)+22(aq)-Cl +H O HOCl+H +Cl → (10)0 10 20 30 40 5060C /C 0t (min)0102030 40 50 60 00.20.40.60.81.0C /C 0t (min)156中 国 环 境 科 学 41卷0 5 10 15 20 253000.2 0.4 0.6 0.81.0C /C 0t (min)0510 15 20 00.20.40.60.81.0C /C 0t (min)51015202530354045C /C 0t (min)图6 (a) 催化剂投加量 (b ) PMS 浓度 (c) pH 值 (d) Cl -浓度和(e) HA 浓度对AO7去除效果的影响Fig.6 Effect of (a) catalyst dosage (b) PMS concentration (c) initial pH and (d) Cl -concentration and (d) HA concentration on theremoval of AO72.7 Co -C -N/PMS 体系猝灭及EPR 实验为了研究Co -C -N/PMS 氧化降解AO7的机理,进行活性物种猝灭实验以鉴别体系中自由基与非自由基体系对AO7降解的贡献,结果如图7所示.甲醇(MeOH)与SO 4·-和·OH 的反应速率分别为(1.6~7.7)×107和(1.2~2.8)×109L/(mol·s),对2种自由基均能猝灭,而叔丁醇(TBA)与SO 4·-的反应速率仅为(4.0~9.1)×105L/(mol·s),远低于与·OH 的(3.8~ 7.6)×108L/(mol·s),而这2种物质几乎不与1O 2反应,故常用MeOH 和TBA 对活化PMS 进行高级氧化反应抑制效果的高低来判断溶液中的自由基种类[26].糠醇(FFA)对SO4·-与·OH 均有较高的反应速率,与1O 2的反应速率也达到1.2×10⁸L/(mol·s),可以同时清除溶液中的自由基与1O 2.通过FFA 与MeOH 和TBA 的猝灭效果对比可以鉴定反应体系中的1O 2的贡献[27].空白对照实验中去除AO7的一级反应速率常数为0.2286min -1,当投加500mmol/L的TBA 和MeOH 时分别为0.1992和0.1086min -1,2者对反应的抑制率为12.9%和52.5%.因此在AO7的降解中·OH 的贡献率为12.9%,而SO 4·-的贡献率为39.6%.这说明在中性条件下溶液中SO 4·-为自由基体系中的主要活性物种.由于FFA 对SO 4·-的反应速率远高于MeOH,为保持2者对SO 4·-清除效果相似,选择投加1mmol/L 的FFA 进行猝灭.反应速率常数为0.0501min -1,对反应的抑制率达到78.1%,高于500mmol/L M eOH 对反应52.5%的抑制率.这说明在中性条件下溶液中存在1O 2,对去除AO7的贡献率为25.6%.1O 2氧化污染物的过程对pH 值不敏感[28],这也是Co -C -N/PMS 体系pH 值适应性好的原因之一.苯酚、TBA 和MeOH 的介电常数分别为9.78、12.47和33.0,它们的极性逐渐减小,且苯酚含有疏水性的苯基,使得苯酚更易聚集在材料表面,更适合作为非均相体系中催化剂表面自由基的清除剂[29].苯酚对活化PMS 体系中常见的SO4·-与·OH 反应速率分别达到8.8×10⁹和6.6×10⁹L/(mol·s) ,而在中性条件1期 徐 劼等:单原子Co -C -N 催化过一硫酸盐降解金橙Ⅱ 157下对1O 2的反应速率为3.0×10⁶L/(mol·s)[30].投加1mmol/L 苯酚在单纯Co -C -N 吸附AO7的体系中几乎不影响吸附,但在Co -C -N/PMS 体系中对反应的抑制尤为明显,反应速率常数为0.0444min -1,抑制率为82.5%.这表明中性条件下反应主要在催化剂表面发生.抗坏血酸(AA)对反应体系中各活性物种均能进行有效还原猝灭.投加100mmol/L 的AA,AO7的去除与仅投加Co -C -N 进行吸附时一致,说明其完全抑制了体系中的氧化降解反应,但不影响Co -C -N 的吸附能力.0 10 20 30 40 50 600.2 0.4 0.6 0.81.0 t (min)C /C 0图7 活性物种猝灭实验Fig.7 Active species quenching experimentρ(Co -C -N)=50mg/L, c (AO7)=0.05mmol/L, c (PMS)=0.50mmol/L, pH=7.00,T =25℃为了验证猝灭实验的结果并探究催化剂表面自由基的种类,对Co -C -N/PMS 体系进行顺磁共振检测(EPR).使用DMPO 作为自由基捕获剂,实验结果如图8(a),图中仅观察到了DMPO -SO 4·-加合物的特征信号[31],且DMPO -SO 4·-加合物强度随反应时间的延长而增大,未观察到DMPO -·OH 可能是体系中·OH 较少,加合物信号被掩盖.使用TEMP 作为1O 2捕获剂,实验结果如图8(b),图中加入PMS 出现的特征峰是由于PMS 与TEMP 直接反应生成的TEMPO [32].在加入催化剂后会产生更加强烈的1O 2特征峰,且使用Co -C -N 时峰最高,说明Co -C -N/ PMS 体系可以产生1O 2.结合自由基猝灭实验结果,在中性条件下Co -C -N/PMS 体系降解AO7的主要活性物种是催化剂表面产生的SO 4·-,对AO7去除贡献率为39.6%;1O 2贡献率为25.6%;·OH 贡献率仅为12.9%,剩余21.9%则是吸附作用.332333334335336 337 338 339340(a)PMS+Co-C-N +DMPO 3 minPMS+Co-C-N +DMPO 10 minPMS+DMPO▲-DMPO-SO4磁场强度(G)▲▲▲▲ ▲ ▲ ▲▲▲▲▲ ▲ ▲ ▲332334336338 340 342磁场强度(G)图8 电子顺磁共振实验Fig.8 Electron paramagnetic resonance experimentρ(Co -C -N)=ρ(C -N)=50mg/L, c (PMS)=0.50mmol/L, pH=7.00, T =25℃2.8 AO7降解过程及矿化能力使用UV -vis 光谱扫描Co -C -N/PMS 体系去除AO7的过程.由图9可以发现,AO7在310,430和484nm 处有3个特征峰分别对应AO7的萘环和偶氮键发色基团[33].随着反应的进行310,430和484nm 处的特征峰均快速下降,而220和255nm 处出现了2个新的吸收峰,说明Co -C -N/PMS 体系能将AO7的偶氮键发色基团快速氧化,具有良好的脱色效果,萘环结构被破坏说明体系具有一定的矿化能力,而新出现的吸收峰为萘环结构被破坏后被继续氧化层生成的小分子中间产物.在20min 反应完全去溶液中的AO7后,至30min 时中间产物吸收峰快速增长,这说明2.7中被吸附至催化剂上的AO7会被继续氧化降解,这有利于催化剂的重复利用.为了检测Co -C -N/PMS 体系对AO7的矿化能力,进行TOC 测试.为保证AO7及降解中间产物被完全矿化所需的电子数充足,在矿化能力测试中增加PMS 的投加量158 中 国 环 境 科 学 41卷为2.0mmol/L,实验结果如表1.随着反应的进行, 60min 时TOC 由初始的8.92mg/L 下降到3.97mg/L,矿化率达到55.5%.结合光谱扫描推测AO7显色的偶氮键和萘环被氧化后生成以苯环为主体的芳香族化合物,部分中间产物能被继续降解为小分子有机物并最终矿化为CO 2和H 2O.表1 TOC 降解趋势 Table 1 TOC degradation trend项目 0min 15min 30min 60min TOC(mg/L) 8.92 7.36 6.02 3.97200 300 400 500 600吸光度波长(nm)图9 AO7降解过程UV -vis 光谱变化 Fig.9 UV -vis spectral changes for AO7degradationρ(Co -C -N)=50mg/L, c (AO7)=0.05mmol/L, c (PMS)=0.50mmol/L, pH=7.00,T =25℃2.9 Co -C -N 的重复利用性能为了考察Co -C -N 催化材料的重复利用性能,反应结束后将催化剂使用真空抽滤分离并干燥后,再次用于催化PMS 进行去除AO7的重复利用性实验,实验结果如图10(a).由图可知,在6次重复利用周期实验中,Co -C -N/PMS 体系分别可以在10,15,20, 30,45和60min 内完全去除AO7,表现了良好的重复利用性能.作为对比,在相同实验条件下不投加PMS 进行Co -C -N 的吸附重复利用性实验,结果如图10(b).不进行有机溶剂洗脱,直接重复利用的Co - C -N 对AO7的吸附能力迅速下降,第4个反应周期60min 内仅能吸附7.5%的AO7.因此,投加PMS 进行吸附氧化协同去除AO7的体系重复利用性明显优于单纯的吸附体系.催化剂重复利用性的提升对降低废水处理成本具有实际意义.Co -C -N/PMS 体系在多次使用中去除效率降低的主要原因是催化剂使用后比表面积显著下降,在1次使用后由806.71m 2/g 下降至590.66m 2/g.比表面积的下降是因为降解中间产物在催化剂中的残留,减少了AO7与催化剂接触的反应位点,从而降低了反应速度[34],从反应后XRD 图谱新增的衍射峰也有所证实.同时,XPS 光谱半定量测得1次使用后Co -C -N 中Co 的负载量由0.33at%下降至0.27at%,能够活化PMS 产生自由基的Co 含量下降也是降低AO7氧化降解反应速度的原因.0306090120150 180 210 240 270 3003303600.20.40.60.81.0C /C 0t (min)0306090 120 150 180 2102400.20.40.60.81.0C /C 0t (min)图10 材料重复利用性实验 Fig.10 Catalyst reuse experimentρ(Co -C -N)=100mg/L, c (AO7)=0.05mmol/L, pH=7.00, T =25℃, (a)c (PMS)=0.50mmol/L, (b) c (PMS)=0mmol/L由于检测到催化剂表面Co 的流失,为了验证AO7降解反应体系中均相反应的贡献,对第1次反应后的溶液使用ICP -MS 进行检测,结果显示反应后溶液中Co 离子含量为0.26mg/L.使用反应后滤液再次投加AO7和PMS,在Co -C -N/PMS 初次使用完全去除AO7的10min 反应时间内,对AO7降解率仅1期徐劼等:单原子Co-C-N催化过一硫酸盐降解金橙Ⅱ 159有8.3%.这说明Co-C-N渗漏的Co2+造成的均相体系对AO7降解贡献有限,Co-C-N/PMS由非均相体系起主导作用.3结论3.1采用模板蚀刻法制备的Co-C-N催化剂能有效催化PMS降解偶氮染料AO7,Co-C-N/PMS体系对AO7的去除速度显著优于吸附体系且6次使用后仍具有优异的催化性能.3.2在Co-C-N/PMS体系中,AO7的去除速度随催化剂和PMS投加量的增大而升高;染料废水中常见的Cl-会加速反应的进行,体系在pH=3.0~9.0的范围内均可有效去除AO7.3.3 中性条件下Co-C-N/PMS降解AO7反应主要发生在催化剂表面并由非均相体系主导.主要活性物种为SO4·-,贡献率为39.6%.1O2也参与反应且贡献率为25.6%.体系矿化能力良好,1h内AO7矿化率可达55.5%.参考文献:[1] M eriç S, Kaptan D, Tünay O. Removal of color and cod from amixture of four reactive azo dyes using fenton oxidation process [J].Environmental Letters, 2003,38(10):2241-2250.[2] Robinson T, Mcmullan G, Marchant R, et al. Remediation of dyes intextile effluent: A critical review on current treatment technologies with a proposed alternative [J]. Bioresource Technology, 2001,77(3): 247-255.[3] Forgacs E, Cserháti T, Oros G. Removal of synthetic dyes fromwastewaters: a review [J]. Environment International, 2004,30(7):953- 971.[4] Yang Q, Choi H, Chen Y, et al. Heterogeneous activation ofperoxymonosulfate by supported cobalt catalysts for the degradation of 2,4-dichlorophenol in water: The effect of support, cobalt precursor, and UV radiation [J]. Applied Catalysis B Environmental, 2008, 77(3):300-307.[5] 周骏,肖九花,方长玲,等.UV/PMS体系硝基氯酚降解动力学及机理研究 [J]. 中国环境科学, 2016,36(1):68-75.Zhou J, Xiao J H, Fang C L, et al. Degradation kinetics and mechanisms of chloronitrophenol in UV/PM S system [J]. China Environmental Science, 2016,36(1):66-73.[6] Yang S, Wang P, Yang X, et al. Degradation efficiencies of azo dyeAcid Orange 7by the interaction of heat, UV and anions with common oxidants: persulfate, peroxymonosulfate and hydrogen peroxide [J].Journal of Hazardous Materials, 2010,179(1):552-558.[7] Chen X Y, Qiao X L, Wang D G, et al. Kinetics of oxidativedecolorization and mineralization of Acid Orange 7by dark and photoassisted Co2+ catalyzed peroxymonosulfate system [J].Chemosphere, 2007,67(4):802-808.[8] Anipsitakis G P, Dionysiou D D. Radical generation by the interactionof transition metals with common oxidants [J]. Environmental Science & Technology, 2004,38(13):3705-3712.[9] Wei C, Zhang J, Zhang Y, et al. Ultrasound enhanced heterogeneousactivation of peroxymonosulfate by a Co-NiOx catalyst [J]. Water Science & Technology A: Journal of the International Association on Water Pollution Research, 2017,76(6):1436-1446.[10] Chen X, Chen J, Qiao X, et al. Performance of nano-Co3O4/peroxymonosulfate system : Kinetics and mechanism study using Acid Orange 7as a model compound [J]. Applied Catalysis B Environmental, 2008,80(1):116-121.[11] Sun H Q, Tian H Y, Hardjono Y, et al. Preparation of cobalt/carbon-xerogel for heterogeneous oxidation of phenol [J]. Catalysis Today, 2016,186(1):63-68.[12] Yang Y, Banerjee G, Brudvig G W, et al. Oxidation of organiccompounds in water by unactivated peroxymonosulfate [J].Environmental Science & Technology, 2018,52(10):5911-5919.[13] Liu W G, Z L L, Liu X, et al. Discriminating Catalytically active FeNxspecies of atomically dispersed Fe-N-C catalyst for selective oxidation of the C-H bond [J]. Journal of the American Chemical Society, 2017,139(31):10790-10798.[14] Xiao M L, Zhu J B, M a L, et al. M icroporous Framework-inducedsynthesis of single-atom dispersed Fe-N-C acidic orr catalyst and its in-situ reduced Fe-N-C active site identification revealed by X-ray absorption spectroscopy [J]. ACS Catalysis, 2018,8(4):2824-2832. [15] Liu W G, Z L L, Yan W S, et al. Single-atom dispersed Co-N-Ccatalyst: structure identification and performance for hydrogenative coupling of nitroarenes [J]. Chemical Science, 2016,7(9):5758-5964. [16] Chen X, Guo H G, Zhang Y L, et al. Non-photochemical production ofsinglet oxygen via activation of persulfate by carbon nanotubes [J].Water Research, 2017,113(15):80-88.[17] Kim J, Edwards J O. A study of cobalt catalysis and coppermodification in the coupled decompositions of hydrogen peroxide and peroxomonosulfate ion [J]. Inorganica Chimica Acta, 1995,235(1): 9-13.[18] Lu S, G W, S C, et al. Heterogeneous activation of peroxymonosulfateby LaCo1-x Cu x O3 perovskites for degradation of organic pollutants [J].Journal of Hazardous Materials, 2018,353(2):401-409.[19] Zhang T, Zhu H, Croué J. Production of sulfate radical fromperoxymonosulfate induced by a magnetically separable CuFe2O4spinel in water: efficiency, stability, and mechanism [J].Environmental Science & Technology, 2013,47(6):2784-2791.[20] Qi C, Liu X, M a J, et al. Activation of peroxymonosulfate by base:Implications for the degradation of organic pollutants [J].Chemosphere, 2016,151:280-288.[21] Liu J, Zhou J, Ding Z, et al. Ultrasound irritation enhancedheterogeneous activation of peroxymonosulfate with Fe3O4 for degradation of azo dye [J]. Ultrasonics Sonochemistry, 2017,34: 953-959.[22] Gong F, Wang L, Li D, et al. An effective heterogeneous iron-basedcatalyst to activate peroxymonosulfate for organic contaminants removal [J]. Chemical Engineering Journal, 2015,267:102-110.160 中国环境科学 41卷[23] Zhang W Q, Zhou S Q, Sun J L, et al. Impact of chloride ions onUV/H2O2 and UV/persulfate advanced oxidation processes [J].Environmental Science & Technology, 2018,52(13):7380-7389. [24] 张黎明,陈家斌,房聪,等.Cl-对碳纳米管/过一硫酸盐体系降解金橙G的影响 [J]. 中国环境科学, 2016,36(12):3591-3600.Zhang L M, Chen J B, Fang C, et al. Effect of chloride ions on degradation of Orange G with peroxymonosulfate activated by carbonnanotubes [J]. China Environmental Science, 2016,36(12):3591-3600. [25] Wang Z, Yuan R, Guo Y, et al. Effects of chloride ions on bleaching ofazo dyes by Co2+/oxone regent: Kinetic analysis [J]. Journal of Hazardous Materials, 2011,190(1):1083-1087.[26] Lindsey M E, Tarr M A. Inhibition of hydroxyl radical reaction witharomatics by dissolved natural organic matter [J]. Environmental Science & Technology, 2000,34(3):444-449.[27] Yang Z, Jin J, Yuan G, et al. Activation of peroxymonosulfate bybenzoquinone: a novel nonradical oxidation process [J].Environmental Science & Technology, 2015,49(21):12941-12950. [28] Yun E T, Lee J H, Kim J, et al. Identifying the nonradical mechanismin the peroxymonosulfate activation process: singlet oxygenation versus mediated electron transfer [J]. Environmental Science & Technology, 2018,52(12):7032-7042.[29] Zhang J, Shao X, Shi C, et al. Decolorization of acid orange 7 withperoxymonosulfate oxidation catalyzed by granular activated carbon [J]. Chemical Engineering Journal, 2013,232(10):259-265. [30] Liang H Y, Zhang Y Q, Huang S B, et al. Oxidative degradation ofp-chloroaniline by copper oxidate activated persulfate [J]. Chemical Engineering Journal, 2013,218(3):384-391.[31] Wang Y, Sun H, Ang M, et al. 3D-hierarchically structured MnO2 forcatalytic oxidation of phenol solutions by activation of peroxymonosulfate: Structure dependence and mechanism [J]. Applied Catalysis B Environmental, 2015,164:159-167.[32] Liang P, Zhang C, Duan X, et al. An insight into metal organicframework derived N-doped graphene for the oxidative degradation of persistent contaminants: formation mechanism and generation of singlet oxygen from peroxymonosulfate [J]. Environmental ence: Nano, 2017,4(2):315-324.[33] Wang K, Zhang J, Lou L, et al. UV or visible light inducedphotodegradation of AO7on TiO2 particles: the influence of inorganic anions [J]. Journal of Photochemistry & Photobiology A Chemistry, 2004,165(30):201-207.[34] 王柯晴,徐劼,沈芷璇,等. LaCoO3钙钛矿活化过一硫酸盐降解萘普生 [J]. 化工学报, 2020,71(3):1326-1334.Wang K Q, Xu J, Shen Z X, et al. Degradation of naproxen by peroxymonosulfate activated with LaCoO3 [J]. CIESC Journal, 2020,71(3):1326-1334.作者简介:徐劼(1995-),男,湖北武汉人,苏州科技大学硕士研究生,主要研究方向为污水处理与回用技术.发表论文4篇.《中国环境科学》获评“2014中国最具国际影响力学术期刊”2014年12月,中国环境科学学会主办的《中国环境科学》被评为“2014中国最具国际影响力学术期刊”.“中国最具国际影响力学术期刊”是《中国学术期刊(光盘版)》电子杂志社有限公司、清华大学图书馆、中国学术国际评价研究中心对我国5600余种中外文学术期刊,根据总被引频次、影响因子、被引半衰期等计算出的国际影响力综合评价指标CI进行排序,遴选出的排名前5%的期刊.获评“中国最具国际影响力学术期刊”的科技类期刊共175种.自2012年开始此项评选以来,《中国环境科学》已连续3年获此殊荣.《中国环境科学》编辑部。


金属-电介质-金属柔性结构增强荧光发射曹文静 孙李泽童 郭付周 宋健彤 刘啸 陈智辉 杨毅彪 孙非Enhancing the fluorescence emission by flexible metal-dielectric-metal structuresCAO Wen-jing, SUN Li-ze-tong, GUO Fu-zhou, SONG Jian-tong, LIU Xiao, CHEN Zhi-hui, YANG Yi-biao, SUN Fei引用本文:曹文静,孙李泽童,郭付周,宋健彤,刘啸,陈智辉,杨毅彪,孙非. 金属-电介质-金属柔性结构增强荧光发射[J]. 中国光学, 2022, 15(1): 144-160. doi: 10.37188/CO.2021-0084CAO Wen-jing, SUN Li-ze-tong, GUO Fu-zhou, SONG Jian-tong, LIU Xiao, CHEN Zhi-hui, YANG Yi-biao, SUN Fei. Enhancing the fluorescence emission by flexible metal-dielectric-metal structures[J]. Chinese Optics, 2022, 15(1): 144-160. doi: 10.37188/CO.2021-0084在线阅读 View online: https:///10.37188/CO.2021-0084您可能感兴趣的其他文章Articles you may be interested in双色荧光辐射差分超分辨显微系统研究Dual-color fluorescence emission difference super-resolution microscopy中国光学. 2018, 11(3): 329 https:///10.3788/CO.20181103.0329纳米尺度下的局域场增强研究进展Advances in the local field enhancement at nanoscale中国光学. 2018, 11(1): 31 https:///10.3788/CO.20181101.0031氧化石墨烯的多色发光及其在荧光成像中的应用Multicolor fluorescent emission of graphene oxide and its application in fluorescence imaging中国光学. 2018, 11(3): 377 https:///10.3788/CO.20181103.0377金属等离子激元调控Fabry-Perot微腔谐振模式研究Resonant mode of Fabry-Perot microcavity regulated by metal surface plasmons中国光学. 2019, 12(3): 649 https:///10.3788/CO.20191203.0649[Cd(对硝基苯甲酸)2(乙二胺)H2O]配合物的结构及荧光性能[Cd(p-nitrobenzoic acid)2(en)H2O] coordination compound in structure and fluorescent property中国光学. 2019, 12(2): 302 https:///10.3788/CO.20191202.0302图像增强算法综述Review of image enhancement algorithms中国光学. 2017, 10(4): 438 https:///10.3788/CO.20171004.0438第 15 卷 第 1 期中国光学Vol. 15 No. 1 2022年1月Chinese Optics Jan. 2022文章编号 2095-1531(2022)01-0144-17Enhancing the fluorescence emission by flexiblemetal-dielectric-metal structuresCAO Wen-jing1,2,SUN Li-ze-tong2,GUO Fu-zhou1,2,SONG Jian-tong1,2,LIU Xiao1,2,CHEN Zhi-hui1,2 *,YANG Yi-biao1,2,SUN Fei1,2(1. Key Laboratory of Advanced Transducer and Intelligent Control System, Ministry of Educationand Shanxi Province, Taiyuan 030024, China;2. College of Physics and Optoelectronics, Taiyuan University of Technology, Taiyuan 030024, China)* Corresponding author,E-mail: huixu@Abstract: The technology of enhancing fluorescence emission can increase the sensitivity of fluorescence de-tection and the brightness of Light Emitting Diodes (LEDs), and is of great significance in improving the per-formance of light-emitting devices. Since the metal structure has a good effect in enhancing the local field and fluorescence emission, and the flexible dielectric material has flexible bendability characteristics, on the basis of above, we propose a flexible structure composed of Metal-Dielectric-Metal (MDM) to enhance the fluorescence emission. The influence of the structure on the directional emission enhancement of quantum dots is systematically studied by using the finite difference time domain method. Theoretical calculations show that the local undulations and arcs of the flexible MDM structure can promote fluorescence enhance-ment and increase the quantum efficiency of the quantum dots located at the center of the structure by about 7 times. They can alao change the refractive index and thickness of the dielectric to achieve the tunability of the target wavelength. At the same time, the experimental results shows that the flexible MDM structure does have a positive effect on the fluorescence enhancement. This discovery is valuable for future display techno-logies and flexible light-emitting devices. It is of certain guiding significance for the development and applic-ation of high-efficiency flexible devices.Key words: fluorescence enhancement; flexible structure; directional emission; tunable wavelength收稿日期:2021-04-19;修订日期:2021-05-11基金项目:国家自然科学基金资助项目(No. 62175178,No. 11674239);中央引导地方科技发展资金项目(No.YDZJSX2021A013);山西省青年拔尖人才支持计划;三晋英才支持计划Supported by National Natural Science Foundation of China (No. 62175178, No. 11674239); the Central Guid-ance on Local Science and Technology Development Fund of Shanxi Province (No. YDZJSX2021A013); Pro-gram for the Top Young Talents of Shanxi Province; Program for the Sanjin Outstanding Talents of China金属-电介质-金属柔性结构增强荧光发射曹文静1,2,孙李泽童2,郭付周1,2,宋健彤1,2,刘 啸1,2,陈智辉1,2 *,杨毅彪1,2,孙 非1,2(1. 太原理工大学 新型传感器与智能控制教育部/山西省重点实验室, 山西 太原 030024;2. 太原理工大学 物理与光电工程学院, 山西 太原 030024)摘要:增强荧光发射可以提高荧光检测灵敏度、提高LED的亮度,在提高发光器件性能方面具有重要意义。
Gold Hollow Nanospheres:Tunable Surface Plasmon Resonance Controlled byInterior-Cavity SizesHan-Pu Liang,†,‡Li-Jun Wan,*,†Chun-Li Bai,†and Li Jiang§Institute of Chemistry,Chinese Academy of Sciences,Beijing100080,China,and Schlumberger Doll Research,36Old Quarry Road,Ridgefield,Connecticut06877Recei V ed:No V ember2,2004;In Final Form:March1,2005Uniform gold hollow nanospheres with tunable interior-cavity sizes were fabricated by using Co nanoparticlesas sacrificial templates and varying the stoichiometric ratio of starting material HAuCl4over the reductants.The formation of these hollow nanostructures is attributed to two subsequent reduction reactions:the initialreduction of HAuCl4by Co nanoparticles,followed by the reduction by NaBH4.In addition,a thick layer ofsilica was successfully coated onto the gold hollow nanospheres.These nanostructures are extensivelycharacterized by TEM,XRD,HRTEM,SEM,electron diffraction,energy-dispersive X-ray analysis,and UV-visible absorption spectroscopy.It is evident that the SPR peak locations corresponding to these hollownanospheres are shifted over a region of more than100nm wavelength due to changes of shell thickness,which make these optically active nanostructures of great interest in both fundamental research and practicalapplications.IntroductionGold nanostructures have attracted considerable interest due to their intriguing surface plasmon resonance(SPR)property originating from the collective oscillation of their conduction electrons in response to optical excitation.1These optically active nanostructures are potentially useful in photocrystals,plasmonic waveguides,chemical or biological sensors,optical filters,and optically triggered drug delivery.2Consequently,various gold nanostructures such as nanoparticles,nanowires,hollow nano-spheres,and nanoshells were fabricated leading to different and highly sensitive SPR features.In particular,gold hollow nanospheres are intriguing to synthesize and investigate because of their fascinating SPR properties.For example,Xia et al. reported that the SPR spectra of gold hollow spheres exhibit a much more sensitive response toward environmental changes than solid colloids.3Halas and co-workers have prepared nanoparticles with multiply,concentric shells of gold and silica and gold shell can be used to enable fast whole-blood immuno-assays.4As such the SPR frequency is strongly dependent on the size,shape,and surface functionality of the metallic nanostructures.For hollow metallic nanospheres,the frequency is a sensitive function of the inner and outer diameter of the metallic nanospheres.5Therefore,it is necessary to explore metallic hollow nanospheres with tunable cavity size so to affect the SPR property.To date,hollow spheres of various materials have been extensively investigated in the literature,6-11invari-ably focused on two geometrical parameters:shell thickness and cavity size.Most methods are based on the outward growth of the nanosphere shell.Few were dedicated to the fabrication techniques of hollow nanospheres with tunable cavity size, which may be very useful in the practical application and in the study of basic physics.12Recently,we developed a facile method for one-step,large-scale synthesis of Pt hollow nano-spheres with Co nanoparticles as sacrificial templates.13Herein, we extend this approach to fabricate gold hollow nanospheres with tunable cavity size by varying the stoichiometric ratio of HAuCl4over the reductant(s).The SPR features of these nanospheres are investigated,showing that SPR peak frequency can be continuously tuned over100nm wavelength by control-ling the interior-cavity size.Silica-coated gold hollow nano-spheres were also fabricated and studied.Experimental SectionFabrication of Gold Hollow Nanospheres with Tunable Cavity Size.For the synthesis of gold hollow nanospheres with tunable interior cavity,the Co nanoparticles were first fabricated. The preparation is carried out with the method reported by Kobayashi et al.14Briefly,0.2mL of0.4M CoCl2solution was added into200mL of deaerated aqueous solution containing8 mM NaBH4and0.8mM citric acid to fabricate Co nanopar-ticles.To avoid the oxidation of the Co nanoparticles in the existence of atmospheric oxygen,high-purity nitrogen was bubbled through the solution during the whole procedure.H2 was evolved during the reaction and continued for several minutes.When the gas evolution ceased,three as-synthesized Co nanoparticle colloidal solutions with equal volume(30mL) were transferred to three stirred aqueous solutions,samples A, B,and C with different volumes of1mM HAuCl4(5,8,and 18mL).Prior to these,two solutions with equal volume(30 mL)were sampled in the course of H2evolution and also transferred to two stirred aqueous solutions,samples D and E with12and40mL of1mM HAuCl4,respectively.The obtained suspension solutions were centrifuged and the precipitates were samples A to E.Fabrication of Silica-Coated Gold Hollow Nanocompos-ites.Coating of hollow gold nanospheres with amorphous silica was achieved by using the Sto¨ber method.15Briefly,ap-proximately0.5mg of the as-synthesized gold hollow nano-spheres(sample B)was dispersed into a mixture of20mL of*To whom correspondence should be addressed.Phone and Fax:+86-10-62558934.E-mail:wanlijun@.†Chinese Academy of Sciences.‡Also in the Graduate school of CAS,Beijing,China.§Schlumberger Doll Research.7795J.Phys.Chem.B2005,109,7795-780010.1021/jp045006f CCC:$30.25©2005American Chemical SocietyPublished on Web04/02/20052-propanol and3mL of Millipore water.Under continuous stirring,0.4mL of25%ammonia and0.036M tetraethyl orthosilicate(TEOS)were added into this system.After the reaction had proceeded for2h,the solution was centrifuged to isolate the precipitate,which was then redispersed into Millipore water.Characterization Methods.For TEM and SEM measure-ments,the obtained suspension solutions were centrifuged and the precipitates were collected,washed,dispersed by ultrasonic treatment,and dropped on carbon-coated copper grids.TEM measurement,electron diffraction,and energy-dispersive X-ray analysis(EDAX)were performed with a JEM2010transmission electron microscope equipped with energy-dispersive X-ray analyzer(Phoenix).High-resolution TEM images were recorded on a Philips TECNAI F30operating at300kV.Powder X-ray diffraction(XRD)was carried out with a Rigaku D/max-2500, using filtered Cu K R radiation.SEM was carried out with a Hitachi S-4300F field emission scanning electron microscope. UV-visible absorption data were recorded on a UV-vis spectrophotometer(UV-1601PC,SHIMADZU).Results and DiscussionGold Hollow Nanospheres with a Tunable Interior Cavity. The standard reduction potentials of the AuCl4-/Au and Co2+/ Co redox couple are0.994and-0.277V vs SHE.In the present study,the reduction potentials of these two redox couples can be obtained according to the Nernst equation.Since the reduction potential of the AuCl4-/Au redox couple(0.935V vs SHE)is much higher than that of the Co2+/Co redox couple(-0.377V vs SHE),AuCl4-will be reduced to Au atoms as soon as Co nanoparticles were added into the solution due to the big gap between the potential of these two redox couples.In addition, because the reduced gold atoms are largely confined to the vicinity of sacrificial template outer surface,the diameter of Co nanoparticles determines that of the resulting gold hollow nanostructures.Therefore,the fabrication of Co nanoparticles is a critical foundation in the whole preparation procedure.In the present study,excess reducing agent(NaBH4)was used to modify the nucleation and growth process,hence optimize the diameter and size distribution of Co nanoparticles as suggested by an early report.16After the formation of Co nanoparticles, which is easily observed by the solution color change from transparent to dark,this solution was kept for several minutes to allow excessive NaBH4to react with water completely.13,17 Gold hollow nanostructures were successfully fabricated bysubsequently adding Co colloidal solution into aqueous HAuCl4 solutions.Figure1a shows a typical TEM image of sample B,where there is strong contrast difference in all of the spheres with a bright center surrounded by a much darker edge,confirming their hollow architecture.The average outer diameter of the hollow nanospheres is statistically measured to be58.6(4.5 nm by sampling200hollow nanospheres.No size separation process was necessary on these hollow nanospheres,as the synthetic protocol already achieved high monodispersity.The inset in Figure1a is an electron diffraction pattern,in which the concentric rings could be assigned as diffraction from{111}, {200},{220},and{311}planes of face-center-cubic(fcc)gold from the centermost ring,respectively.Figure1b is a typical SEM image of sample B,showing the production of large-scale uniform spherical materials.Figure2shows the powder X-ray diffraction Pattern of sample B,and all diffraction peaks could be indexed to an fcc phase of gold according to the JCPDS No. 65-2870.Figure3is a high-resolution TEM image taken from the surface of an individual gold hollow nanosphere(sample B), from which it is evident that the shell surface of the hollow nanospheres consists of small single Au crystals.Samples A-C with different volumes of HAuCl4solutions were designed on the basis of the stoichiometric relationship as presented in eq1.The amount of HAuCl4in sample B is just sufficient to react with the added Co nanoparticles completely,while the ratio of HAuCl4in sample A and sample C is lower and higher than that in sample B,respectively.Parts a and b of Figure4show low-magnification TEM images of samples A and pared with Figure1a of sample B,obvious changes occur in the shell thickness of these hollow nanospheres.The formation of sample A in Figure4a with different shell thickness may beattributed Figure1.(a)TEM and(b)SEM images of gold hollow nanospheres of sample B.The inset in part a is the electron diffraction pattern obtained on a random assembly of goldnanospheres.Figure2.XRD pattern of gold hollow nanospheres(sample B)formed by reducing AuCl4-with Co nanoparticles as the sacrifice templates.3Co+2AuCl4-)2Au+3Co2++8Cl-(1)7796J.Phys.Chem.B,Vol.109,No.16,2005Liang et al.to the fact that some Co nanoparticles react with sufficient HAuCl 4to form a thick shell,while other particles cannot due to the insufficient supply of HAuCl 4,thus forming a thin shell.As this replacement reaction occurs rapidly,the reduced Au atoms nucleate and grow into very small particles,and eventu-ally evolve into a thin shell around the cobalt nanoparticles.The shells presumably have an incomplete porous structure at an early stage when Co 2+and AuCl 4-are able to continuously diffuse across the shell in reverse directions.13At this stage,the remaining active Co “core”can also be continually oxidized by H +,from HAuCl 4aqueous solution,across the porous shell since the standard reduction potential of the H +/H 2redox couple is higher than that of the Co 2+/Co redox pared to eq 1,this reaction is secondary due to the smaller thermody-namic driving force.It is the combination of the two reactions that results in the gold hollow nanostructure without the presence of a Co “core”.From the low-magnification TEM image of sample C in Figure 4b,the gold hollow nanospheres are similar to that of sample B except for additional gold nanoparticles.The high-magnification TEM image in Figure 4c indicates that these nanoparticles are directly connected to the outer shell ofgold hollow spheres.Figure 5is a proposed mechanism for this formation processes from the observed results.The formation of these nanoparticles may be attributed to the existence of citrate as HAuCl 4may be reduced by citrate in boiling solution.18In the present study,the fact that HAuCl 4can be reduced by citrate at room temperature may be attributed to the presence of the hollow nanospheres,functioning as “seeds”.These seeds can act as nucleation centers accelerating seed-mediated auto-catalytic growth at their surfaces.The reduction reaction is a relatively slow process compared with the replacement reaction.After Co nanoparticles were completely consumed,the porous shell turned into a dense surface as indicated in Figure 3.The change on the shell outer surface may be attributed to the effective reconstruction of Au to form a smooth and highly crystalline structure through the Ostwald ripening process to lower surface energy after Co nanopaticles were completely consumed.11b The dense shell structure no longer allows citrate molecules to diffuse freely across the shell into the cavity,resulting in excess HAuCl 4reduction on the outer surfaces of the shells and hence the different morphology of sample C.The above mechanism is corroborated by a control experiment,in which an aqueous suspension of sample B was added into HAuCl 4,resulting in identical composition of obtained solution to that of sample C.The TEM image (not shown)revealed that the morphology of the obtained nanostructures was indeed closely analogous to that of sample C.Parts d,e,and f of Figure 4show HMTEM images of samples B,D,and E.Samples D and E,with a higher stoichiometric ratio of HAuCl 4than that of sample B,were designed to investigate the influence of excess NaBH 4.From these images gold hollow nanospheres with different shell thickness and interior cavity are evident.Note that the outer surfaces of these hollow spheres are smooth and different from those of sample C.As shown in Figure 4d,these nanospheres clearly exhibit hollow structure.The shell thickness and cavity can be easily pared with Figure 4d,Figure 4e clearly reveals an increase of gold shell thickness and a decrease in interior-cavity size.It is evident from Figure 4f that gold solid nanoparticles with an average diameter of 60.0(6.1nmwereFigure 3.High-resolution TEM images taken from the surface of an individual gold hollow nanosphere (sampleB).Figure 4.(a,b)Low-magnification TEM images of samples A and C,respectively.(c -f)High-magnification TEM images of samples C,B,D,and E,respectively.Gold Hollow Nanospheres J.Phys.Chem.B,Vol.109,No.16,20057797formed.Since the outer diameters are controlled by the diameter of Co nanoparticles,the outer diameters of these hollow nanospheres are largely identical.Table1summarizes the average outer and inner diameters,shell thickness,and wave-length of SPR peaks of these hollow and solid nanospheres. These results,together with the nanostructures in Figure4a,d,e,f, clearly reveal an inward growth process of gold hollow nanospheres.The changes in these nanostructures are also reflected in the coloration of these aqueous suspensions.The color of samples A,B,and C was blue,while the color of samples D and E was purplish red and pink,respectively.In general,gold hollow nanospheres with tunable interior-cavity size are achieved by changing the stoichiometric ratio of HAuCl4over the reducing agent(s).The process is clearly illustrated in Figure5.In the absence of NaBH4in the Co colloidal solution,the main reactions are the reduction of Co nanoparticles by AuCl4-and H+.The shell formation is an inward growth process,in which the thickness of the gold shell increases inward as the replace-ment between Co nanoparticles and HAuCl4continues.The gold shell at its formation stage should have an incomplete porous structure because Co2+and AuCl4-can continuously diffuse into the shell.The porous structure allows the remaining active Co“core”to be continuously oxidized to Co2+by H+when there is not a sufficient supply of HAuCl4.In the presence of NaBH4in the Co colloidal solution,the process is mainly attributed to two distinct reduction reactions:namely,the initial reduction of HAuCl4by Co nanoparticles and the subsequent reduction of HAuCl4by NaBH4.The porous structure also enables BH4-diffusing into the cavity of hollow spheres to reduce AuCl4-to Au.Therefore,gold hollow shells here act as nanoreactors for the oxidation of Co nanoparticles and the reduction of AuCl4-.As a result,the shell grows inward until all of the HAuCl4was consumed,if the BH4-was in excess. These hollow spheres can eventually become solid ones if the appropriate volume of HAuCl4is used,as shown in Figure4f. In such a circumstance,the solid nanoparticles grow outward as the common seed-mediated growth process if excess HAuCl4 still remained.Optical Characterization.The SPR properties of gold nanostructures are discernible in the UV-visible region.Figure 6shows the UV-visible absorption spectra of aqueous solution of samples A,B,C,D,and E with an increase of gold shell thickness.The characteristic SPR peaks show an evident blue shift from sample A to sample E due to the increase of gold shell thickness.The results are also summarized in Table1. The SPR band of these hollow nanospheres can be tuned to cover the spectral region from526to628nm.The SPR peak at ca.526nm for sample E is similar to that of gold solid colloids with a diameter of50nm(SPR peak at ca.528nm).1c,19 The result further confirms that the gold nanostructure in sample E is a solid nanoasphere rather than a hollow one.Consequently, the shift of SPR peaks can be attributed to changes in shell thickness.Since the shell thickness of these gold nanospheres are thinner than the mean free path(50nm)of electrons in bulk gold,even a slight change in the shell thickness would significantly shift the wavelength of their SPR peaks.3The results indicate that we have accomplished tunable SPR by controlling the interior-cavity size of gold hollow nanostructures. Silica-Coated Gold Hollow Nanocomposites.Surface modi-fication is a major challenge in metal nanoparticle preparation. The addition of an extra functionality onto each individual particle directly leads to a multifunctional nanoparticle and offers the opportunity to study the mutual interactions between the new functionality and the core materials.The surface modifica-tion of gold nanostructures to form silica coating is attractive because it opens up a wide range of surface modification chemistry that is not available for bare gold.20In the present study,silica-coated gold hollow nanocomposites are fabricated. Figure7a is a low-magnification TEM image of silica-coated gold hollow nanocomposites.It can be seen that almost every single gold hollow nanosphere is completely coated with silica shell,which can be identified by contrast difference of these nanocomposites.The silica shell has a thickness of ca.15nm based on high-magnification TEM image(Figure7b).These nanostructures remain as well-dispersed suspensions during the entire process of silica coating.As shown in Figure7c,the energy-dispersive X-ray analysis(EDAX)of silica-coated gold hollow nanocomposites reveals the presence of silica,confirming the coating of silica.From the low-and high-magnification SEMTABLE1:The Average Outer and Inner Diameter,Shell Thickness,and Wavelength of SPR Peaks of the Various Gold Hollow and Solid Nanospheres(samples A-E)sample A sample B sample C sample D sample E outer diameter(nm)59.2(7.858.6(4.559.0(5.258.8(6.460.0(6.1 inner diameter(nm)40.0(5.128.6(3.029.0(3.114.6(2.60 shell thickness(nm)9.6(4.315.0(2.015.0(1.822.1(3.030.0(2.8wavelength of SPR peaks(nm)628595592550526Figure5.Schematic illustration of the formation process of Au hollow nanospheres with tunable interior-cavitysize.Figure6.UV-visible absorption spectra of a suspension solution of samples A-E and silica coated gold hollow nanocomposites.7798J.Phys.Chem.B,Vol.109,No.16,2005Liang et al.images of the nanocomposites (Figure 7d,e),large-scale uniform spherical silica-coated gold hollow nanocomposites with an average diameter of 90nm are fabricated.The UV -visible absorption spectrum of silica-coated gold hollow nanocompos-ites is shown in Figure 6,indicating that SPR peaks are red shifted compared with sample B.ConclusionIn summary,we have demonstrated a facile and effective approach to fabricate gold hollow nanospheres with a tunable interior-cavity size using Co nanoparticles as sacrificial tem-plates.The interior-cavity size can be controlled by varying the stoichiometric ratio of HAuCl 4over reducing agent(s).The gold hollow spheres act as nanoreactors for the oxidation of Co nanoparticles and the reduction of AuCl 4-.The SPR peaks wavelengths corresponding to these hollow nanospheres are shifted and covered the spectral region from 526to 628nm.Silica-coated gold hollow nanospheres are also successfully fabricated,showing different SPR features.Nanostructures with hollow interiors offer several advantages over their solid counterparts:namely,lightweight,reduction in material,and cost.In addition,the cavity provides a unique space as either reactor or store.Most previous synthetic methods of gold hollow nanostructures have resulted in low yieldsofFigure 7.(a,b)Typical TEM and (d,e)SEM images of silica-coated gold hollow spheres.(c)The EDAX results of silica-coated gold hollow spheres.Gold Hollow Nanospheres J.Phys.Chem.B,Vol.109,No.16,20057799rough surfaced,polycrystalline products,which are considerably heterogeneous in shell thickness and composition.Our process affords a large-scale synthesis of well-defined,tunable void sizes that are homogeneous,smooth,and highly crystalline-walled nanostructures.These optically active plasmonic nanostructures are of great interest in basic research and in such diverse applications as photonic devices,drug delivery,microfluidic valves or pumps,and biology.Acknowledgment.Financial support from National Natural Science Foundation of China(Nos.20025308,20177025, 10028408,and20121301),National Key Project on Basic Research(Grant G2000077501),and the Chinese Academy of Sciences is gratefully acknowledged.References and Notes(1)(a)Murphy,C.J.;Jana,N.R.Ad V.Mater.2002,14,80.(b)Kim,F.;Song,J.H.;Yang,P.J.Am.Chem.Soc.2002,124,14316.(c)Link,S.; Mohamed,M.B.;El-sayed,M.A.J.Phys.Chem.B1999,103,3073.(d) Jana,N.R.;Gearheart,L.;Murphy,C.J.J.Phys.Chem.B2001,105, 4065.(e)Daniel,M.C.;Astruc,D.Chem.Re V.2004,104,293.(f)Grant, C.D.;Schwartzberg,A.M.;Norman,T.J.,Jr.;Zhang,J.Z.J.Am.Chem. Soc.2003,125,549.(2)(a)Liang,Z.;Susha,A.;Caruso.F.Chem.Mater.2003,15,3176.(b)Carotenuto,anomet.Chem.2001,15,344.(c)Storhoff,J. J.;Elghanian,R.;Mucic,R.C.;Mirkin,C.A.;Letsinger,R.L.J.Am. Chem.Soc.1998,120,1959.(d)Knoll,B.;Keilmann,F.Nature1999, 399,134.(e)Emory,S.R.;Nie,S.Anal.Chem.1997,69,2631.(f)Brolo, A.G.;Gordon,R.;Leathem,B.;Kavanagh,ngmuir2004,20,4813.(g)Schwartzberg,A.M.;Grant,C.D.;Wolcott,A.;Talley,C.;Huser,T.; Bogomolni,R.;Zhang,J.Z.J.Phys.Chem.B2004,108,19191.(3)Sun,Y.;Xia,Y.Anal.Chem.2002,74,5297.(4)(a)Prodan,E.;Radloff,C.;Halas,N.J.;Nordlander,P.Science 2003,302,419.(b)Hirsch,L.R.;Jackson,J.B.;Lee,A.;Halas,N.J.; West,J.L.Anal.Chem.2003,75,2377.(5)Aden,A.L.;Kerker,M.J.Appl.Phys.1951,22,1242.(6)(a)Caruso,F.;Caruso,R.A.;Mo¨hwald,H.Science1998,282, 1111.(b)Jiang,P.;Bertone,J.F.;Colvin,V.L.Science2001,291,453.(7)(a)Kim,S.-W.;Kim,M.;Lee,W.Y.;Hyeon,T.J.Am.Chem. Soc.2002,124,7642.(b)Dai,Z.;Da¨hne,L.;Mo¨hwald,H.;Tiersch,B. Angew.Chem.,Int.Ed.2002,41,4019.(8)(a)Bourlinos,A.B.;Karakassides,M.A.;Petridis,D.Chem. Commun.2001,1518.(b)Schmidt,H.T.;Ostafin,A.E.Ad V.Mater.2002, 14,532.(9)(a)Nakashima,T.;Kimizuka,N.J.Am.Chem.Soc.2003,125, 6386.(b)Fowler,C.E.;Khushalani,D.;Mann,mun.2001, 2028.(c)Gao,X.;Zhang,J.;Zhang,L.Ad V.Mater.2002,14,290.(10)(a)Schacht,S.;Huo,Q.;Voigt-Martin,I.G.;Stucky,G.D.;Schuth,F.Science1996,273,768.(b)Sun,Q.;Kooyman,P.J.;Grossmann,J.G.; Bomans,P.H.H.;Frederik,P.M.;Magusin,P.C.M.M.;Beelen,T.P. M.;van Santen,R.A.;Sommerdijk,N.A.J.M.Ad V.Mater.2003,15, 1097.(c)Jang,J.;Lee,mun.2002,1098.(d)Zhang,D.;Qi, L.;Ma,J.;Cheng,H.Ad V.Mater.2002,14,1499.(11)(a)Sun,Y.;Xia,Y.Science2002,298,2176.(b)Sun,Y.;Mayers,B.T.;Xia,Y.Ad V.Mater.2003,15,641.(c)Sun,Y.;Mayers,B.T.;Xia, Y.Nano Lett.2002,2,481.(12)Yang,Z.;Niu,Z.;Lu,Y.;Hu,Z.;Han,C.C.Angew.Chem.,Int. Ed.2003,42,1943.(13)Liang,H.-P.;Zhang,H.-M.;Hu,J.-S.;Guo,Y.-G.;Wan,L.-J.;Bai,C.-L.Angew.Chem.,Int.Ed.2004,43,1540.(14)Kobayashi,Y.;Horie,M.;Konno,M.;Rodrı´guez-Gonza´lez,B.; Liz-Marza´n,L.M.J.Phys.Chem.B2003,107,7420.(15)Sto¨ber,W.;Fink,A.;Bohn,E.J.Colloid Interface Sci.1968,26, 62.(16)Lisiecki,I.;Pileni,ngmuir2003,19,9486.(17)Glavee,G.N.;Klabunde,K.J.;Sorensen,C.M.;Hadjipanayis,G.ngmuir1993,9,162.(18)Frens,G.Nature1973,241,20.(19)Lu,Y.;Yin,Y.;Li,Z.-Y.;Xia,Y.Nano Lett.2002,2,785.(20)(a)Dick,K.;Dhanasekaran,T.;Zhang,Z.;Meisel,D.J.Am.Chem. Soc.2002,124,2312.(b)Nooney,R.I.;Thirunavukkarasu,D.;Chen,Y.; Josephs,R.;Ostafin,ngmuir2003,19,7628.7800J.Phys.Chem.B,Vol.109,No.16,2005Liang et al.。
Sono-photoacoustic imaging of gold nanoemulsions:Part I.Exposure thresholdsBastien Arnal a,*,Camilo Perez a,c,Chen-Wei Wei a,Jinjun Xia a,Michael Lombardo a,b,Ivan Pelivanov a,d,Thomas J.Matula a,c,Lilo D.Pozzo a,b,Matthew O’Donnell aa University of Washington,Department of Bioengineering,616NE Northlake Place,Seattle,WA98105,United Statesb University of Washington,Department of Chemical Engineering,Box351750,Seattle,WA98195-1750,United Statesc Center for Industrial and Medical Ultrasound,Applied Physics Laboratory,University of Washington,1013NE40th Street,Seattle,WA98105-6698,United Statesd International Laser Center,Moscow State University,Moscow,Russian Federation1.IntroductionContrast-enhanced imaging with exogenous contrast agents is arapidly developing technique for both photoacoustic(PA)andultrasound(US)systems.Microbubbles have been used in USharmonic imaging[1]of vasculature,and for drug delivery[2]orcavitation-based treatments[3].Their large size(typically1–10m m),however,inhibits high penetrability into tissue throughleaky vasculature(300–500nm endothelial gaps)and nanoscalepores,and through active mechanisms such as cellular uptake.Making stable nanobubbles at the dimensions required forenhanced transport is currently a challenge[4].To solve this problem,phase-change contrast agents,whichchange state from liquid to gas if exposed to thermal and/or acousticenergy,were introduced.Liquid perfluorocarbon nanodroplets witha low-boiling point and a physical dimension appropriate forenhanced penetrability into tissue have been developed[5–8].Thephase-transition of these nanodroplets into a microbubble(vapori-zation)produces high contrast for US pared to other UScontrast agents,nanoemulsions can have a long circulation in thebody(up to2h[8]).Because of increased surface tension,however,US exposure parameters must be relatively high,usually involvinghigh repetition rates[7]or long excitations($100ms)[6].Thismeans that heat can be involved in the vaporization,increasing thepossibility to damage surrounding tissues or limiting the repetitionrate of the imaging modality.This mechanism is also not efficientusing low-frequency ultrasound because of low acoustic absorption.To achieve molecular imaging at significant depths within tissue,nanoscale,laser-activated PA contrast agents have been introduced[9–13].Plasmonic absorption enhances the efficiency of compactnanoprobes(10–200nm)in PA generation.However,a significantconcentration is usually required to get single shot measurementsfor real-time in vivo imaging(e.g.$10nM)[9–13].Recent studieshave shown that combining nanodroplets with efficient opticalabsorbers in a single contrast agent can enhance the PA signal fromthe absorbers[12].Here we build on this work to demonstrate ahighly sensitive,and potentially specific,approach for molecularimaging and therapy using a nanoscale contrast agent integratingPhotoacoustics3(2015)3–10A R T I C L E I N F OArticle history:Received25August2014Received in revised form19November2014Accepted11December2014Keywords:Photoacoustic cavitationVaporizationGold nanoparticlesNanoemulsionPerfluorocarbonNon-linear photoacousticsA B S T R A C TIntegrating high contrast bubbles from ultrasound imaging with plasmonic absorbers fromphotoacoustic imaging is investigated.Nanoemulsion beads coated with gold nanopsheres(NEB-GNS)are excited with simultaneous light(transient heat at the GNS’s)and ultrasound(rarefactionalpressure)resulting in a phase transition achievable under different scenarios,enhancing laser-inducedacoustic signals and enabling specific detection of nanoprobes at lower concentration.An automatedplatform allowed dual parameter scans of both pressure and laserfluence while recording broadbandacoustic signals.Two types of NEB-GNS and individual GNS were investigated and showed the greatpotential of this technique to enhance photoacoustic/acoustic signals.The NEB-GNS size distributioninfluences vaporization thresholds which can be reached at both permissible ultrasound and lightexposures at deep penetration and at low concentrations of targets.This technique,called sono-photoacoustics,has great potential for targeted molecular imaging and therapy using compactnanoprobes with potentially high-penetrability into tissue.Published by Elsevier GmbH.This is an open access article under the CC BY-NC-ND license(http:///licenses/by-nc-nd/4.0/).*Corresponding author.Tel.:+180963345E-mail address:bastien.arnal@(B.Arnal).Contents lists available at ScienceDirectPhotoacousticsj o ur n a l ho m e pa g e:w w w.e l s e vi e r.c om/l o c a t e/p a c s/10.1016/j.pacs.2014.12.0012213-5979/Published by Elsevier GmbH.This is an open access article under the CC BY-NC-ND license(/licenses/by-nc-nd/4.0/).perfluorocarbon nanodroplets with plasmonic absorbers.In partic-ular,we explore the non-linear acoustic response of these agents to simultaneous light and sound excitations at exposure levels well within safety limits for routine diagnostic imaging.In our previous work,we introduced a nanoemulsion of perfluorohexane droplets(100–200nm)surrounded by amphi-philic gold nanopsheres(12nm in diameter).It was used as a non-linear PA contrast agent by inducing a phase transition of the oil through plasmonic absorption of light by the gold nanoparticles [14].This approach can produce highly sensitive PA images with high background suppression(i.e.,also highly specific contrast), but it requires a relatively high opticalfluence to observe non-linear contrast(at750nm,threshold at4mJ/cm2,10dB contrast around6mJ/cm2),limiting its use for deep imaging applications.An approach to greatly reduce the opticalfluence required for a non-linear response from these contrast agents is suggested by recent work showing that laser generation of water vapor bubbles around plasmonic absorbers can be enhanced by adding ultrasound pressurefields[15–17].This technique,named‘‘PA cavitation’’, enables high contrast imaging at lower exposure thresholds and concentrations.Building on this work,we investigate here the PA cavitation exposure thresholds needed to trigger vaporization of a nanoemulsion bead coated with gold nanopsheres(NEB-GNS).This approach leverages short-lived(a few m s)bubbles made possible by the high boiling point(BP)of the perflurocarbon used in this nanoemulsion.In contrast to another approach using long lifetime bubbles[12],a short-lifetime strategy using reversible phase transitions is preferred for molecular imaging applications requiring extended ing PA cavitation,the detection sensitivity for imaging can be enhanced by two physical effects:higher thermal expansion will enhance the PA response and the emitted ultrasound field will instantly scatter on the generated bubbles.In the remainder of this paper,we investigate the benefit of clustering small gold nanopsheres around high-BP perfluorocarbon droplets for combined PA/US applications.After introducing the physical characteristics of the NEB-GNS agent,vaporization thresh-olds are quantified and compared to single gold nanopsheres.The potential use of the vaporization signals for imaging is then studied and discussed.To specifically retrieve the vaporization signal in tissues loaded with NEB-GNS,photoacoustic and backscattered ultrasound signals must be canceled by a procedure described in a future publication called‘‘sono-photoacoustic’’imaging.2.Materials and methods2.1.Nanoemulsion samplesNEB-GNSs were synthetized using the procedure described in previous reports[18,19].Colloidal GNSs(diameter12nm)were synthetized using a citrate reduction method[20].The particles were functionalized using PEG-thiol and butane-thiol(Sigma–Aldrich,St.Louis,MO,USA),with dosages of0.8chains/nm2Au and 700molecules/nm2Au respectively.Attraction between the hydrophobic butane-thiol ligands resulted in clustered GNS dispersions.A solution of1vol%perfluorohexane(Sigma–Aldrich, St.Louis,MO,USA)and0.012vol%Au clusters in water was sonicated(102C,Branson,Danbury,CT,USA,pulsed regime–1s on,4s off)for13s in a cold water bath.The absorbance was measured with a spectrophotometer(UV 1601,Shimatzu,Kyoto,Japan).The absorbance spectrum(cf Fig.1a, blue curve)exhibits a red shift of the resonance from520nm to 547nm compared to the original gold nanopsheres(black curve) and a broad tail enhancing absorption in the optical window ([600–1100]nm wavelengths).The size was measured by DLS as a broad dispersion between30nm and 1.2m m with a peak at 132.1nm and a mean size of303nm(cf Fig.1b).Additional complexes were identified between2and6m m,but DLS may not be quantitative in this range as it is heavily affected by sedimentation orflotation[21].In our case,the effective density of perfluorohexane beads(1.7g/cm3)can be increased by the GNS (density19.3)resulting in sedimentation speeds depending on size.To confirm the presence and quantify the micron-size particle number,the size distribution and concentration of the emulsion were obtained prior to and after all experiments using a Coulter Multisizer III(Beckman Coulter,Miami,FL).A20m m aperture was used,which can size particles with diameters from0.56to12m m and considers any count below0.56m m as the noise level.The sample was diluted$1250Âon a0.2m mfiltered ISOTON II electrolyte(Beckman Coulter,Miami,FL).A50m L sample was used each time,and all measurements were repeated6times using a volumetric count mode.Individual particles were sized and binned in300evenly spaced bins with0.039m m width.All data are reported as a histogram with count vs.diameter,with the count (bin height)showing the number of particles in each bin interval. The reported concentration is computed for all ranges in question and accounts for the dilution factor and sampling volume used above.A near Gaussian distribution of NEB-GNS was identified between1and3m m(cf inset of Fig.1b).The sample was then split in two volumes.Assuming an ideal covering of the bead by gold nanopsheres(80%surface density),the weight of each bead size was calculated.Then,a basic model of sedimentation(Stokes force=gravity)was used to calculate the sedimentation speeds of different particles:e.g.,in24h a425nm particle sinks22mm.In contrast,a132nm bead should sink only6mm in the same period.A sample of10ml was left to settle in a scintillation vial.As22mm was the height of our solution in the vial,we assume thatallFig.1.(a)Absorbance spectra of the nanoemulsion before(blue)and after purification(red),and of gold nanopsheres in suspension(black).(b)Sizing of the nanoemulsion by DLS(intensity).Inset:Sizing in the micron range using a Coulter counter:nanoemulsion before(blue)and after purification(red);background signal is shown in black.B.Arnal et al./Photoacoustics3(2015)3–104particles larger than425nm will fall to the bottom.An8ml sample was carefully withdrawn from the top without provoking any agitation.This supernatant was sized again with the Coulter counter.There were no particles larger than1micron(inset Fig.1b),which validated the purification process.These samples were used to compare the vaporization threshold before and after purification.The purified NEB-GNS sample showed a less broad tail than the original one(cf Fig.1a),indicating that larger beads tend to broaden the extinction spectrum.We performed Discrete Dipole Approximation(DDA)simula-tions using DDscat[22]to estimate the contributions of scattering and absorption on NEB-GNS.An oil bead of150nm diameter was surrounded by12nm GNS positioned using an optimization code solving the Thomson problem leaving a gap of2nm between spheres.The NEB-GNS structure was discretized using a step of 1.35nm and the simulation was run with orientational averages. The broadening of the tail was observed for both absorption and scattering contributions,but scattering contributes to less than 20%of the extinction and is not particularly higher at the longer wavelength.Hence,it is likely that absorption dominates over scattering,at least for the purified sample,meaning NEB-GNS absorption can be related to the absorbance measurement.2.2.Sample preparationUsing a size-dependent concentration measurement from DLS, we estimate the concentration of emulsion bead in the stock solution to be1.32Â1012beads/ml(for sizes ranging from100to 8000nm),or about2.2nM.For all experiments,the solution was diluted to afixed absorbance of0.25cmÀ1at750nm,leading to a concentration of 3.8Â1010beads/ml(or63pM)for the raw sample and 5.86Â1010beads/ml(or94pM)for the purified sample(lower tail afterfiltration,cf Fig.1b).A sample of GNS obtained after a citrate reduction method was diluted with citrate buffer(3.8mM)to obtain an absorbance matching the NEB-GNS one at520nm(0.403cmÀ1).The concen-tration of GNS was then2.59Â1012GNS/ml.The concentrations of GNS and NEB-GNS samples were estimated respectively to be 3.8Â1012GNS/ml and5.9Â1012GNS/ml,i.e.,on the same order.2.3.Ultrasound transducer calibrationThe pressurefield generated by a focused ultrasound transducer (H-102,Sonic Concept,Woodinville,WA,USA,focused at63mm,f# 0.98,1.24MHz)in line with a55dB gain power amplifier(ENI-A150) was quantified using afiber optic hydrophone(FOPH2000,Aperture 100m m,RPI Acoustics,Germany).This hydrophone is calibrated at lower frequencies(down to100kHz)and provides a broadband (up to100MHz)frequency response for accurate non-linear acoustic measurements.The HIFU transducer,mounted at one end of a degassed and deionized water bath,was driven by a10cycle sine-burst produced by a function generator(33120A,Agilent,Palo Alto, CA)together with the power amplifier and a customized matching network.A10M V high voltage probe(Teledyne LeCroy,Chestnut Ridge,NY)was inserted between the matching network and the power amplifier to measure the input voltage applied to the driving system.A3D positioning system was used to move thefiber optic probe hydrophone at the focus.Hydrophone signals were digitized by an oscilloscope(LT344Waverunner,LeCroy,NY)at500MSample/s. The FOPH2000software CALDEC was used to calculate the pressure from oscilloscope data and to deconvolve the signal to account for the frequency response of the system[23].As minimal thermal effects result from ultrasound with a10-cycle pulse at low repetition rate(5Hz),peak negative(pÀ)pressure alone is reported and corresponds to the minimum pressure measured in the pulse.2.4.Automated setup for light and sound exposure threshold studyA532-nm pump beam was injected into a wavelength-tunable optical parametric oscillator(OPO)cavity(Surelite OPO plus, Continuum,Santa Clara,CA,USA)to produce10-ns duration,750-nm laser pulses.Before coupling the laser beam into afiber bundle (77526,Oriel Instruments,Stratford,CT,USA)for delivery to the sample,thefluence was adjusted with a combination of neutral densityfilters that can be remotely switched with a six-position filter wheel(FW-103,Thorlabs,NJ,USA),as shown on the top left of Fig.2a.The sample(diluted NEB-GNS solution or GNS)was injected into a customized transfer pipet(3ml,BD Falcon,NJ,USA) connected to a tube in a closed loop.The tubing was coupled to a peristaltic pump(Masterflex L/S model7518-60,Cole-Parmer,IL, USA),allowing circulation of the sample between each dataset.The pump likely induced static pressure changes and was not used during acquisitions.On the edge of the transfer pipet facing the focused ultrasound transducer(H-102,Sonic Concept,Woodin-ville,WA,USA,focused at63mm,f#0.98,1.24MHz),a black marker spot of1mm diameter was drawn for alignment purposes.The sample was immersed into ultra-pure degassed water and was roughly positioned at the focus of the transducer by maximizing the pulse-echo signal received on the focused transducer.Then,the laser wasfired at a lowfluence on the black marker spot and the PA signal was maximized on the focused transducer,allowing more precise positioning.An in-house PVDF unfocused sensor(bandwidth[0.05–30MHz],aperture6mm diameter)was then positioned at the water surface70mm from the sample.The timing of ultrasound emissions and laserfiring was adjusted.The PVDFfirst received the PA signal from theblackFig.2.Setup for automated parameter scan of laserfluence and acoustic pressure.(a)Light and sound delivery and sample position.(b)Instrumentation with remote controls. The reader should follow the diagram starting from theflash lamp signal(t=0).B.Arnal et al./Photoacoustics3(2015)3–105marker spot when only the laser wasfired.Then,US pulses were emitted and the echoes generated on the edge of the pipet were measured with the PVDF transducer.By changing the trigger delay controlling the duration between the acoustic emission and the lasing time,the arrival time of the PA signal was matched to the one of the5th acoustic cycle,meaning the laser isfired on the sample when the5th US cycle reaches it.Note,that the laser beam size of6mm is larger than the acoustic wavelength(1.2mm)and covers multiple peak negative pressure sites.Thus,contrary to our preliminary experiment where the light was focused on a1mm area[28],the exact lasing time in the microsecond range will not affect the results.Broad illumination is also more representative of potential in vivo applications.The sample was then moved horizontally toward the transducer,allowing both the focal spot of the transducer and the laser spot to meet within the pipet bulb. As noted above,a10-cycle ultrasound pulse emitted with the focused US transducer was used for all studies.The laser wasfired at the arrival time of the5th acoustic cycle at the transducer focus.To cover all desired exposure ranges in terms of laserfluence and US pressure while recording enough data to perform statistics, an automated platform was designed.A TTL signal running at 20Hz,corresponding to theflash lamp timing of the laser,is used as an input trigger to an ADC board(Razor14X2Express CompuScope,Gage,Lockport,IL,USA)controlled with Matlab. When the software is running,a trigger out is sent by the ADC board immediately after being triggered.This signal is then delayed by250m s by a function generator(AFG-3252,Tektronix, OR,USA)to trigger the laser Q-switch.This approach limits exposure of the samples since lasing only occurs when a signal is actually being recorded.Moreover,the repetition rate was limited to5Hz by the Matlab software.The second channel of the generator was used to drive an RF amplifier(A150,ENI,USA)at a voltage also controlled by software to independently scan the pressure amplitude.Ultrasound was emitted earlier than the laser so that it could propagate to the region under study.The PVDF transducerfinally received both the laser-induced PA signals and the scattered pressure waves originating from the focused transducer.This RF signal was captured by the ADC,displayed in real-time and saved on the computer hard-drive for further analysis.At each set of exposure parameters,200recordings were performed.The laserfluence was gradually increased.For each laserfluence,the ultrasound pressure was raised until significant cavitation activity was noted.Fluence values were calibrated by placing an energy meter(J-power,Coherent,Santa Clara,CA)at a position matching the focus of the US transducer.A2-mm pinhole was used,ensuring that it was at the maximum energy position of the laser beam.Then,light attenuation through60-mm of water was taken into account to report allfluence values.2.5.Data analysisFor each set of exposure parameters,a reference signal recorded without laserfiring was subtracted from the200signals to remove the US scattered wave contributions from the plastic container, similar to methods used in our previous studies[28].This subtraction was robust and produced residual signals outside the time window of interest much smaller than those obtained during laser excitation studies.The broadband noise signal was computed in a time window before the lasing time.If no bubble is present,the differential signal should correspond to pure noise. In contrast,the presence of vapor will automatically generate some scattered acoustic signals in all directions.To detect the vaporization events,a threshold on the magnitude of the signals equal to2times the noise value was chosen to count the number of cavitation events out of the200independent recordings.This threshold was set arbitrarily and the results were not highly influenced by its value,indicating that our detection method is very sensitive.A sigmoidal function wasfit to all broadband noise dependencies at each laserfluence to compute the cavitation threshold,defined as the peak negative acoustic pressure corresponding to a50%probability of a cavitation event.3.Results3.1.Cavitation signalsAfter removing the contribution from the tube using a reference signal,the recorded signals clearly exhibited the presence of cavitation.With the same exposure parameters,a small cavitation event can be distinguished in Fig.3b from no cavitation in Fig.3a. Cavitation always occurred at the lasing time depicted by the red dotted line.A larger cavitation event is shown in Fig.3c with10-fold amplitude compared to the small cavitation(note scale change).Normalized spectra for both of these signals are shown in Fig.3d.The broadband noise characteristics are present in both signals,although the main harmonic is relatively higher for the large cavitation event.3.2.Vaporization probabilitiesThe resulting cavitation probabilities as a function of US peak negative pressure are shown for the NEB-GNS and purified NEB-GNS samples in Fig.4a and b.For both samples,cavitation activity was not consistently observed using the10-cycle ultrasound pulse alone,even at pressures exceeding8MPa(below20%for the raw sample and2%for the purified one;results are not shown).In contrast,a smallfluence(0.64mJ/cm2)already creates consistent vaporization at1.5MPa for the raw sample and at2.5MPa for the purified one.Higherfluences decrease the vaporization threshold. Note that for the purified sample,and at such a lowconcentration,Fig.3.Wideband detection of cavitation events using a PVDF sing time is shown with the red dotted line and the ultrasound10-cycle pulse travels to the focus starting from the blue dotted line time.(a)–(c)Signals after differentiation.(a) and(b)No cavitation and cavitation(probability5%)with exposures of F0=0.641mJ/cm2,pÀ=1.74MPa.(c)Large cavitation(F0=4.7mJ/cm2, pÀ=1.43MPa).(d)Normalized spectra of differential signals for large(red), small(orange)and spectrum of the driving signal at1.24MHz.B.Arnal et al./Photoacoustics3(2015)3–10 6a very high laser fluence of 27.7mJ/cm 2is only efficient for vaporization at 0.6MPa,and that raising the fluence from 9.48to 27.7mJ/cm 2doesn’t change the cavitation threshold dramatically.These results show that combining light (transient heating)and short ultrasound pulse (pressure)exposures is much more efficient than using each of them separately.3.3.Summary of the vaporization results and comparison with a GNS sampleA summary of the vaporization threshold (50%probability)of the GNS-NEB samples (raw and purified)and the GNS 12nm sample is presented in Fig.5.For a peak negative pressure of1.0MPa,the fluence threshold of the GNS is reduced by a factor of 12for the raw sample and by a factor of 6for the filtered sample.3.4.Sono-photoacoustic signal enhancementFor imaging purposes,the amplitude emitted by the bubbles will determine detection sensitivity.In addition,the non-linear nature of sono-photoacoustic signal enhancement may lead to a highly specific agent.To explore this hypothesis,the signals presenting cavitation within each data set were isolated.Then,the median value and the standard deviation of the maximum amplitude in time of these signals were calculated.In Fig.6,the sono-photoacoustic signal clearly evolves in a non-linear manner as a function of acoustic peak negative pressure for both the raw sample and the purified one.Note that amplitudes are higher in Fig.6a than in Fig.6b.The bubble signatures had in fact similar amplitudes at a fixed pressure.The error bars denote the standard deviation s of the amplitudes within the ensemble of cavitation events with a length equal to 2s .While the cavitation threshold decreases with laser fluence,the amplitude of cavitation events does not change with pressure when the fluence is above a threshold (above 2.4mJ/cm 2for both samples).This result suggests the potential for deep sono-photoacousticimaging.Fig.4.Photoacoustic cavitation probabilities of emulsion sample #1before (a)&after purification(b).Fig.5.Summary of vaporization thresholds.Each point in the Fluence/Peak negative pressure plane corresponds to a 50%vaporization probability.NEB-GNS,NEB-GNS purified and GNS.The red dotted lines indicate:the mechanical index (MI)FDA limitation of 1.9for ultrasound imaging (vertical)and the permissible optical fluence exposure of 25mJ/cm 2(horizontal).Fig.6.Amplitude of sono-photoacoustic signals as a function of acoustic pressure at different fluences.(a)NEB-GNS sample.(b)NEB-GNS purified sample.B.Arnal et al./Photoacoustics 3(2015)3–1074.DiscussionIn this paper,we have demonstrated the potential of a novel contrast agent composed of nanoemulsion beads surrounded by gold nanospheres using simultaneous light and sound excitation.A robust emulsion characterization platform,which performs a2-dimensional parameter scan(pressure and light)for cavitation threshold determination,was developed and introduced.This platform will be particularly beneficial for future testing and comparison of new nanoemulsion contrast agent formulations.The exposure parameters required to achieve PA cavitation were extensively studied at a picomolar concentration of contrast agent (2–6Â1010beads/ml).Ultrasound pressures were varied from 0.1MPa to9MPa at focal peak negative pressures and laserfluences varied from0.4to27.6mJ/cm2.As laserfluence increased,the cavitation threshold(in terms of US peak negative pressure) decreased to values far below the FDA mechanical index(MI<1.9) limitation.From Fig.4,it is clear that the cavitation probability for ultrasound exposure alone remained low for pressures up to4MPa (<10%).The pressure for ultrasound exposure alone was scanned up to9MPa(not shown in Fig.4)yet we did not reach a50% probability of cavitation(dashed pink line).Previous work with similar nanoemulsions,in terms of boiling points and sizes, explored acoustic droplet vaporization thresholds of dodecafluor-opentane(DDFP,boiling point in bulk=298C)and of2H,3H-perfluoropentane(H-PFP,boiling point in bulk=558C)albumin-coated droplets with a mean diameter of approximately260nm, and630nm,respectively[24].These nanoemulsions were included in albumin-acrylamide gel phantoms and sonicated with 10cycle HIFU pulses(f=2MHz,pulse repetition=5s),similar to our setup(1.24MHz).For DDFP,an ultrasound peak negative pressure threshold was found at8.50MPa.In the case of H-PFP,the pressure was increased up to8.7MPa without evidence of vaporization.Our results are consistent with this study[24].When exposed to5MHz,micron-scale perfluoropentane droplets vapor-ization thresholds decreases with droplet diameter[25]as surface tension decreases.As the purification process removes particles larger than600nm,the observed increase of vaporization threshold is consistent with previous studies.Additionally,many studies reported a decreasing vaporization pressure as a function of increasing US frequency[26,27].As mentioned earlier,heat seems to be necessary to overcome surface tension stabilization. Our study shows that this heat can be delivered in a controlled and targeted way by plasmonic light absorption.Further work could study photoacoustic vaporization thresholds of NEB-GNS at higher frequencies tofind the optimal configuration to implement real-time sono-photoacoustic imaging.Preliminary imaging experiments(not shown here)suggest that particles accumulated at the bottom of the sample.Single nanoparticles are mostly subject to diffusion and gravity can usually be neglected.In contrast,gravity effects can be dominant for large oil droplets(1.7density)and is amplified by the gold particles on the surface.We took advantage of these effects to purify our sample.A centrifugation technique could have been used,but it was not preferred because it could increase the probability of aggregation of beads at the bottom of the container.Similarly,extrusion through membranefilters could lead to more consistent size distributions, but it could also generate new distributions of beads since extrusion can actually help create droplets.It could also result in the loss of products trapped on the membrane surface.Further work could investigate the best way to purify NEB-GNS samples.DLS measurements have to be complemented with other sizing techniques such as a Coulter counter to quantify the amount of micron-scale beads if high penetrability is needed(i.e.particles >500nm will not penetrate the gaps in leaky vasculature).Even a very small amount of larger beads can greatly affect the measured vaporization thresholds as their volume is far larger.A strategy using a broad distribution such as our raw sample(100nm–6m m) can image vasculature scales from large vessels to capillaries,with the ability to penetrate leaky vasculature only for the smaller particles.Previous high speed photomicrography studies on the same emulsion type showed the short lifetimes$1.2m s for the vapor bubbles under light exposure only[28],suggesting that the perfluorocarbon beads also go back to the liquid state when the ultrasoundfield vanishes.The fate of the gold nanoparticles during bubble expansion and after condensation has not been studied yet. Nevertheless,additional experiments have also shown a strong consistency in the cavitation activity after several thousand shots, indicating that the gold particles remain somehow coupled to the beads.Observing a single emulsion beadflowing into a small channel and exposed to light and sound could lead to better characterization[29].Photoacoustic cavitation is surprisingly induced in the GNS sample composed of small particles(15nm diameter)at a wavelength(750nm)where optical absorption is very weak. Previous work has only studied photoacoustic cavitation of large diameter GNS(82nm diameter)at the plasmonic resonance wavelength(532nm)[17].Here,the mean distance between GNS is72m m given the size and concentration,so coupling effects should not play a role in effective vapor bubble creation unless there is particle aggregation due to acoustic streaming,or other pressure-induced effects.Further modeling inspired by previous work[30,31] could focus on explaining this pared to the emulsion beads,the liquid volume to vaporize is not the same and the total energies necessary to achieve vaporization might not be comparable.As the probability of cavitation increases(see Fig.6),we have shown that the amplitude of the resultant acoustic signal does not increase with laserfluence forfluences higher than2.4mJ/cm2.This means that when the phase transition occurs,a higher laserfluence does not affect the vaporization signals as much as the US pressure does.The laser pulse induces heat within a short30–40ns time window enabling the phase transition.Then,it appears that the bubble size is more influenced by the pressurefield,which also controls the amplitude of bubble-generated acoustic waves.As extinction by soft tissue limits light penetration,a scenario of low laserfluence with a maximum permissible pressure would be ideal for contrast enhancement.Depending on the tissue types between the light source and the region of interest,such light penetration can be achieved from one to a few centimeters deep into tissue.A Monte Carlo simulation[31]of light transport was performed through skin (thickness D Z=1.12mm,absorption coefficient m a=0.49cmÀ1, scattering coefficient m s=82.6cmÀ1,anisotropy g=0.75),fat (D Z=2mm,m a=0.1cmÀ1,m s=115cmÀ1,g=0.9)and muscle (D Z=30mm,m a=0.09cmÀ1,m s=216cmÀ1,g=0.9).Using a gaussian beam(width:2cm,l=750nm,maximumfluence: 25mJ/cm2),fluences of2mJ/cm2and0.6mJ/cm2were respectively reached at depths of1.6and2.0cm.Future studies could explore the penetration limits for different imaging applications.Finally,thanks to the clustering of gold nanopsheres on an emulsion bead,and to the resulting large signal from the bubble, these measurements succeeded even at low concentration in a regime where single shot linear PA imaging fails(0.25cmÀ1).The nanoemulsion structure and synthesis can be further improved to reach higher efficiency,for example using another perfluorocarbon oil with a lower boiling point[25,32].Future studies will explore the relationship between both threshold and acoustic signal strength as a function of concentration.Based on this work,a real-time imaging system could achieve sono-photoacoustic imaging of NEB-GNS at depths exceeding several centimeters and at ultra-low concentration levels.ThisB.Arnal et al./Photoacoustics3(2015)3–10 8。