压电薄膜传感器.
- 格式:pptx
- 大小:2.67 MB
- 文档页数:22
压电MEMS传感器介绍及原理解析一、压电效应及压电材料1、压电效应压电材料是指受到压力作用在其两端面会出现电荷的一大类单晶或多晶的固体材料,它是进行能量转换和信号传递的重要载体。
最早报道材料具有压电特性的是法国物理学家居里兄弟,1880年他们发现把重物放在石英晶体上,晶体某些表面会产生电荷,电荷量与压力成正比,并将其成为压电效应。
压电效应可分为正压电效应和逆压电效应两种。
某些介电体在机械力作用下发生形变,使介电体内正负电荷中心发生相对位移而极化,以致两端表面出现符号相反的束缚电荷,其电荷密度与应力成比例。
这种由“压力”产生“电”的现象称为正压电效应。
反之,如果将具有压电效应的介电体置于外电场中,电场使介质内部正负电荷位移,导致介质产生形变。
这种由“电”产生“机械变形”的现象称为逆压电效应。
2、压电材料(1)压电单晶压电单晶是指按晶体空间点阵长程有序生长而成的晶体。
这种晶体结构无对称中心,因此具有压电性。
如石英晶体、镓酸锂、锗酸锂、锗酸钛以及铁晶体管铌酸锂、钽酸锂等。
压电单晶材料的生长方法包括水热法、提拉法、坩埚下降法和泡生法等。
(2)压电陶瓷压电陶瓷则泛指压电多晶体,是指用必要成份的原料进行混合、成型、高温烧结,由粉粒之间的固相反应和烧结过程而获得的微细晶粒无规则集合而成的多晶体,具有压电性的陶瓷称压电陶瓷。
压电陶瓷材料具有良好的耐潮湿、耐磨和耐高温性能,硬度较高,物理和化学性能稳定。
压电陶瓷材料包括钛酸钡BT、锆钛酸铅PZT、改性锆钛酸铅、偏铌酸铅、铌酸铅钡锂PBLN、改性钛酸铅PT等。
(3)压电薄膜压电薄膜材料是原子或原子团经过或溅射的方法沉积在衬底上而形成的,其结构可以是费静态、多晶甚至是单晶。
压电薄膜制备的器件不需要使用价格昂贵的压电单晶,只要在衬底上沉积一层很薄的压电材料,因而具有经济和省料的特点。
而且制备薄膜过程中按照一定取向来沉积薄膜,不需要进行极化定向和切割等工艺。
另外,利用压电薄膜制备的器件应用范围广泛、制作简单、成本低廉,同时其能量转换效率高,还能与半导体工艺集成,符合压电器件微型化和集成化的趋势。
PVDF压电薄膜传感器的标定技术PVDF压电薄膜传感器只能测量动态压力,因此我们要确定它的动态灵敏度系数。
本实验主要测试低应力下自制传感器的动态灵敏度,因此,采用落锤冲击装置对PVDF压电薄膜传感器进行标定实验。
一、落锤装置标定PVDF传感器的实验方案(一)实验原理PVDF压电薄膜传感器灵敏度标定装置是由标准压力传感器、PVDF压电薄膜传感器、1个2.2kg重锤(Ф60×100)、1个1mL油缸、1个油缸活塞杆(Ф8×70)、1个活塞杆定位套、两台电荷放大器、一台示波器等组成。
该装置是利用重锤、活塞杆和油缸中的硅油相互作用过程中形成毫秒量级的动态压力扰动,压力波形接近半个正弦波,在记录仪器中可以获取标准压力传感器的输出信号和被标压力传感器的输出信号,经数据处理后可以得到被标压力传感器的灵敏度和非线性误差水平,实现PVDF压电薄膜传感器的标定。
PVDF压电薄膜传感器灵敏度标定装置的主要参数如下:重锤质量约为M2=2200g,此值是设计与调试中主要控制参数之一;重锤最大落高约为hmax≈1300mm;重锤最大打击速度约为umax=(2ghmax)0.5=5m/s,此值是设计与调试中主要控制参数之一;油缸中硅油质量约为M1=1.2g,此值是设计与调试中主要控制参数之一;因为本实验需要的压力不高,所以直接手动用落锤打击产生超压。
(二)实验装置实验使用的实验装置主要由标准压力传感器、PVDF压电薄膜传感器、落锤冲击装置、两台电荷放大器、一台示波器。
(1)标准压力传感器。
我们采用比较测试法对PVDF压电薄膜传感器进行标定实验,对自制传感器和标准传感器输入相同的激励信号,通过测量它们的输出信息,比较两个传感器输出的电压波形,计算出PVDF压电薄膜传感器的灵敏度,其中标准传感器的灵敏度为2.436pc/bar。
(2)落锤装置。
落锤装置是由1个2.2kg重锤(Ф60×100)、1个1mL油缸、1个1.5m长圆筒式滑轨、1个油缸活塞杆(Ф8×70)、1个活塞杆定位套组成的。
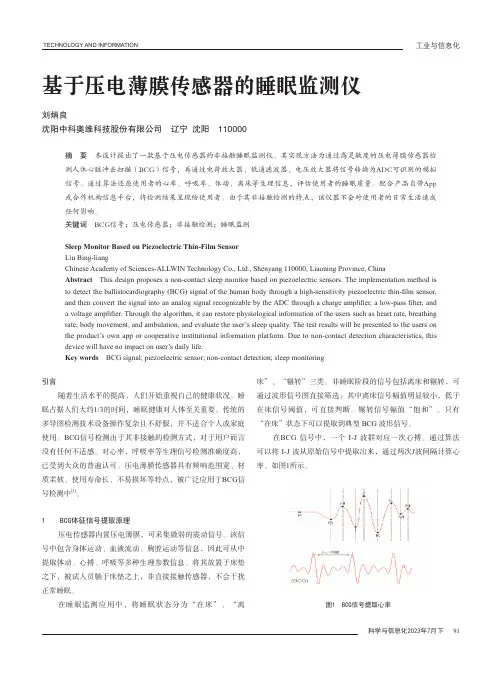
TECHNOLOGY AND INFORMATION科学与信息化2023年7月下 91基于压电薄膜传感器的睡眠监测仪刘炳良沈阳中科奥维科技股份有限公司 辽宁 沈阳 110000摘 要 本设计提出了一款基于压电传感器的非接触睡眠监测仪。
其实现方法为通过高灵敏度的压电薄膜传感器检测人体心脏冲击扫描(BCG)信号,再通过电荷放大器、低通滤波器、电压放大器将信号转换为ADC可识别的模拟信号。
通过算法还原使用者的心率、呼吸率、体动、离床等生理信息,评估使用者的睡眠质量。
配合产品自带App 或合作机构信息平台,将检测结果呈现给使用者。
由于其非接触检测的特点,该仪器不会对使用者的日常生活造成任何影响。
关键词 BCG信号;压电传感器;非接触检测;睡眠监测Sleep Monitor Based on Piezoelectric Thin-Film Sensor Liu Bing-liangChinese Academy of Sciences-ALLWIN Technology Co., Ltd., Shenyang 110000, Liaoning Province, ChinaAbstract This design proposes a non-contact sleep monitor based on piezoelectric sensors. The implementation method is to detect the ballistocardiography (BCG) signal of the human body through a high-sensitivity piezoelectric thin-film sensor, and then convert the signal into an analog signal recognizable by the ADC through a charge amplifier, a low-pass filter, and a voltage amplifier. Through the algorithm, it can restore physiological information of the users such as heart rate, breathing rate, body movement, and ambulation, and evaluate the user’s sleep quality. The test results will be presented to the users on the product’s own app or cooperative institutional information platform. Due to non-contact detection characteristics, this device will have no impact on user’s daily life.Key words BCG signal; piezoelectric sensor; non-contact detection; sleep monitoring引言随着生活水平的提高,人们开始重视自己的健康状况。
pvdf 压电电路
PVDF压电薄膜是一种常用的压电材料,具有3层结构薄膜,在两个表面已经覆了很薄的铝电极。
这种材料具有较高的压电常数、居里点温度高、热稳定性好、耐腐蚀性强等优点。
在应用方面,PVDF压电薄膜主要用于制作传感器和换能器,如压力传感器、加速度传感器、流量传感器等。
在电路设计方面,以PVDF压电薄膜为材料的传感器通常需要将信号从传感器的输出端传输到后续的信号处理电路中。
为了实现这一目标,需要设计相应的电路来连接传感器和信号处理电路。
具体电路设计需要根据实际应用需求和传感器特性进行定制,但通常需要包括信号放大、滤波、调理等环节,以提高信号的信噪比和稳定性。
总之,以PVDF压电薄膜为材料的电路设计需要根据实际应用需求和传感器特性进行定制,以确保电路的性能和稳定性。
pzt压电薄膜原理PZT压电薄膜是一种具有压电效应的薄膜材料,其原理是通过施加压力或电场来产生电荷的分离和倾斜,从而实现电能与机械能的相互转换。
PZT压电薄膜在各种应用领域中具有广泛的应用,如传感器、声波器件、振动能量收集器等。
PZT压电薄膜的压电效应基于压电效应的整体特性,即应变效应和电效应之间的相互作用。
应变效应是指当施加压力或应变时,材料产生电位变化;电效应是指当施加电场时,材料发生形变。
PZT压电薄膜利用这种相互作用,可以将机械能转化为电能或将电能转化为机械能。
在PZT压电薄膜中,晶格结构的不对称性是实现压电效应的关键。
PZT材料由铅、锆和钛等元素组成,其晶格结构呈现出非中心对称性。
当施加压力或应变时,晶格结构发生变形,导致正负电荷的分离。
这种分离产生的电荷可以通过电极收集,并产生电压信号。
相反地,当施加电场时,电场作用下的电荷重新分布会导致晶格结构的变形,从而引起机械应变。
PZT压电薄膜的性能与其晶粒尺寸、结构、组分比例以及制备工艺等因素密切相关。
通过控制这些因素,可以调节PZT薄膜的压电性能,以满足不同应用的需求。
此外,通过在PZT薄膜上加工微细结构,可以进一步提高其压电效应和灵敏度。
PZT压电薄膜在传感器领域中具有重要应用。
以压力传感器为例,当施加压力时,PZT薄膜产生电荷分离,从而产生电压信号。
通过测量这一信号的变化,可以确定外部压力的大小。
类似地,PZT压电薄膜也可用于加速度、应变和温度等传感器的制备。
PZT压电薄膜还可以应用于声波器件,如压电陶瓷换能器和压电陶瓷谐振器。
在压电陶瓷换能器中,当施加电压时,PZT薄膜产生机械振动,从而产生声波;相反地,当声波作用于薄膜时,薄膜产生电荷分离,从而产生电压信号。
压电陶瓷谐振器则利用PZT薄膜的压电效应,实现声波的放大和滤波功能。
PZT压电薄膜还可用于振动能量收集器的制备。
通过将PZT薄膜与机械振动器件相结合,可以将机械能转化为电能,从而实现能量的收集和存储。
压电式传感器是基于压电效应的传感器,是一种自发电式和机电转换式传感器。
它的敏感元件由压电材料制成。
压电材料受到力后表面产生电荷。
此电荷经电荷放大器和测量电路放大和变换阻抗后就成为正比于所受外力的电量输出。
压电式传感器用于测量力和能变换为力的非电物理量。
它的优点是频带宽、灵敏度高、信噪比高、结构简单、工作可靠和重量轻等。
缺点是某些压电材料需要防潮措施,而且输出的直流响应差,需要采用高输入阻抗电路或电荷放大器来克服这一缺陷。
2压电式传感器的基本原理2.1 压电效应压电效应可分为正压电效应和逆压电效应。
正压电效应是指:当晶体受到某固定方向外力的作用时,内部就产生电极化现象,同时在某两个表面上产生符号相反的电荷;当外力撤去后,晶体又恢复到不带电的状态;当外力作用方向改变时,电荷的极性也随之改变;晶体受力所产生的电荷量与外力的大小成正比。
压电式传感器大多是利用正压电效应制成的。
逆压电效应是指对晶体施加交变电场引起晶体机械变形的现象,又称电致伸缩效应。
用逆压电效应制造的变送器可用于电声和超声工程。
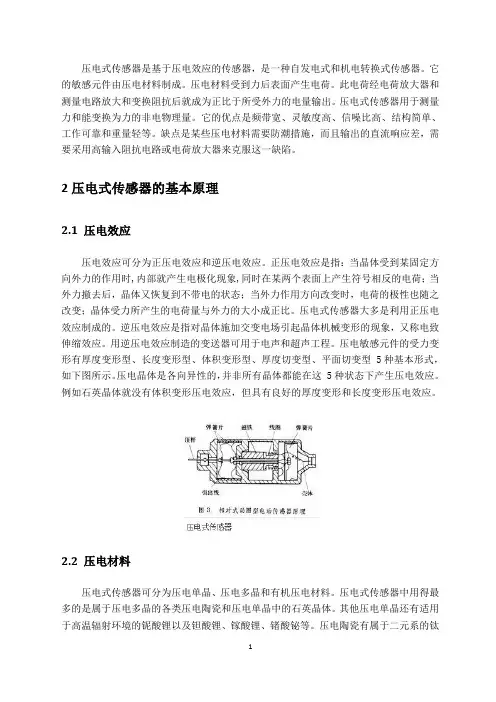
压电敏感元件的受力变形有厚度变形型、长度变形型、体积变形型、厚度切变型、平面切变型 5种基本形式,如下图所示。
压电晶体是各向异性的,并非所有晶体都能在这 5种状态下产生压电效应。
例如石英晶体就没有体积变形压电效应,但具有良好的厚度变形和长度变形压电效应。
2.2 压电材料压电式传感器可分为压电单晶、压电多晶和有机压电材料。
压电式传感器中用得最多的是属于压电多晶的各类压电陶瓷和压电单晶中的石英晶体。
其他压电单晶还有适用于高温辐射环境的铌酸锂以及钽酸锂、镓酸锂、锗酸铋等。
压电陶瓷有属于二元系的钛酸钡陶瓷、锆钛酸铅系列陶瓷、铌酸盐系列陶瓷和属于三元系的铌镁酸铅陶瓷。
压电陶瓷的优点是烧制方便、易成型、耐湿、耐高温。
缺点是具有热释电性,会对力学量测量造成干扰。
有机压电材料有聚二氟乙烯、聚氟乙烯、尼龙等十余种高分子材料。
有机压电材料可大量生产和制成较大的面积,它与空气的声阻匹配具有独特的优越性,是很有发展潜力的新型电声材料。
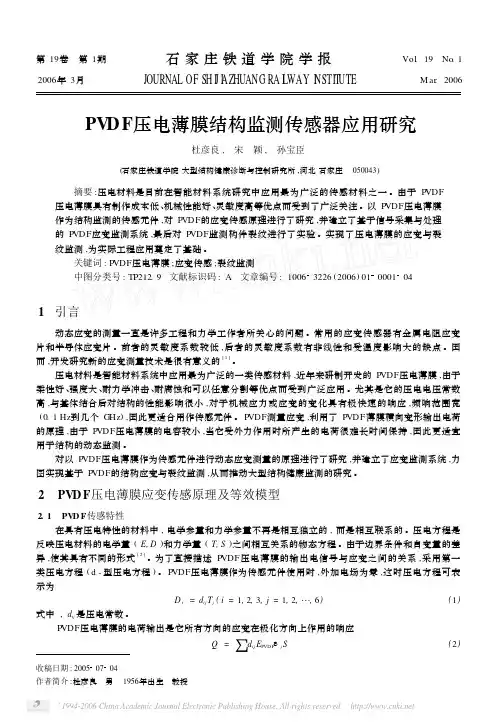
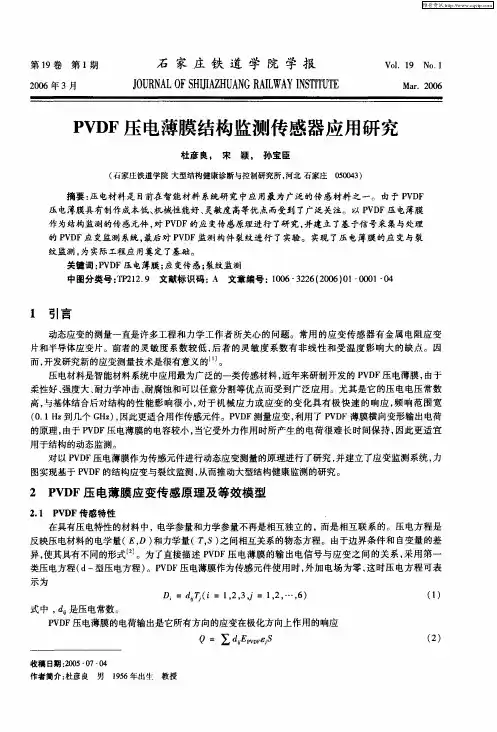
第19卷 第1期石家庄铁道学院学报Vol .19 No .12006年3月JOURNAL OF SH I J I A ZHUANG RA I L WAY I N STITUTE Mar .2006PV D F 压电薄膜结构监测传感器应用研究杜彦良, 宋 颖, 孙宝臣(石家庄铁道学院大型结构健康诊断与控制研究所,河北石家庄 050043) 摘要:压电材料是目前在智能材料系统研究中应用最为广泛的传感材料之一。
由于P VDF 压电薄膜具有制作成本低、机械性能好、灵敏度高等优点而受到了广泛关注。
以P VDF 压电薄膜作为结构监测的传感元件,对P VDF 的应变传感原理进行了研究,并建立了基于信号采集与处理的P VDF 应变监测系统,最后对P VDF 监测构件裂纹进行了实验。
实现了压电薄膜的应变与裂纹监测,为实际工程应用奠定了基础。
关键词:P VDF 压电薄膜;应变传感;裂纹监测中图分类号:TP212.9 文献标识码:A 文章编号:10063226(2006)01000104收稿日期:20050704作者简介:杜彦良 男 1956年出生 教授1 引言动态应变的测量一直是许多工程和力学工作者所关心的问题。
常用的应变传感器有金属电阻应变片和半导体应变片。
前者的灵敏度系数较低,后者的灵敏度系数有非线性和受温度影响大的缺点。
因而,开发研究新的应变测量技术是很有意义的[1]。
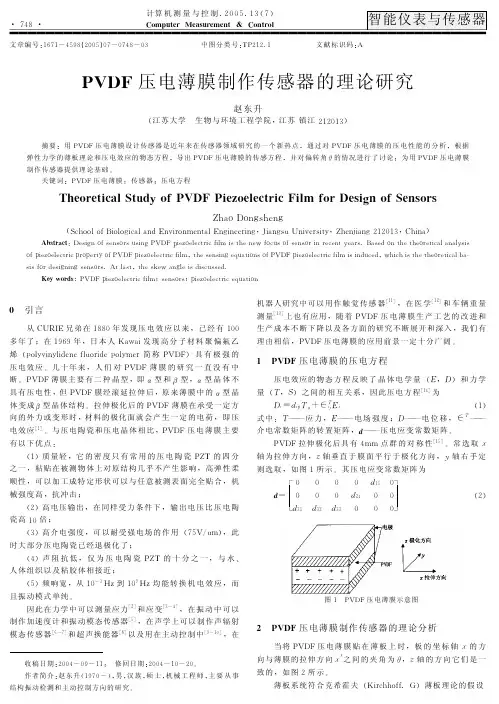
压电材料是智能材料系统中应用最为广泛的一类传感材料,近年来研制开发的P VDF 压电薄膜,由于柔性好、强度大、耐力学冲击、耐腐蚀和可以任意分割等优点而受到广泛应用。
尤其是它的压电电压常数高,与基体结合后对结构的性能影响很小,对于机械应力或应变的变化具有极快速的响应,频响范围宽(0.1Hz 到几个GHz ),因此更适合用作传感元件。
P VDF 测量应变,利用了P VDF 薄膜横向变形输出电荷的原理,由于P VDF 压电薄膜的电容较小,当它受外力作用时所产生的电荷很难长时间保持,因此更适宜用于结构的动态监测。
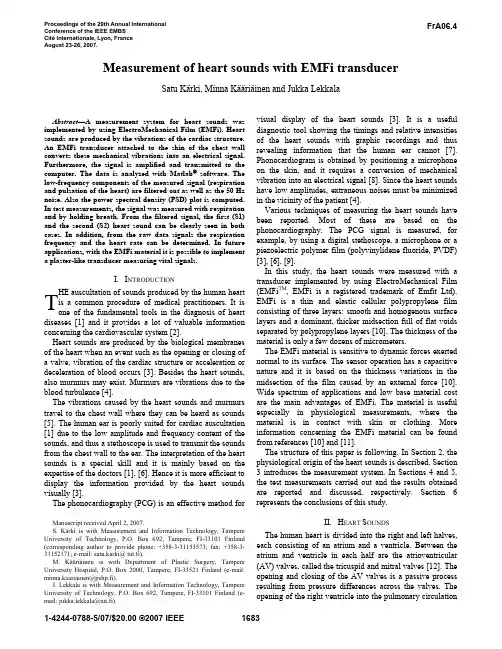
Abstract —A measurement system for heart sounds wasimplemented by using ElectroMechanical Film (EMFi). Heart sounds are produced by the vibrations of the cardiac structure. An EMFi transducer attached to the skin of the chest wall converts these mechanical vibrations into an electrical signal. Furthermore, the signal is amplified and transmitted to the computer. The data is analyzed with Matlab ® software. The low-frequency components of the measured signal (respiration and pulsation of the heart) are filtered out as well as the 50 Hz noise. Also the power spectral density (PSD) plot is computed. In test measurements, the signal was measured with respiration and by holding breath. From the filtered signal, the first (S1) and the second (S2) heart sound can be clearly seen in both cases. In addition, from the raw data signals the respiration frequency and the heart rate can be determined. In future applications, with the EMFi material it is possible to implement a plaster-like transducer measuring vital signals.I. I NTRODUCTIONHE auscultation of sounds produced by the human heart is a common procedure of medical practitioners. It is one of the fundamental tools in the diagnosis of heart diseases [1] and it provides a lot of valuable information concerning the cardiovascular system [2].Heart sounds are produced by the biological membranes of the heart when an event such as the opening or closing of a valve, vibration of the cardiac structure or acceleration or deceleration of blood occurs [3]. Besides the heart sounds, also murmurs may exist. Murmurs are vibrations due to the blood turbulence [4].The vibrations caused by the heart sounds and murmurs travel to the chest wall where they can be heard as sounds [5]. The human ear is poorly suited for cardiac auscultation [1] due to the low amplitude and frequency content of the sounds, and thus a stethoscope is used to transmit the sounds from the chest wall to the ear. The interpretation of the heart sounds is a special skill and it is mainly based on the expertise of the doctors [1], [6]. Hence it is more efficient to display the information provided by the heart sounds visually [3].The phonocardiography (PCG) is an effective method forManuscript received April 2, 2007.S. Kärki is with Measurement and Information Technology, Tampere University of Technology, P.O. Box 692, Tampere, FI-33101 Finland (corresponding author to provide phone: +358-3-31153573; fax: +358-3-31152171; e-mail: satu.karki@ tut.fi).M. Kääriäinen is with Department of Plastic Surgery, Tampere University Hospital, P.O. Box 2000, Tampere, FI-33521 Finland (e-mail: minna.kaariainen@pshp.fi).J. Lekkala is with Measurement and Information Technology, Tampere University of Technology, P.O. Box 692, Tampere, FI-33101 Finland (e-mail: jukka.lekkala@tut.fi).visual display of the heart sounds [3]. It is a useful diagnostic tool showing the timings and relative intensities of the heart sounds with graphic recordings and thus revealing information that the human ear cannot [7]. Phonocardiogram is obtained by positioning a microphone on the skin, and it requires a conversion of mechanical vibration into an electrical signal [8]. Since the heart sounds have low amplitudes, extraneous noises must be minimized in the vicinity of the patient [4].Various techniques of measuring the heart sounds have been reported. Most of these are based on the phonocardiography. The PCG signal is measured, for example, by using a digital stethoscope, a microphone or a piezoelectric polymer film (polyvinylidene fluoride, PVDF) [3], [6], [9].In this study, the heart sounds were measured with a transducer implemented by using ElectroMechanical Film (EMFi TM , EMFi is a registered trademark of Emfit Ltd). EMFi is a thin and elastic cellular polypropylene film consisting of three layers: smooth and homogenous surface layers and a dominant, thicker midsection full of flat voids separated by polypropylene layers [10]. The thickness of the material is only a few dozens of micrometers.The EMFi material is sensitive to dynamic forces exerted normal to its surface. The sensor operation has a capacitive nature and it is based on the thickness variations in the midsection of the film caused by an external force [10]. Wide spectrum of applications and low base material cost are the main advantages of EMFi. The material is useful especially in physiological measurements, where the material is in contact with skin or clothing. More information concerning the EMFi material can be found from references [10] and [11].The structure of this paper is following. In Section 2, the physiological origin of the heart sounds is described. Section 3 introduces the measurement system. In Sections 4 and 5, the test measurements carried out and the results obtained are reported and discussed, respectively. Section 6 represents the conclusions of this study.II. H EART S OUNDSThe human heart is divided into the right and left halves, each consisting of an atrium and a ventricle. Between the atrium and ventricle in each half are the atrioventricular (AV) valves, called the tricuspid and mitral valves [12]. The opening and closing of the AV valves is a passive process resulting from pressure differences across the valves. The opening of the right ventricle into the pulmonary circulationMeasurement of heart sounds with EMFi transducerSatu Kärki, Minna Kääriäinen and Jukka LekkalaTProceedings of the 29th Annual International Conference of the IEEE EMBS Cité Internationale, Lyon, France August 23-26, 2007.FrA06.4and left ventricle into the aorta are also regulated by the valves, called the pulmonary and aortic valves [12].The cardiac cycle consists of two phases: the period of ventricular contraction and blood ejection, systole, and ventricular relaxation, diastole, during which the ventricle fills with blood [12]. The sound emitted by a human heart during a single cardiac cycle consists of two dominant events, known as the first heart sound S1 and the second heart sound S2 [13]. The first heart sound depicts the onset of systole, and it is produced by the closure of mitral and tricuspid valves [14]. The second heart sound is produced by the closure of the aortic and pulmonary valves, and it marks the end of systole and the beginning of diastole [14]. S1 and S2 are always audible in a normal patient [1].Additional heart sounds may occur in early diastole (the third heart sound, S3) and late diastole (the fourth heart sound, S4) [14]. S3 is sometimes audible in normal patients, but S4 is usually abnormal [14]. S3 and S4 usually cannot be heard with a stethoscope because of their low frequency content [5].In the auscultation of heart, different sound components may be audible. The primary components are the four heart sounds. The second class is the murmurs [1] caused by the turbulence in blood flow [4]. Murmurs may occur in normal heart or they may be caused by structural abnormalities [1]. In addition, clicks and snaps may be heard during the cardiac cycle. These sounds indicate abnormality and they are associated with valve opening [1].Sound consists of vibrations in different frequencies [5] and thus different heart disorders generate the sounds of different frequencies [6]. A lot of opinions concerning the frequency content of the heart sounds and murmurs have been represented. The first heart sound has a slightly lower frequency than the second heart sound [14]. The frequencies of the murmurs are higher [2], [15], and frequencies from 600 to 1000 Hz may exist [15].Anand [6] stated that the frequency range of the heart sounds is up to 100 Hz. Arnott et al. concluded that the major concentration of energy for both the first and the second heart sounds is below 150 Hz [16]. Cameron & Skofronick [17] and Rushmer [17] agreed with Arnott; both stated that the frequency range of the heart sound is from 20 to about 200 Hz. Vander et al. [12] suggested a bit higher frequency range, from 40 to 500 Hz.The heart sounds and murmurs are measured from the chest wall. For the cardiac auscultation, four surface areas of the chest wall are suitable [5], [15]. These areas are called the aortic, pulmonary, tricuspid and mitral areas corresponding to the respective valvular areas [5], [15]. With the stethoscope placed in any one of these areas, the sounds from all the other valves can still be heard, though the sound from the special valve is the loudest [5].III.M EASUREMENT SYSTEMA.EMFi transducerThe transducer was implemented by using commercial EMFi material. Mechanical vibrations caused by the cardiac structure are converted into an electrical signal by the transducer. The operation is based on the thickness variations of the EMFi material caused by the vibrations. The change in thickness generates a corresponding charge, and hence, a voltage to appear at the electrodes [11]. Thus the vibrations applied to the film can be detected by measuring either the charge or the voltage of the transducer. The transducer was chosen to be a two-layer folded structure with a shape of a rectangle (size 7 cm x 5 cm). The film used was metallized on both sides by sputtering to provide electrodes. The thickness of the electrodes is only a few dozens of nanometers, and thus the conductivity of the electrodes was ensured with a layer of aluminum foil. In the constructed transducer, the outer metal surface acts as a grounded electric shield and the inner surface of the two layer stack as a signal electrode. Finally, the outer surface of the EMFi transducer was strengthened with a layer of plastic sheeting. Connections were made by using a coaxial cable. The structure and operation principle of the EMFi transducer is described more precisely in [18].B.Measurement electronicsThe electronics is enclosed inside a plastic housing including amplifier electronics and a power source. Two 9 V alkaline batteries are used as power source. The amplifier electronics is realized with a transimpedance amplifier followed by a voltage amplifier. AD820 (Analog Devices) amplifier is used for both stages. The transimpedance amplifier converts the charge flow of the EMFi transducer to a voltage, which is further amplified with the voltage amplifier. The amplifier has the lower cut-off frequency (-3 dB) 1.5 Hz and the upper one 830 Hz.C.Measurement setupThe EMFi transducer was attached to the chest wall by using double-sided tape. The transducer area corresponds to the pulmonary area, that is, the transducer is attached to the left side of the sternum, below the collar bone.The measurement electronics was connected to the computer by using National Instruments SCB-68 connector block. The data was collected and analyzed with Matlab®software. The sampling rate f s = 1000 Hz was used. Each measurement lasted for 30 seconds.D.Data analysisIn the data analysis, the Matlab® software was used. The original raw data signal was filtered and the power spectral density (PSD) plot was calculated. In the filtration, the digital Butterworth second order band pass filter was used to remove the low-frequency respiration and heart pulsation components of the signal. The pass band of the filter waschosen to be from 20 Hz to 499 Hz, based on the frequency content of the heart sounds discussed in Section 2. The heart sounds can be detected within this pass band. The 50 Hz noise was removed with an elliptic band stop filter. The PSD estimate was computed by using the Welch method of averaged periodograms [19].IV. TEST MEASUREMENTSFor the test measurements, the EMFi transducer was taped to the chest wall of a healthy test person by using double-sided tape. In Fig. 1, the measured raw data signal is shown. The main component of the signal is respiration. The respiration frequency is eight times in 30 seconds. Also the pulsation of the heart can be distinguished as sharp spikes.Time [s]V o l t a g e [V ]Fig. 1. Measured raw data signal. The main component of the signal corresponds to respiration.In Fig. 2, the filtered signal is shown. To distinguish the separate heart sound components, only a section of four seconds of the signal is shown. In the figure, five cardiac cycles can be seen, each consisting of the first heart sound (S1) and the second heart sound (S2).-3Time [s]V o l t a g e [V ]Fig. 2. Filtered signal. Each cardiac cycle consists of the first (S1) and the second (S2) heart sound.PSD plot provides information of the frequency content of the heart sounds. The plot was computed from the filtered30 seconds signal by using 2048-point periodograms and 50% overlapping. In Fig. 3, the PSD plot of the filtered signal is shown.1010101010-810-6Frequency [Hz]P S D [V 2/H z ]Fig. 3. Power spectral density (PSD) plot.The raw data signal was also measured by holding breath. A ten seconds section of the measured signal is shown in Fig. 4. With this measurement setup, the main component is the pulsation of heart. Fourteen peaks are visible and thus the heart rate has been 84 during the measurement. Fig. 5 represents a four seconds section of the filtered signal.Time [s]V o l t a g e [V ]Fig. 4. Raw data signal measured by holding breath. The heart pulsation can be seen as sharp spikes.-3Time [s]V o l t a g e [V ]Fig. 5. Filtered signal measured by holding breath. Five cardiac cycles consisting S1 and S2 are shown.The frequency content of the signal is mainly the same asit was in the previous case. Therefore the PSD plot is not represented here.V.R ESULTSThe raw data signal measured with respiration reveals the respiration frequency. With proper filtering, the heart sound components can be seen. The first and the second heart sounds are clearly visible. The signal was measured from the pulmonary area, and thus the second heart sound has occasionally larger amplitude. However, the amplitude of the heart sounds slightly alters due to the phase of the respiration. Based on the power spectral density plot shown in Fig. 3, the frequency content of the heart sounds is concentrated on frequencies up to 80 Hz. This corresponds to the values discussed in Section 2.The pulsation of the heart is clearly seen from the raw data signal measured by holding breath. Again, in the filtered signal, the second heart sound has slightly larger amplitude than the first sound due to the measurement area. Since the measurement was carried out by holding breath, the amplitudes of the heart sounds do not alter. With this measurement setup, the heart sounds are more evident. Some noise appeared in the filtered signals. The amount of noise could be reduced by more efficient shielding of the EMFi transducer. However, the extraneous noises did not disturb the measurement. The EMFi material records the mechanical vibrations and is not as sensitive to extraneous noises coupled via air as normal microphones. Hence it is suitable material for measurements of this kind.VI.C ONCLUSIONSIn this study, a new measurement system for the heart sounds was developed. The transducer was implemented by using ElectroMechanical Film (EMFi). The EMFi transducer converts the mechanical vibrations caused by the cardiac structure to an electrical signal. Thus the operation is more straightforward than in conventional stethoscopes, where a bell is required as an impedance matcher between the air and skin [17] before the conversion to an electrical signal is feasible. In addition, the amplifier electronics for the EMFi transducer was implemented. The measured and amplified signal was transmitted to the computer and analyzed with the Matlab® software.With the constructed EMFi transducer and amplifier electronics, some test measurements were carried out. By taping the transducer to the chest wall of a healthy test person and by using proper digital filters, the heart sounds can be clearly seen. In the test measurements, the signal was measured both with respiration and by holding breath. With the latter one, the heart sound signal was more distinct, since the phase of the respiration did not affect the amplitudes of the heart sounds. From the signal measured by holding breath, the heart rate can be calculated. In addition, the respiration frequency can be determined from the signal measured with respiration.The EMFi transducer taped to the chest wall reveals a lot of valuable information. The respiration frequency, heart rate and heart sounds can be determined, although the focus here was in the measurement of heart sounds. With EMFi material and by using more sophisticated manufacturing techniques, it would be possible to implement a plaster-like transducer measuring vital signals. Due to the low base material cost, the transducer could be disposable. Based on the results obtained here, the EMFi seems to be a promising material for physiological measurements.R EFERENCES[1]T. Reed, N. Reed and P. Fritzson, “Heart sound analysis for symptomdetection and computer aided diagnosis”, Simulation ModellingPractice and Theory, vol. 12, pp. 129-146, May 2004.[2]Z. Zhidong, Z. Zhijin and C. Yuquan, “Time-frequency analysis ofheart sound based on HHT”, Int. Conf. Communications, Circuits and Systems, 2005.[3]L. T. Hall, J. L. Maple, J. Agzarian and D. Abbott, “Sensor system forheart sound biomonitor”, Microelectronics Journal, vol. 31, pp. 583-592, July 2000.[4]J. Webster (ed.), “Medical instrumentation: application and design”,Boston: Houghton Mifflin, 1978, ch. 7.[5] A. Guyton, “Textbook of medical physiology”, Philadelphia: W.B.Sounders, 1976, 5th edition, ch. 27.[6]R. S. Anand, “PC based monitoring of human heart sounds”,Computers and Electrical Engineering, vol. 31, pp. 166-173, March2005.[7]S. R. Messer, J. Agzarian and D. Abbott, “Optimal wavelet denoisingfor phonocardiograms”, Microelectronics Journal, vol. 32, pp. 931-941, December 2001.[8]L. Torres-Pereira, P. Ruivo, C. Torres-Pereira and C. Couto, “Anoninvasive telemetric heart rate monitoring system based onphonocardiography”, IEEE Int. Symposium on Industrial Electronics,1997, pp. 856-859.[9] A. Zucherwar, R. Pretlow, J. Stoughton and D. Baker, “Developmentof a piezopolymer pressure sensor for a portable fetal heart ratemonitor”, IEEE Trans. Biomedical Engineering, vol. 40, pp. 963-969,September 1993.[10]M. Paajanen, J. Lekkala and K. Kirjavainen, ”ElectroMechnical Film(EMFi) – a new multipurpose electret material”, Sensors andActuators A: Physical, vol. 84, pp. 95-102, August 2000.[11]Homepage of Emfit Ltd, , 2.4.2007.[12] A. Vander, J. Sherman and D. Luciano, “Human physiology: themechanisms of body function”, New York: McGraw-Hill, 1990, 5thedition, ch. 3C.[13]S. M. Debbal and F. Bereksi-Reguig, “Time-frequency analysis of thefirst and the second heartbeat sounds”, Applied Mathematics andComputation, vol. 184, pp. 1041-1052, January 2007.[14] B. Kirby and K. MacLeod, “Clinical examination of the heart”,Medicine, vol. 34, pp. 123-128, April 2006.[15]R. Rushmer, “Cardiovascular dynamics”, Philadelphia: W.B.Sounders, 1976, 4th edition, ch. 11.[16]P. Arnott, G. Pfeiffer and M. Tavel, “Spectral analysis of heart sounds:relationships between some physical characteristics and frequencyspectra of first and second heart sounds in normals andhypertensives”, Journal of Biomedical Engineering, vol. 6, pp. 121-128, April 1984.[17]J. Cameron and J. Skofronick, “Medical physics”, New York: JohnWiley & Sons, 1978, ch. 8.[18]S. Kärki, T. Salpavaara and J. Lekkala,”EMFi in wearable audioapplications”, 4th Int. Workshop on Wearable and Implantable BodySensor Networks, 2007.[19]P.D. Welch, “The use of fast Fourier transform for the estimation ofpower spectra: a method based on time averaging over short, modified periodograms”, IEEE Trans. Audio and Electroacoustics, vol. 15, pp.70-73, 1967.。