KDCIV系列光伏阵列IV模拟器
- 格式:pdf
- 大小:1.23 MB
- 文档页数:6
坡面屋顶光伏阵列阴影分析软件坡面屋顶上的光伏阵列是一种常见的发电装置,可以将太阳能转化为电能。
然而,由于建筑物和周围环境的遮挡,光伏阵列可能会受到阴影的影响,降低发电效率。
因此,进行光伏阵列阴影分析是非常重要的。
现在市场上有很多光伏阵列阴影分析软件,可以帮助用户准确分析阴影的影响。
这些软件通常基于建筑的地理位置、方向和阴影对象的高度等参数,利用数学模型和算法来模拟太阳的轨迹和阴影的投射情况。
下面是一些常见的光伏阵列阴影分析软件:1. PVsyst:PVsyst是一款功能强大的光伏系统设计和模拟软件,可以进行阴影分析、优化电池板布局等。
它可以基于建筑物的地理位置、倾角、方向等参数,模拟太阳的轨迹和阴影的投射情况,并提供相应的报告和结果。
2. Solar design tools:这是一个在线的光伏系统设计和模拟平台,提供了光照模拟、阴影分析和电池板布局规划等功能。
用户可以通过上传建筑物的CAD文件或手动输入参数,进行光伏阵列的阴影分析和电池板布局优化。
3. SAM(System Advisor Model):SAM是美国国家可再生能源实验室开发的一款免费的太阳能系统模拟软件。
它可以进行光伏阵列的阴影分析、优化布局、能量产出模拟等。
SAM具有友好的用户界面和强大的模拟功能,广泛应用于光伏系统的设计和优化。
通过使用这些光伏阵列阴影分析软件,用户可以准确地评估阴影对光伏系统产能的影响,进行电池板布局的优化,提升系统的发电效率。
此外,这些软件还可以提供详细的报告和结果,帮助用户进行经济和环境效益的评估。
对于光伏系统的设计和建设来说,光伏阵列阴影分析是一项非常重要的工作。
它可以帮助用户全面评估阴影对系统产能的影响,合理规划电池板的布局,提高系统的发电效率。
因此,通过使用光伏阵列阴影分析软件,可以更好地设计和优化光伏系统,实现更高的经济和环境效益。
基于数模混合控制的快速光伏模拟器谷叶;邓焰;李广地;王昆【摘要】针对目前光伏电池最大功率点跟踪(MPPT)算法扰动频率越来越高的问题,设计了一种基于数模混合控制的快速光伏模拟器.模拟器的数字部分采用数字信号处理器(DSP)实现,所提出的算法首先使用四段折线法拟合光伏电池的伏安特性曲线,线性化的拟合结果可简化运算过程;接着采样输出电压、电流,计算出了负载阻抗;最后利用负载阻抗定位法,只用一个运算周期确定光伏模拟器的静态工作点.模拟部分主功率电路为同步BUCK,控制算法采用峰值电流控制以提高电路的响应速度,且其输出电压和电流可跟踪数字部分输出的具有光伏特性的参考值.建立模型分析模拟器的响应时间为0.22 ms,满足光伏变流器的MPPT算法要求.仿真和实验结果表明,理论分析准确,所设计的光伏模拟器具有实用性.【期刊名称】《机电工程》【年(卷),期】2014(031)004【总页数】5页(P517-521)【关键词】光伏模拟器;快速最大功率点跟踪(MPPT);数模混合控制;动态响应【作者】谷叶;邓焰;李广地;王昆【作者单位】浙江大学电气工程学院,浙江杭州310027;浙江大学电气工程学院,浙江杭州310027;浙江大学电气工程学院,浙江杭州310027;浙江大学电气工程学院,浙江杭州310027【正文语种】中文【中图分类】TM61;TH74;TP2720 引言光伏电池的输出特性为非线性,具有最大功率点(MPP)[1],因此光伏电池变流器通常采用MPPT算法提高能量利用率[2]。
若直接用光伏电池来调试MPPT 算法,一方面安装成本高、占地面积大,且做实验时需进行串、并联调整,耗费人力物力;另一方面光伏电池的输出特性与光照强度、环境温度等相关,因而实验结果可复现性差[3]。
故有必要研发设计一种光伏模拟器模拟光伏电池特性,加速光伏变流器的研发工作。
光伏模拟器不仅应具有与光伏电池足够相近的静态特性,还应具备合理的响应速度,因为在配合后级MPPT算法调试时,只有在MPPT的两次扰动时间间隔内输出达到稳态,才能不影响后级变流器的MPPT动作。
光伏组件用太阳模拟器I-V测试仪校准方法研究林剑春【摘要】光伏组件的功率测量与太阳模拟器I-V测试仪密切相关。
为了满足光伏组件制造企业在产线上对I-V测试仪进行快速校准的需求,文中提出了一种基于标准光伏组件比较测量的校准方法,并进行了不确定度分析计算。
测量时,将标准光伏组件放置在太阳模拟器有效工作面上并保持位置不变,再用数字信号采集装置分别对标准光伏组件的开路电压和短路电流进行测量,然后将测量结果与太阳模拟器I-V测试仪得到的数值进行比较,得到修正系数。
该方法综合考虑了辐照度、温度、采样时间等因素。
根据分析,开路电压校准结果的相对扩展不确定度为1.6%( k=2),短路电流校准结果的相对扩展不确定度为1.8%(k=2),该过程能够较好地保证光伏组件功率的准确测量。
%Power measurement of Photovoltaic (PV) modules is closely related to solar simulator I-V tester. In order to meet the requirement of PV module manufacturing enterprises for solar simulator I-V tester calibration in production line, we propose a calibration method based on comparison of measuring the same standard PV module and calculated the calibration uncertainty. The correction factor is obtained by comparing the open-circuit voltage and short circuit current of the same standard PV module measured by the digital signal acquisition device with the results measured by solar simulator I-V tester. The standard PV module should be placed in the effective working place of the solar simulator and be kept in the same position. This method takes into account the irradiance, temperature, sampling time and other factors. According to the analysis, the relative expanded uncertainty of the open-circuit voltage calibration results is 1.6%( =2), and the relative expanded uncertainty of the short-circuit current calibration results is 1.8%( =2), which results in accurate measurement of the PV modules.【期刊名称】《质量技术监督研究》【年(卷),期】2015(000)003【总页数】5页(P6-9,13)【关键词】光伏组件;太阳模拟器;I-V测试仪;校准【作者】林剑春【作者单位】福建省计量科学研究院,福建福州 350003【正文语种】中文1 前言光伏组件是光伏发电系统中的核心部件,其功率大小直接影响到光伏电站的发电量,而光伏组件的功率通常是用太阳模拟器进行测量的[1]。
本文由jiabxhit贡献pdf文档可能在WAP端浏览体验不佳。
建议您优先选择TXT,或下载源文件到本机查看。
华中科技大学硕士学位论文基于DSP的光伏电池数字模拟系统研究姓名:杜柯申请学位级别:硕士专业:电力电子与电力传动指导教师:段善旭 20060429 摘要太阳能作为一种新型的可再生资源受到越来越广泛的重视,光伏发电则是太阳能利用中技术含量最高、最有发展前途的技术。
现在,光伏发电系统已在世界范围内得到越来越广泛的应用。
为了在实验室条件下,进行太阳能光伏发电的研究,必须研究出一种可以模拟光伏电池输出 I-V 特性的模拟器。
本文分析了太阳能光伏电池的输出 I-V 特性,讨论了光伏电池的数学模型,并在此模型基础之上建立了简单易用的工程数学模型。
本文还根据现有文献讨论了国内外光伏电池模拟器的研究状况,并在这些研究成果的基础上提出了自己的设计方案。
本文从DSP控制电路、IGBT 驱动和主电路拓扑结构三个层次详细介绍了系统硬件组成;软件部分,本文提出了用分段二次曲线的方法拟合光伏电池输出特性曲线的算法,并针对特定功率采用汇编语言编写了程序实现该算法。
通过系统仿真和实验证明了系统工作原理的正确性。
实验结果证明本文中所设计的光伏电池模拟器,能够较好的完成设计的目的,模拟器的输出特性符合所要模拟的光伏电池的输出 I-V 特性,并且模拟器具有较好的动态响应性能,负载突变时,模拟器能够自动跟踪工作点的变化并在当前工作点稳定工作。
因此,本系统能够在实验室条件下满足光伏发电系统的实验要求,为研究工作提供一个较好的实验环境,节省研究经费和时间,加快研究进度。
关键词:光伏电池、特性曲线、模拟器、BUCK 电路、DSPAbstractSolar energy is paid more and more attention to as a new type of regenerated energy sources. As the most important technology in the use of Solar energy, PV power systemis used all over the world. It’s necessary to imitate the performance characteristic of solar cells if researching Solar energy in the laboratory condition. This paper analyzed the I-V characteristic of solar cells and its mathematical model. Furthermore, this paper presents the engineering analytical models of solar cells derived from the mathematical model. And this paper presents my own solution of the PV simulator on the study of all the papers about the simulator. Hardware that contains DSP controller, IGBT driver and main circuit were introduced in detail; . Quadratic polynomials are used to fit the real PV array’s I-V characteristic curve, and it is programmed by assembly language to fulfill the algorithm. Through the simulation under Matlab and the experiments, the exactitude of the system is illustrated. The experimental results show that the output characteristics of the simulator are very close to those of actual solar cells, and the simulator has a good dynamic response as well. It can search the working Point automatically and stabilize the output according to the change of the loads. Therefore, some extent, simulator can be used in replacement of actual to the solar cells in the laboratory condition, provide a good environment for experiment to cut down money and time.Key words:solar cells , characteristics curve , simulator , BUCK ,DSP 独创性声明本人声明所呈交的学位论文是我个人在导师指导下进行的研究工作及取得的研究成果。
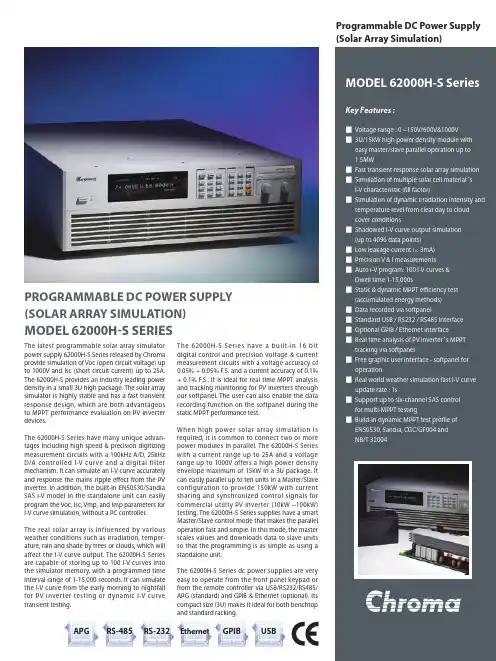
The latest programmable solar array simulator power supply 62000H-S Series released by Chroma provide simulation of Voc (open circuit voltage) up to 1000V and Isc (short circuit current) up to 25A. The 62000H-S provides an industry leading power density in a small 3U high package. The solar array simulator is highly stable and has a fast transient response design, which are both advantageos to MPPT performance evaluation on PV inverter devices.The 62000H-S Series have many unique advan-tages including high speed & precision digitizing measurement circuits with a 100kHz A/D, 25kHz D/A controlled I-V curve and a digital filter mechanism. It can simulate an I-V curve accurately and response the mains ripple e ect from the PV inverter. In addition, the built-in EN50530/Sandia SAS I-V model in the standalone unit can easily program the Voc, Isc, Vmp, and Imp parameters for I-V curve simulation, without a PC controller.The real solar array is influenced by various weather conditions such as irradiation, temper-ature, rain and shade by trees or clouds, which will affect the I-V curve output. The 62000H-S Series are capable of storing up to 100 I-V curves into the simulator memory, with a programmed time interval range of 1-15,000 seconds. It can simulate the I-V curve from the early morning to nightfall for PV inverter testing or dynamic I-V curve transient testing.The 62000H-S Series have a built-in 16 bit digital control and precision voltage & current measurement circuits with a voltage accuracy of 0.05% + 0.05% F.S. and a current accuracy of 0.1% + 0.1% F.S.. It is ideal for real time MPPT analysis and tracking monitoring for PV inverters through our softpanel. The user can also enable the data recording function on the softpanel during the static MPPT performance test.When high power solar array simulation is required, it is common to connect two or more power modules in parallel. The 62000H-S Series with a current range up to 25A and a voltage range up to 1000V offers a high power density envelope maximum of 15kW in a 3U package. It can easily parallel up to ten units in a Master/Slave configuration to provide 150kW with current sharing and synchronized control signals for commercial utility PV inverter (10kW ~100kW) testing. The 62000H-S Series supplies have a smart Master/Slave control mode that makes the parallel operation fast and simple. In this mode, the master scales values and downloads data to slave units so that the programming is as simple as using a standalone unit.The 62000H-S Series dc power supplies are very easy to operate from the front panel keypad or from the remote controller via USB/RS232/RS485/APG (standard) and GPIB & Ethernet (optional). Its compact size (3U) makes it ideal for both benchtop and standard racking.PROGRAMMABLE DC POWER SUPPLY SOLAR ARRAY SIMULATIONMODEL 62000H S SERIESProgrammable DC Power Supply (Solar Array Simulation)The model 62000H-S Series include a graphical userInterface software through remote digital interface (USB / GPIB / Ethernet / RS232) control. The user can easily program the I-V curve of the 62000H-S Series as well as the I-V & P-V curves for real-time testing. In addition it will display the MPPT status for the PV inverter. Readings and the report function with real-time monitoring using the softpanel are shown left.SIMULATES DIFFERENT SOLAR CELL MATERIALS I V CHARACTERISTIC FILL FACTORThe purpose of the PV inverter is to convert the dc voltage (from solar array) to the ac power (utility). The better a PV inverter can adapt to the various irradiation & temperature conditions of sun, the more power that can be fed into the utility grid over time. So, the MPPT performance is a very important factor for PV generation system. The model 62000H-S Series are capable of simulating different types of standard crystalline, multi-crystalline and thin-film fill factor* parameters to verify the MPPT tracking algorithm mechanism and efficiency.*Fill Factor = (Imp*Vmp)/(Isc*Voc)Solar Array Simulation SoftpanelDesign and verify the maximum power tracking circuit and algorithm of the PV inverter.Verify the high/low limit of operating input voltage allowed for the PV inverter.Verify the high/low limit of operating input voltage allowed for the inverter s maximum power point.Verify the static maximum power point tracking efficiency of the PV inverter.Measure and verify the overall efficiency & conversion High-efficiency CrystallineStandard Crystalline ArrayThin-FilmFF=0.80FF=0.68FF=0.55 Verify the maximum power point tracking performance of the inverter for dynamic curves. (EN50530, Sandia, CGC/GF004, NB/T 32004 standard) Verify the maximum power point tracking performance of the inverter under different time period conditions spanning from morning to nightfall. Verify the maximum power point tracking mechanism of the inverter for the I-V curve when the solar array is shaded by clouds or trees.Simulate the I-V curve under the actual environmental temperatures within burn-in room to do inverter burn-in testing. *Requires an extra power meter.DYNAMIC MPPT EFFICIENCY TESTINGThe latest test standards EN50530, CGC/GF004 & Sandia have provided a procedure for testing patterns of the dynamic MPPT efficiency of inverters, those standards can accelerate the MPP tracking algorithm mechanism to the optimal for PV inverter manufactures. The advanced Dynamic MPPT Test functioncomplies with EN50530, CGC/GF004, Sandia test regulations and can be controlled via the graphical softpanel by selecting CGC/GF004 or Sandia or EN50530 I-V mathematical expressions and test items. This function simulates the irradiation intensity and temperature change of the I-V curve under actualweather variations to test the PV inverter's dynamic MPPT performance. The GUI will calculate the MPPT performance for analysis after running the test. A test data recording function is integrated into the software where users can edit and control the test parameters to be recorded such as voltage, current, power, watt and MPPT performance along with the sampling interval (1 - 10,000s) and total time length to facilitate the analysis and validation of the PV inverter.SHADOW I V CURVE SIMULATIONIt has easy-to-use software to simulate the shadowed I-V curve and its dynamic change as the figure shown aside. The user can select the PV Module from the database or create individual PV module parameters for storage; and then set the amount of PV string to form a PV Array in series or parallel. Next, the user can set the irradiation, temperature, moving direction and time of dynamic shadowed change for PV Module that can simulate the cloud cover change or make Shadow I-V curve simulation for other shadow such as under the trees or the buildings. Each I-V curve is formed with maximum 4096 data points of voltage and current.EVALUATING THE PV INVERTER'S CONVERSION EFFICIENCY *The photovoltaic I-V curve model of Sandia Lab and EN50530's built in the softpanel allows the user to input the maximum dc input power (Pmax), I-V Fill Factor, Vmin, Vnom and Vmax desired to test the PV Inverter. Click the maximum power percentage value (5%, 10%, 20%, 25%, 30%, 50%, 75%, 100%) desired directly and , the softpanel will produce the tested solar cell I-V curve automatically. Next, download it to the standalone unit to start simulating the I-V curve for the PV Inverter to test the conversion efficiency. *Required an extra power meter.REAL WORLD WEATHER SIMULATIONThe real world weather simulation function allows the user to import real conditions of irradiation and temperature profiles of a whole day from excel file to Softpanel, in order to simulate the irradiation intensity and temperature level from early morning to nightfall. It can also set the interval time resolution to 1s for I-V curve update rate and enable the user to perform MPPT tracking tests under the simulation of actual weather environments.REPORT FUNCTIONThe softpanel also provides data recording capabilities, which include: voltage, current, power, energy and MPPT efficiency and the corresponding parameter sampling time (1s~10000s) for the recording process. The report can be utilized for R&D design characterization verification, QA verification and production quality control.MASTER / SLAVE PARALLEL OPERATION UP TO 150KW150kW Solar Array SimulatorModel 62150H-600S/1000S600V/1000V/15kWModel A620027/A620028 Slave Unit600V/1000V/15kWand increase energy efficiency, please addinga Schaffner ECOsine TM-Passive Harmonic Filtersdevice between power supply and grid.Model A620029 CSUConnect multiple 150kW solar array simulatorin parallel (0~1000V/0~2500A/0~1500kW)Simultaneous display of output voltage and currentCurrent sharing capability up to 1.5MWORDERING INFORMATION1234567891011121314151617181920Note 1 : GPIB or Ethernet Interface (alternative) , please specified at time of order.Note 2 : Call for more information regarding the customized solar array simulator of 150kW~1.5MW.Model 62020H-150S A620027/A620028Note*1 : Max. Power is 20kW for 62020H-150S.Note*2 : There is parallel mode for DC power supply when the I-V curve function is enabled.All speci cations are subject to change without notice. Please visit our website for the most up to date speci cations.Note * :None APG interface for A620027/A62002862000H-S Series-E-201409-pdfWorldwide Distribution andService NetworkJAPANCHROMA JAPAN CORP .472 Nippa-cho, Kouhoku-ku, Yokohama-shi, Kanagawa,223-0057 JapanTel: +81-45-542-1118Fax: +81-45-542-1080http://www.chroma.co.jp E-mail: info@U.S.A.CHROMA SYSTEMS SOLUTIONS, INC.19772 Pauling, Foothill Ranch, CA 92610Tel: +1-949-600-6400Fax: +1-949-600-6401 E-mail: sales@Developed and Manufactured by :HEADQUARTERS CHROMA ATE INC.66 Hwaya 1st Rd., Kueishan Hwaya Technology Park,Taoyuan County 33383,Taiwan Tel: +886-3-327-9999Fax: +886-3-327-8898 E-mail: info@EUROPECHROMA ATE EUROPE B.V.Morsestraat 32, 6716 AH Ede,The Netherlands Tel: +31-318-648282Fax: +31-318-648288 E-mail: sales@CHINA CHROMA ELECTRONICS (SHENZHEN) CO., LTD.8F, No.4, Nanyou Tian An Industrial Estate, Shenzhen, China PC: 518052Tel: +86-755-2664-4598Fax: +86-755-2641-9620。
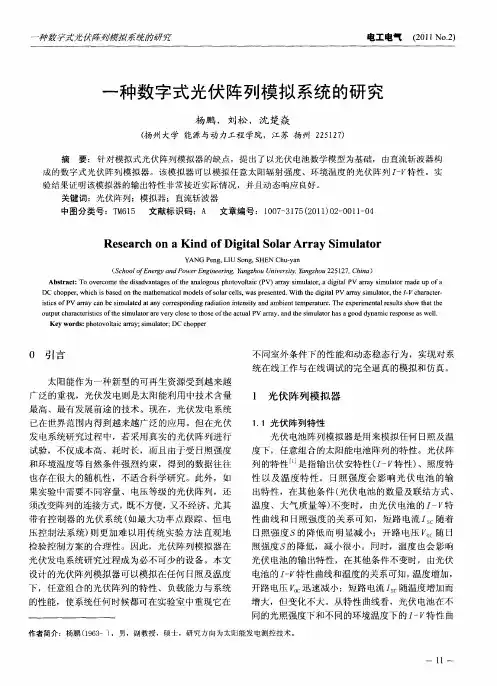
光伏优化器原理光伏优化器原理在光伏发电系统中,光伏优化器是一种能充分利用光伏电池发电效率的关键设备,其原理是通过协调光伏系统中每个光伏模块的电流和电压,以有效提高整个系统的发电效率。
目前市场上已经出现了很多种不同类型的光伏优化器,本文将主要介绍其中的两种常见原理。
第一种原理:最大功率跟踪(MPPT)最大功率跟踪(Maximum Power Point Tracking),简称MPPT,是常见的一种光伏优化器原理。
其主要目的是通过匹配光伏电池的输出电流和电压,以达到光伏电池发电效率最大化的效果。
MPPT工作原理是通过对光伏电池的V-I特性曲线进行监测,以确定当前工作点的位置,并根据当前工作点的电流电压值调整直流电压,以使得光伏电池输出的功率达到最大值。
还可以采用逆变器调节、PWM方式调节、P&O算法以及微软基本运算器等方式实现最大功率追踪。
这种原理的光伏优化器具有功率追踪精准度高、实现简单、成本低等特点。
第二种原理:电流电压极化(IV-Curve Scan)电流电压极化方法(IV-Curve Scan)是一种通过不同电流电压产生的光伏电池特性曲线,确定光伏电池的最大功率点的光伏优化器原理。
该方法通过对光伏模块进行短时干扰,绘制当前模块输出功率与电压和电流之间曲线,以寻找最大功率点,并将直流电压、直流电流和交流电压转化为最符合当前光伏电池输出的功率流。
该原理的优点是可实现智能维护和故障报警,增强系统的可调节性和实现远控等。
总结无论是采用最大功率跟踪还是电流电压极化这两种原理,光伏优化器的作用都是最大化光伏电池的输出功率,从而提高整个光伏发电系统的效率。
此外,光伏优化器具有输出低电压、提高负荷荷电电量、抗风沙、降低热成像等优点。
当然,每个系统都是独特的,因此可以根据不同系统的需求和特点,选择不同的光伏优化器原理,以提高整个光伏发电系统的效率。
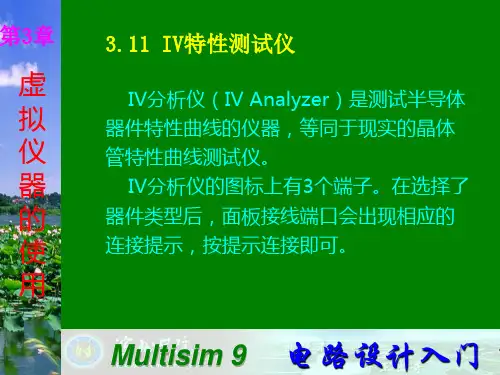
光伏阵列fluent计算
光伏阵列是一种利用太阳能发电的装置,而Fluent是一种计算
流体力学(CFD)软件,用于模拟和分析流体动力学问题。
在光伏阵
列的设计和优化中,可以使用Fluent软件进行流场模拟和热场分析,以评估光伏板的性能和效率。
在进行光伏阵列的Fluent计算时,首先需要建立一个准确的模型,包括光伏板的几何形状、材料属性、周围环境等。
然后,需要
设置模拟的边界条件,例如太阳辐射、空气流动速度、温度等。
接
下来,进行网格划分,确保模型的几何形状得到合适的网格划分,
以保证计算的准确性和效率。
在进行计算时,Fluent可以用来模拟光伏板表面的光照情况、
热量分布以及空气流动对光伏板温度的影响。
这些信息对于评估光
伏板的发电效率和热管理至关重要。
通过Fluent软件的模拟计算,
可以优化光伏阵列的设计,改善光伏板的性能,提高能源转换效率。
此外,Fluent还可以用于分析光伏阵列在不同工况下的性能,
比如在不同季节、不同天气条件下的发电情况。
这有助于优化光伏
阵列的布局和组件配置,以最大化太阳能的利用率。
总的来说,利用Fluent进行光伏阵列的计算可以帮助工程师和设计者更好地理解光伏板的工作原理和性能特性,从而优化光伏阵列的设计和运行,提高太阳能的利用效率。
KDC/IV系列光伏阵列IV模拟器
产品简介
合肥科威尔电源系统有限公司最新推出KDC/IV系列光伏阵列IV模拟器最大输出电压达1500V,单机最大输出功率为15kW,采用移相全桥软开关技术,效率在93%以上。
可以精确的仿真太阳能光伏阵列,确保了I-V模拟器实际输出的精度和动态特性。
KDC/IV系列光伏阵列IV模拟器是测试逆变器MPPT效率的重要工具,产品性价比高,解决了光伏逆变器MPPT跟踪及其效能满载测试的难题。
KDC/IV系列光伏阵列IV模拟器电路原理图如下,三相交流380V输入,输出直流0~1500V可调,输出电流0~35A可调,输出最大功率可达15kW。
直流源主要由输入整流(AC-DC)电路、DC-DC电路以及控制通讯电路等三部分构成。
交流输入通过整流电路得到直流电压,再通过DC-DC电路得到输出可调的直流电压和直流电流,从而得到需要的模拟直流源,通讯接口电路主要是为了上位机与下位机之间的信息交换,以查看和设置直流源的工作状态。
KDC系列高频直流源电路原理图
产品功能特点
●自动宽范围输出电流可达35A电压达到1500V(可以多机并联使用);
●自动编程控制I-V曲线输出(可自动编程任意多条曲线,按时间运行);●模拟不同类型太阳电池阵列I-V曲线(单晶,多晶,薄膜);
●模拟不同温度及光照强度下的I-V曲线;
●模拟光伏阵列局部阴影遮挡I-V曲线;
●模拟缩放全天日照变化下I-V曲线;
●静态和动态下MPPT效能测试;
●内置EN50530及CGC/GF004关于动态MPPT测试要求,一键式调取测试;
●模拟全天累计电能计量;
●输出电流、电压精度高;
●多种标准的输出接口CAN/USB/RS485/ETHERNET;
●转换效率最高可达93%以上;
●LCD大屏幕显示,曲线、编程一目了然,触摸式操作,简单便捷;
●具有资料存贮记录功能;
●友好的人机操作界面,可本机操作也可通过上位机软件操作
●标准3U机箱,方便安装。
KDC/IV-15-1500输出特性曲线
功能概述及界面
●程控直流源功能
可以设置三种工作模式,恒压模式,恒流模式和恒功率模式
;
程控直流源和I-V模拟器选择程控直流源显示界面
●I-V模拟功能
三种设置模式,单点设置:设置最大功率点的电压mp V和最大功率点电流mp I;双点设置:设置开路电压oc V、短路电流sc I;多点设置:设置最大功率点电压mp V、最大功率点电流mp I和填充因子FF。
在每种模式下都可以设置环境参数:光照强度)
/
(2m
W和温度)(C ;另外在单点设置和双点设置模式下可以选择阵列类型:单晶硅、多晶硅和薄膜电池,在多点设置下不需要设置阵列类型。
带载后能实时计算当前MPPT的效率、功率和发
电量。
曲线可以在运行中实时更改参数运用。
如下图:
●电压、电流宽范围可调
●电压设定范围0~1500V,电流设定范围0~35A,功率设定范围0~15kW
●具有输入过欠压、输入过流、输出过压、输出过流、过温等保护功能
●在过欠频、过欠压、防孤岛、低电压穿越、电能质量等测试时提供符合标准的I-V模拟功能的直流供电
●时间缩放功能
将太阳能电池板在一整天或更长时间的运行环境通过I-V模拟器在给定时间下模拟完成。
用户可以在时间缩放功能界面下设置特性模式、阵列类型和不同时间段的光照强度和温度参数,来模拟真实太阳能电池板的运行环境。
将一个时间段的电池板典型的输出变化形式缩短在相对短的时间里输出,缩短研发和测试周期。
设置缩放环境,缩放环境可以设置光照强度和温度及运行时间。
如下图:
●阴影遮挡功能
当太阳能电池板被云层、建筑、树木等遮挡了阳光照射即云层等遮挡时,电池板的输出特性就会改变。
I-V模拟器可以模拟出遮挡不同面积,不强度下的电池板的输出特性。
在阴影遮挡功能界面中,设置阵列类型、环境参数(光照强度和温度),最后设遮挡强度和面积。
●动态MPPT功能
内置EN50530&CGC/GF004标准的动态测试环境,更能详细测试光伏逆变器的功态追踪的性能。
有三种测试环境:“PDCn %50/%10”、“PDCn %100/%30”和“停止启动/%101 ”
产品参数技术表
类别
项目
技术指标
15kW
30KW
交流输入
工作电压范围AC 380V±10%工作频率范围50±5%Hz 接线方式三相三线
直流输出
直流电压输出范围0~1500V 0~1500V 直流电流输出范围
0~35A (35A@≤428VDC)
0~70A (70A@≤428VDC)
IV 曲线
开路电压设定范围
0~1500V
短路电流设定范围0~35A
0-70A
模拟填充因子范围0.5-0.92
光伏板类型选择包括单晶、多晶、非晶等
IV 曲线编辑能够编辑IV 曲线
IV 曲线更新率≤1s 单条曲线包含的点数
≤4000点输出
电压精度
0.05%FS+5dgt
●设计、验证、优化光伏逆变器的MPPT 软件算法●测试、验证光伏逆变器静态及动态跟踪效率●测试逆变器一天辐照度、温度变化下跟踪状态●测试逆变器的在光伏阵列被遮挡下的工作状况
●
在过欠频、过欠压、防孤岛、低电压穿越、电能质量等测试时提供符合标准的I-V 模拟功能的直流供电。