defects in ZnO nanorods prepared by a hydrothermal method
- 格式:pdf
- 大小:557.99 KB
- 文档页数:7

磷酸铁锂的制备及其电化学性能杜炳林;朱华丽;张磊;王成武;陈召勇【摘要】以LiOH·H2O,FeSO4·7HO和H3PO4为原料[n(Li)∶n(Fe)∶n(P)=3∶1∶1],采用水热法合成了LiFePO4(P),其结构经XRD,FE-SEM,HR-TEM和SEAD表征.考察了pH值、反应温度、反应时间和表面活性剂对P的结晶度、颗粒形貌、晶粒大小和择优取向的影响.结果表明:在pH为9.27,0.5%的聚乙烯醇为表面活性剂,于150℃反应8h合成的P表现出规则的片状形貌,衍射峰强I(200)/I(211)为0.492 5;P在垂直b轴方向有一定的择优生长;P在ac面为最大面,b轴方向尺寸最短;采用乙炔黑为导电剂制备的P扣式电池表现出优良的电化学性能,于室温0.1C倍率充放电,放电比容量为108.3 mAh·g-1;葡萄糖包覆改性后的扣式电池,0.1C倍率放电比容量为148mAh·g-1,1C倍率放电时,放电比容量仍保持在133.9 mAh·g-1左右.【期刊名称】《合成化学》【年(卷),期】2014(022)003【总页数】5页(P322-326)【关键词】水热法;制备;LiFePO4;择优生长;包覆改性;充放电性能【作者】杜炳林;朱华丽;张磊;王成武;陈召勇【作者单位】长沙理工大学物理与电子科学学院,湖南长沙410114;长沙理工大学物理与电子科学学院,湖南长沙410114;长沙理工大学电力与交通材料保护湖南省重点实验室,湖南长沙410114;长沙理工大学物理与电子科学学院,湖南长沙410114;长沙理工大学物理与电子科学学院,湖南长沙410114;长沙理工大学物理与电子科学学院,湖南长沙410114【正文语种】中文【中图分类】O614.8;O613.6针对磷酸铁锂(LiFePO4)的电导率和离子扩散率低两大缺陷,研究人员纷纷展开了大量深入的研究。


不同形貌硫化镍纳米材料的可控合成及电化学性能研究郎雷鸣【摘要】该文主要采用简单的溶剂热和水热法通过控制不同条件如硫源和表面活性剂合成了多种形貌的硫化镍纳米材料,在使用L-胱氨酸,硫代乙酰胺作为硫源以及PEG2000作为表面活性剂时,分别获得了规整的硫化镍实心球,海胆状硫化镍空心微球以及由纳米粒子组成的空心球,分别测定了三者的电化学性能,结果表明海胆状硫化镍空心微球的循环性能较好,循环30次以后放电容量保持在200mAhg^-1左右.%Nickel sulfide nanomaterials with different morphologies were synthesized by solvothermal and hydrothermal methods under different reaction conditions, such as different surfactants and sulfur sources. Regular NiS microspheres, urchin-like mierospheres and hollow spheres were obtained by using L-cystine and TAA as sulfur sources and PEG2000 as surfactant respectively. Electrochemical performance of the samples was analyzed as a cathode of lithium-ion batteries. The results indicated that the cyclic performance of urchin-like NiS hollow micro- spheres was better than that of NiS microspheres and hollow spheres. The discharge capacity of 200 mA h g- ^-1 still remained after 30 cycles.【期刊名称】《南京晓庄学院学报》【年(卷),期】2012(000)006【总页数】5页(P60-64)【关键词】硫化镍;可控合成;电化学【作者】郎雷鸣【作者单位】南京晓庄学院生物化工与环境工程学院,江苏南京211171【正文语种】中文【中图分类】O6140 引言低维结构的纳米材料由于具有独特的物理、化学和光电性能一直以来就受到学者们的关注.随着纳米材料的快速发展,已经成功合成出不同形貌的低维结构的纳米材料[1-6],这些材料在催化、药物传输、光学材料和电池材料等领域表现出极大的潜在应用价值[7-9].不同形貌和结构的材料在性能方面有很大的差异,进而表现出不同的实际应用价值,为了合成性能更为优越的纳米材料,实现对形貌和结构的可控合成是材料合成的关键,因此,材料的不同形貌和结构对其性能的影响一直是科研工作者关注的焦点.在众多的材料中,金属硫化物由于具有特殊的光学、磁学以及催化性质而成为研究的热点.硫化镍除了具有在临界温度时,高温相NiS由顺磁性的导体转变为反铁磁性的半导体这种特殊的性质外,它还在太阳能电池、加氢脱硫催化反应,以及光电导材料和锂电池电极材料等方面都有着广泛的应用[10],因而备受关注.目前,多种形貌的NiS纳米材料被相继合成出来,如纳米晶、纳米棒、三角状纳米棱柱、薄膜、空心球以及通过自组装方法获得的由纳米针或纳米片组成的三维花状或海胆状NiS微球[11-16].但以L-胱氨酸为硫源合成很规整的硫化镍纳米材料还未见报导,此外,系统研究各种因素对硫化镍形貌的影响以及对不同形貌硫化镍纳米材料电化学性能的研究都较为少见.本文主要采用简单的溶剂热法以L-胱氨酸为硫源成功合成了形貌规整的NiS微球,并研究了不同硫源、表面活性剂以及配体对硫化镍形貌的影响,以形貌较好的海胆状NiS空心微球,NiS实心微球和由纳米粒子组成的空心球为电极材料,对其进行了锂离子充放电性能测试,海胆状NiS微球显示出了较好的充放电性能和循环性能.1 实验部分1.1 硫化镍纳米材料的制备准确称取氯化镍和硫源各2 mmol,在磁力搅拌下溶于20 ml乙二醇中,待固体全部溶解后,加入2.0 ml乙二胺,搅拌片刻后将澄清透明溶液转移到高压釜中,将高压釜放入烘箱190℃加热反应24小时得尺寸均一的硫化镍纳米材料.自然冷却到室温,取出反应釜,在1000转/分的转速下离心分离产品并用无水乙醇洗涤产品3—4次.真空干燥后备用.在相同的实验方法下使用不同硫源和表面活性剂合成不同形貌的硫化镍微纳米材料.1.2 锂离子电池电极材料的制备和电化学性能测试将活性物质按NiS∶碳黑∶聚四氟乙烯(PTFE)=8∶1∶1(质量比)的比例均匀混合后,涂在宽度为8mm的铜箔表面,在100℃下真空干燥至少8 h,即可得工作电极.采用金属锂作为对电极,1 mol·L-1 LiPF6的碳酸乙烯(EC)、碳酸二甲酯(DMC)和碳酸二乙酯(DEC)的混合溶液(EC∶DMC∶DEC=1∶1∶1)作为电解液,在氩气保护的手套箱(Labconco glovebox)中进行电池组装,构筑锂离子电池进行充放电容量和循环性能测试.电化学性能测试时采用的是两电极体系,在充放电测试系统(Land CT2001)上进行充放电实验和循环性能测试,相应的充放电电流密度为0.2 mA/cm2,电势范围为3.0~0.1 V.图1 硫化镍微球的a-b)SEM图片,c)XRD和d)EDS谱图2 结果与讨论2.1 硫化镍微球SEM、XRD、EDS分析图1是以L-胱氨酸为硫源合成的NiS微球的扫描电镜图片、XRD以及EDS谱图,图1a是大面积的扫描电镜图,图中可以看到制备的NiS都为形貌规整的球形结构,大小均一,图1b是放大的SEM图片,可以清楚地看到NiS微球尺寸非常均一,平均直径为2—3 μm,从图中NiS微球某些破损处可以看到,所制备的产品有形成空心结构的趋势.物质的相结构通过XRD来进行表征.图1c是制备的硫化镍XRD 图,从图中可以看出所制备的产品为纯六方相(α)的 NiS,XRD 图谱中在2θ角为30.4°、34.7°、45.9°、53.7°处分别对应于α 相 NiS 的(100)、(101)、(102)、(110)特征晶面,与标准卡片(JCPDS 75-0613)完全一致.图1d是NiS的EDS谱图,图中显示产物中只含有硫和镍两种元素,两个小的杂峰来源于基底的碳和氧,镍和硫的原子个数比接近于1∶1,与硫化镍化学式中元素个数比相吻合.2.2 不同硫源、表面活性剂对硫化镍形貌的影响为了比较不同硫源对硫化镍纳米材料形貌的影响,我们使用硫代乙酰胺、硫代氨基脲、硫脲、硫代硫酸钠以及硫化钠替代L-胱氨酸,当使用硫代乙酰胺为硫源时,合成的产品全为大小比较均一的由针状纳米棒组成的海胆状球形结构,图2是海胆状NiS微球的扫描电镜图片和XRD谱图,图2a是大面积的扫描电镜图,图中可以看到制备的NiS微球大小非常均一,图2b是放大的SEM照片,可以清楚地看到NiS微球表面是由针状纳米棒组装而成的海胆状结构,平均直径为6 μm左右,将单个微球进行放大,针状纳米棒和空心结构清晰可见,纳米棒的直径为40 nm左右(图2c).图2d是制备的硫化镍XRD图,从图中可以看出硫化镍产物中存在两种相结构,斜方六面体相(β)的NiS和六方相(α)NiS,前者的2θ 角为18.5°、30.4°、32.8°、35.8°、40.6°、48.9°分别对应(110)、(101)、(300)、(021)、(211)、(131)特征晶面,与标准卡片(JCPDS 12-0041)相一致.后者的2θ角为30.4°、34.7°、45.9°、53.7°分别对应于α 相 NiS 的(100)、(101)、(102)、(110)特征晶面,与标准卡片(JCPDS 75-0613)完全一致.这与使用L-胱氨酸为硫源制备产品的XRD图有很大区别,说明硫源的不同对产品的相结构有很大的影响.图2 海胆状硫化镍空心球的a-c)SEM图片以及d)XRD谱图将硫源换为硫脲后,获得很多由较粗的纳米棒组成的花状结构(图3a),但大小不一,有部分其他不规整的形貌出现.当使用硫代氨基脲后,得到的则是杂乱无章、大小不一的粒子以及少量由针状纳米棒组成的海胆状结构(图3b),但都欠规整.使用硫代硫酸钠作为硫源时,得到的硫化镍则为长短不一、粗细不等的短棒(图3c),短棒平均直径在3微米左右,而使用硫化钠合成的产品都为杂乱无章的粒子(图3d),由此可见,硫源对硫化镍纳米材料的形貌有着极其重要影响.图3 使用不同硫源合成的NiS纳米材料的SEM图片:a)硫脲,b)硫代氨基脲,c)硫代硫酸钠,d)硫化钠表面活性剂在材料合成中常用来控制产品的形貌,不同表面活性剂的使用可以获得形貌相差很大的硫化镍产品,在使用L-胱氨酸作为硫源,水作为溶剂,用PVP和PEG2000作为表面活性剂时,得到了如图4两种形貌的硫化镍纳米材料,图4a是使用PVP作为表面活性剂合成产品的TEM图片,从图中可以看出制备的硫化镍为大小比较均一的球形粒子,平均尺寸在50 nm左右,而使用PEG2000合成的产品则为由许多小粒子组成的空心球结构(图4b),空心球球壁很薄,直径为100 nm左右.通过以上实验说明在相同条件下,使用不同的表面活性剂会得到形貌截然不同的产品,因此可以通过控制表面活性剂的种类来控制产品的形貌.2.3 电化学性能测试锂离子电池是20世纪90年代出现的绿色高能环保电池,由于具有突出的优点而有着广泛的应用.目前,锂离子电池的电极材料也发展非常迅猛,有许多不同物质的或新的结构的电极材料被研制出来,但以金属硫化物为电极材料的研究并不多见,而NiS由于其具有较高的理论容量在锂离子电池中也有着潜在的应用价值.图4 a)NiS纳米粒子和b)NiS空心球的TEM图片因此,我们分别以海胆状硫化镍空心微球(图2)、纳米粒子组成的硫化镍空心球(图4b)和硫化镍微球(图1)为工作电极,金属Li作为对电极,构筑了Li离子电池,测试了三者的锂离子充放电性能.图5a为海胆状硫化镍空心微球的循环性能图,图中显示首次放电容量超过900 mA h g-1,高于文献所报道的NiS电极材料的理论放电容量[17],但电池充放电容量衰减较快,循环四次以后容量衰减到350 mA h g-1左右,随着循环次数的增加逐渐趋于稳定,当循环到30次以后放电容量依然能保持在200 mA h g-1左右.而用硫化镍微球作为电极首次放电容量只有不到500 mA h g-1,循环30次以后稳定在150 mA h g-1左右(图5b),低于海胆状硫化镍空心微球,但相对比较稳定,衰减率不高.虽然NiS空心球首次放电容量也达到800 mA h g-1左右,但电池容量衰减也较快,循环30次以后容量只有不到80 mA h g-1(图5c),循环性能要明显差于前两者.性能出现以上差异主要是由于海胆状NiS空心微球具有空心的内腔和分级结构的壳,有较大的界面面积和方便的扩散通道,有利于电化学充放电过程的进行,因而循环性能较好,而NiS空心球球壁由许多小粒子组成,球壁较薄,结构比较疏松,循环过程中结构易遭破坏而导致充放电容量的显著衰减.NiS微球充放电容量不高主要是由于其实心结构阻碍了锂离子的嵌入与释放,但其结构相对比较稳定,所以放电容量衰减较慢.由此可见,材料的形貌对锂离子充放电性能有显著的影响,结构稳定、界面面积大的材料可获得更高的充放电容量和更好的循环性能.3 小结图5 a)海胆状NiS空心微球、b)NiS微球和c)NiS空心球的循环性能图(电流密度为0.2 mA/cm2,电势范围为3.0-0.1 V)本文主要通过简单的溶剂热法和水热法制备了多种形貌的硫化镍纳米材料,通过控制不同的硫源成功合成了海胆状空心微球、大小均一的实心微球以及纳米棒等形貌的硫化镍,使用不同的表面活性剂获得了球形粒子和空心球,实现了硫化镍纳米材料形貌的可控合成.分别对海胆状空心微球等三种形貌硫化镍进行了电化学性能测试,结果表明海胆状硫化镍空心微球首次放电容量和循环性能都要好于实心微球和由纳米粒子组成的空心球,循环30次以后放电容量保持在200 mAhg-1左右,显示了较好的循环性能,但放电容量相对还较低,如何通过改进实验条件获得形貌新颖,结构稳定,性能优越的纳米材料将是本课题进一步努力的方向.参考文献:【相关文献】[1]Zhu G,Xu Z.Controllable Growth of Semiconductor Heterostructures Mediated by Bifunctional Ag2S Nanocrystals as Catalyst or Source-Host[J].J.Am.Chem.Soc.,2011,133(1):148.[2]Hu J,Bando Y,Zhan J,et al.Fabrication of Silica-Shielded Ga-ZnS Metal-Semiconductor Nanowire Heterojunctions[J].Adv.Mater.,2005,17(16):1964.[3]Liu B,Zeng H C.Fabrication of ZnO“Dandelions”via a Modifi ed Kirkendall Process [J].J.Am.Chem.Soc.,2004,126(51):16744.[4]Zhou J,Ding Y,Deng S Z,et al.Three-Dimensional Tungsten Oxide Nanowire Networks[J].Adv.Mater.,2005,17(17):2107.[5]Xu L,Ding Y-S,Chen C-H,et al.3D Flowerlike α-Nickel Hydroxide with Enhanced Electrochemical Activity Synthesized by Microwave-Assisted Hydrothermal Method [J].Chem.Mater.,2008,20(1):308.[6]Cheng Y,Wang Y S,Jia C,et al.J.Phys.Chem.B,MnS Hierarchical Hollow Spheres with Novel Shell Structure[J].2006,110(48):24399.[7]Cao A M,Hu J S,Liang H P,et al.Self-Assembled VanadiumPentoxide(V2O5)Hollow Microspheres from Nanorods and Their Application in Lithium-Ion Batteries[J].Angew.Chem.Int.Ed.,2005,44(28):4391.[8]Hu J,Ren L,Guo Y,et al.Mass Production and High Photocatalytic Activity of ZnS Nanoporous Nanoparticles[J].Angew.Chem.Int.Ed.,2005,44(8):1269.[9]Lou X W,Deng D,Lee J Y,et al.Self-Supported Formation of NeedlelikeCo3O4Nanotubes and Their Application as Lithium-Ion Battery Electrodes[J].Adv.Mater.,2008,20(2):258.[10]Wong E,Sheeleigh C W,Rananvare S B.Proceedings of the Sixth Annual Conference on Fossil Energy Materials[A].Oak Ridge:Tennessee NETL Publications,1992.[11]Zhang B,Ye X,Dai W,Hou W,Xie Y.Biomolecule-Assisted Synthesis and Electrochemical Hydrogen Storage of Porous Spongelike Ni3S2Nanostructures Grown Directly on Nickel Foils[J].Chem.Eur.J.2006,12(8),2337.[12]Ghezelbash A,Sigman M B Jr,Korgel B A.Solventless Synthesis of Nickel Sulfide Nanorods and Triangular Nanoprisms[J].Nano Lett.,2004,4(4):537.[13]Yu S H,Yoshimura M.Fabrication Powders of Thin Films of Various Nickel Sulfides by Soft Solution-Processing Routes[J].Adv.Funct.Mater.,2002,12(4):277.[14]Zhang W Q,Xu L Q,Tang K B,et al.Solvothermal Synthesis of NiS 3D Nanostructures[J].Eur.J.Inorg.Chem.,2005(4):653.[15]Xu F,Xie Y,Zhang X,et al.From polymer-metal complex framework to 3D architectures:growth,characterization and formation mechanism of micrometer-sized α-NiS[J].New J.Chem.,2003,27(9):1331.[16]Wu Z,Pan C,Li T,Yang G,et al.Formation of Uniform Flowerlike Patterns of NiS by Macrocycle Polyamine Assisted Solution-Phase Route [J].Crystal Growth.Des.,2007,7(12):2454.[17]Han S C,Kim K W,Ahn H J,et al.Charge-discharge mechanism of mechanically alloyed NiS used as a cathode in rechargeable lithium batteries[J].J.Alloys Compd.,2003,361(1-2):247.。

Zn基柱状ZnO取向生长机制刘长友;王金芳;孙晓燕;王泽温;介万奇【摘要】通过预氧化处理在Zn基底上制备了ZnO颗粒膜,并由N2H4.H2O-水热体系制备了Zn基柱状ZnO阵列。
实验发现,在Zn单一晶体学取向表面上柱状ZnO高度有序排列,据此提出了Zn基柱状ZnO的自由生长取向机制。
水热反应条件下,ZnO微晶通常具有沿c轴优先生长的结晶习性,柱状体高度有序排列取决于ZnO晶核的状态。
单一晶体学取向表面上晶核的状态一致,决定了ZnO柱状体取向一致。
Zn基柱状ZnO阵列光致发光谱分析表明,在30~60 K之间,近带边激子发射峰强度呈现反常温度依赖的"负热淬灭"现象,该过程包含了两个无辐射过程和一个负热淬灭过程。
【期刊名称】《无机材料学报》【年(卷),期】2013(028)003【总页数】6页(P301-306)【关键词】氧化锌;锌基底;取向生长机理;光致发光【作者】刘长友;王金芳;孙晓燕;王泽温;介万奇【作者单位】【正文语种】中文【中图分类】O611ZnO纳米阵列制备及其功能应用是当前微纳米研究领域的热点之一。
Zn基柱状ZnO阵列是以Zn片兼作基底和源,不仅能解决导电性问题,还能节省成本,且制备工艺简单,已为人们所关注。
Zn基柱状ZnO阵列的制备方法主要有水热法[1-11]、电化学沉积法[12-14]、热氧化法[15-16]、微波与放电氧化法[17-18]以及软化学法[19-23]等。
其中,水热法具有能耗低、原料廉价、易于控制和绿色环保等优点,倍受人们青睐。
目前,所谓的Zn基ZnO“阵列”,其柱状体在基底上排列并不规则,分布也不均匀。
分析表明,在ZnO柱状体和基底之间存在一个薄膜层,它为ZnO柱状体的生长提供晶核和支撑。
柱状体分布取决于Zn基片上ZnO形核的分布,而ZnO 柱状体的排列不仅与晶核有关,还与ZnO微晶的生长习性有关。
通常情况下,ZnO 沿晶格的c轴方向生长最快,往往呈棒状形态。
因此,ZnO在Zn基片上的成核就成了影响Zn基ZnO阵列形貌特征的主要因素,文献[5]和[19]在这方面作了有益的尝试。
三种纳米结构三氧化钨的气敏性研究王新刚;郭一凡;田阳;刘丽丽;张怀龙【摘要】Utilizing ammonium metatungstate [(NH4)6W12O40] as raw material, we produced three kinds of nanostructured WO3 under the same reaction conditions by controlling the concentration of citric acid (C6H8O7). The nanostructured WO3 was characterized by XRD, SEM and TEM. Then, three kinds of gas sensors including WO 3 nanorod gas sensors, WO3 nanoplate gas sensors and WO3 nanoplate/nanorods mixing gas sensors were further manufactured. The sensitivity was measured for three kinds of nanostructured WO 3 gas sensors under the condition of acetone, ammonia and formaldehyde gas respectively. Experimental results show that the sensitivities of the three kinds of nanostructured WO3 firstly increase and then decrease with the increase of temperature at gas concentration of 1 000 ×10-6. In contrast, the sensitivity of WO3 nanoplate gas sensors is the highest among the three kinds of nanostructured WO3 for the three kinds of gases in the range of measuring temperature. The opt imum operating temperature of WO3 nanoplate gas sensor is 350 ℃, 300 ℃, 325 ℃, 250 ℃ and its maximum sensitivity is 25.4, 18.52, 30.29, 18.31 in acetone, ammonia and formaldehyde gas, respectively. The sensitivity of the three kinds of nanostructured WO3 firstly increases and then decreases with the increase of temperature in the acetone gas of 50 × 10-6 and the formaldehyde gas of 100×10-6, respectively. The sensitivityof WO3 nanoplate is obviously higher than that of other twonanostructured WO3. At the optimum operating temperature, the acetone and formaldehyde gas with lower concentration can be detected by using nanoplate WO 3 gas sensor.%试验以偏钨酸铵为钨源,采用水热法在相同的反应条件下,通过控制柠檬酸的加入量,合成了三种纳米结构的三氧化钨,并采用XRD、SEM和TEM对合成的WO3粉末进行分析。
Fabrication of nanowires of Al-doped ZnO using nanoparticle assisted pulsed laser deposition (NAPLD)for deviceapplicationsS.Thanka Rajan a ,B.Subramanian a ,⇑,A.K.Nanda Kumar a ,M.Jayachandran a ,M.S.Ramachandra Rao ba ECMS Division,CSIR –Central Electrochemical Research Institute,Karaikudi 630006,India bDepartment of Physics,Indian Institute of Technology Madras,Chennai 600036,Indiaa r t i c l e i n f o Article history:Received 24June 2013Received in revised form 30August 2013Accepted 7September 2013Available online 26September 2013Keywords:NAPLD Thin films Al doped ZnO Nanowiresa b s t r a c tAluminium doped zinc oxide (AZO)nanostructures have been successfully synthesized on sapphire sub-strates by using nanoparticle assisted pulsed laser deposition (NAPLD)in Ar atmosphere without using any catalyst.The growth of the AZO nanowires has been investigated by varying the argon flow rates.The coatings have been characterized by X-ray diffraction (XRD),Field emission scanning electron microscopy (FESEM),Atomic force microscopy (AFM),Diffuse Reflectance Spectroscopy (DRS),Laser Raman spectroscopy and Photoluminescence spectroscopy.The results of XRD indicate that the deposited films are crystalline ZnO with hexagonal wurtzite structure with (002)preferred orientation.FESEM images also clearly reveal the hexagonal structure and the formation of nanowires with aspect ratios between 15and 20.The surface roughness value of 9.19nm was observed from AFM analysis.The optical properties of the sample showed that under excitation with k =325nm,an emission band was observed in UV and visible region.The characteristic Raman peaks were detected at 328,380,420,430cm À1.Ó2013Elsevier B.V.All rights reserved.1.IntroductionZinc oxide (ZnO)is one of the most important metal oxide semi-conductors.This material has good electrical and optical properties and it is chemically stable.It has a wide direct band gap of 3.37eV with a large binding energy of 60meV [1].Undoped ZnO thin films generally exhibit n-type conductivity due to intrinsic donors,such as oxygen vacancies and Zn interstitials [2].It has an open struc-ture,with a hexagonal close-packed lattice where Zn atoms occupy half of the tetrahedral sites,while all the octahedral sites are empty [3].This crystal structure offers plenty of sites to accommodate intrinsic defect and extrinsic dopants.The wurtzite structure of ZnO can be described as a series of alternating planes of tetrahe-drally coordinated O 2Àand Zn 2+ions stacked along the c -axis;this characteristic polarity of the surfaces gives rise to different nano-structures (nanorods,nanowires,nanobelts,nanotubes)under proper growth conditions [4].Such nanostructures show different and superior properties over their bulk counterparts due to their small size and large surface to volume ratio [5].Impurity-doped ZnO films also show stable electrical and optical properties.Aluminium doping in zinc oxide (AZO)is a promising material due to its high conductivity and good optical properties [6].The choice of Al as donor dopant for ZnO over higher valence ions is lar-gely owing to its ease of incorporation in the ZnO structure;more-over it decreases the resistivity of the host ZnO without impairing the optical transmission in thin film form [7].Both ZnO:Al and Al 2O 3are transparent to visible light,making them interesting can-didates for optical applications.Nowadays,pure ZnO or AZO are being actively investigated as alternative materials to indium tin oxide (ITO)because it is nontoxic,inexpensive and have long term environmental stability [8–10].Several deposition techniques have been routinely used to grow AZO nanostructures.The most common methods are magnetron sputtering [11,12],pulsed laser deposition (PLD)[13],chemical va-por deposition [14],and chemical spray [15].PLD is an attractive method,compared to magnetron sputtering and reactive RF sput-tering techniques,for deposition of ZnO thin films with high struc-tural homogeneity and crystalline quality [16].Compared with other techniques PLD has many advantages such as (i)the compo-sition of the films are close to that of the target,(ii)surface of the film is smooth and (iii)good quality film can be deposited [17].Nanoparticle assisted pulsed laser deposition (NAPLD)is a rela-tively new modification of the PLD technique in which nanowires can be grown at high temperatures and high pressures without using any catalyst.This technique also gives films with almost the same composition as that of the target.This advantage scores highly when compared to the other modified deposition tech-niques [18].In NAPLD the nanoparticles that are formed in the background gas by laser ablation are used for the subsequent growth of the nanowires [18].The initial nanoparticles formed in the laser ablation plume by the condensation are transported onto the substrate and act as starting materials for nano-crystal growth [19].In this work,we report the successful synthesis of AZO nano0925-8388/$-see front matter Ó2013Elsevier B.V.All rights reserved./10.1016/j.jallcom.2013.09.046Corresponding author.Tel.:+914565241538;fax:+914565227713.E-mail address:subramanianb3@ (B.Subramanian).wires on sapphire substrates by NAPLD at different argonflow rates without any catalyst.The structural and optical properties of the nanowires are also discussed in this paper.2.ExperimentalThe depositions of Aluminium doped ZnOfilms were carried out in the NAPLD system.The target preparation procedure is shown in Fig.1.The AZO target was prepared by mixing98mol%ZnO and2mol%Al2O3(99.99%pure,Sigma Aldrich). The sapphire substrate was cleaned byfirst boiling it in trichloroethylene and then ultrasonically cleaned in acetone for3min followed by milli pore water.AZO thin films were deposited on sapphire substrates using frequency triplet,Q switched Nd:YAG laser.Fig.2shows a schematic diagram of the NAPLD system.The target was loaded into the target holder and the substrate was stuck on the substrate holder using silver paste.The target and substrate holder are placed inside a fur-nace,so the whole atmosphere with target and substrate are heated.When the tem-perature reached1000°C,the laser was switched on for ablating the target and Ar gas was let in.The AZOfilms were deposited on sapphire substrate for different ar-gonflow rates(200,300,400and500sccm)for30min.The optimized deposition parameters and conditions are described in the Table1.Thefilms were characterized by Bruker D8Advance to study the phases and for grain size measurement.The surface morphology of the preparedfilms was studied using Quanta3D FESEM.Atomic force microscopy for topographic studies was done by Agliant technologies(model5500).PL spectral analyses were performed using Cary Eclipse(Varian)and Raman spectroscopy for micro-structural analysis was done by Renishaw in via laser Raman microscope.Hall Effect measurements(Eco-pia,HMS3000)were made on the AZOfilms at a constant magneticfield of 1.02T.Diffuse reflectance spectra of thefilms were recorded using Ocean Optics (USB2000)spectrophotometer.BaSO4powder compact was used as a standard ref-erence.The diffuse reflectance(R)was measured as a function of wavelength rang-ing from300to700nm.3.Results and discussion3.1.Structural and compositional analysisThe XRD patterns of the AZO thinfilm for different Argonflow rates(200–500sccm)on sapphire substrates are shown in Fig.3. It was observed that the wurtzite structure of the ZnO is unaffected by the doping of2mol%Aluminium.The diffraction patterns were equivalent,since the Al doping did not show any significant shifts shift is because of the decrease of the lattice constants a and c with increasing argonflow rate.At lowflow rates of the inert gas,the growth mechanism is lateral growth over the substrate surface with uniform coverage.Therefore,a strain can be induced in the lattice of the AZO owing to the strained interface.At higherflow rates,the mechanism varies to condensation in the vapor phase leading to perfect needle type nano wire,which are under signifi-cantly lower stress,with lattice parameters approaching that of an ideal single crystal,although not exactly,owing to the incorpora-tion of Al into the Zn sublattice.Therefore,due to the preferential growth along the[0001]direction,a strain can be induced in the lattice of the AZO by the strained substrate/film interface.This might have led to a change in lattice constants.High texture in (002)will determine the quality of the nano wire.At400sccm flow rate,the(004)line at72°is detected and intensity of the (002)also increased,indicating that the quality of thefilm was im-proved when the argonflow rate was increased.This shows that the crystallinity of the AZO thinfilms increased withflow rate. AZOfilms become polycrystalline,which means thefilm is com-posed of many grains with crystallographic orientations(100), (002),(101),(110),and(004)as indicated in Fig.3.The grain size(D)for various argonflow rates was calculated from the standard Scherer’s formula,expressed asD¼0:94kb cos hð1Þwhere k is the wavelength of Cu K a X-radiation(1.5406Å),b is the Full width at half maximum(FWHM)value for a particular orienta-tion calculated from the XRD pattern and h is the Braggs’angle.The calculated grain size for different argonflow rates(200–500sccm) for(002)peak were77.8,60,86.8and181.5nm respectively. The general trend seems to be that the crystallinity of thefilm also increases with the argonflow rate.Fig.4a–e compares the surface morphology of the ZnOfilms grown under different Arflow rates observed by FE-SEM.Films deposited at200sccm the lowflow rate regime–show a rather dense formation of ZnO grains growing laterally on the substrate surface with uniform coverage(Fig.4a).There is no evidence of the formation of thin ZnO wires.The wire-type morphology ap-pears only with increasingflow rates.Fig.4b shows the morphol-ogy offilm coated at300sccm.Some agglomeration is observed along with clusters randomly dispersed on the substrate.Interest-ingly,appearance of a thin needle-like structure is also seen.Fig.4c shows a SEM image of thefilm deposited at400sccm of Ar.While a number of vertically growing nano rods can be discerned in the microstructure,observation of the crystals along a direction nor-mal to{0001}shows afiner structure of the nano rods that consist of a layered arrangement of ZnO crystals,but neatly stacked along the c axis,suggestive of growth by oriented attachment mecha-nism[20].Such a layered growth produces corrugated10 10side walled nano rods as the layered structure is partially fused be-tween the stacks,probably by diffusional sintering.Clearly,this seems to be a preliminary step towards the perfect needle type nano structures observed at500sccm,shown in Fig.4d and e. Thefilm at500sccm,is homogeneous and comprises of nanowires and nanorods of diameters ranging from150to250nm and the lengths from3to10l m grown along the c-axis,clearly showing the hexagonal lattice of ZnO with wurtzite structure.They appear well aligned in a vertical plane of the substrate and have perfect hexagonal shape.Based on these observations,it is evident that the inert gas(Ar)flow rate plays a crucial role in con-trolling the morphology of the ZnOfilms.At lowflow rates,the partial pressure of Ar in the vapor is too low to produce any con-densation within the vapor and hence,uniform coverage of the substrate is seen.With increasingflow rate of the Ar gas,the ener-getic Zn and O species from the ablated target rapidly lose theirFig.1.Flow chart of target preparation.612S.Thanka Rajan et al./Journal of Alloys and Compounds584(2014)611–616energy by colliding with the colder Ar atoms and nucleate into nano particles within the vapor phase which subsequently act as seeds for the nanocrystalline growth.This mechanism is akin to the inert gas condensation technique and explains the formation of perfectly grown ZnO wire under optimized Ar flow rateconditions.The gradual change from uniformly grown films with lateral spread to vertical nano rods by varying the inert gas flow rate also introduces a slight straining of the lattice which is also reflected in changes in lattice parameter observed by XRD.The nano rods deposited at 500sccm have a low defect density and hence an unstrained lattice,whereas those deposited at 300sccm have a considerable strain due to bonding with the substrate.AFM studies were carried out to investigate the effect of Al dop-ing concentration on surface roughness of the films.Fig.5shows that the surface of the film is covered with grains of diameter about 50nm.The root mean square (rms)surface roughness of the film was measured to be 9.19nm.The elemental composition analyses were carried out on Al doped ZnO nanowires using Energy dispersive X-ray (EDX)analysis and is shown in Fig.6.The presence of Zn,Al and O was observed in the AZO samples.No impurity phases were detected on the surface of the film.The different Hall parameters such as Hall mobility (cm 2V À1s À1),resistivity (X cm)and carrier concentration (cm À3)have been measured for the films deposited at 500sccm.From the previous observation it is optimized that 500sccm shows high X-ray diffraction intensity and the SEM images also reveal that 500sccm is an apt parameter for our studies.Analysis of the equi-librium defect concentration in Al doped ZnO reveals that for each Al 3+that substitutes for one Zn 2+,a free electron is released into the crystal to enhance its conductivity,according to the relation (in Kröger–Vink notation):Al 2O 3ðZnO Þ 2Al Zn þ2O o þ2e 0þ12O 2ð2ÞIn this case,the Al dopant concentration has been fixed at 2mol%,and we assume that the O 2partial pressure does not vary significantly with the Ar flow rate.The electronic charge conduc-tion should control the net resistivity of the film at low frequen-cies.The carrier concentration of the AZO film determined by Hall effect measurement is 8.07Â1019.Hall mobility and resistiv-ity were measured as 25.28cm 2V À1s À1and 1.028Â10À2X cm,which agrees clearly with the values reported by Pin-Chuan Yao et al.[21].3.2.Optical propertiesRaman scattering is an effective technique to investigate the crystallization,structure and defects chemistry of ser Raman spectra of the nanostructured AZO films are shown in Fig.7.Wurtzite structure belongs to the space group C 46v with two formulae units per primitive cell,where all atoms occupy C 3v sites.Twelve vibrational modes exist in the ZnO unit cell;one longitudinal acoustic (LA),two transverse acoustic (TA),threeFig.2.Schematic set up of nanoparticle assisted pulsed laser deposition.Table 1Deposition parameters and conditions.SpecificationParameters LaserNd:YAG (355nm)Repetition rate 10Hz 4ns140mJ/pulse 2–4J cm À2Sintered AZO Sapphire 1000°C Argon $2mbar200–500sccmXRD pattern of AZO films grown on sapphire substrate at different flowlongitudinal-optical(LO),and six transverse optical(TO).A1and E1 symmetries are polar and split into LO and TO components with different frequencies[22].The Raman peaks near328,380,420,430and465cmÀ1can be attributed to the wurtzite crystal structure of AZO.The dominant peak at430cmÀ1indicates the Wurtzite structure of ZnO and is attributed to the high E2mode of non polar optical phonons.E2 high mode is for ZnO hexagonal structure with vibrations of O sub-lattice.The FWHM of the E2line is about8cmÀ1which is another indication of the high quality of the NAPLD synthesized nanocrys-talline ZnOfilms.The peak at380,420and465cmÀ1corresponds to A1(TO),E1(TO)and A1(LO)respectively.The peak A1measured at328cmÀ1is related to multiple phonon scattering process.A slight shift was also observed which was due to the doping of AlFig.4.FESEM images for AZOfilm at(a)200sccm,(b)300sccm,(c)400sccm,(d and e)500sccm.Fig.5.A representative AFM image of AZOfilm.Fig.6.Energy dispersive X-ray analysis of AZO nanowires on sapphire substrate.without introduction of any additional stress within the samples shown in XRD.Diffuse reflectance spectral studies in the UV–visible region were carried out to estimate the optical band gap of the nanostruc-turedfilm.The optical diffuse reflection spectra of AZO samples differentflow rates(200–500sccm)on sapphire substrate are dis-played in Fig.8.The energy band gap E g can be determined from onset of the linear increase in the diffuse reflectance.From2wefind that the band gap of the AZOfilm lies in the range 3.40–3.44eV using Einstein’s energy relation:1:24kðl mÞwhere E is the band gap and k is the wavelength.The band gap increases with increasing Arflow rate.The in-crease in E g may be due to the increase of electron concentration. Generally,the values for band gap of AZOfilms are slightly higher. The conduction electrons in the ZnOfilms are supplied from donor sites associated with oxygen vacancies or excess metal ions[23] The band gap of ZnO is in the near UV region which is3.37 The AZO reflection starts at about380nm and the samples exhib-ited absorption peaks in the visible region at about660nm in both spectra.The photo luminescent emission spectrum of AZOfilms for the various argonflow rates are shown in Fig.9.The PL peaks for all the samples are almost same in position but different in intensity.They show near-band edge emission around373nm which is the UV re-gion;this emission is due to ZnO.The visible emission was ob-served at around405nm,468nm and533nm due to defect emission.The blue peak at468nm comes from the electron transi-tion from Zn interstitial level to the top of the valance band.The green emission observed at533nm resulted from intrinsic defects. Deep level emissions are associated with intrinsic defects such as oxygen vacancies or zinc interstitials[24].From Table3wefind that the calculated band gaps are approx-imately equal to the band gap of ZnO.So the ZnO phase is con-firmed with the band gap in the UV absorption region.However, the UV emission intensity increases and the deep level emission intensity decreases as argonflow rate increases from200to 500sccm suggesting that the crystals grown at higherflow rates have lower defect densities in their lattice.This observation is in agreement with the XRD results suggesting that defect densities decrease with increasing Arflow rates,along with the correspond-ing change in the lattice parameter.ser Raman spectra of AZOfilms on sapphire substrates.Fig.8.DRS patterns of AZOfilms on sapphire substrates.Fig.9.PL emission spectra of AZOfilms on sapphire substrates.Table3Band gap values of AZOfilm on sapphire substrate determined from the PL spectrum.Rgonflow(sccm)Wavelength(nm)Band gap(eV)200364.2 3.32300365.9 3.32400364.9 3.31500355.7 3.334.ConclusionWe have used a relatively new technique,nanoparticle assisted pulsed laser deposition(NAPLD),to grow AZO nanostructures. Deposition of AZO on sapphire using NAPLD was done at high tem-perature and high pressure,without using any catalyst.XRD and EDAX characterization shows that AZO belongs to the most stable wurtzite type with the presence of Zn,Al and O on the surface of thefilm.SEM analysis reveals the formation of nanowires.Band gap of these nanostructures increases from3.37to3.41.Surface topology was studied by AFM imaging of the surfaces of AZOfilms deposited at high temperature and the RMS roughness was deter-mined.XRD and Raman measurements showed that Al ions were incorporated into the ZnO lattice.Photo luminescent emission spectrum of AZOfilms show near-band edge emission around 373nm in the UV region corresponds to ZnO.Increase in the inert gasflow rate seems to reduce defect densities and corresponding with a decrease in the defect level emission intensities in the PL spectra.AcknowledgementsOne of the authors(S.T)thanks Dr.E.Senthil Kumar and F.Bel-larmine for their help in doing the NAPLD process.References[1]S.Tewari,A.Bhattacharjee Pramana,J.Phys.76(1)(2011)153–163.[2]Kyong-Kook Kim,Hitoshi Tampo,June-O Song,Tae-Teon Seong,Seong-Ju Park,Ji-Myon Lee,Sang-Woo Kim,Shizuo Fujita,Shigeru Niki,Jpn.J.Appl.Phys.44 (7A)(2005)4776–4779.[3]Chundong Li,Jinpeng Lv,Bo Zhou,Zhiqiang Liang,Phys.Status Solidi A209(8)(2012)1538–1542.[4]Rodrigo Noriega,Jonathan Rivnay,Ludwig Goris,Daniel Kälblein,Hagen Klauk,Klaus Kern,Linda M.Thompson,Aaron C.Palke,Jonathan F.Stebbins,Jacob R.Jokisaari,Greg Kusinski,Alberto Salleo,in:J.Appl.Phys.107(2010)074312-1–074312-7.[5]M.Mozibur Rahman,M.K.R.Khan,M.Rafiqul Islam,M.A.Halim,M.Shahjahan,M.A.Hakim,Dilip Kumar Saha,Jasim Uddin Khan,J.Mater.Sci.Technol.28(4) (2012)329–335.[6]S.M.Park,G.H.Gu,C.G.Park,Phys.Status Solidi A208(2011)2688–2691.[7]H.Kim,J.S.Horwitz,S.B.Qadri,D.B.Chrisey,Thin Solid Films420–421(2002)107–111.[8]Sang moo Park,Tomoaki Ikegami,Kenji Ebihara,Jpn.J.Appl.Phys.45(2006)8453–8456.[9]S.Suzuki,T.Miyata,M.Ishii,T.Minami,Thin Solid Films434(2003)14–19.[10]B.Szyszka,Thin Solid Films351(1999)164–169.[11]Z.Le,W.Gao,Mater.Lett.58(2004)1363–1370.[12]Z.G.Yu,P.Wu,H.Gong,Appl.Phys.Lett.88(2006)132114–132116.[13]F.K.Shan,B.C.Shin,S.C.Kim,Y.S.Yu,J.Korean Phys.Soc.42(2003)S1374–S1377.[14]Y.Natsume,H.Sakata,T.Hirayama,H.Yanagada,J.Appl.Phys.72(1992)4203–4207.[15]H.Mondragon Suarez, A.Maldonaldo,M.de la,L.Olvera, A.Reyes,R.Castanedo-Perez,G.Torres-Delgado,R.Asomoza,Appl.Surf.Sci.193(2002) 52–59.[16]V.Cracium,J.Elders,J.G.E Gardeniers,I.W.Boyd,Appl.Phys.Lett.65(1994)2963–2965.[17]A.V.Singh,Manoj Kumar,R.M.Mehra,Akihiro Wakahara,Andakira Yoshida,J.Indian Inst.Sci.81(2001)527–533.[18]Y.N.Xia,P.D.Yang,Y.G.Sun,Y.Y.Wu,B.Mayers,B.Gates,Y.D.Yin,F.Kim,Y.Q.Yan,Adv.Mater.15(2003)353–389.[19]Tatsuo Okado,Ruqian Guo,Jun Nishimura,Masato Matsumoto,MitsuhiroHigashihata,Daisuke Nakamura,Thin Solid Films447–448(2004)33–39.[20]Shilei Xie TengZhai,Yexiang Tong,mun.14(2012)1850–1855.[21]Pin Chuan Yao,Shih Tse Hang,Yu Shuan Lin,Wen Tsai Yen,Yi Cheng Lin,Appl.Surf.Sci.257(2010)1441–1448.[22]A.Singh,A.Kumar,N.Suri,S.Kumar,M.Kumar,P.K.Khanna,D.Kumar,J.Optoelectron.Adv.Mater.11(6)(2009)790–793.[23]M.Suchea,S.Christoulakis,N.Katsarakis,T.Kitsopoulos,G.Kiriakidis,ThinSolid Films515(2007)6562–6566.[24]K.J.Chen,T.H.Fang,F.Y.Hung,L.W.Ji,S.J.Chang,S.J.Young,Y.J.Hsiao,Appl.Surf.Sci.254(2008)5791–5795.616S.Thanka Rajan et al./Journal of Alloys and Compounds584(2014)611–616。
Studies in Synthetic Chemistry 合成化学研究, 2018, 6(2), 23-28Published Online June in Hans. /journal/sschttps:///10.12677/ssc.2018.62004Synthesis of SiO2 Nanorodes by One-StepHydrothermal ProcessShuhong Sun, Yin He, Yongmao Hu, Yan Zhu*Kunming University of Science and Technology, Kunming YunnanReceived: Mar. 20th, 2018; accepted: May 2nd, 2018; published: May 10th, 2018AbstractSiO2 nanorodes were successfully synthesized by a simple low-cost one-step alkaline hydrother-mal process using commercial silicate glass at 170˚C. The SEM results show that ammonia concen-tration and holding time play an important role in the formation of SiO2nanorods. XRD results confirmed that the synthesized SiO2nanorods were amorphous. Photoluminescence results showed that the synthesized nanorodes exhibited a strong, sharp photoluminescence emission peak, centered at 410 nm.KeywordsSiO2 Nanorode, Hydrothermal Process, Silicate Glass一步水热法合成SiO2纳米棒孙淑红,贺胤,胡永茂,朱艳*昆明理工大学,云南昆明收稿日期:2018年3月20日;录用日期:2018年5月2日;发布日期:2018年5月10日摘要以商业硅酸盐玻璃为原材料,在170˚C下,通过简单的低成本一步水热法成功制备了SiO2纳米棒。

Home Search Collections Journals About Contact us My IOPscienceThe synthesis and selective gas sensing characteristics of SnO2/α-Fe2O3 hierarchical nanostructuresThis article has been downloaded from IOPscience. Please scroll down to see the full text article.2008 Nanotechnology 19 205603(/0957-4484/19/20/205603)View the table of contents for this issue, or go to the journal homepage for moreDownload details:IP Address: 202.113.13.10The article was downloaded on 09/09/2012 at 03:11Please note that terms and conditions apply.IOP P UBLISHING N ANOTECHNOLOGY Nanotechnology19(2008)205603(5pp)doi:10.1088/0957-4484/19/20/205603The synthesis and selective gas sensing characteristics of SnO2/α-Fe2O3 hierarchical nanostructuresYujin Chen1,2,4,Chunling Zhu3,Xiaoling Shi2,Maosheng Cao2andHaibo Jin21College of Science,Harbin Engineering University,Harbin15001,People’s Republic ofChina2School of Materials Science and Engineering,Beijing Institute of Technology,Beijing100081,People’s Republic of China3College of Materials Science and Chemical Engineering,Harbin Engineering University,Harbin150001,People’s Republic of ChinaE-mail:chenyujin@Received28January2008,infinal form10March2008Published14April2008Online at /Nano/19/205603AbstractSnO2/α-Fe2O3hierarchical nanostructures,in which the SnO2nanorods grow on the sidesurface ofα-Fe2O3nanorods as multiple rows,were synthesized via a three-step process.Thediameters and lengths of the SnO2nanorods are6–15nm and about120nm.The growthdirection of SnO2nanorods is[001],significantly affected by that ofα-Fe2O3nanorods.Thehetero-nanostructures exhibit very good selectivity to ethanol.The sensing characteristics arerelated to the special heterojunction structures,confirmed by high-resolution transmissionelectron microscopy observation.Therefore,a heterojunction barrier controlled gas sensingmechanism is realized.Our results demonstrate that the hetero-nanostructures are promisingmaterials for fabricating sensors and other complex devices.1.IntroductionHierarchical hetero-nanostructures are expected to have novel or multifunctional properties and have applications in the fabrication of complex nanodevices.In recent years, great progress has been made in the synthesis of such nanocomposites[1–7].Hierarchical ZnO nanostructures were synthesized by a vapor transport and condensation technique. In the nanocomposites,the secondary ZnO nanorods grew either as a single row or multiple rows on the side surfaces of the core In2O3nanowires[1].Xie et al reported the epitaxial growth of T-ZnO/SnO2hetero-nanostructures and found that the new luminescence properties were induced by the epitaxial interfaces[2].Recently,Fen and his co-workers grew carbon nanotubes,ZnO nanowires and silicon nanowires on carbon cloth[3–5].These nanocomposites exhibited enhancedfield emission properties and are expected to befield emitters with practical applications in highly efficient lamps,field emission displays,and micro vacuum electron sources.4Author to whom any correspondence should be addressed.As two important kinds of fundamental material, SnO2[8–18]andα-Fe2O3[20–26]have attracted a lot of attention due to their applications as chemical catalysts and devices such as sensors[16–18],UV detectors and transistors[19],etc.In this paper,we report a three-step route to grow SnO2nanorod arrays on the side surfaces of porousα-Fe2O3nanorods.The gas sensing properties and sensing mechanism of the SnO2/α-Fe2O3hierarchical hetero-nanostructures are investigated.2.Experimental detailsSnO2/α-Fe2O3hierarchical hetero-nanostructures were synthe-sized via a three-step process.First,β-FeOOH nanorods were synthesized by a hydrothermal route.In a typical procedure, 40ml of0.5M FeCl3solution was transferred into a50ml Teflon-lined autoclave.The autoclave was heated to120◦C, and kept for12h.After cooling to room temperature,the resulting precipitates were washed several times with water and absolute ethanol,and then dried at80◦C for6h.AfterFigure1.(a)SEM image ofβ-FeOOH nanorods.(b)SEM image of α-Fe2O3nanorods.(c)XRD pattern of the products.Pattern1:β-FeOOH,pattern2:α-Fe2O3nanorods,pattern3:SnO2/α-Fe2O3 hierarchical hetero-nanostructures.(d)SEM image ofα-Fe2O3 nanorods.calcinations of the obtainedβ-FeOOH nanorods at500◦C for 2.5h,α-Fe2O3nanorods with porous structures were obtained. The SnO2/α-Fe2O3hierarchical hetero-nanostructures werefi-nally prepared usingα-Fe2O3nanorods and SnCl4as starting materials through a hydrothermal method as follows.0.015g α-Fe2O3nanorods were dispersed into a mixed solution con-sisting of heptane(10.2ml),hexanol(3.0ml),sodium dodecylsulfate(SDS,1.44g),Sn(OH)2−6(2.0ml;the volume ratio of0.5M SnCl4and5M NaOH solutions is1:3).After ultra-sonication for5min,the mixture was transferred into a25mlTeflon-lined autoclave and heated to220◦C for6h.After cool-ing to room temperature,the obtained precipitates were washedseveral times with absolute ethanol and distilled water.The fabrication process of the sensors based on the hetero-nanostructures has been described elsewhere[16,17,27–30].The sensitivity(S)in this paper is defined as S= R a/R g[16,17],where R a is the sensor resistance in air,and R g is the resistance in target–air mixed gas.During the measuredprocess the ambient relative humidity(RH)is about30%. 3.Results and discussion3.1.Morphology study of hetero-nanostructuresβ-FeOOH nanorods can be obtained at temperatures in the range from90to120◦C.Samples prepared at different synthesis temperatures have slightly different morphologies. Figure1(a)is a typical scanning electron microscopy(SEM) image of the as-synthesizedβ-FeOOH nanorods that were synthesized at120◦C.It indicates that the diameters and the lengths of the nanorods are50–180nm and∼2μm, respectively.Pattern1infigure1(c)shows corresponding x-ray diffraction(XRD)pattern from the pared with the data in JCPDS card(No.75-1594),all the diffraction peaks in the pattern can be indexed toβ-FeOOH.After calcinations at500◦C for2.5h,β-FeOOH nanorodswere Figure2.(a)Low-resolution TEM image of SnO2/α-Fe2O3 hierarchical hetero-nanostructures.Scale bar:100nm.(b)High-resolution TEM image of an individual SnO2nanorod grown onα-Fe2O3nanorods.Scale bar:5nm.(c)High-resolution TEM image of the interface of SnO2/α-Fe2O3hierarchicalhetero-nanostructures.transformed intoα-Fe2O3nanorods,proved by XRD pattern 2infigure1(c)(JCPDS No.33-0664).They remained in the original morphologies(figure1(b)).Pattern3is the measured XRD pattern of thefinal products.The asterisks indicate the peaks coming fromα-Fe2O3(JCPDS No.33-0664),while the others come from SnO2(JCPDS No.41-1445).The results indicate that thefinal products were composites ofα-Fe2O3and SnO2.Figure1(d)shows a typical SEM image of thefinal products.It can be clearly observed that thefinal products exhibit hierarchical heterostructures,in which the second nanorod arrays grow on the side surface of theα-Fe2O3 nanorods as multiple rows.According to the XRD results,the secondary phase in the structures is SnO2nanorods.The morphology and size of the hierarchical hetero-nanostructures were further characterized by transmission electron microscopy(TEM).Figure2(a)displays a typical TEM image of the heterostructures.It is found that the average diameters and lengths of the SnO2nanorods are6–15nm and about120nm,respectively.It is clear that the SnO2nanorods are parallel to each other at the same side surface of anα-Fe2O3nanorod,and the angle between the SnO2andα-Fe2O3 nanorods is about122◦or58◦.3.2.Crystallographic study of hetero-nanostructuresIn order to clarify how SnO2nanorods grow onα-Fe2O3 nanorods,high-resolution TEM(HRTEM)observations of hi-erarchical hetero-nanostructures were conducted.Figure2(b) shows the HRTEM image of an individual SnO2nanorod.The two adjacent spacings are0.246and0.237nm,correspond-ing to(101)and(200)planes of SnO2,respectively.This in-dicates the single-crystal nature of the nanorods with prefer-ential growth along the[001]direction.The result is differ-ent from the previous report by Zhang et al that[101]is thepreferential growth direction for SnO 2nanorods grown on α-Fe 2O 3nanotubes [11].This may be related to the growth direc-tion of α-Fe 2O 3nanorods because the growth of heterostruc-tures requires low lattice mismatch between different materi-als [2,11].Figure 2(c)is an HRTEM image of the interface of hetero-nanostructures.It is obvious that the SnO 2nanorods still grow along the [001]direction at the interface.For α-Fe 2O 3nanorods,the two almost identical spacings of 0.252nmare consistent with the d values of the (2¯10)and (110)planes,indicating that the α-Fe 2O 3nanorods grow preferentially along the [110]direction.Therefore,the interfacial orientation relationships between the SnO 2and α-Fe 2O 3nanorods are(101)SnO 2/(110)α-Fe 2O 3and (200)SnO 2/(2¯10)α-Fe 2O 3.The lat-tice mismatch is lower for such interfacial orientation relation-ships [11],thereby resulting in SnO 2nanorods with growth along the [001]rather than [101]direction.The result demon-strates that the growth direction of the second phase can be affected by the first phase in a heterogeneous system.This may be an effective route to synthesize heterostructures with controlled crystalline and physical characteristics because dif-ferent growth directions may lead to different physical proper-ties.For example,SnO 2nanoribbons with exposed (10¯1)and (010)surfaces have highly sensing characteristics to NO 2even at room temperature [31].The experimentally measured angle between the (101)and (200)planes of SnO 2is about 56.2◦,while it is about60◦between the (2¯10)and (110)planes of α-Fe 2O 3,as shown in figure 2(c).Both values are consistent with the theoretically calculated values,suggesting that the misfit angle between those planes is about 3.8◦.According to the HRTEMobservation (figure 2(c)),however,the (2¯10)α-Fe 2O 3plane is not completely parallel to the (200)SnO 2plane:the acute angle between them is about 2◦.Therefore,the misfit angle between the (110)α-Fe 2O 3plane and the (101)SnO 2plane is about 1.8◦.The results reveal that SnO 2nanorods grown on α-Fe 2O 3nanorods should be parallel to each other at the same side surface and the angle between SnO 2nanorods and α-Fe 2O 3nanorod should be 122◦or 58◦,which is consistent with the low-resolution TEM observation (figure 2(a)).In addition,lattice distortion induced by lattice mismatch is also observed,as indicated by the white frame in figure 2(c).The phenomenon is also observed by Zheng et al in the ZnO/SnO 2system [2].It should be noted that the synthesized conditions have an important effect on the formation of SnO 2/α-Fe 2O 3hierarchical hetero-nanostructures.When the volume ratio of SnCl 4and NaOH was changed to 1:1or 1:2,the hierarchical hetero-nanostructures mentioned above were difficult to obtain.In those cases,only SnO 2nanoparticles or short rods grew on the side surfaces of α-Fe 2O 3nanorods.The same results were also observed when the solvents were changed into a mixture of ethanol and water,or without the addition of SDS.Therefore,the volume ratio of SnCl 4and NaOH,the solvents and SDS are important factors for the growth of SnO 2/α-Fe 2O 3hierarchical hetero-nanostructures.3.3.Gas sensitivity of hetero-nanostructuresIt is well known that SnO 2and α-Fe 2O 3are important sensing materials.However,gas sensors for practicalapplicationsFigure 3.The sensitivities of SnO 2/α-Fe 2O 3hetero-nanostructures to ethanol at different working temperatures:curve 1,at 350◦C;curve 2,at 250◦C.The inset shows the sensitivities of SnO 2/α-Fe 2O 3hetero-nanostructures to H 2,CH 4and C 4H 10gases at a working temperature of 350◦C.require not only high sensitivities,but also very good selectivity to target molecules.The hierarchical hetero-nanostructures prepared in this work exhibited very good selectivity as well as high sensitivity to ethanol.Figure 3shows the sensitivities of the hetero-nanostructures to ethanol with various concentrations at different working temperature.At a working temperature of 350◦C,the sensitivity is 4.6–10ppm,as shown in curve 1,while the sensitivities are less than 2.3–1000ppm of H 2,CH 4and C 4H 10as shown in the inset of figure 3.As the working temperature was reduced to 250◦C,the hetero-nanostructures still kept high sensitivity.The sensitivity is up to 2.9–10ppm of ethanol,as shown in curve 2;however,the hetero-nanostructures have no response to the three other gases.The results demonstrate that the hetero-nanostructures are promising materials for fabricating gas sensors with good sensing characteristics.For a pure metal oxide semiconductor,the sensing mecha-nism is usually explained by the space–charge model [16,17].In this model,the sensitivity of the materials is strongly de-pendent on the change of the space–charge length under differ-ent gas atmospheres,resulting in higher sensitivity of the sens-ing materials with smaller size [16,17].However,the elec-tron transport mechanism of the nanocomposites synthesized in this work should be significantly different from that of the pure SnO 2or α-Fe 2O 3nanorods due to the formation of many semiconductor heterojunctions at their interfaces,observed by HRTEM,as shown in figure 2(c).Electron transport is thus expected to be strongly tuned by the heterojunction (HJ)bar-rier,which has been widely investigated for many HJ devices such as lasers,photodiodes and HJ bipolar transistors.It is well known that the band gaps of SnO 2and α-Fe 2O 3at room temperature are about 3.6eV and about 2.1eV [12,32,33].Thus the energy band structure of the SnO 2/α-Fe 2O 3HJ can be schematically depicted in figure 4,where φeff denotes the effective barrier height,considering the contribution of other factors such as temperature to the barrier height [34].There-fore,it requires that the transport of electrons should overcome the heterojunction barriers [34].At the high temperature re-gion,the electron motility μis expressed by [34]μ=μ0exp (−q φeff /k B T ),(1)Figure4.A schematic diagram of the energy band structure of the SnO2/α-Fe2O3hetero-nanostructures:(a)in air,(b)in ethanol. where q is the charge of an electron,k B is Boltzmann’s constant,and T is the absolute temperature.According to equation(1),the conductivity G of the heterostructures under different gas atmospheres can be given by[34]G=G0exp(−φeff/k B T).(2) In this equation,G0can be considered as a constant parameter.φeff will increase in air because electrons are trapped both in SnO2andα-Fe2O3induced by adsorbed oxygen species,as shown infigure4(a).In this case,the conductivity of the HJ is very low.When the heterostructures are exposed to ethanol,the reaction between the adsorbed oxygen species and the ethanol molecules leads to the release of the trapped electrons back simultaneously into the conduction bands of the SnO2and Fe2O3rods,resulting in a decrease in the width and height of the barrier potential at their interfaces,as shown infigure4(b).In the case,the conductivity of the HJ will consequently be greatly increased,resulting in high sensitivity of the SnO2/α-Fe2O3HJs to ethanol. Therefore,the barrier with adjustable height controls the transport of electrons in the heterostructures,and accordingly controls the sensing characteristics of the nanocomposites.As for the good selectivity of the hetero-nanostructures,it may be related to the following factors.First,for pure SnO2 sensors the sensitivity to H2exhibited significantly different characteristics,depending on the fabrication techniques of both the sensing materials and the sensors.For example, W¨o llenstein et al fabricated a micromachined micro-hotplate sensor array based on ZnO,WO3and V2O5,in which the sensitivity of SnO2to100ppm H2is less than3.0at a working temperature of400◦C[35].Salehi et al reported that SnO2 sensingfilms had a sensitivity to1000ppm H2less than4.0 at200◦C[36].But the sensitivity of sensors based on SnO2 thickfilms with porous structures were above400–800ppm H2at350◦C[37].The sensitivity was as high as1000–800ppm H2at350◦C after SnO2nanoparticles were calcined at600◦C[38].This phenomenon may result from the size and crystalline phase of SnO2sensing materials and the sensor configurations.Therefore,the sensors based on the hetero-nanostructures presumably exhibited low sensitivity to H2. Second,the sensing properties of composites are significantly different from those of the single-component counterparts. For instance,CeO/SnO2and SnO2/CuO composites had excellent selectivity to H2S[39,40].SnO2/ZnO[41]and SnO2/α-Fe2O3[42,43]composites exhibited greatly improved sensitivity to ethanol vapor compared to H2,CH4and CO molecules.The reason for this is that the sensing mechanism of the composites is different from that of the single-component counterparts[43,44].It has been reported that when the test gas has a complex molecular structure or a reactive functional group such as ethanol,the surface reactions could differ depending on the acid–base properties.The base properties are more helpful to the surface reactions between C2H5OH and surface O species.In this work,the hetero-nanostructures are composed of SnO2andα-Fe2O3nanorods.They are basic oxides,and thereby the basicity of the hetero-nanostructures will increase.Due to the fact mentioned above,the SnO2/α-Fe2O3hetero-nanostructures exhibited higher sensitivity to ethanol than to H2,CH4and C4H10gases.In addition,water vapor cross-sensitivity is important for gas sensors based on metal oxides.Thus the response of the sensors was also measured at the RH of∼30%and∼54%, respectively.Negligible resistance changes of the sensors with the present configuration at these humidities were observed. Therefore,the sensors based on the hetero-nanostructures can be used to detect ethanol vapor.4.ConclusionsIn summary,we synthesized SnO2/α-Fe2O3hierarchical hetero-nanostructures by a three-step process.The SnO2 nanorods with average diameters in the range6–15nm and lengths of120nm grow on the side surface of theα-Fe2O3 nanorods as multiple rows,resulting in the formation of hierarchical structures.It is observed that the preferential growth direction of SnO2nanorods is[001],significantly affected by the growth direction ofα-Fe2O3nanorods.This may offer an effective route to synthesize heterostructures with controlled crystalline and physical characteristics.The hetero-nanostructures exhibit high sensitivity and very good selectivity to ethanol.Heterojunction barrier controlled gas sensing characteristics were realized in SnO2/α-Fe2O3 hierarchical nanostructures.Our results demonstrate that SnO2/α-Fe2O3hetero-nanostructures are very promising for fabricating sensors as well as other complex devices. AcknowledgmentsThe authors acknowledge the support from the National Natural Science Foundation of China(50772025),the PhD Programs Foundation of the Ministry of Education of China(20070217002),China Postdoctoral Science Foundation (20060400042),and also the Innovation Foundation of Harbin City(RC2006QN017016).References[1]Lao J Y,Wen J G and Ren Z2002Nano Lett.21287[2]Kuang Q,Jiang Z Y,Xie Z X,Lin S C,Lin Z W,Xie S Y,Huang R B and Zheng L S2003J.Am.Chem.Soc.12511306[3]Banerjee D,Jo S H and Ren Z F2004Adv.Mater.162028[4]Jo S H,Wang D Z,Huang Z Y,Li W Z,Kempa K andRen Z F2004Appl.Phys.Lett.85801[5]Zeng B Q,Xiong G Y,Chen S,Wang W Z,Wang P Z andRen Z F2007Appl.Phys.Lett.90033112[6]Zhang D F,Sun L D,Jia C J,Yan Z G,You L P andYan C H2005J.Am.Chem.Soc.12713492[7]Wan Q,Wei M,Zhi D,MacManus-Driscoll J L andBlamire M G2006Adv.Mater.18234[8]Wu N L,Wang S Y and Rusakova I A1999Science2851375[9]Comini E,Faglia G,Sberveglieri G,Pan Z and Wang Z L2002Appl.Phys.Lett.811869[10]Law M,Kind H,Messer G,Kim F and Yang P D2002Angew.Chem.Int.Edn412405[11]Zhang D F,Sun L D,Yin J L and Yan C H2003Adv.Mater.151022[12]Dai Z R,Pan Z W and Wang Z L2003Adv.Funct.Mater.139[13]Chen Y J,Li Q H,Liang Y X,Wang T H,Zhao Q andYu D P2004Appl.Phys.Lett.855682[14]Cheng B,Russell J M,Shi W S,Zhang L andSamulski E T2004J.Am.Chem.Soc.1265972[15]Chowdhuri A,Gupta V,Sreenivas K,Kumar R,Mozumdar S and Patanjali P K2004Appl.Phys.Lett.841180[16]Chen Y J,Xue X Y,Wang Y G and Wang T H2005Appl.Phys.Lett.87233503[17]Chen Y J,Xue X Y,Wang Y G and Wang T H2006Appl.Phys.Lett.88083105[18]Kuang Q,Lao C S,Wang Z L,Xie Z X and Zheng L S2007J.Am.Chem.Soc.1296070[19]Dattoli E N,Wan Q,Guo W,Chen Y B,Pan X and Lu W2007Nano Lett.72463[20]Rockenberger J,Scher E C and Alivisatos A P1999J.Am.Chem.Soc.1211595[21]Park J,An K,Hwang Y,Park J G,Noh H J,Kim J Y,Park J H,Hwang N M and Hyeon T2004Nat.Mater.3891[22]Wang D S,He J B,Rosenzweig N and Rosenzweig Z2004Nano Lett.4409[23]Jia C J,Sun L D,Yan Z G,You L P,Luo F,Han X D,Pang Y C,Zhang Z and Yan C H2005Angew.Chem.Int.Edn444328[24]Xiong G,Joly A G,Holtom G P,Wang C M,McCready D E,Beck K M and Hess W P2006J.Phys.Chem.B11016937 [25]Wu J J,Lee Y L,Chiang H H and Wong D K P2006J.Phys.Chem.B11018108[26]Li L,Chu Y,Liu Y and Dong L H2007J.Phys.Chem.C1112123[27]Liang Y X,Chen Y J and Wang T H2004Appl.Phys.Lett.85666[28]Chen Y J,Zhu C L and Wang T H2006Nanotechnology173012[29]Chen Y J,Zhu C L and Xiao G2006Nanotechnology174537[30]Chen Y J,Zhu C L and Xiao G2008Sensors Actuators B129639[31]Maiti A,Rodriguez J A,Law M,Kung P,McKinney J R andYang P2003Nano Lett.31025[32]Preisinger M,Krispin M,Rudolf T,Horn S andStrongin D R2005Phys.Rev.B71165409[33]Gratzel M2001Nature414338[34]Weis T,Lipperheide R,Wille U and Brehme S2002J.Appl.Phys.921411[35]W¨o llenstein J,Plaza J A,Can´e C,Min Y,B¨o ttner H andTuller H L2003Sensors Actuators B93350[36]Salehi A and Gholizade M2003Sensors Actuators B89173[37]Sakai G,Baik N S,Miura N and Yamazoe N2001SensorsActuators B77116[38]Baik N S,Sakai G,Miura N and Yamazoe N2000SensorsActuators B6374[39]Fang G J,Liu Z L,Liu C Q and Yao K L2000SensorsActuators B6646[40]Chowdhuri A,Gupta V,Sreenivas K,Kumar R,Mozumdar S and Patanjali P K2004Appl.Phys.Lett.841180[41]de Lacy Costello B P J,Ewen R J,Guernion N andRatcliffe N M2002Sensors Actuators B87207[42]Gopal Reddy C V,Cao W,Tan O K and Zhu W2002SensorsActuators B81170[43]Tan O K,Cao W,Zhu W,Chai J W and Pan J S2003SensorsActuators B93396[44]Yamazoe N and Miura N1992Chemical Sensor Technologyvol4,ed S Yamauchi(Amsterdam:Elsevier)pp39–40。
ZnS 量子点的制备及光催化性能研究魏茂彬;王佳琳;曹健;杨景海【摘要】采用水热法制备了ZnS量子点纳米材料,利用X射线衍射仪( XRD)和透射电子显微镜( TEM)对所制备的样品进行了结构和形貌表征.同时以环境中存在的抗生素污染物环丙沙星( CIP)为降解对象,研究了ZnS量子点的光催化性能.经研究表明,成功制备了ZnS量子点材料,且ZnS量子点材料在紫外光照射下能够明显的降解环境中存在的抗生素环丙沙星( CIP)污染物,降解效率达到80%,表现出良好的光催化性能,但其在可见光下照射下的光催化性能明显降低,降解效率仅有45.75%.%In this paper , ZnO quantum dot nanomaterials were prepared by hydrothermal method and the structure and morphology of the prepared samples were characterized by XRD and transmission electron microscopy ( TEM ) .At the meantime , it is studied photocatalytic properties of ZnS quantum dots using antibiotic contaminants ciprofloxacin ( CIP) in the environment as the object of degradation .The study showed that ZnS quantum dot successfully prepared revealed good photocatalytic properties under UV irradiation ,it can effectively degraded the antibiotic contaminants ciprofloxacin ( CIP ) in the environment , but its catalytic activity under visible light was not high and its removal efficiency was only 45.75%.【期刊名称】《吉林师范大学学报(自然科学版)》【年(卷),期】2016(037)002【总页数】4页(P30-33)【关键词】ZnS量子点;水热法;光催化性能;抗生素【作者】魏茂彬;王佳琳;曹健;杨景海【作者单位】吉林师范大学物理学院,吉林四平136000;吉林师范大学物理学院,吉林四平136000;吉林师范大学物理学院,吉林四平136000;吉林师范大学物理学院,吉林四平136000【正文语种】中文【中图分类】O643.3随着经济的快速发展,人类资源污染日趋加剧,对污染物的降解处理现已经是迫在眉睫了,是人类现今亟待解决的问题之一[1-2].抗生素污染物是一类难降解和含生物毒性物质多的有机污染物,环境的恶化严重威胁着人们的健康[3-4].纳米ZnS是一种优异的光催化半导体材料[5-7],因为纳米ZnS在一定条件下受激发能够产生大量的光子-空穴对,同时当ZnS粒子的粒径相当于其激子的玻尔半径时,材料将呈现出明显的量子尺寸效应,这一效应能够使其能级改变、能隙变宽,从而大大增强其氧化还原能力.因此,ZnS的制备及性能研究引起了广大科研工作者们的关注[8-13].本文采用水热法成功制备了ZnS量子点纳米材料,并以环境中存在的抗生素污染物环丙沙星(CIP)为降解对象,深入研究了ZnS量子点的光催化性能.利用水热法制备纤锌矿结构的ZnS纳米颗粒,按物质量比1∶2准确称量适量的醋酸锌和硫脲.然后,按照1∶1比例将水和乙二胺充分混合制成混合溶液,再将醋酸锌溶于此混合溶液中.将溶有醋酸锌的混合溶液在常温下搅拌1 h,使其充分溶合.再将硫脲加入到上述混合溶液中,将其用磁力搅拌器搅拌2 h.搅拌后,将所得的溶液放入反应釜中190 ℃条件下进行烧结12 h.取出反应釜中的产物,反复2次用去离子水对其进行超声清洗和离心干燥;最后,将清洗后的样品放置在真空干燥箱中在70 ℃下干燥至恒重,即得到粉末物质.晶体结构通过D/max-2500型X射线粉末衍射仪(XRD)和日本电子JEM-2100HR 型高分辨透射电子显微镜进行表征.材料性能利用Thermo Nicolet 360型红外光谱仪和日本岛津UV2450型紫外-可见漫反射谱(UV-Vis DRS)进行表征.图1(A)为水热法合成的ZnS样品的XRD谱图,从图中可知,在2θ角为28°,48°,56°处出现3个较强的衍射峰,这与ZnS的JCP-DS标准卡片(JCPDS No.36-1450)的(111),(220),(311)特征衍射峰的峰位置一一对应,并无其他杂峰出现,表明所制备的样品为纯度较高的纤锌矿结构ZnS纳米材料.由图1(B)样品的TEM图可知,样品的颗粒平均大小为5~6 nm,样品结晶良好,样品的晶格面间距为0.31 nm,说明所制备的样品为纤锌矿结构的ZnS量子点.图2为利用水热法制备纤锌矿结构ZnS量子点的UV-Vis光谱图.由图可知,ZnS 样品在300 nm区域有一个较强的紫外吸收,通过计算可知ZnS量子点的带隙宽度为3.82 eV[14].从图中可以看出,紫外吸收光谱具有明显的蓝移现象,这是因为本实验所制备的ZnS材料的颗粒大小接近于ZnS的玻尔半径(2.4 nm)[15]产生了量子尺寸效应所致.图3为水热法制备纤锌矿结构ZnS纳米颗粒的红外光谱图.由图中可知,3 500 cm-1和1 260 cm-1处出现了较强的振动峰,此吸收峰为ZnS样品中吸附水的—OH基团O—H键的振动峰,这说明ZnS量子点表面的Zn2+与—OH发生了较强的键合作用.1 610 cm-1处的吸收峰为醋酸锌中非对称和伸缩振动的特征吸收峰;1 400 cm-1处的吸收峰对应于醋酸锌中对称C—O伸缩振动的特征吸收峰;617 cm-1处的吸收峰应为ZnS的特征吸收峰.为了研究ZnS量子点材料光催化降解抗生素类污染物的性能,本实验接下来以环丙沙星(CIP)为降解对象,分别在只有紫外光作用、无ZnS光催化剂的情况下(如图4中曲线a)、无紫外光作用只有ZnS光催化剂的情况下(如图4中曲线b)和ZnS光催化剂在紫外光作用下(如图4中曲线c)对ZnS量子点材料的光催化性能进行了研究(如图4).由图中数据可知,数据a表明紫外光照射对CIP溶液没有降解作用,在照射40 min后吸光度值有所增加,这因为CIP自身发生了聚合作用所导致,因此CIP在紫外光照射下比较稳定,不容易被降解.从数据b可以看出CIP没有明显得到降解,并且变化较缓慢,降解率只有22.4%,这是由ZnS光催化剂自身对CIP溶液物理的吸附作用引起的.从数据c可以看出ZnS光催对CIP溶液具有明显的降解作用,40 min时其降解率就达到了62.7%,当照射时间为60 min时其降解率可达到80.3%.所以,本实验所制备的ZnS量子点材料在紫外光激发下对CIP具有良好的光催化降解能力.本实验也考察了可见光下ZnS量子点材料光催化降解染物环丙沙星(CIP)的性能.由图5可知,光照60 min后,ZnS光催化剂在可见光照射下对CIP的降解率为45.75%,可见此种条件下ZnS的催化活性较紫外光条件下大大降低了,如果再去除ZnS自身的物理吸附作用和可见光中少量的紫外光激发ZnS产生的光催化活性对CIP的降解,直接证明可见光下ZnS的催化活性较低.从图6中可以看出,插图a为未被紫外光光照过的CIP原溶液,从谱图中可看出只有在3.0 min处出现了一个单峰并且峰值很大,峰面积为550.2.将其溶液进行不同时间的光照,然后进行色谱分析,结果表明,随着光照时间的增加,3.0 min 处吸收峰的峰值明显减弱,峰面积大大减小,到紫外光光照60 min后,峰面积降低到36.4.在1.5 min和6.5 min处出现了新的峰,其峰值随着光照时间的增加出现不规则变化.因此,由CIP色谱峰的峰面积的变化可知,光照60 min后,ZnS光催化剂对CIP的降解率可以达到85%以上.这表明紫外光照射作用下光催化剂ZnS可以光催化降解CIP,达到去除环境中CIP污染物的目的.利用水热法成功制备了ZnS量子点纳米材料,并以环境中存在的抗生素污染物环丙沙星(CIP)为降解对象,研究了ZnS量子点的光催化性能.经研究表明,ZnS量子点材料在紫外光照射下具有良好的光催化性能,紫外光照射60 min时其降解率可达到80%,能够有效的降解环境中存在的抗生素环丙沙星(CIP)污染物.【相关文献】[1]ANGELAKIS A N,MAREKOS M H F,Bontoux L,et al.The status of wastewater reuse practice in the mediterrean basin-need for guidelines[J].Water Res,1999,33(10):2201-2217.[2]GALINDO C,JACQUES P,KALT A.Photooxidation of the phenylazonaphthol AO20 onTiO2:kinetic and mechanistic investigations[J].Chemosphere,2001,45(6-7):997-1005.[3]LINDBERG R H,WENNBERG P,JOHANSSON M I,et al.Screening of human antibiotic substances and determination of weekly mass flows in five sewage treatment plants in Sweden[J].Environ Sci Technol,2005,39(10):3421-3429.[4]陈杖榴,杨桂香,孙永学.兽药残留的毒性与生态毒理研究进展[J].华南农业大学学报,2001,22(1):88-91.[5]YIN H B,YUJI W D,TAKAYUKI K,SHOZO Y.Photoreductive dehalogenation of halogenated benzene derivatives using ZnS or CdS nanocrystallites asphotocatalysts[J].Environ Sci Technol,2001,35(1):227-231.[6]CHEN L F,SHANG Y Z,XU J,et al.Synthesis of ZnS nanospheres in microemulsion containing cationic gemini surfactant[J].J Disper Sci Technol,2005,27(6):839-842.[7]程丽娅,陈云,吴庆生.单分散ZnS纳米球与纳米梭之间的形貌转换及光学性能研究[J].化学学报,2007,65 (17):1851-1854.[8]LIU J Y,GUO Z,JIA Y,et al.Triethylenetetramine (TETA)-assisted synthesis,dynamic growth mechanism,and photoluminescence properties of radial single-crystalline ZnS nanowire bundles[J].J Cryst Growth,2009,311(5):1423-1429.[9]葛明,吴伟,徐斌,等.ZnS纳米球的水热合成剂光催化性能[J].南开大学学报,2008,41(6):33-38.[10]NIASARI M S,ESTARKI M R L,DAVAR F.Controllable synthesis of wurtzite ZnS nanorods through simple hydrothermal method in the presence of thioglycolic acid[J].J Alloys Compd,2009,475(1-2):782-788.[11]WANG H,CHEN Z,CHENG Q.Solvothermal synthesis and optical properties of single-crystal ZnS nanorods[J].J Alloys Compd,2009,478(1-2):872-875.[12]MOORE D F,ZHONG Y D,WANG L.Crystal orientation-ordered ZnS nanowirebundles[J].J Am Chem Soc,2004,126(44):14372-14373.[13]BISWAS S,GHOSHAL T,KAR S.et al.Cerium chloride methanol adductcrystals,CeCl3(CH3OH)4:preparation,crystallography,and scintillation properties[J].Cryst Growth Des,2008,8(7):2070-2072.[14]WANG L P,HONG G Y.A new preparation of zinc sulfide nanoparticles by solid-state method at low temperature[J].Mater Res Bull,2000,35(5):695-701.[15]YAO W T,YU S H,PAN L.Flexible wurtzite-type ZnS nanobelts with quantum-size effects:a diethylenetriamine-assisted solvothermal approach source[J].Small,2005,1(3):320-325.。

Mn离子掺杂对α-FeOOH结构和形貌的影响任利荣;燕来;王毅;王洪;杨勇;李永旺【摘要】本文采用水热合成方法,在120℃碱性条件下制备出形貌均一的短棒状α-FeOOH纳米粒子,对其进行了金属离子Mn的掺杂.系统研究了Mn离子掺杂对产物物相结构和形貌的影响,对产物进行了X射线衍射(XRD)、红外光谱(1R)、穆斯堡尔谱(MES)、场发射扫描电镜(FE-SEM)和高分辨透射电子显微镜(HRTEM)表征.结果表明:低浓度Mn离子掺杂对α-FeOOH的形成起了形貌和物相调控作用.α-FeOOH纳米棒的长径比随着Mn离子加入量的增大逐渐增加;当nMn(Ⅱ)/nFe(Ⅲ)=0.30时,产物变成了α-(Fe,Mn)OOH和MnFe2O4的混合物,形貌为纳米棒和纳米颗粒.%Goethite (α-FeOOH) nanorods with uniform sizes were successfully prepared by hydrothermal method in alkaline solutions at 120℃. The effects of Mn-dopant on the phase structure and morphology were investigated systematically using X-ray diffraction (XRD), m(o)ssbauer spectroscopy (MES), fourier transform infrared spectroscopy (FTTR), field-emision scanning electron microscopy (FE-SEM), and high-resolution transmission electron microscope (HRTEM). It was found that the concentration of Mn2+ ion plays an important role in modulating the morphology and phase structure of a-FeOOH. The aspect ratio of nanorods increases with Mn ion concentration increasing. When the atomic ratio of Mn ion and Fe ion (nMn(Ⅱ)/npo(Ⅲ)) is 0.30, the α-(Fe,Mn) OOH and MnFeAi mixture was formed with the morphology of irregular nanorods and nanoparticles.【期刊名称】《无机化学学报》【年(卷),期】2012(028)006【总页数】6页(P1111-1116)【关键词】Mn掺杂;α-FeOOH;水热合成;纳米棒【作者】任利荣;燕来;王毅;王洪;杨勇;李永旺【作者单位】中国科学院山西煤炭化学研究所煤转化重点实验室,太原030001;中国科学院研究生院,北京100049;煤炭间接液化国家工程实验室,太原030001;中科合成油技术有限公司,太原030001;煤炭间接液化国家工程实验室,太原030001;中科合成油技术有限公司,太原030001;煤炭间接液化国家工程实验室,太原030001;中科合成油技术有限公司,太原030001;煤炭间接液化国家工程实验室,太原030001;中国科学院山西煤炭化学研究所煤转化重点实验室,太原030001;中科合成油技术有限公司,太原030001;煤炭间接液化国家工程实验室,太原030001;中国科学院山西煤炭化学研究所煤转化重点实验室,太原030001;中科合成油技术有限公司,太原030001;煤炭间接液化国家工程实验室,太原030001【正文语种】中文【中图分类】O614.81铁氧化合物主要包含铁的氢氧化合物和氧化物,其在催化领域、磁性材料、传感器、颜料、环境污染治理等方面有广泛的用途[1-5]。
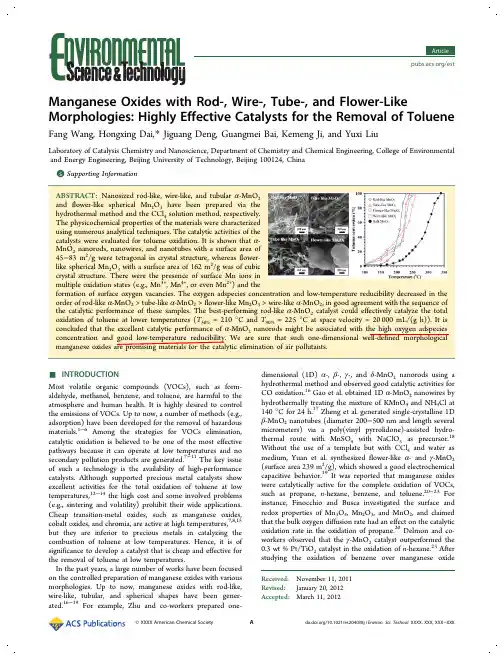
Manganese Oxides with Rod-,Wire-,Tube-,and Flower-LikeMorphologies:Highly Effective Catalysts for the Removal of TolueneFang Wang,Hongxing Dai,*Jiguang Deng,Guangmei Bai,Kemeng Ji,and Yuxi LiuLaboratory of Catalysis Chemistry and Nanoscience,Department of Chemistry and Chemical Engineering,College of Environmental and Energy Engineering,Beijing University of Technology,Beijing 100124,China*Supporting Informationconcentration and low-temperature reducibility decreased in the wire-like α-MnO 2,in good agreement with the sequence of rod-like α-MnO 2catalyst could effectively catalyze the total 90%=225°C at space velocity =20000mL/(g h)).It is nanorods might be associated with the high oxygen adspecies sure that such one-dimensional well-defined morphological elimination of air pollutants.INTRODUCTIONMost volatile organic compounds (VOCs),such as form-aldehyde,methanol,benzene,and toluene,are harmful to the atmosphere and human health.It is highly desired to control the emissions of VOCs.Up to now,a number of methods (e.g.,adsorption)have been developed for the removal of hazardous materials.1−6Among the strategies for VOCs elimination,catalytic oxidation is believed to be one of the most effective pathways because it can operate at low temperatures and no secondary pollution products are generated.7−11The key issue of such a technology is the availability of high-performance catalysts.Although supported precious metal catalysts show excellent activities for the total oxidation of toluene at low temperatures,12−14the high cost and some involved problems (e.g.,sintering and volatility)prohibit their wide applications.Cheap transition-metal oxides,such as manganese oxides,cobalt oxides,and chromia,are active at high temperatures,7,8,15but they are inferior to precious metals in catalyzing the combustion of toluene at low temperatures.Hence,it is of significance to develop a catalyst that is cheap and effective for the removal of toluene at low temperatures.In the past years,a large number of works have been focused on the controlled preparation of manganese oxides with various morphologies.Up to now,manganese oxides with rod-like,wire-like,tubular,and spherical shapes have been gener-ated.16−19For example,Zhu and co-workers prepared one-dimensional (1D)α-,β-,γ-,and δ-MnO 2nanorods using a hydrothermal method and observed good catalytic activities for CO oxidation.16Gao et al.obtained 1D α-MnO 2nanowires by hydrothermally treating the mixture of KMnO 4and NH 4Cl at 140°C for 24h.17Zheng et al.generated single-crystalline 1D β-MnO 2nanotubes (diameter 200−500nm and length several micrometers)via a poly(vinyl pyrrolidone)-assisted hydro-thermal route with MnSO 4with NaClO 3as precursor.18Without the use of a template but with CCl 4and water as medium,Yuan et al.synthesized flower-like α-and γ-MnO 2(surface area 239m 2/g),which showed a good electrochemical capacitive behavior.19It was reported that manganese oxides were catalytically active for the complete oxidation of VOCs,such as propane,n -hexane,benzene,and toluene.20−23For instance,Finocchio and Busca investigated the surface and redox properties of Mn 3O 4,Mn 2O 3,and MnO 2,and claimed that the bulk oxygen diffusion rate had an effect on the catalytic oxidation rate in the oxidation of propane.20Delmon and co-workers observed that the γ-MnO 2catalyst outperformed the 0.3wt %Pt/TiO 2catalyst in the oxidation of n -hexane.23After studying the oxidation of benzene over manganese oxideReceived:November 11,2011Revised:January 20,2012Accepted:March 11,2012octahedral molecular sieve(OMS-2)catalyst,Luo et al. believed that the excellent activity and stability of OMS-2at low temperatures were due to the hydrophobic property and the facile evolution of lattice oxygen.21Aguero et al.observed good catalytic performance over Al2O3-supproted MnO x catalyst for the combustion of ethanol and toluene,which was attributed to the high capacity for adsorbing oxygen,the existence of surface defects,and the good reducibility of the catalyst.22It has been generally accepted that catalytic activity is related to the surface area,defective structure,reducibility,and morphology of a catalyst.The particle morphology has an important impact on catalytic oxidation performance of transition metal oxides(e.g.,Co3O4).24However,up to now, rarely has work been done on the comparative investigation of manganese oxides with various well-defined morphologies. Previously,our group prepared a series of three-dimension-ally(3D)ordered or wormhole-like mesoporous transition-metal oxides(e.g.,chromia,25,26iron oxide,27manganese oxide,28and cobalt oxide28,29)by using the3D ordered mesoporous silica KIT-6-or SBA-16-nanocasting method,and investigated their physicochemical properties.We found that these3D mesoporous transition-metal oxides performed well in catalyzing the combustion of formaldehyde,acetone,methanol, and toluene.Recently,we adopted the hydrothermal method to generate a number of transition-metal oxides with well-defined morphologies.In this paper,we report the controlled preparation and catalytic properties of rod-like,wire-like,and tubular MnO2as well as flower-like Mn2O3for the combustionof toluene.■EXPERIMENTAL SECTIONCatalyst Preparation.The manganese oxide catalysts were prepared according to the hydrothermal16,30or solution method.19The detailed procedures are described in the Supporting Information.The as-prepared samples are referred to as rod-like MnO2,wire-like MnO2,tube-like MnO2,and flower-like Mn2O3.Catalyst Characterization.All of the as-prepared samples were characterized by techniques such as X-ray diffraction (XRD),N2adsorption−desorption(BET),scanning electron microscopy(SEM),transmission electron microscopy(TEM), selected-area electron diffraction(SAED),X-ray photoelectron spectroscopy(XPS),and H2temperature-programmed reduc-tion(H2-TPR).The detailed methods are stated in the Supporting Information.Catalytic Evaluation.Catalytic activity of the samples was evaluated in a continuous-flow fixed-bed quartz microreactor(i.d.4mm).To minimize the effect of hot spots,the catalyst(0.1g,40−60mesh)was diluted with0.3g of quartz sands (40−60mesh).The reactant feed(flow rate33.3mL/min)was 1000ppm toluene+O2+N2(balance),with the toluene/O2 molar ratio and space velocity(SV)being1/400and20000 mL/(g h),respectively.For the change of SV,we altered the total flow rate of the reactant feed by the mass flow controller (D0719CM,Beijing Sevenstar Electronics Co.).The outlet gases were analyzed online by a gas chromatograph(Shimadzu GC-2010)equipped with a flame ionization detector(FID)and a thermal conductivity detector(TCD),using a1/8-in. Chromosorb101column(3m long)for toluene separation and a1/8-in.Carboxen1000column(3m long)for permanent gas separation.The outlet gases were also monitored online by a mass spectrometer(HPR20,Hiden).We found that no other products were detected in addition to CO2and H2O.On the basis of the toluene consumption and CO2production,the carbon balance and the conversion of toluene were calculated. The relative errors for the gas concentration measurements were less than±1.5%.The balance of carbon throughout theinvestigation was estimated to be ca.99.5%.■RESULTS AND DISCUSSIONCrystal Phase Composition.Figure1shows the XRD patterns of the as-prepared manganese oxide samples.Bycomparing to the XRD patterns of the standardα-MnO2 (JCPDS PDF72-1982),Mn2O3(JCPDS PDF41-1442),and Mn3O4(JCPDS PDF24-0734)samples,one can realize that the hydrothermally derived rod-and tube-like manganese oxide samples were single-phaseα-MnO2and of tetragonal crystal structure;in addition to the main phase of tetragonalα-MnO2, there was a trace amount of tetragonal Mn3O4phase in the wire-like manganese oxide sample.In the CCl4-solution derived flower-like manganese oxide sample,however,there were a cubic Mn2O3phase in majority and a tetragonalα-MnO2phase in minority.All of the diffraction peaks could be well indexed, as indicated in Figure1c and d.From Figure1,one can also observe no significant difference in XRD signal intensity of the four samples,indicating that they possessed similar crystallinity, a result due to the same subsequent thermal treatments.The XRD results demonstrate that the preparation conditions had an important influence on crystal structure of the manganese oxide sample.Morphology,Surface Area,Surface Element Compo-sition,and Oxygen Species.Figure2shows the SEM images of the as-prepared manganese oxide samples.It is observed that the manganese oxide particles derived hydrothermally at140°C for12h(Figure2a and b),240°C for24h(Figure2c and d),and120°C for12h(Figure2e and f)were,respectively, rod-,wire-,and tube-like in morphology,whereas those obtained with CCl4solution displayed a flower-like spherical shape with sharp edges.It should be noted that the wire-like morphology can be differentiated from the rod-like morphology in terms of the bending or straight shape.The diameter and length of the rods in the rod-likeα-MnO2sample were ca.43 nm and2−4μm,those of the wires in the wire-likeα-MnO2 sample were ca.40nm and1−10μm,and those of the tubesin Figure1.Wide-angle XRD patterns of(a)rod-like MnO2,(b)wire-like MnO2,(c)tube-like MnO2,and(d)flower-like Mn2O3.Δ: Impurity Mn3O4phase;○:impurity MnO2phase.the tubular α-MnO 2sample were ca.65nm and 1−3μm,respectively.For the Mn 2O 3sample,the size of the flower-like spheres was in the range of 800−1000nm.Shown in Figure 3are the TEM and high-resolution TEM images as well as the SAED patterns of the manganese oxide samples.Well-grown nanorods (Figure 3a),nanowires (Figure 3c),and nanotubes (Figure 3e)of α-MnO 2could be clearly observed.The TEM images (Figure 3g and h)were recorded on the edge of a broken flower-like Mn 2O 3nanoentity.From the high-resolution TEM images (Figure 3b,d,and f),one cansee well-resolved lattice fringes.The lattice spacings (d values)of the (121)crystal plane of the rod-,wire-,and tube-like α-MnO 2samples were ca.0.239,0.238,and 0.239nm,respectively,rather close to that (0.2388nm)of the standard α-MnO 2sample (JCPDS PDF 72-1982).The d value (0.271nm)of the (222)crystal plane of the flower-like spherical Mn 2O 3sample estimated from the high-resolution TEM image (Figure 3h)was also not far away from that (0.2716nm)of the referenced Mn 2O 3sample (JCPDS PDF 41-1442).Further-more,the recording of linearly aligned brightelectronFigure 2.SEM images of (a,b)rod-like MnO 2,(c,d)wire-like MnO 2,(e,f)tube-like MnO 2,and (g,h)flower-like Mn 2O 3.Figure 3.TEM and high-resolution TEM images as well as SAED patterns (insets)of (a,b)rod-like MnO 2,(c,d)wire-like MnO 2,(e,f)tube-like MnO 2,and (g,h)flower-like Mn 2O 3.diffraction spots in the SAED patterns (insets of Figure 3b,d,and f)means that the tetragonal α-MnO 2samples with rod-like,wire-like,and tubular morphologies were single crystalline.For the flower-like spherical Mn 2O 3sample,however,the SAED pattern (inset of Figure 3h)showed multiple bright electron diffraction rings,suggesting that this cubic Mn 2O 3sample was mainly polycrystalline.As can be seen from Table 1,the BET surface areas (ca.83m 2/g)of the rod-and wire-like α-MnO 2samples were similar,and much higher than that (ca.45m 2/g)of the tubular α-MnO 2sample.However,the flower-like spherical Mn 2O 3sample possessed a surface area of ca.162m 2/g,significantly higher than those of the hydrothermally derived α-MnO 2samples.The difference in preparation method led to a big difference in surface area of the MnO x catalysts with similar crystallinity,similar phenomena also took place in the preparation of α-Fe 2O 3samples.31,32XPS is a good tool to investigate the surface element composition,element oxidation state,and adsorbed species of a material.Figure 4illustrates the Mn 2p 3/2and O 1s XPS spectra of the manganese oxide samples.As shown in Figure 4A,there was one asymmetrical signal at BE =ca.642eV for the three α-MnO 2samples and at BE =ca.641eV for the Mn 2O 3sample,in which the former could be decomposed to two components at BE =641.6and 642.8eV,whereas the latter could be decomposed to three components at BE =640.6,641.6,and 642.8eV.The components at BE =640.6,641.6,and 642.8eV were attributable to the surface Mn 2+,Mn 3+,and Mn 4+species,7,33respectively.A quantitative analysis on the Mn 2p 3/2XPS spectra of the samples gives rise to the surface Mn 3+/Mn 4+as well as Mn 2+/Mn 3+molar ratios,as summarized in Table 1.Apparently,the preparation method had an important impact on the surface Mn 3+/Mn 4+or Mn 2+/Mn 3+molar ratio ofthe product.Among the hydrothermally prepared manganese oxide samples,the rod-like α-MnO 2sample showed the highest surface Mn 3+/Mn 4+molar ratio (0.58),whereas the lowest surface Mn 3+/Mn 4+molar ratio (0.31)was achieved on the wire-like α-MnO 2sample.It is noted that there was also the copresence of Mn 2+,Mn 3+,and Mn 4+on the surface of the flower-like Mn 2O 3sample due to the formation of tetragonal Mn 2O 3and α-MnO 2phases,with the surface Mn 3+/Mn 4+and Mn 2+/Mn 3+molar ratios being 4.17and 0.38,respectively.Based on the principle of electroneutrality,we deduce that the surface oxygen vacancy density was the highest on the rod-like α-MnO 2surface,while the lowest was on the wire-like α-MnO ually,oxygen molecules are adsorbed at the oxygen vacancies of an oxide material.Therefore,we believe that the oxygen adspecies locate at the surface oxygen vacancies of α-MnO 2or Mn 2O 3.This result is in good agreement with the result of O 1s XPS investigations.The formation of surface oxygen vacancies on the α-MnO 2or Mn 2O 3sample was beneficial for the oxidation of VOCs,which provides a good interpretation for the higher catalytic activity of rod-like α-MnO 2at low temperatures (shown in Section 3.4).As can be seen from Figure 4B,the asymmetrical O 1s signal could be deconvoluted to two components:one at BE =529.0eV and the other at BE =531.7eV;the former was assigned to the surface lattice oxygen (O latt )species,whereas the latter was assigned to the surface adsorbed oxygen (O ads )species.25−27,29It is found from Table 1that the estimated surface O ads /O latt molar ratios of the samples were dependent upon the preparation method.The surface O ads /O latt molar ratio decreased in the order of rod-like α-MnO 2(1.50)>tube-like α-MnO 2(1.15)>flower-like Mn 2O 3(0.92)>wire-like α-MnO 2(0.78).The formation of oxygen adspecies was due toTable 1.Preparation Conditions,BET Surface Areas,and Surface Element Compositions of the Manganese Oxide SamplesaThe datum in parentheses is the surface Mn 2+/Mn 3+molar ratio.Figure 4.(A)Mn 2p 3/2and (B)O 1s XPS spectra of (a)rod-like MnO 2,(b)wire-like MnO 2,(c)tube-like MnO 2,and (d)flower-like Mn 2O 3.the presence of surface oxygen vacancies on α-MnO 2or Mn 2O 3,which implies that there might be the coexistence of Mn 3+and Mn 4+ions in/on the α-MnO 2samples or Mn 2+and Mn 3+ions on/in the Mn 2O 3sample.27,29Such a deduction was supported by the Mn 2p 3/2XPS results of these samples.Reducibility.Figure 5A illustrates the H 2-TPR profiles of the as-prepared manganese oxide samples.For the rod-like α-MnO 2sample,there was a main reduction band at 265°C with a shoulder at 285°C,the total H 2consumption was 11.28mmol/g (Table 2).However,only one strong reduction band centered at 275°C for the wire-like α-MnO 2sample and at 268°C for the tube-like α-MnO 2sample was recorded,with the total H 2consumption being 10.00and 10.95mmol/g (Table 2),respectively.In the case of the flower-like spherical Mn 2O 3sample,there were two weaker reduction bands at 260and 332°C,corresponding to a total H 2consumption of 5.93mmol/g (Table 2).According to the results reported previously,28,34the reduction process could be reasonably divided into two steps:(i)Mn 4+→Mn 3+and (ii)Mn 3+→Mn 2+.Theoretically,the H 2consumptions for the reduction of MnO 2to Mn 3O 4and of Mn 3O 4to MnO are 7.67and 3.83mmol/g,respectively;while a H 2consumption of 6.30mmol/g is needed if the Mn 2O 3is completely reduced to MnO.In the present studies,the totalH 2consumptions (10.00−11.28mmol/g)of the hydro-thermally derived α-MnO 2samples and that (5.93mmol/g)of the flower-like Mn 2O 3sample were quite close to their theoretical H 2consumptions (11.50and 6.30mmol/g,respectively).This result indicates that a substantial fraction of Mn 4+in α-MnO 2or Mn 3+and Mn 4+in Mn 2O 3had been reduced to Mn 2+below 400°C.To better compare the low-temperature reducibility of these samples,we calculated the initial H 2consumption rate of the first reduction band of each sample before the occurrence of phase transformation (where the initial H 2consumption of the first reduction band of the catalyst is less than 25%25−27,35,36),and the results are shown in Figure 5B.Obviously,the initial H 2consumption rate decreased in the sequence of rod-like α-MnO 2>tube-like α-MnO 2>flower-like Mn 2O 3>wire-like α-MnO 2.That is to say,the low-temperature reducibility of these manganese oxide samples followed the above order.Catalytic Performance.In the blank experiment (only quartz sands were loaded),no conversion of toluene was detected below 400°C,indicating that under the adopted reaction conditions there was no occurrence of homogeneous reactions.Figure 6shows the catalytic performance of the bulk α-MnO 2sample (surface area =ca.10m 2/g,Beijing Chemical Reagent Company,A.R.,99.9%)and the as-prepared α-MnO 2and Mn 2O 3samples for the combustion of toluene.Under the conditions of toluene concentration =1000ppm,toluene/O 2molar ratio =1/400,and SV =20000mL/(g h),toluene conversion increased with the rise in reaction temperature,and the α-MnO 2and Mn 2O 3catalysts with various morphologies performed much better than the bulk α-MnO 2catalyst.It is worth pointing out that toluene was completely oxidized to CO 2and H 2O over the as-prepared α-MnO 2and Mn 2O 3catalysts,and there was no detection of products of incomplete oxidation,as confirmed by the good carbon balance of ca.99.5%in each run.It is convenient to compare the catalytic activities of these samples by using the reaction temperatures T 10%,T 50%,and T 90%(corresponding to the toluene conversion =10,50,and 90%),as summarized in Table 2.It is clearly seen that rod-like α-MnO 2was inferior to wire-and tube-like α-MnO 2and flower-like Mn 2O 3in catalytic performance atlowerFigure 5.(A)H 2-TPR profiles and (B)initial H 2consumption rates of (a)rod-like MnO 2,(b)wire-like MnO 2,(c)tube-like MnO 2,and (d)flower-like Mn 2O 3.Table 2.Reduction Temperatures,H 2Consumptions,and Catalytic Activities of the Manganese Oxide Samples2rod-like MnO 226528511.28176210225wire-like MnO 227510.00143225245tube-like MnO 226810.95157222233flower-like Mn 2O 3260332 5.93145226238temperatures (<180°C),but the former catalyst (T 50%=210°C and T 90%=225°C)outperformed the latter three catalysts (T 50%=222−226°C and T 90%=233−245°C)at higher temperatures.Such a phenomenon might be mainly associated with the nature and distribution of the surface adsorbed oxygen (O −,O 2−,and O 22−)species on the catalysts.As we know,the oxygen adspecies can be converted from O 2−(the lowest reactivity)to O −(the highest reactivity)at elevated temper-atures.37−39Although the total amount of the surface adsorbed oxygen species on the rod-like MnO 2sample was higher than those on the wire-and tube-like MnO 2or flower-like Mn 2O 3catalyst,the O −species concentration (which is governed by the defective structure)on the rod-like MnO 2catalyst might be lower than those on the other three catalysts at lower temperatures.Hence,the rod-like MnO 2catalyst showed lower activity at low temperatures.With a rise in reactiontemperature,a larger amount of O −species might be available through the conversion of O 2−and O 22−to O −species on the rod-like MnO 2catalyst,37,39giving rise to a great enhancement in catalytic activity.The T 50%and T 90%values for the rod-like α-MnO 2catalyst were 82and 97°C lower than those for the bulk α-MnO 2catalyst,respectively.Therefore,it is concluded that in terms of T 50%and T 90%values,the catalytic performance decreased in the order of rod-like α-MnO 2>tube-like α-MnO 2>flower-like Mn 2O 3>wire-like α-MnO 2,coinciding with the sequences of oxygen adspecies concentration obtained in the XPS studies and of low-temperature reducibility revealed by the H 2-TPR investigations.25−27,29Figure 7A and B shows the effects of SV and toluene/O 2molar ratio on the catalytic activity of the rod-like α-MnO 2sample,respectively.It is observed that the catalytic activity of rod-like α-MnO 2decreased with the rise in SV value (Figure 7A)or toluene/O 2molar ratio (Figure 7B).Obviously,the rise in O 2concentration of the reactant feed favored the enhancement of toluene conversion,suggesting that the oxygen adspecies might play an important role in the total oxidation of toluene.That is to say,the oxygen nonstoichiometry relevant to structural defects might be a critical factor in determining the catalytic activity of manganese oxide.25−30To examine the catalytic stability of the rod-like α-MnO 2sample,we carried out the on-stream reaction experiment at 225°C and the result is shown in Figure S1of the Supporting Information.It is found that there was no significant decline in catalytic activity within 60h of on-stream reaction.Hence,we believe that the rod-like α-MnO 2sample was catalytically durable.In the past years,a number of materials have been used as catalysts for the oxidative removal of toluene.It was reported that under similar conditions for the combustion of toluene,the T 50%and T 90%values were 245−340and 265−375°C over the commercial Mn 3O 4,Mn 2O 3,or MnO 2catalyst at SV =15000mL/(g h),15140−200and 234−240°C over the mesoporous CrO x or MnO 2catalyst at SV =20000h −1,26,28254−279and 295−306°C over the LaMnO 3or LaCoO 3catalyst at SV =178h −1,40,41270and 300°C over the 5wt %Au/CeO 2catalyst at SV =186h −1,42and 180and 250°C over the 0.5wt %Pd/Figure 6.Toluene conversion as a function of reaction temperature over the catalysts under the conditions of toluene concentration =1000ppm,toluene/O 2molar ratio =1/400,and SV =20000mL/(g h).Figure 7.Toluene conversion versus reaction temperature over the rod-like MnO 2catalyst under the conditions of (A)toluene concentration =1000ppm,toluene/O 2molar ratio =1/400,and different SV values;and (B)toluene concentration =1000ppm,SV =20000mL/(g h),and various toluene/O 2molar ratios.LaMnO 3catalyst at SV =18000mL/(g h).43Apparently,the rod-like α-MnO 2catalyst (T 50%=210°C and T 90%=225°C at SV =20000mL/(g h))outperformed the above-mentioned commercial Mn 3O 4,Mn 2O 3,and MnO 2,mesoporous CrO x and MnO 2,LaMnO 3,LaCoO 3,5wt %Au/CeO 2,and 0.5wt %Pd/LaMnO 3catalysts for the combustion of toluene.15,26,28,40−43It is well-known that the catalytic activity of a transition metal oxide is associated with several factors,such as defect nature and density,oxygen adspecies concentration,reducibility,surface area,and morphology.For the combustion of organics,the catalyst with a higher surface area would show a better catalytic activity.15,44The surface area of the flower-like spherical Mn 2O 3sample was much higher than that of the rod-and tube-like α-MnO 2samples,but its catalytic perform-ance was inferior to the rod-and tube-like α-MnO 2samples;furthermore,the wire-like α-MnO 2sample possessed a much higher surface area than the tube-like counterpart,but the catalytic activity of the wire-like α-MnO 2sample was also poorer than that of the tube-like α-MnO 2sample.This result indicates that surface area was a minor factor influencing the catalytic performance.Although the morphology might exert an influence on the reducibility of a catalyst,45the relation between the morphology and the oxygen vacancy density is not clear.The morphology and oxygen density as well as reducibility of the as-obtained catalysts might be dependent mainly on the preparation approach in the present ually,a higher structural defect (e.g.,oxygen vacancy)density,which is beneficial for the activation of oxygen molecules to active oxygen adspecies,and a stronger reducibility render the catalyst to show better catalytic performance.22As revealed by the XPS and H 2-TPR investigations,the oxygen adspecies concentration relevant to the surface oxygen vacancy density and low-temperature reducibility were correlative with the catalytic activity of these manganese oxide samples.25−27,29Therefore,we conclude that the excellent catalytic performance of the rod-like α-MnO 2sample for toluene combustion was mainly related to the high oxygen adspecies concentration and good low-temperature reducibility.■ASSOCIATED CONTENT*Supporting Information Details of catalyst preparation procedures and characterization,and one additional figure.This material is available free of charge via the Internet at .■AUTHOR INFORMATIONCorresponding Author*Phone:+86-10-6739-6118;fax:+86-10-6739-1983;e-mail:hxdai@).NotesThe authors declare no competing financial interest.■ACKNOWLEDGMENTSFinancial support by the NSF of Beijing Municipality (grant 2102008),the NSF of China (grants 20973017and 21077007),the National High-Tech Research and Development (863)Program of China (grant 2009AA063201),the Creative Research Foundation of Beijing University Technology (grants 00500054R4003and 005000543111501),and the Funding Project for Academic Human Resources Development in Institutions of Higher Learning under the Jurisdiction ofBeijing Municipality (grants PHR201007105and PHR201107104)is gratefully acknowledged.We also thank Prof.Chak Tong Au (Department of Chemistry,Hong Kong Baptist University)and Mrs.Jianping He (State Key Laboratory of Advanced Metals and Materials,University of Science &Technology Beijing)for doing the XPS and SEM analyses,respectively.■REFERENCES(1)Gupta,V.K.;Carrott,P.J.M.;Ribeiro Carrott,M.M.;Suhas,L.Low-cost adsorbents:Growing approach to wastewater treatment −a review.Crit.Rev.Environ.Sci.Technol.2009,39,783−842.(2)Ali,I.;Gupta,V.K.Advances in water treatment by adsorption technology.Nat.Protoc.2007,1,2661−2667.(3)Gupta,V.K.;Ali,I.Removal of endosulfan and methoxychlor from water on carbon slurry.Environ.Sci.Technol.2008,42,766−770.(4)Gupta,V.K.;Rastogi,A.;Dwivedi,M.K.;Mohan,D.Process development for the removal of zinc and cadmium from wastewater using slag −A blast furnace waste material.Sep.Sci.Technol.1997,32,2883−2912.(5)Gupta,V.K.;Rastogi,A.Biosorption of lead(II)from aqueous solutions by non-living algal biomass Oedogonium sp.and Nostoc sp.−A comparative study.Colloids Surf.,B 2008,64,170−178.(6)Gupta,V.K.;Rastogi,A.Sorption and desorption studies of chromium(VI)from nonviable cyanobacterium Nostoc muscorum biomass.J.Hazard.Mater.2008,154,347−354.(7)Tseng,T.K.;Chu,H.;Hsu,H.H.Characterization of γ-alumina-supported manganese oxide as an incineration catalyst for trichloro-ethylene.Environ.Sci.Technol.2003,37,171−176.(8)Rotter,H.;Landau,M.V.;Herskowitz,bustion of chlorinated VOC on nanostructured chromia aerogel as catalyst and catalyst support.Environ.Sci.Technol.2005,39,6845−6850.(9)Parida,K.M.;Sahu,N.;Tripathi,A.K.;Kamble,V.S.Gold promoted S,N-doped TiO 2:An efficient catalyst for CO adsorption and oxidation.Environ.Sci.Technol.2010,44,4155−4160.(10)Wang,R.H.;Li,J.H.Effects of precursor and sulfation on OMS-2catalyst for oxidation of ethanol and acetaldehyde at low temperatures.Environ.Sci.Technol.2010,44,4282−4287.(11)Kim,S. C.;Shim,W.G.Influence of physicochemical treatments on iron-based spent catalyst for catalytic oxidation of toluene.J.Hazard.Mater.2008,154,310−316.(12)Masui,T.;Imadzu,H.;Matsuyama,N.;Imanaka,N.Total oxidation of toluene on Pt/CeO 2−ZrO 2−Bi 2O 3/γ-Al 2O 3catalysts prepared in the presence of polyvinyl pyrrolidone.J.Hazard.Mater.2010,176,1106−1109.(13)Santos,V.P.;Carabineiro,S.A.C.;Tavares,P.B.;Pereira,M.F.R.;O rfa o ,J.J.M.;Figueiredo,J.L.Oxidation of CO,ethanol and toluene over TiO 2supported noble metal catalysts.Appl.Catal.,B 2010,99,198−205.(14)Shim,W.G.;Lee,J.W.;Kim,S.C.Analysis of catalytic oxidation of aromatic hydrocarbons over supported palladium catalyst with different pretreatments based on heterogeneous adsorption properties.Appl.Catal.,B 2008,84,133−141.(15)Kim,S.C.;Shim,W.G.Catalytic combustion of VOCs over a series of manganese oxide catalysts.Appl.Catal.,B 2010,98,180−185.(16)Liang,S.H.;Teng,F.;Bulgan,G.;Zong,R.L.;Zhu,Y.F.Effect of phase structure of MnO 2nanorod catalyst on the activity for CO oxidation.J.Phys.Chem.C 2008,112,5307−5315.(17)Gao,Y.Q.;Wang,Z.H.;Wan,J.X.;Zou,G.F.;Qian,Y.T.A facile route to synthesize uniform single-crystalline α-MnO 2nano-wires.J.Cryst.Growth 2005,279,415−419.(18)Zheng,D.S.;Sun,S.X.;Fan,W.L.;Yu,H.Y.;Fan,C.H.;Cao,G.X.;Yin,Z.L.;Song,X.Y.One-step preparation of single-crystalline β-MnO 2nanotubes.J.Phys.Chem.B 2005,109,16439−16443.(19)Yuan,C.Z.;Gao,B.;Su,L.H.;Zhang,X.G.Interface synthesis of mesoporous MnO 2and its electrochemical capacitive behaviors.J.Colloid Interface Sci.2008,322,545−550.。
Self-Assembly of Novel Mesoporous Manganese Oxide Nanostructures and Their Application in Oxidative Decomposition of FormaldehydeHongmin Chen,†,§Junhui He,*,†Changbin Zhang,‡and Hong He‡Functional Nanomaterials Laboratory and Key Laboratory of Organic Optoelectronic Functional Materials andMolecular Engineering,Technical Institute of Physics and Chemistry,Chinese Academy of Sciences(CAS),Beijing100080,P.R.China,Graduate Uni V ersity of Chinese Academy of Sciences,Beijing100049,P.R.China,and State Key Laboratory of En V ironmental Chemistry and Ecotoxicology,Research Center forEco-En V ironmental Sciences,Chinese Academy of Sciences(CAS),Beijing100085,P.R.ChinaRecei V ed:July31,2007;In Final Form:September18,2007Monodisperse manganese oxide honeycomb and hollow nanospheres have been prepared facilely at roomtemperature by varying the molar ratio of KMnO4and oleic acid.These new nanomaterials were characterizedby XRD,SEM,EDS,TEM,and BET measurements.They had robust nanostructures and were stable evenafter ultrasonic treatment(40kHz,120W)for30min.A plausible mechanism of the formation of manganeseoxide nanostructures was proposed.The manganese oxide nanomaterials showed high catalytic activities foroxidative decomposition of formaldehyde at low plete conversion of formaldehyde to CO2and H2O could be achieved,and harmful byproducts were not detected in effluent gases.The catalytic activityof manganese oxide hollow nanospheres was much higher than that of honeycomb nanospheres,although thesurface area of the latter was nearly2times as high as that of the former.The mechanism of such morphology-dependent catalytic activity was discussed in detail.The catalytic activities of the obtained manganese oxidenanospheres were also significantly higher than those of previously reported manganese oxide octahedralmolecular sieve(OMS-2)nanorods,MnO x powders,and alumina-supported manganese-palladium oxidecatalysts.Potential applications and future research efforts were proposed.1.IntroductionControlling the size,shape,and structure of inorganic nanomaterials to search for new properties has become one of the major objectives of nanoscale science and technology, because of their structure-,size-,and shape-dependent charac-teristics and novel electronic,magnetic,optical,chemical,and mechanical properties that cannot be obtained in their bulk counterparts.1,2Oxides of transition metals,which have different oxidation states and coordination numbers,are especially interesting due to their unique electronic,optical,thermal, photonic,and catalytic properties in different morphologies.3 Recently,much attention has been paid to3D nanostructures, such as TiO2,SnO2,MnO2,and Fe2O3hollow spheres and other nanostructures.4Among various strategies for controlled syn-thesis,the“soft chemistry”route,which is based on a solution process,is effective for the synthesis of nanostructured materials with well-controlled shapes,sizes,and structures.5 Manganese oxides(MnO2)have been extensively studied as a well-known transition-metal oxide,because of their outstand-ing structural multiformity combined with novel chemical and physical properties and wide applications in catalysis,ion or molecular sieves,molecular adsorption,biosensors,electrode materials in batteries,and energy storage.6-14Different MnO2 morphologies have so far been prepared,including rods,wires,tubes,urchin-like microstructures,etc.They were prepared either by oxidizing Mn2+with oxidants or by reducing MnO4-with reductants.Very recently,Suib and co-workers15prepared cryptomelane-type MnO2octahedral molecular sieve micro-spheres(OMS-2)and mesoporousγ-MnO2hollow nanospheres by hydrothermal method.Xie and co-workers16prepared -MnO2nanorods,urchin-like R-MnO2microspheres and R-MnO2hierarchical structures via a homogeneous catalytic route.However,few works were reported on nanostructures of layered MnO2,such as birnessite-type MnO2(A x MnO2,where A)H+or metal cation).A x MnO2is a layered structure consisting of edge-sharing MnO6octahedra with an interlayer spacing of ca.0.7nm.17It can be widely used in applications, such as ionic adsorption,18battery electrodes,19electrochemical and magnetic materials,20,21and oxidative degradation of organic and inorganic contaminations.22Hydrothermal reaction,23sol-gel process,24reflux method,25and thermal decomposition26have been used to synthesize MnO2materials of various ordered morphologies.Obtained MnO2particles,however,were several microns in size and most of the prepared methods needed catalysts,acid or alkaline media,or high temperatures. Formaldehyde is a major indoor air pollutant and is known to cause irritation to eyes,respiratory tract,and skin even at concentrations of ppm levels.27It exists in isolating materials, furniture,wood,exhaust gases,disinfectants,and tobacco smoke. It is also used as an additive in water-based paints.Currently effective removal of HCHO is attracting much attention.The catalytic decomposition of HCHO has been achieved in the temperature range90∼500°C.Facile decomposition of HCHO at low temperature,however,is still a challenge though there are increasing concerns on HCHO in the indoor environment.*To whom correspondence should be addressed.Tel.:+86-10-8254 3535.Fax:+86-10-82543535.E-mail:jhhe@.†Technical Institute of Physics and Chemistry,Chinese Academy of Sciences.‡Research Center for Eco-Environmental Sciences,Chinese Academy of Sciences.§Graduate University of Chinese Academy of Sciences.18033J.Phys.Chem.C2007,111,18033-1803810.1021/jp076113n CCC:$37.00©2007American Chemical SocietyPublished on Web11/15/2007Catalytic oxidation is a promising approach as HCHO can be oxidized to CO 2over catalysts at lower temperatures than thermal oxidation.28MnO x powders,MnO 2octahedral molecular sieve (OMS-2)nanorods,and alumina-supported manganese-palladium oxides (Mn -Pd/Al 2O 3)were used as catalysts for decomposition of HCHO,and the latter two catalysts showed high activities at low temperatures.29Very recently,Sinha et al.30reported that mesostructured 2.8wt %Au/γ-MnO 2nano-particle composites could be used for extensive air purification.In this article,we reported self-assembly of manganese oxide nanoplatelets into novel mesoporous nanostructures and their application in oxidative decomposition of -plete conversion of HCHO to CO 2and H 2O was achieved at low temperatures,and harmful byproducts were not detected in effluent gases.The as-prepared mesoporous nanostructures also showed better catalytic activities for decomposion of HCHO than other existing MnO 2materials.2.ExperimentsK x MnO 2honeycomb nanospheres and hollow nanospheres were synthesized via a simple soft chemistry route at room temperature,as described in Chart 1.Oleic acid (OA)was oxidized by potassium permanganate (KMnO 4)in neutral aqueous solution.Such a reaction was also called “Baeyer test for unsaturation”.312.1.Materials.Potassium permanganate (g 99.5%),oleic acid (g 99.5%),and ethanol (g 99.7%)were purchased from Beijing Chemical Reagent Company and used without further purifica-tion.Distilled water was used throughout.2.2.Synthesis of K x MnO 2Honeycomb Nanosphere.In a typical procedure,1.0g (6.3mmol)of KMnO 4was dissolved in 500mL of distilled water,and the mixture was fleetly stirred for about 30min.A total of 10.0mL of oleic acid was added,and a steady emulsion was formed.After the emulsion was maintained at room temperature for a certain period of time,brown -black products were collected and washed several times with distilled water and alcohol to remove any possible residual reactants.Finally,the products were dried under a vacuum at 60°C for 10h.2.3.Synthesis of K x MnO 2Hollow Nanospheres.A total of 2.0∼4.0g (12.6∼25.2mmol)of KMnO 4was dissolved in 200mL of distilled water,and the mixture was stirred for about 30min.A total of 4.0mL of oleic acid was added,and a steady emulsion was formed.After the emulsion was maintained at room temperature for a certain period of time,brown -black products were collected and washed several times with distilled water and alcohol to remove any possible residual reactants.Finally,the products were dried under a vacuum at 60°C for 10h.2.4.Oxidative Decomposition of Formaldehyde on K x M-nO 2Nanomaterials.Catalytic activities of as-prepared samples for the oxidation of HCHO were studied with a fixed-bed quartz flow reactor (length )300mm,diameter )4mm)by passing a gas mixture of 100ppm HCHO,20vol %O 2,and the balancegas (He)at a total flow rate of 50cm 3min -1in a space velocity of GHSV )50000h -1.32A total of 50∼70mg of catalysts were loaded.HCHO,CO,and CO 2were analyzed on-line using a gas chromatograph (GC)equipped with hydrogen flame ionization detector (FID)and Ni catalyst converter which was used for converting carbon oxides and HCHO quantitatively into methane in the presence of hydrogen before the detector.Separation of reactants and products was achieved using two columns:a carbon molecular sieve column for permanent gases (CO and CO 2)and a GDX-403column for HCHO.The HCHO conversion was determined by the equationwhere [HCHO]b (ppm)is the HCHO concentration without passing over catalyst,[HCHO](ppm)is the HCHO concentra-tion after passing over catalyst.2.5.Characterization.Powder X-ray diffraction (XRD)patterns of as-prepared samples were recorded on a Holand PANalytical X’Pert PRO MPD X-ray diffractometer with Cu K R radiation (λ)0.1542nm)operated at 40kV and 40mA.The 2θrange and recording step were 10∼90°and 0.03°,respectively.Crystallite sizes were calaulated using the Scherrer equation.For the crystallite size calculation,the (001)reflection of as-synthesized K x MnO 2at a 2θof 12.29°was used.Scanning electron microscopy (SEM)and energy dispersive spectroscopy (EDS)measurements were carried out on a Hitachi S-4300field emission scanning electron microscope (FESEM).All of the samples were sputtered with gold before observation.For transmission electron microscopy (TEM),powder samples were added on the carbon-coated copper grids and observed on a JEOL JEM-200CX transmission electron microscope at an acceleration voltage of 150kV.Nitrogen adsorption -desorption measurements were performed on a Quantachrome NOVA 4200e surface area analyzer (measurable diameter range 0.35∼200nm)at -196°C using the volumetric method.The as-prepared K x MnO 2products were first dried at 150°C before analysis.The specific surface area was calculated by the Brunauer -Emmett -Teller (BET)method using a linear plot over the range P /P 0)0.04∼0.20(six points collected).Pore size distributions were estimated from the adsorption branch of the isotherm by the Barrett,Joyner,and Halenda (BJH)method.Pore volumes were determined from the amount of nitrogen adsorbed at P /P 0)0.98.3.Results and Discussion3.1.Crystalline Structures and Elemental Analyses.The phase and crystallographic structure of the products were determined by XRD.Figure 1,panels a and b,shows XRD patterns of honeycomb and hollow nanospheres,respectively.They have similar patterns.Significant XRD peaks recorded at 2θ)12.29,24.33,36.60,and 65.67°could be well assigned to the (001),(002),(100),and (110)planes of K x MnO 2with a turbostratic structure.33The d-spacings of these planes were estimated to be 0.718nm (001),0.366nm (002),0.246nm (100),and 0.142nm (110).The increase in intensity of the (100)peak was probably related to scattering from remaining organics.From 2θ)12.29°,the interlayer spacing was estimated to be ca.0.72nm,in good agreement with the literature.17,33For the particle size estimation,the (001)reflection at 2θ)12.29°was used.Calculation by the Scherrer equation showed that the lamellar structure of K x MnO 2had a thickness of ca.8.1nm.CHART 1:Synthetic Procedures of K x MnO 2Honeycomb and Hollow Nanospheres (C KMnO4)Concentration of KMnO 4).HCHO conversion (%))[HCHO]b -[HCHO][HCHO]b×100(1)18034J.Phys.Chem.C,Vol.111,No.49,2007Chen et al.Thus,it is supposed to consist of ca.7monolayers.The corresponding EDS results (Figure 2)confirmed the presence of Mn,O,and K elements and gave rough atomic ratios of Mn/O and K/Mn of 1:2and 0.05,respectively.K x MnO 2of x <0.3was also reported previously.213.2.Morphologies of K x MnO 2Nanospheres.Figure 3a shows a typical SEM image of the product obtained using a KMnO 4/OA molar ratio of 1:5after redox reaction for 20h.Clearly,the product consists of monodisperse nanospheres of ca.97nm in diameter.A magnified image (inset of Figure 3a)shows that the nanosphere in fact has a honeycomb structure that was formed by the self-assembly of nanoplatelets.15The thickness of such platelets was estimated to be ca.10.7nm,inagreement with the above XRD results.Figure 3b shows a typical TEM image of the honeycomb nanospheres.Clearly,each nanosphere consists of platelets that self-align perpendicular to the spherical surface and emanate from the center rather like the structure of a honeycomb.15,34Gray parts are platelets that were vertical to the electron beam,and dark parts are those that were parallel to the electron beam.Figure 3,panels c and d,shows SEM and TEM images,respectively,of the product obtained using a molar ratio of KMnO 4/OA at 1:1after redox reaction for 5h.The clear contrast between the dark edge and the gray center of each nanosphere (Figure 3d)is evidence of its hollow nature.35A close look at the shells shows that they consist of shorter and thinner platelets than the above honey-comb K x MnO 2nanospheres.Their size distribution is also not as uniform as that of the latter.It is very interesting that both the honeycomb and hollow K x MnO 2nanospheres had no changes in morphology upon ultrasonic treatment (40kHz,120W)for 30min,indicating the robustness of the nanospheres.The validity of the above synthetic approaches on a larger scale was also confirmed by increasing the precursor quantities by 10fold.3.3.Evolution of Honeycomb K x MnO 2Nanospheres with Reaction Time.The size and morphology evolution of hon-eycomb K x MnO 2nanospheres were investigated by varying the reaction time.After 0.5h of redox reaction,the color of the solution had little changes,and only a small amount of solid was obtained.As shown in Figure 4a,the nanostructure (ca.50nm in size)consisted of nanoplatelets of ca.2.2nm in thickness.The contrast was low,probably because of a small number of nanoplatelets.After 2h,the color of the solution changed from purple -red to yellow -brown,showing that more K x MnO 2was formed.As shown in Figure 4b,clear sphere-like nanostructures were formed,in which nanoplatelets self-assembled by standing on each other.The nanostructure and the nanoplatelets were 75nm in size and 3.0nm in thickness,respectively.With further increase of reaction time,the color of the solution gradually changed to brown -black,and the size of the nanostructure and the thickness of the nanoplatelet increased to nearly 83and 3.3nm (5h,Figure 4c),89and 5.2nm (20h,Figure 4d),respectively.Clearly,the nanoplatelets eventually self-aligned perpendicular to the spherical surface and emanate from the center rather like the structure of a honeycomb (Figure 4d).36Thus,the thickness of the platelet and the size and morphology of nanospheres are dependent on the redox reaction time.37Another interesting observation was that the lamellarplateletsFigure 1.XRD patterns of as-prepared honeycomb (a)and hollow (b)K x MnO 2nanospheres,respectively.Figure 2.EDS analysis of as-prepared K x MnO 2nanospheres.Figure 3.SEM (a)and TEM (b)images of honeycomb K x MnO 2nanospheres (KMnO 4/OA )1:5)and SEM (c)and TEM (d)images of hollow K x MnO 2nanospheres (KMnO 4/OA )1:1).Figure 4.TEM images of honeycomb KxMnO 2nanospheres obtained after redox times of 0.5(a),2(b),5(c),and 20h (d),respectively.Scale bar:50nm.Self-Assembly of Manganese Oxide Nanostructures J.Phys.Chem.C,Vol.111,No.49,200718035initially looked very soft and foldable.In fact,such softness has recently been discussed on the nanometer scale in a review article.383.4.Effect of the Molar Ratio of KMnO 4/OA on the Size and Morphology of K x MnO 2Nanospheres.The effect of the molar ratio of KMnO 4/OA on the size and morphology of K x -MnO 2nanospheres was also studied.Figure 5a shows a TEM image of product obtained with a KMnO 4/OA molar ratio of 1:10.Irregular sphere-like nanostructures with soft and foldable lamellar nanoplatelets were obtained.They were similar in morphology to those nanostructures in Figure 4,panels b and c,which had also been observed in other crystal phases of MnO 2.39At a higher KMnO 4/OA molar ratio of 1:5,honeycomb nanpspheres were obtained,as shown in Figure 5b.Very interesting,hollow nanospheres were produced at a still higher KMnO 4/OA molar ratio of 1:1(Figure 5c).Their shells consisted of loosely packed nanoplatelets and had a thickness of ca.20nm.When the molar ratio of KMnO 4/OA further increased to 2:1,hollow nanospheres of denser shells were obtained (Figure 5d).Therefore,the size and morphology of K x MnO 2nanospheres are largely dependent on the molar ratio of KMnO 4/OA,and it is possible to tailor the K x MnO 2nanostructures by adjusting this parameter.3.5.Formation Mechanism of the Nanostructures.In principle,crystal growth and crystal morphology are determined by the degree of supersaturation,the species to the surface of the crystals,the surface and interfacial energies,and the structure of the crystals.Various extrinsic and intrinsic factors,the crystal structure,and the growth surroundings are accounted for in the final morphology.40Based on the above analysis,a plausible mechanism was proposed and is shown in Scheme 1.Oleic acid can form a stable O/W emulsion at appropriate concentrations (process a).41In the emulsion,the “Baeyer test for unsaturation”reaction quickly occurs between KMnO 4and oleic acid at the O/W interface and produces K x MnO 2nuclei there (process b).42At low KMnO 4concentrations,small amounts of lamellar K x MnO 2platelets are produced,and thus an unstable shell of loosely packed platelets is formed (process c).Removal of oleic acid and formed cis-diol by ethanol results in collapse of the shell,giving honeycomb nanospheres (process d).In contrast,large amounts of lamellar platelets are produced at high KMnO 4concentrations,and thus a robust shell of densely packed platelets is formed (process e).Therefore,the K x MnO 2shell ispreserved even after removal of oleic acid and formed cis-diol,and hollow nanospheres are formed (process f).Thus,the current approach is believed to be a general method for preparation of metal oxide hollow nanospheres.3.6.Nitrogen Adsorption -Desorption Measurements.The surface area and pore size distribution of the above nanomate-rials were revealed by N 2adsorption -desorption measurements.The results showed that both the honeycomb and hollow nanospheres had a typical type IV adsorption -desorption isotherm with a hysteresis loop characteristic of mesoporous materials based on the IUPAC (Figure 6).43The BET surface areas of the honeycomb and hollow nanospheres were calculated to be 70.70and 40.69m 2/g,respectively.The corresponding pore volumes are 0.20and 0.09cm 3/g,respectively.As shown by BJH analyses,the pore size of the honeycomb nanosphere has a tri-modal distribution at4.9,6.5,and 9.0nm (Figure 6a,inset),and that of the hollow nanosphere has amulti-modalFigure 5.TEM images of K x MnO 2nanostructures obtained with molar ratios of KMnO 4/OA of 1:10(a),1:5(b),1:1(c),and 2:1(d),respectively.Figure 6.Nitrogen sorption isotherms and pore size distributions (inset)of honeycomb (a)and hollow (b)K x MnO 2nanospheres.SCHEME 1:Plausible Formation Mechanism of Honeycomb and Hollow K x MnO 2Nanospheres18036J.Phys.Chem.C,Vol.111,No.49,2007Chen et al.distribution at 3.7,4.7,6.2,and 13.0nm (Figure 6b,inset),respectively.The mesopores are attributed to the interstitial space between nanoplatelets of honeycomb and hollow nanostructures.These results agree well with those of XRD,SEM,and TEM measurements.The high BET surface area is beneficial as catalyst or catalyst supports for catalytic reactions.3.7.Oxidative Decomposition of Formaldehyde on As-Synthesized K x MnO 2Nanospheres.A sample (50mg)of the hollow K x MnO 2nanospheres showed the highest catalytic activity for decomposition of HCHO,and at 60°C,the HCHO conversion reached 61.8%(Figure 7,curve a).A sample (70mg)of the honeycomb nanospheres achieved a HCHO conver-sion of 24%at the same temperature (Figure 7,curve b).The HCHO conversion by the hollow K x MnO 2nanospheres (50mg)increased to 100%when the temperature was raised to 80°C,and that by the honeycomb nanospheres (70mg)needed 85°C to reach a 100%conversion.In sharp contrast,no HCHO conversion was noticeable in a control experiment.This is the first report of catalytic decomposition of HCHO by mesoporous layered K x MnO 2nanomaterials at such low temperatures.The catalytic activities of the as-prepared K x MnO 2nanomater-ials were compared with those of previous reported materials.OMS-2nanorods (200mg)showed a HCHO conversion of 13%at 60°C.It increased to 100%when the reaction temperature was raised to 80°C.29Mn 18.2wt %/Al 2O 3catalysts (100mg)had no activity at temperatures lower than 150°C.The HCHO conversation by these catalysts reached 100%when reaction temperature was increased to 220°C.Mn 18.2wt %/Pd 0.4wt %/Al 2O 3catalysts (100mg)gave a HCHO conversation of 100%at temperatures higher than 80°C.29Both OMS-2nanorods (200mg)and Mn 18.2wt %/Pd 0.4wt %/Al 2O 3(100mg)catalysts had no catalytic activity when reaction temperature was lower than 50°C.29Even though the mesoporous hollow K x MnO 2nanospheres had a surface area nearly 2times lower than that of mesoporous honeycomb K x MnO 2nanospheres,it still showed a much higher catalytic activity for the HCHO conversion.The HCHO conversion per gram of the hollow K x -MnO 2nanospheres (Figure 8,curve a)is about 4times as high as that of the honeycomb K x MnO 2nanospheres (Figure 8,curve b)at 60°C and about 2times as high as that of the honeycomb K x MnO 2nanospheres at 80°C.In contrast,OMS-2nanorods and MnO x powders gave a HCHO conversion per gram of less than 1at 60°C (Figure 8,curve c)and of less than 5at 80°C (Figure 8,curve d).Thus,the catalytic activities of these MnO 2nanomaterials for HCHO oxidation fall in the order of hollow K x MnO 2nanospheres >honeycomb K x MnO 2nanospheres >OMS-2nanorods >MnO x powders.Clearly,the catalytic activity of MnO 2nanomaterial is largely dependent on its morphology.The hollow K x MnO 2nanospheres would adsorb and retain HCHO for a longer period of time than the honeycomb K x MnO 2nanospheres and eventually enhance the oxidation of HCHO.The smaller size of nanoplatelets in hollowK x MnO 2nanospheres than in honeycomb K x MnO 2nanospheres would be another reason for their higher catalytic activity.4.ConclusionIn summary,we developed a facile approach to preparation of mesoporous nanospheres of layered MnO 2at room temper-ature.It involves a redox reaction of KMnO 4and oleic acid at the O/W interface,followed by self-assembly of formed K x -MnO 2nanoplatelets into K x MnO 2nanostructures.Both mono-disperse honeycomb and hollow K x MnO 2nanospheres were prepared in high yields depending on the molar ratio of KMnO 4/OA.These new nanomaterials had robust nanostructures and showed morphology-dependent catalytic activities for decom-position of plete conversion of HCHO to CO 2and H 2O could be achieved at low temperatures,and harmful byproducts were not detected in effluent gases.The catalytic activities were also significantly higher than those of previously reported MnO 2OMS-2nanorods,MnO x powders,and Mn -Pd/Al 2O 3catalysts.Although TiO 2had no activity for HCHO oxidation,TiO 2-supported noble metals (Pt,Au,Pd,and Rh)showed high activities under otherwise identical conditions when the noble metal loading reached a certain quantity.32Palladium also enhanced the activity of 18.2wt %Mn/Al 2O 3catalysts,as discussed above.28,29Thus,the mesoprous K x MnO 2nanospheres would be convenient and effective catalysts and catalyst supports for noble metals,such as Pt,Au,Pd,and Rh.32,44In fact,they are currently being investigated as catalyst supports for noble metal nanaparticles in our laboratory.Such materials are also believed to have applications as adsorbents and separation materials,18and in electrodes,electrolytes,19and electromagnetic and electronic devices.20Acknowledgment.We are grateful to the “Hundred Talents Program”of CAS,the National Basic Research Program of China (Grant No.2006CB933000),and the National Natural Science Foundation of China (Grant No.20471065)for financial supports.References and Notes(1)(a)Hu,J.T.;Odom,T.W.;Lieber,C.M.Acc.Chem.Res.1999,32,435.(b)Hupp,J.T.;Poeppelmeier,K.R.Science 2005,309,2008.(2)(a)Huang,M.H.;Mao,S.;Feick,H.;Yan,H.;Wu,Y.;Kind,H.;Weber,E.;Russo,R.;Yang,P.Science 2001,292,1897.(b)Chen,J.;Xu,L.N.;Li,W.Y.;Gou,X.L.Ad V .Mater.2005,17,582.(3)(a)Tian,Z.;Tong,W.;Wang,W.J.;Duan,N.;Krishnan,V.V.;Suib,S.L.Science 1997,276,926.(b)Toberer,E.S.;Seshadri,R.Ad V .Mater.2005,17,2244.(4)(a)Chen,H.;He,J.Chem.Lett.2007,36,174.(b)Mao,Y.B.;Kanungo,M.;Benny,T.H.;Wong,S.S.;J.Phys.Chem.B 2006,110,702.(c)Lou,X.W.;Wang,Y.;Yuan,C.L.;Lee,J.Y.;Archer,L.A.Ad V .Mater.2006,18,2325.(d)Li,X.H.;Zhang,D.H.;Chen,J.S.J.Am.Chem.Soc.2006,128,8382.(e)Wang,S.T.;Feng,L.;Jiang,L.Ad V.Figure 7.HCHO conversion on control (9),honeycomb K x MnO 2nanospheres (70mg)(2),and hollow K x MnO 2nanospheres (50mg)(4),respectively.Figure 8.HCHO conversion per gram of samples on MnO x powder (2),OMS-2nanorods (4),honeycomb (b )and hollow (O )K x MnO 2nanospheres,respectively.Self-Assembly of Manganese Oxide Nanostructures J.Phys.Chem.C,Vol.111,No.49,200718037Mater.2006,18,767.(f)Caruso,F.;Spasova,M.;Susha,A.;Giersig,M.; Caruso,R.A.Chem.Mater.2001,13,109.(5)Cushing,B.L.;Kolesnichenko,V.L.;O’Connor,C.J.Chem.Re V. 2004,104,3893.(6)(a)Thackeray,M.M.Prog.Solid State Chem.1997,25,1.(b) Espinal L,Suib S L and Rusling J F.J.Am.Chem.Soc.2004,126,7676.(7)Armstrong,A.R.;Bruce,P.G.Nature1996,381,499.(8)Ammundsen,B.;Paulsen,J.Ad V.Mater.2001,13,943.(9)Winter,M.;Brodd,R.J.Chem.Re V.2004,104,4245.(10)Toupin,M.;Brousse,T.;Be´langer,D.Chem.Mater.2002,14,3946.(11)Cheng,F.Y.;Zhao,J.;Song,W.;Li,C.;Ma,H.;Chen,J.;Shen, P.Inorg.Chem.2006,45,2038.(12)Wills,A.S.;Raju,N.P.;Greedan,J.E.Chem.Mater.1999,11, 1510.(13)(a)Segal,S.R.;Park,S.H.;Suib,S.L.Chem.Mater.1997,9,98.(b)Greedan,J.E.;Raju,N.P.;Wills,A.S.;Morin,C.;Shaw,S.M.Chem. Mater.1998,10,3058.(14)Yamamoto,S.;Matsuoka,O.;Fukada,I.;Ashida,Y.;Honda.T.; Yamamotoy,N.J.Catal.1996,159,401.(15)(a)Yuan,J.K.;Li,W.N.;Gomez,S.;Suib,S.L.J.Am.Chem. Soc.2005,127,14184.(b)Yuan,J.;Laubernds,K.;Zhang,Q.;Suib,S.L. J.Am.Chem.Soc.2003,125,4966.(16)Li,Z.Q.;Ding,Y.;Xiong,Y.J.;Yang,Q.;Xie,mun. 2005,918.(17)(a)Ma,Y.;Luo,J.;Suib,S.L.Chem.Mater.1999,11,1972.(b) Feng,Q.;Kanoh,H.;Ooi,K.J.Mater.Chem.1999,9,319.(c)Golden,D.C.;Chen,C.C.;Dixon,J.B.Clays Clay Miner.1987,35,271.(18)Lina,A.A.;Dyer,A.;Harjula,R.J.Mater.Chem.2003,13,2963.(19)Aronson,B.J.;Kinser,A.K.;Passerini,S.;Smyrl,W.H.;Stein,A.Chem.Mater.1999,11,949.(20)Nakayama,M.;Konishi,S.;Tagashira,H.;Ogura,ngmuir 2005,21,354.(21)(a)Mori,S.;Chen,C.H.;Cheonq,S.W.Nature1998,392,473.(b)Ge,J.;Zhuo,L.;Yang,F.;Tang,B.;Wu,L.Z.;Tung,C.J.Phys. Chem.B2006,110,17854.(22)(a)Ahn,M.;Fillry,T.R.;Jafvert,C.T.;Nies,L.;Hua,I.;Cruz,J. En V iron.Sci.Technol.2006,40,215.(b)Barrett,K.A.;Mcbride,M.B. En V iron.Sci.Technol.2005,39,9223.(c)Sekine,Y.Atmos.En V iron.2002, 36,5543.(23)Gaillot,A.C.;Lanson,B.;Drits,V.A.Chem.Mater.2005,17, 2959.(24)Ching,S.;Roark,J.L.;Duan,N.;Suib,S.L.Chem.Mater.1997, 9,750.(25)Yang,X.;Tang,W.;Feng,Q.;Ooi,K.Cryst.Growth Des.2003, 3,409.(26)Omomo,Y.;Sasaki,T.;Wang,L.;Watanabe,M.J.Am.Chem. Soc.2003,125,3568.(27)Collins,J.J.;Ness,R.;Tyl,R.W.;Krivanek,N.;Esmen,N.A.; Hall,T.A.Regul.Toxicol.Pharm.2001,34,17.(28)(a)AÄlvarez-Galva´n,M.C.;de la Pen˜a O’Shea,V.A.;Fierro,J.L.G.;Arias,mun.2003,4,223.(b)Imamura,S.;Uchihori,D.;Utani,K.Catal.Lett.2004,24,377.(29)(a)Tang,X.F.;Huang,X.M.;Shao,J.J.;Liu,J.L.;Li,Y.G.; Xu,Y.D.;Shen,W.J.Chin.J.Catal.2006,27,97.(b)AÄlvarez-Galva´n, M.C.;Pawelec,B.;de la Pen˜a,O’Shea,V.A.;Fierro,J.L.G.;Arias,P. L.Appl.Catal.B:En V iron.2004,51,83.(30)Sinha,A.K.;Suzuki,K.;Takahara,M.;Azuma,H.;Nonaka,T.; Fukumoto,K.Angew.Chem.,Int.Ed.2007,46,2891.(31)Fessenden,R.J.;Fessenden,anic Chemistry;Willard Grant Press:Boston,MA,1979;p413.(32)(a)Zhang,C.;He,H.;Tanaka,mun.2005,6,211.(b)Zhang,C.;He,H.;Tanaka,K.Appl.Catal.B:En V iron.2006,65,37.(33)(a)Villalobos,M.;Lanson,B.;Manceau,A.;Toner,B.;Sposito,G.Am.Miner.2006,91,489.(b)Drits,V.A.;Silvester,E.;Gorshov,A.I.;Manceau,A.Am.Miner.1997,82,946.(34)(a)Zhong,L.;Hu,J.;Liang,H.;Cao,A.;Song,W.;Wan,L.Ad V. Mater.2006,18,2426.(b)Liu,B.;Zeng,H.C.J.Am.Chem.Soc.2004, 126,8124.(35)Caruso,F.;Caruso,R.A.;Mo¨hwald,H.Science1998,282,1111.(36)(a)Wang,D.;Song,C.;Hu,Z.;Fu,X.J.Phys.Chem.B2005, 109,1125.(b)Cao,A.;Hu,J.;Liang,H.;Wan,L.Angew.Chem.,Int.Ed. 2005,44,4391.(37)Lameiras,F.S.Mater.Res.1999,2,139.(38)He,J.;Kunitake,T.Soft Matter2006,2,119.(39)Wu,C.;Xie,Y.;Wang,D.;Yang,J.;Li,T.J.Phys.Chem.B2006, 107,13583.(40)Wang,X.L.;Yan,C.L.;Zou,L.J.;Xue,D.F.Inter.J.Nanosci. 2006,5,219.(41)Cheng,X.;Liu,S.;Lu,L.;Sui,X.;Meynen,V.;Cool,P.;Vansant,E.F.;Jiang,J.Microporous Mesoporous Mater.2006,98,41.(42)Huang,J.;Xie,Y.;Li,B.;Liu,Y.;Qian,Y.;Zhang,S.Ad V.Mater. 2000,12,808.(43)Sing,K.S.W.;Everett,D.H.;Haul,R.A.W.;Moscou,L.;Piertti, R.A.;Rouque`rol,J.;Siemieniewska,T.Pure Appl.Chem.1985,57,603.(44)Cellier,C.;Ruaux,V.;Lahousse,C.;Grange,P.;Gaigneaux,E. M.Catal.Today2006,117,350.18038J.Phys.Chem.C,Vol.111,No.49,2007Chen et al.。
VO2(A)纳米杆的水热合成、生长机理及光学特性魏宁;金城;熊狂伟;赵慧;金绍维【摘要】用V2O5和草酸作为初始原料,在水热条件下合成了VO2(A)纳米杆.通过改变初始的V2O5与草酸摩尔比以及反应时间制备纯相VO2 (A).样品的元素组成、微结构及光学性能分别被X射线光电子能谱(XPS)、X射线衍射(XRD)、扫描电镜(SEM)、差示扫描量热法(DSC)和傅里叶变换红外光谱(FT-IR)表征.实验结果表明合成VO2 (A)的最佳条件为:反应温度230℃、保温24 h以及V2O5对草酸摩尔比为1∶1.5.结合XRD数据与SEM图像,提出一个转变、自组装和重结晶过程解释了VO2 (A)纳米棒的形成过程.【期刊名称】《安徽大学学报(自然科学版)》【年(卷),期】2016(040)001【总页数】8页(P42-49)【关键词】钒氧化物;VO2(A);水热合成;相转变;红外光谱【作者】魏宁;金城;熊狂伟;赵慧;金绍维【作者单位】安徽大学物理与材料科学学院,安徽合肥230601;安徽大学物理与材料科学学院,安徽合肥230601;安徽大学物理与材料科学学院,安徽合肥230601;安徽大学物理与材料科学学院,安徽合肥230601;安徽大学物理与材料科学学院,安徽合肥230601【正文语种】中文【中图分类】O613.51Received date:2015-07-31Foundation item:Supported by the National Science Foundation of China (11174001,51402002),the Science Foundation of Anhui Education (KJ2013A030)Author’s brief:WEI Ning(1987-),male,born in Jinan of Shandong Province,master degree candidate of Anhui University;*JIN Shaowei (corresponding author),professor of Anhui University,doctoral student supervisor,E-mail:jinsw@.Vanadium dioxides,VO2is a typical binary compound with various polymorphs.The polymorphic configurations in this system include rutile-type VO2(R)[1],monoclinic VO2(M)[2],tetragonal VO2(A)[3],monoclinic VO2(B)[4],tetragonal VO2(C)[5],etc.Among all of VO2,more effort has been paid to rutile type VO2(R)because it undergoes a fully reversible metal-to-insulator transition(MIT)at 340K[2],which is closer to the ambient temperature compared to other compounds having thermochromic behavior that had been found [6].Associated with this transition is a structural distortion from a high temperature,rutile structure VO2(R)(P42/mnm,136)to a low temperature,monoclinic form VO2(M)(P21/c,14)[2],which has been studied abundantly for applications to smart windows[7-9].Except for the polymorphic of VO2(R)and VO2(M)structures,the metastable polymorphs of VO2,such as VO2(B),VO2(A),etc.are not frequently reported[10]. In recent years,VO2(B)has gained increasing attention because it is a potential candidate for the cathode in lithium cells forelectric vehicles.Studies revealed the layer structure of VO2(B)has highLi+intercalation performance[11-12].However,another layer structureof the metastable VO2(A)has limited study until now.One main reason is that the metastable of VO2(A)is usually missed during the preparationof VO2polymorphs.VO2(A)was firstly reported by Th obaldin the hydrothermal process ofV2O4-V2O5-H2O system,the crystal structure of VO2(A)had not been clarified until 1998[13].The thermal stability of VO2(A)indicates that VO2(A)transforms reversibly from low-temperature tetragonal VO2(A)(P4/ncc,130)to high-temperature body-center tetragonal VO2(AH)(I4/m,87)structure at 162℃. Recently,the synthesis condition of VO2(A)has been studied by some researchers via a hydrothermalroute.However,Ji et al.[14]used oxalic to reduce V2O5by a hydrothermal route to synthesis VO2(A)at 270℃.The filling ratio of the experimental procedure in Li’s group[15]was 80%.For ultra-long VO2(A)nanorods,Liu et al.[16]reported the hydrothermal treatment time was 48h.Thus a simple and effective method for preparing metastable of VO2(A)nanostructures is very essential for theoretical research and practical applications.In this paper,VO2(A)nanorods with about 10μm in length are prepared by one pot hydrothermal process in V2O5-H2C2O4-H2O system.The phases of VO2(B)and VO2(A),as well as their transformation can be controlled by varying both the molar ratio of V2O5to oxalic acid and reaction time at a lower temperature of 230℃for 24hwith a filling ratio of40%.The microstructure,phase transition and optical properties of theVO2(A)samples were carefully studied. A possible growth mechanism was proposed to explain the formation process of the VO2(A)nanorods.1.1 SynthesisVanadium pentoxide and oxalic acid(H2C2O4·2H2O)are of analytical grade and used without any further purification.In a typical synthesis,0.3g of V2O5(orange yellow)powder and 0.21-0.42 g of H2C2O4·2H2O were dispersed into 20mL of distilled water with vigorous stirring for about 30 min at room temperature.After,the mixed solution was transferred into a Teflon-lined autoclave(50 mL)with stainless steel shell(the filling ratio designated as fin the captions of the following figures is 0.4),which was sealed and sustained at 230℃for 2-60h,and then cooled to room temperaturenaturally.The precipitates were collected by filtering,washed with distilled water and ethanol alternately,and dried in an oven at70℃for 10hfor further characterization and measurement.1.2 CharacterizationX-ray photoelectron spectroscopy(XPS,ESCALAB-250)was used to identifiy the composition of the sample and the valence of the vanadium.The phase structure was determined by X-ray diffraction (XRD)with Philips X’Pert diffractometer(Cu Kαradiation,λ=1.540 6)at 40kV and 30mA. The morpholgys of the as-obtained samples were examined using scanning electron microscopy(SEM,S-4800).Differential scanning calorimetry(DSC)analysis were performed using a Q2000under a nitrogen gas flow with a scan rate of 10℃·min-1.Optical properties of VO2(A)nanorods were measured by Fourier transform infrared spectroscopy (FT-IR,Nicolet 8700)with an adapted heating controlled cell.Fig.1shows the typical XPS spectrum of the sample prepared at 230℃for 24hwith a molar ratio of 1∶1.5(V2O5/oxalic acid).No other element peaks except for those of V,O and C are observed on the survey spectrum(Fig.1a).The peak of C1sis ascribed to some carbon dioxides absorbed on the surfaces of the sample and can be disregarded.The spectrum of Fig.1bshows the peaks at 516.6,524.3and 530.4eV are attributed to the V2p2/3,V2p1/2and O1slevel,they are characteristics of vanadium in+4oxidation state and accord with the values of bulkVO2reported in literatures[17-18].For the obtained sample,theΔ(O1s-V2p2/3)value is 13.8eV,which is true of the reported value of V4+in literature[18],this confirms the vanadium valence to be+4oxidation state.Generally,the reaction temperature,reaction time,and the initial molar ratio of vanadium source to reducing agent under the hydrothermal conditions are greatly important for the VO2synthesis.Fig.2 shows the XRD patterns of the samples synthesized at temperature of 230℃after 24hwith different molar ratios of V2O5/oxalic acid(from 1∶1.2to 1∶1.8).The samples obtained at a molar ratio of 1∶1.2can be indexed to the metastable VO2(B)phase(JCPDS:31-1438)[19],it has gained increasing interest as a cathode material for lithium cells.Upon increasing the molar ratio to 1∶1.5,the isolated sample can be indexed to pure phase VO2(A)(JCPDS:42-0876)[3].As depicted in Fig.2c,the mostremarkable peaks belong to the(hk0)family,which strongly suggests a preferential growth along a specific orientation.When the molar ratios are raised to 1∶1.6and/or 1∶1.8,the obtained samples appear to be a mixof the original VO2(A)along with a prominent proportion of VO2(B).Such results reveal the initial molar ratio of V2O5/oxalic acid plays an important role in synthesizing high purity ofVO2(A).As shown in Fig.2,the preparation of phase-pure VO2(A)is only achieved in hydrothermal treatment at 230℃for 24hwith a molar ratio of 1∶1.5(V2O5/oxalic acid),where as the mix of VO2(A)and VO2(B)is observed below and above this optimum molar ratio.The SEM images of the samples corresponding to Fig.2(XRD)are depicted in the Fig.3. Analyzing the SEM images(Fig.3)and comparingthe results of XRD(Fig.2),one can draw the conclusion that the VO2(B)appeared as the short belt-like structures(Fig.3a),the VO2(A)appeared as the long rod-like structures(Fig.3c).Fig.4shows the XRD patterns of the samples obtained at 230℃for different reaction t imes under a molar ratio of 1∶1.5(V2O5/oxalic acid),which reveal the formation and evolution of the VO2(A)phase.From the diffraction pattern of the Fig.3a,it was observed that all peaks of the isolated sample after the reaction of 2hbelong to the VO2(B)phase.Upon increasing reaction time to 12h,the samples appear to bemix of the primary VO2(B)along with a noticeable proportion of theVO2(A).Further increasing the time to 36hor longer(such as,60h),the samples appear to be exclusively phase-pure of VO2(A).Thissuggests that the VO2(B)formed at 230℃after 2h,and then the VO2(A)phase was transformed from VO2(B)with the increase of thetime.Eventually,the pure VO2(A)formed after the reaction of 24h (Fig.3c).Galy[20]proposed that the phase transition VO2(B)→VO2(A)is just a crystallographic slip Cs=1/3[-100](001),occurring in the median plane of the double layers assembled by VO6octahedra of the VO2(B)[4].The morphological evolution of the samples prepared at 230℃for different reaction times under a molar ratio of 1∶1.5was depicted in Fig.5.The morphology of VO2(B)(Fig.5a)is short belt after the reaction of2h.With futher reaction,some short VO2(B)belts combine together,and assemble to the VO2(A)nanorods(Fig.5b).This combination occurs continuously,and the VO2(A)nanorods progressively elongate with increasing time to 36h(Fig.5c).Finally,the long VO2(A)nanorods with lengths up to tens of micrometers are formed after the reaction of60h(Fig.5d).Several benched surfaces and short rods attached to long rods can be clearly observed(Figs.3cand 5d).These are evidence of the self-assembled nanorods combining or attaching.Through the XRD patterns(Fig.4)and SEM images(Fig.5),it is found that the belt-like VO2(B)is the intermediate product to synthesize VO2(A)nanorods.A possible process for the formation of VO2(A)nanorods was schematically charted in Fig.6.(1)VO2(B)belts are fast formed by the hydrothermal reaction between V2O5and H2C2O4,as described in Figs.4aand 5a.(2)VO2(B)short belts transformed and assembled toVO2(A)nanorods,as depicted in Figs.4b-c and Fig.5b. (3)VO2(A)short rods are attached and recrystallized to long rods.(4)VO2(A)nanorods continue to grow with further prolonging the time(Figs.5c-d).Briefly,the formation of the VO2(A)nanorods can be described as the transformation,assembly,attaching and recrystallization process. Fig.7shows the DSC curves of the obtained samples with different molar ratios.In the DSC scan,the thermal behavior of the samples was performed when it was heated(from 20to 200℃)and then cooled(from 200to 20℃)at 10K·min-1.During the heating process,a single endothermic peak was observed at 168.3℃,it can be assigned to conversion of the primitive tetragonal VO2(A)into a body-centered tetragonal VO2(AH)structure.A wide exothermic peak is detected at 122.8℃on cooling,it is ascribed to the transformation of the VO2(AH)into the VO2(A)form.In previous studies,Oka et al.[21]reported a phase transition of the VO2(A)sample at 162℃only upon heating not on cooling from the DTA and magnetic susceptibility measurements.In our work,the transition temperature of 168.3℃for the VO2(A)nanorods raised about 6℃.The higher transition temperature and wide hysteresis loop can be considered to be due to the nonstoichiometry of VO2(A)nanorods and/or the scaling to nanoscale dimensions,as described inthe VO2(M)nanostructures[22]. There are no peaks detected in the heating and cooling process of VO2(B)because no structure transition occurs.The endothermic peak at 169.9℃for sample synthesized with a molar ratio of 1∶1.8may caus ed by the crystal boundary between VO2(B)and VO2(A).Contrast with the rutile VO2(R),the optical properties of VO2(A)in the infrared region(IR)are limited studied.The infrared spectra ofFig.8shows a clear process of the phase transition in the VO2(A)sample before and after the Tc(Transition temperature).It is clearly seen that as-prepared VO2(A)nanorods has optical switching property at absorption bands from 680to 660cm-1where its missing can be ascribed to the delocalisation of the electrons involving in the V4+-V4+bonds between VO6octahedra[16].It suggests the VO2(A)has potential application in optical switching devices.Two IR curves below Tc(one from the heating,the other from cooling)are basically coincided,revealing the phase transition of the VO2(A)nanorods has good reversibility.These optical properties indicate that the VO2(A)is a good candidate for the application of an infrared light switching material.VO2(A)nanorods were facilely prepared by hydrothermal approach using V2O5,oxalic acid and H2O as starting materials.The results reveal that the optimal synthesis condition of the VO2(A)nanorods is hydrothermal process at 230℃with a 1∶1.5molar ratio of V2O5to oxalic acid after 24h. An assembly,attaching and recrystallization mechanism is considered to be responsible for the formation of VO2(A)nanorods.An endothermic peak at 168.3℃on heating and an exothermal peak at122.8℃on cooling were detected in DSC curve for pure VO2(A)product.The infrared spectra indicate that the VO2(A)nanostructures can be used as the optical switching materials at bands from 680to 660cm-1.References:[1] EYERT V,HCK K H.Electronic structure of V2O5:role of octahedral deformations[J].Phys Rev B,1998,57(20):12727-12737.[2] MORIN F J.Oxides which show a metal-to-insulator transition at the neel temperature[J].Phys Rev Lett,1959,3(1):34-36.[3] OKA Y,YAO T,YAMAMOTO N.Powder X-ray crystal structure ofVO2(A)[J].J Solid State Chem,1990,86(2):116-124.[4] THOBALD F,BERNARDS J,CABALA R.Essai sur la structure de VO2(B)[J].J Solid State Chem,1976,17(4):431-438.[5] HAGRMAN D,ZUBIETA J,CHRISTOPHER J,et al.A new polymorph of VO2prepared by soft chemical methods[J].J Solid State Chem,1998,138(1):178-182.[6] MAENG J S,KIM T W,JO G H,et al.Fabrication,structural and electrical characterization of VO2nanowires[J].Mater Res Bull,2008,43(7):1649-1656.[7] KANG L T,GAO Y F,LUO H J.A novel solution process for the synthesis of VO2thin films with excellentthermochromic properties[J].ACS Appl Mater Interface,2009,1(10):2211-2218.[8] ZHANG Z T,GAO Y F,CHEN Z,et al.Thermochromic VO2thin film:solution-based processing,improved optical properties,and lowered phase transformation temperature[J].Langmuir,2010,26(13):10738-10741.[9] DAI L,CAO C X,GAO Y F,et al.Synthesis and phase transition behavior of undoped VO2with a strong nano-sizeeffect[J].Sol EnergyMater and Sol Cells,2011,95(2):712-715.[10] ZHANG S D,SHANG B,YANG J L,et al.From VO2(B)to VO2(A)nanobelts:first hydrothermal transformation,spectroscopic study and first principles calculation[J].Phys Chem Chem Phys,2011,13:15873-15881.[11] LIU H M,WANG Y G,WANG K X,et al.Design and synthesis of nanothorn VO2(B)hollow microsphere and their application in lithium-ion batteries[J].J Mater Chem,2009,19:2835-2840.[12]MILOˇSEVIC′S,STOJKOVC′I,KURKO S,et al.The simple one-step solvothermal synthesis of nanostructurated VO2(B)[J].Ceramics International,2012,38(3):2313-2317.[13] OKA Y,SATO S,YAO T,et al.Crystal Structures and transition mechanism of VO2(A)[J].J Solid State Chem,1998,141(2):594-598.[14] JI S D,ZHANG F,JIN F P.Selective formation of VO2(A)or VO2(R)polymorph by controlling the hydrothermal pressure[J].J Solid State Chem,2011,184(8):2285-2292.[15] LI M,KONG F Y,LI L,et al.Synthesis,field-emission and electric properties of metastable phase VO2(A)ultra-long nanobelts[J].Dalton Trans,2011,40:10961-10965.[16] LIU P C,ZHU K J,GAO Y F,et al.Ultra-long VO2(A)nanorods using the high-temperature mixing method under hydrothermal conditions:synthesis,evolution and thermochromic properties[J]. CrystEngComm,2013(15):2753-2760.[17] CHEN Y S,XIE K,LIU Z X.Determination of the position of V4+as minor component in XPS spectra by difference spectra[J].Appl Surf Sci,1998,133(4):221-224.[18] MENDIALDUA J,CASANOVA R,BARBAUX Y.XPS studies of V2O5,V6O13,VO2and V2O3[J].J Electron Spectrosc Relat Phenom,1995,71(3):249-261.[19] OKA Y,YAO T,YAMAMOTO N,et al.Phase transition and V4+-V4+paring in VO2(B)[J].J Solid State Chem,1993,105(1):271-278.[20] GALY J.A proposal for(B)VO2(A)VO2Phase transition:a simple crystallographic slip[J].J Solid State Chem,1999,148(2):224-228. [21] OKA Y,OHTANI T,YAMAMOTO N,et al.Phase transition and electrical properties of VO2(A)[J].J Ceram Soc Jpn,1989,97(10):1134-1137.[22] WHITT AKER L,JAYE C,FU Z G,et al.Depressed phase transitionin solution-grown VO2nanostructures[J].J Am Chem Soc,2009,131(25):8884-8894.。
α2/β2M nO 2的水热合成及其催化性能杨则恒3 宋欣民 张卫新 王 华 汪 芳(合肥工业大学化工学院 合肥230009)摘 要 以K M n O 4为锰源,抗坏血酸为还原剂,通过水热法于相同的反应体系分别合成了α2Mn O 2和β2Mn O 2纳米棒,采用XRD 和TE M 测试技术对合成产物进行了表征。
结果表明,在抗坏血酸与K Mn O 4摩尔比为1∶5的酸性水热反应体系中,反应温度和时间是影响合成产物的重要因素。
在150~160℃反应12h 得到α2Mn O 2纳米棒,而在170℃反应24h 则得到β2Mn O 2纳米棒。
以酸性品红(F A )为模拟污染物评估了所制备Mn O 2样品的催化活性。
结果显示,α2Mn O 2和β2Mn O 2纳米棒对H 2O 2氧化降解酸性品红均有良好的催化活性,且催化性能明显优于相应的块体材料。
其中,β2Mn O 2纳米棒的催化活性最高,反应60m in 酸性品红脱色率即达到9716%。
关键词 水热法,纳米Mn O 2,酸性品红,催化活性中图分类号:O611.4;O643.3 文献标识码:A 文章编号:100020518(2008)01200132042007202205收稿,2007205226修回国家自然科学基金(20576024)和安徽省自然科学基金(070414165)资助项目通讯联系人:杨则恒,男,副教授;E 2mail:yangzh0219@sina .com;研究方向:无机纳米功能材料合成及应用不同的合成方法可以制备出不同晶体结构和形貌的纳米MnO 2,在性能上也存在差异[1~4]。
MnO 2晶体,由于具有由正八面体MnO 6单元通过顶点或边相连构成的孔道或层状结构[5],有良好的分子吸附特性,能够应用于催化化学反应[6]。
作为新型环保催化剂,纳米MnO 2在H 2O 2分解[7]、亚甲基蓝降解[8]、苯酚的湿法氧化[9]等反应中得到了应用。
铀掺杂纳米ZnO的制备及其光催化性能研究摘要:以ZnSO4.7H2O和硝酸铀为原料。
采用溶胶凝—胶法制备了纳米级的Ni/ZnO光催化剂,并用XRD和SEM手段进行表征,以甲基橙光催化降解作为模板反应,对所制备的催化剂催化性能进行了评价,考察了制备催化剂最佳工艺条件和催化剂投加量,光照时间对甲基橙降解率的影响。
结果表明:————————————————————————————————————————————————————————————————————————————————————————————————关键词:溶胶—凝胶法;制备;Eu掺杂;光催化The Preparation and Peoperty Research on Doping Eu Nanosized ZnO PhotocatalystSong Qing(department of Chem.&Eng,Baoji University of Arts and Sciences,Baoji Shannxi 721013) Abstract:nanosized Ni/ZnO was prepared from zinc sulphate and ammonium metavanadate by sol-gel method .The structural properties of the catalystrized by means of XRD and TEM techeniques____________________________________________________________________ ____________________________________________________________________ ___________________________________Key words: sol-gel method ;preparation; ni doped; photocatalysis引言氧化锌是一种重要的宽禁带、直接带隙(3.37eV)半导体材料。
合成、表征、钛纳米光催化活动surface-decorated氧化锌纳米粒子的eJournal of Hazardous Materials 161(2009)49–54Synthesis,surface-decorated a r t i c l e i n f o Article history:Received 3January 2008Received in revised form 11March 2008Accepted 11March 2008Available online 22March 2008Keywords:Titanate nanotube Zinc oxide Photocatalysis Recycle usea b s t r a c tNanoscaled zinc oxide (ZnO)particles with different amounts are coated on titanate nanotubes (TNTs)by a facile chemical method at room temperature.The characterizations of XPS,TEM,XRD and UV–visspectra con?rm that pure hexagonal wurtzite ZnO nanoparticles with an average size of about 9nm are distributed on the surfaces of TNTs evenly and attachedstrongly.The photocatalytic activities of the ZnO–TNTs nanocomposite are superior to those of P25,ZnO,TNTs and ZnO–anatase TiO 2(TNP)nanocom-posite in the oxidation of rhodamine B under UV light irradiation.A comparison of thephotocatalytic activities between different catalysts is discussed.Furthermore,we also ?nd that the ZnO–TNT nanocom-posite shows very favorable recycle use potential,because they have a high sedimentationrate and their photocatalytic activity is only slightly decreased even after ?ve times of repeated uses.2008Elsevier B.V.All rights reserved.1.IntroductionRecently,titanates with one-dimensional (1D)TiO 2nanostruc-tures such as nanotubes,nanowires and nano?bers [1–4]have attracted a lot of attention due to their signi?cant potential appli-cations.Among 1D titanate nanostructures,titanate nanotubes(TNTs),which are of layer structure with a hollow cavity,pos-sess unique physicochemical properties and have become one of the most promising materials in various ?elds [5,6].A great development has been achieved in the study of synthesis and the structure of these nanotubes [7–10].In the past few years,increas-ing interests have being focused on the TNTs decorated with activecatalysts,including metal ions and semiconductors in the appli-cation of catalysis process,such as photocatalysis,electrocatalysisand photoelectrocatalysis [11–13].In fact,the high cation-exchangecharacter as well as the particular tubularstructure makes TNTs very suitable to act as the substrate and carrier for different cata-lysts that need to be immobilized.Furthermore,the decoration ofenzymes [14],nanoparticles [15,16]and metal ion [17]with TNTs has resulted in better catalysis activities,because the unique phys-ical properties of TNTs,such as open mesoporous morphology andhigh speci?c surface area,make the reagentseasier to transport dur-ing the catalytic reaction [5].All these interesting properties of TNTs encourage us to investigate it as a support for different catalysts.Correspondingauthor.Tel.:+862088586766;fax:+862087112631.E-mail address:****************.cn(L.S.Wang).Recently,ZnObecomes one of the most widely studied multi-functional nanocrystalline semiconductors and attracts attention for its wide range of applications,such as solar cells,lumines-ZnO–TNTs nanocomposite.Firstly,the high cation exchange prop-2+0304-3894/$–see front matter ?2008Elsevier B.V.All rights reserved.doi:10.1016/j.jhazmat.2008.03.080证实纤锌矿附着适合回收潜在沉淀速率空洞活跃催化剂电催化光电催化阳离子交换特性管状基体载体固定化修饰介孔试剂50L.S.Wang et al./Journal of Hazardous Materials 161(2009) 49–54Fig.1.(a)XPS survey spectra of TNTs (I)and ZnO–TNTs (II),(b)Ti 2p XPS spectra of ZnO(20wt.%)–TNTs,(c)Zn 2p XPS spectra of ZnO(20wt.%)–TNTs.more,the recycle of ZnO–TNTs is more convenient and no obvious decrease in the photocatalytic activity is observed for the recycled ZnO–TNTs.2.Experimental2.1.Reagents and measurementZinc acetate,sodium hydroxide and RhB were of analytical reagent grade purchased from Guangzhou Chemical Reagents Factory (Guangzhou,China)and used without further puri?cation.Deionized water was used in all aqueous solution preparations and washings.2.2.Synthesis2.2.1.Titanate nanotubes synthesisTNTs were prepared following the literature procedure[32].Brie?y,2g of commercial anatase TiO 2nanoparticles (TNP)was added to 50mL of 10M NaOH solution and heated for 24h at 130?C in a Te?on-lined autoclave.After cooled naturally in air,the mixture was centrifuged at a speed of 4000rpm and the precipitates were collected.The white powder was thoroughly washed with water then with 0.1M HCl,followed by vacuum drying at 70?C.2.2.2.Preparation of ZnO–TNTs nanocompositeThe ZnO–TNTs nanocomposite was synthesized by the following method.Stoichiometric amount of pure TNTs and zinc acetate was dispersed in 50mL absolute ethanol by stirring for 6h.Then the absolute ethanol solution of sodium hydroxide (50mL,0.2M)was gradually added with vigorous stirring at room temperature.After the mixture was stirred for 10h,a white precipitate was obtained.Then the white powder was collected by centrifugation and then washed several times with deionized water and ethanol for several times.In addition,the ZnO–TNP was prepared by using in a similar way in order to make a comparison of the photocatalytic properties with that of the ZnO–TNTs.2.3.Characterizations X-ray photoelectron spectroscopy (XPS)measurements were done with AXis Ultra DLD (Kratos).The powder X-ray diffraction (XRD)patterns were recorded using an XD-3A Cu K ?X-ray diffrac-Fig. 2.X-ray diffraction patterns of (a)TNTs,(b)ZnO(10wt.%)–TNTs,(c)ZnO(20wt.%)–TNTs and (d)ZnO nanoparticles.L.S.Wang et al./Journal of Hazardous Materials161(2009)49–5451Fig.3.TEM images of samples(a)as-prepared TNTs,(b)ZnO(10wt.%)–TNTs nanocomposite,(c)ZnO(20wt.%)–TNTs nanocomposite,(d)ZnO(30wt.%)–TNTs nanocomposite, (e)high magni?cation images showing the single ZnO particle is supported on nanotubes and(f)EDX of ZnO(20wt.%)–TNTs nanocomposite.tometer( =15.418?A,Japan).Transmission electron microscope (TEM)measurement was conducted using a JEM-2010HR(JEOL Co. Ltd.).The UV–vis spectra were checked by a UV3100spectropho-tometer(Shimadzu Co.,Kyoto,Japan).2.4.Photocatalytic activity measurementsAll the photocatalytic experiments were performed in200mL hollow cylindrical photoreactor equipment equipped with a glass water jacket(Prexy).A300-W high-pressure mercury lamp was positioned in the inner part of the photoreactor and cooling water circulated through the water jacket surrounding the lamp.The average light intensity in the solution was about8mW cm?2. Batch experiments were conducted at30?C.In a typical reac-tion,150mL of12mg L?1RhB solution and200mg photocatalysts was added in reactor under the magnetic stirring for15min in dark?rstly and then the mercury lamp was turned on.At regular irradiation time intervals,the dispersion was sampled(3mL)and centrifuged to separate the samples.The residual RhB concentra-tion was detected by UV–vis.For cycling use experiments,after the ZnO–TNTs nanocomposite were separated from suspended solu-tion by sedimentation for1h,we removed the upper clear solution, and then the ZnO–TNTs nanocomposite were dispersed in150mL RhB aqueous solution for another cycling use.3.Results and discussion3.1.Characterizations of ZnO–TNTs nanocomposite3.1.1.XPS analysisXPS measurements were performed to determine the chemical composition of the prepared samples and the valence states of var-ious species.Fig.1a shows the XPS survey spectra of pure TNTs and ZnO–TNTs nanocomposite.It can be seen that theobvious peaks化学组成价态检测光谱52L.S.Wang et al./Journal of Hazardous Materials 161(2009) 49–54Fig.4.UV–vis spectra of (a)TNTs and ZnO–TNTs nanocomposite with different ZnO concentrations (b)10wt.%,(c)20wt.%and (d)30wt.%.mainly attribute to the Ti,O and C element.For the TNTs coated with ZnO,the additional peaks of the Zn 2p appear in the survey spectra of the ZnO–TNTs nanocomposite.These XPS spectra can serve as an evidence for the formation of ZnO–TNTs nanocomposite and indi-cate that the nanocomposite contain not only Ti,O and C elements but also Zn element,which is the component of ZnO molecules.The high-resolution XPS spectra in Fig.1b and c shows the charac-teristic peaks of Ti 2p and Zn 2p of ZnO–TNTs nanocomposite.The binding energy peaks located at 1021.3and 1044.1eV are attribute to the spin–orbit splitting of the Zn 2p components,which are in good agreement with those of zinc oxide powder (Fig.1c)[33].Sim-ilarly,the peaks located at 456.8and 462.6eV are attribute to the spin–orbit splitting of theTi 2p components,which are in good agreement with the titanium(IV)species (Fig.1b)[34].Therefore,it is evident that the zinc and titanium in the nanocomposite are present in the 2-valent state and 4-valent state,respectively.3.1.2.XRD analysis and TEM imagesThe XRD pro?le for TNTs,ZnO(10wt.%)–TNTs,ZnO(20wt.%)–TNTs and pure ZnO samples are displayed in Fig.2We can observe that the characteristic XRD patterns for TNTs and ZnO crystallites are visible in the nanocomposite.The obvious peaks of TNTs are found at 24.4?,28.2?and 48.2?corresponding to (110),(310)and (020)crystal planes,respectively [35–38].Meanwhile,there are additional peaks at angles (2?)of 31.7?,34.4?,36.2?,56.5?,62.8?and 67.5?,which could be assigned to the ZnO phase (100),ZnO–TNTs nanocomposite coated with different amounts of ZnO.The typical morphologies of the as-prepared TNTs are displayed in Fig.3a.The TEM images show that the TNTs present uniform distribution in an average diameter of 10nm with a layered struc-ture,and the hollow nature of tubes opening on both ends can also be observed clearly.A single nanotube is multi-layed wall with an inter shell spacing of 0.8nm and 5–6nm in the inner diameter.The morphologies of TNTs change greatly after TNTs are decorated with ZnO particles.Fig.3b–d shows the representative TEM images of the nanotubes after the decoration with different concentration of ZnO nanoparticles.It can be seen that most of the nanosized ZnO nanoparticles are distributed on the surfaces of TNTs evenly and densely and only a small amount of ZnO are encapsulated in theFig.5.Effect of illumination time on the degradation of RhB when using different catalysts.cavity of TNTs.In addition,the amount of ZnO nanoparticles formed on TNTs varies and more ZnO nanoparticles surround the surface of TNTs with the increase of Zn 2+ions concentration.These images indicate that the morphology of ZnO–TNTs nanocomposite can be changed by adjusting the concentrations of the precursors.Fig.3e depicts an HRTEM image demonstrating that the ZnO nanoparticles are adsorbed on the walls of TNTs and the ZnO nanocrystals have dimensions of about 9nm,which is consistent with the analysis of XRD data.The EDX in Fig.3f con?rm the elemental compositionof Zn and also show the signals of copper,titanium and oxygen originated from copper grid and TNTs.3.1.3.UV–vis diffuse re?ection spectroscopyThe UV–vis diffuse re?ection spectra of TNTs,ZnO(10wt.%)–TNTs,ZnO(20wt.%)–TNTs and ZnO(30wt.%)–TNTs samples are present in Fig.4.As shown in Fig.4,the maximum adsorption wavelengths of TNTs and ZnO(10wt.%)–TNTs are 360and 385nm, indicating an obvious red shift of ZnO–TNTs composite comparedwith TNTs.In addition,it also has been found that the slight red shift occurs with the increase of the concentration of ZnO decorated onTNT.It has been reported that wavelength of the absorption edge of ZnO and TiO 2was 391and 365nm,respectively [41].Therefore,the light absorption scopeof ZnO–TNTs nanocomposite is enlarged when compared with TNTs due to the existence of ZnO that modi?es the opticalabsorption edge.3.2.Photocatalytic activity of ZnO–TNTs nanocompositeThe kinetic curves of the photocatalytic RhB degradation with different catalysts in the presence of O 2through magnetic stirring are shown in pared with the pure TNTs,P25and ZnO pho-tocatalysts,enhanced photocatalytic properties of the ZnO–TNTs nanocomposite can be observed as expected.The results of higher photocatalytic activity are primarily attributed to the coupling effect of TNTs and ZnO particles.Fig.6shows the mechanistic scheme of the charge separation and photocatalytic reaction for ZnO–TNTs photocatalysts [42–44].As illustrated in this scheme,the photo-generated electrons inject into the conduction band of TNTs from that of the excited ZnO nanoparticles.On the other hand,the transfer of photo-generated hole also occurs from the valence band of TNTs to that of ZnO similarly.Such an ef?cient charge separa-tion increases the lifetime of the charge carriers and enhances the ef?ciency of the interfacial charge transfer to adsorbed substrates.Thus,the photocatalytic properties increase because the possibili-ties of recombination between photo-generated electron and hole 紫外可见漫反射光谱信号铜钛格红移复合材料比较微小波长吸收限范围L.S.Wang et al./Journal of Hazardous Materials 161(2009)49–5453Fig.6.A schematic diagram illustrating the principle of charge separation and pho-tocatalytic activity for the ZnO–TNTs system.Fig.7.Photocatalytic activity of ZnO–TNTs nanocomposite with different ZnO con-tent.are reduced through facilitating their separation.In addition,we also ?nd that the photocatalytic activity of ZnO–TNTs is higher than ZnO–TNP with the same fraction of ZnO in RhB degradation accord-ing to pared with ZnO–TNP,it indicated that the larger surface area as well as the unique tubular structure of TNTs might facilitate the moving of photo-produced electron and the contact of organic molecules,which are both bene?cial for the degradation reaction [45].Fig.7shows that the photocatalytic activity of ZnO–TNTs nanocomposite is related to the content of ZnO coated on TNTs.Fig.8.Sedimentation for 1h in aqueous suspensions of (a)ZnO (20wt.%)–TNTs,(b)TNP,(c)TNTs and (d)P25(concentration:0.5g/L,ultrasonic treatment for 15min).Fig.9.Photocatalytic activity of the ZnO(20wt.%)–TNTs nanocomposite for RhB degradation with three times of cycling uses.Inset:overall degradation rate constant k vs.times of cycling uses for RhB degradation of ZnO(20wt.%)–TNTs photocatalysts.When the proportion of ZnO is low (10wt.%),the effect of charge separation induced by ZnO is not obvious because of the insuf?-ciency of ZnO.However,when the concentration of ZnO increases to 30wt.%,quite a number of ZnO nanoparticles would surround some active sites of TNTs and hinder the contact between TNTs and oxygen contained species,which result in the decrease of pho-tocatalytic properties.According to Fig.7,the ZnO(20wt.%)–TNTs nanocomposite is considered as the optimal ZnO content among the prepared nanocomposite at differentquantity of ZnO nanoparticles.As well known,the spherical catalysts powders with small size present a superior activity due to the large surface-to-volume ratios.However,in a particular photocatalytic process,the sepa-ration of these powdered photocatalysts from suspended solution after reaction could be very dif?cult for the recycle use.The pho-tocatalysts of titanate nanotubes have taken an advantage over spherical powder catalysts for separating catalysts by sedimenta-tion [46].In our experiment,one of the advantages of ZnO–TNTs is that they may be conveniently separated to recycle the catalysts.According to Fig.8,the TNTs and ZnO–TNTs nanocomposite sed-imentated from an aqueous suspension in 1h,while the aqueous suspension of P25and TNP is still relatively turbid.In addition,the catalytic activity of the repeated ZnO–TNTs nanocomposite is also studied.As shown in Fig.9,after a ?ve-time recycling of ZnO–TNTs nanocomposite,there is still appreciable degradation of RhB in the aqueous solution upon irradiation.In fact,the rate constant in the photocatalytic activity for the repetitive uses of the same ZnO–TNTs photocatalysts has no obvious reduction.4.Conclusion In summary,the ZnO–TNTs nanocomposites with different amount of ZnO have been synthesized by a simple chemical method at room temperature.The obtained ZnO–TNTs nanocomposite is characterized by different methods,including XPS,TEM,XRD and UV–vis absorption measurements.As expected,the ZnO–TNTs nanocomposite exhibits higher activity for photodegradation of RhB than pure TNTs,P25and ZnO.Furthermore,the ZnO–TNTs nonocomposites are also easy to recycle for photocatalytic purpose in that their activity remains similar after ?ve repeated cycles.The ZnO–TNTs nanocompositewith the properties of higher photocat-alytic activity and easier separation for recycle use show promising prospect as photocatalysts for the degradation of organic pollutant from water in future industrial application.54L.S.Wang et al./Journal of Hazardous Materials161(2009)49–54AcknowledgmentsThis work is supported by the National Natural Science Founda-tion of China(No.20475018)and the Nature Science Foundation of Guangdong(No.07006544).References[1]H.Tokudome,M.Miyauchi,Electrochromism of titanate-based nanotubes,Angew.Chem.Int.Ed.44(2005)1974–1977.[2]n,X.P.Gao,H.Y.Zhu,Z.F.Zheng,T.Y.Yan,F.Wu,S.P.Ringer,D.Y .Song,Titanatenanotubes and nanorods prepared from rutile powder,Adv.Funct.Mater.15 (2005)1310–1318.[3]A.R.Armstrong,G.Armstrong,J.Canales,P.G.Bruce,TiO2–B nanowires,Angew.Chem.Int.Ed.43(2004)2286–2288.[4]H.Y.Zhu,X.P.Gao,n,D.Y.Song,Y.X.Xi,J.C.Zhao,Hydrogen titanatenano?bers covered with anatase nanocrystals:a delicate structure achieved by the wet chemistry reaction of the titanate nano?bers,J.Am.Chem.Soc.126 (2004)8380–8381.[5]D.V.Bavykin,J.M.Friedrich,F.C.Walsh,Protonated titanates and tio2nanostruc-tured materials synthesis,properties,and applications,Adv.Mater.18(2006) 2807–2824.[6]A.Thorne,A.Kruth,D.Tunstall,J.T.S.Irvine,W.Z.Zhou,Formatio n,structure,and stability of titanate nanotubes and their proton conductivity,J.Phys.Chem.B109(2005)5439–5444.[7]X.M.Sun,X.Chen,Y.D.Li,Large-scale synthesis of sodium and potassiumtitanate nanobelts,Inorg.Chem.41(2002)4996–4998.[8]B.D.Yao,Y.F.Chan,X.Y.Zhang,W.F.Zhang,Z.Y.Yang,N.Wang,Fo rmation mech-anism of TiO2nanotubes,Appl.Phys.Lett.82(2003)281–283.[9]R.Ma,Y.Bando,T.Sasaki,Nanotubes of lepidocrocite titanates,Chem.Phys.Lett.380(2003)577–582.[10]S.Zhang,L.M.Peng,Q.Chen,G.H.Du,G.Dawson,W.Z.Zhou,F ormation mech-anism of H2Ti3O7nanotubes,Phys.Rev.Lett.91(2003)256103.[11]J.R.Li,Z.L.Tang,Z.T.Zhang,H-titanate nanotube novel lithium intercalation hostwith large capacity and high rate capability,mun.7(2005) 62–67.[12]D.V.Bavykin,pkin,P.K.Plucinski,L.T.Murciano,J.M.Frie drich,F.C.Walsh,Deposition of Pt,Pd,Ru and Au on the surfaces of titanate nanotubes,Top.Catal.39(2006)151–159.[13]A.Ghicov,H.Tsuchiya,J.M.Macak,P.Schmuki,Annealing effects on the pho-toresponse of TiO2nanotube,Phys.Stat.Sol.203(2006)R28–R30.[14]J.P.Qu,X.G.Zhang,Y.G.Wang,C.G.Xie,Electrochemical reduction of CO2onRuO2/TiO2nanotubes composite modi?ed Pt electrode,Electrochim.Acta50 (2005)3576–3580.[15]L.T.Murciano,pkin,D.V.Bavykin,F.C.Walsh,K.Wilson, Highly selectivePt/titanate nanotube catalysts for the double-bond migration reaction,J.Catal.245(2007)272–278.[16]V.Idakiev,Z.Y.Yuan,T.Tabakova,B.L.Su,Titanium oxide nanotubes as supportsof nano-sized gold catalysts for low temperature water–gas shift reaction,Appl.Catal.A281(2005)149–155.[17]T.Akita,M.Okumura,K.Tanaka,K.Ohkuma,M.Kohyama,T.Ko yanagi,M.Date,S.Tsubota,M.Haruta,Transmission electron microscopy observation of the structure of TiO2nanotube and Au/TiO2nanotube catalyst,Surf.Interf.Anal.37 (2005)265–269.[18]H.Zhang,D.R.Yang,X.Y.Ma,Y.J.Ji,J.Xu,D.L.Que,Synthesis of?ower-like ZnOnanostructures by an organic-free hydrothermal process,Nanotechnology15 (2004)622–626.[19]P.D.Yang,H.Q.Yan,S.Mao,R.Russo,J.Johnson,R.Saykally,N. Morris,J.Pham,R.R.He,H.J.Choi,Controlled growth of ZnO nanowires and their optical prop-erties,Adv.Funct.Mater.12(2002)323–331.[20]H.Kind,H.Q.Yan,B.Messer,w,P.D.Yang,Nanowire ultraviolet photode-tectors and optical switches,Adv.Mater.14(2002)158–160.[21]T.Gao,Q.H.Li,T.H.Wang,Sonochemical synthesis,optical properties,and elec-trical properties of core/shell-type ZnO nanorod/CdS nanoparticle composites, Chem.Mater.17(2005)887–892.[22]V.Sukharev,R.Kershaw,Concerning the role of oxygen in photocatalyticdecomposition of salicylic acid in water,J.Photochem.Photobiol.A98(1996) 165–169.[23]N.Serpone,P.Maruthamuthu,P.Pichat,E.Pelizzetti,H.Hidaka ,Exploiting theinterparticle electron transfer process in the photocatalyzed oxidation of phe-nol,2-chlorophenol and pentachlorophenol:chemical evidence for electron and hole transfer between coupled semiconductors,J.Photochem.Photobiol.A85(1995)247–255.[24]X.Fu,L.A.Clark,Q.Yang,M.A.Anderson,Enhanced photocatalytic performanceof titania-based binary metal oxides:TiO2/SiO2and TiO2/ZrO2,Environ.Sci.Technol.30(1996)647–653.[25]S.G.Yang,Q.Xie,X.Y.Li,Y.Z.Liu,S.Chen,G.H.Chen,Preparation ,characterizationand photoelectrocatalytic properties of nanocrystalline Fe2O3/TiO2,ZnO/TiO2, and Fe2O3/ZnO/TiO2composite?lm electrodes towards pentachlorophenol degradation,Phys.Chem.Chem.Phys.6(2004)659–664.[26]X.M.Sun,Y.D.Li,Synthesis and characterization of ion-exchangeable titanatenanotubes,Chem.Eur.J.9(2003)2229–2238.[27]D.V.Bavykin,som,F.Marken,D.H.Kim,D.H.Marsh,D.J. Riley,F.C.Walsh,K.H.El-Abiary,pkin,A novel cation-binding TiO2nanotube substrate for electro-and bioelectro-catalysis,mun.7(2005)1050–1058.[28]Y.X.Yu,D.S.Xu,Single-crystalline TiO2nanorods:highly active and easily recy-cled photocatalysts,Appl.Catal.B73(2007)166–171.[29]M.Hodos,E.Horv′ath,H.Haspel,′A.Kukovecz,Z.K′onya,I.Kiri csi,Photosensi-tization of ion-exchangeable titanate nanotubes by CdS nanoparticles,Chem.Phys.Lett.399(2004)512–515.[30]H.Li,B.L.Zhu,Y.F.Feng,S.R.Wang,S.M.Zhang,W.P.Huang,Synthesis,characterization of TiO2nanotubes-supported MS(TiO2NTs@MS,M=Cd,Zn) and their photocatalytic activity,J.Solid State Chem.180(2007)2136–2142.[31]L.R.Hou, C.Z.Yuan,Y.P.Peng,Synthesis and photocatalytic property ofSnO2/TiO2nanotubescomposites,J.Hazard.Mater139(2007)310–315.[32]T.Kasuga,M.Hiramatsu,A.Hoson,T.Sekino,K.Niihara,Formation of titaniumoxide nanotube,Langmuir14(1998)3160–3163.[33]S.S.Kim,J.H.Yum,Y.E.Sung,Flexible dye-sensitized solar cells using ZnO coatedTiO2nanoparticles,J.Photochem.Photobiol.A171(2005)269–273.[34]C.Huang,X.Liu,L.Kong,n,Q.Su,Y.Wang,The structuraland magneticproperties of Co-doped titanate nanotubes synthesized under hydrothermal conditions,Appl.Phys.A87(2007)781–786.[35]C.C.Tsai,H.S.Teng,Structural features of nanotubes synthesized from NaOHtreatment on TiO2with different post-treatments,Chem.Mater.18(2006) 367–373.[36]D.V.Bavykin,V.N.Parmon,pkin,F.C.Walsh,The effect of hydrothermalconditions on the mesoporous structure of TiO2nanotubes,J.Mater.Chem.14 (2004)3370–3377.[37]Q.Chen,W.Z.Zhou,G.H.Du,L.M.Peng,Trititanate nanotubes made via a singlealkali treatment,Adv.Mater.14(2002)1208–1211.[38]J.J.Yang,Z.S.Jin,X.D.Wang,W.Li,J.W.Zhang,S.N.Zhang,X.Y.Y ong,Z.J.Zhang,Study on composition,structure and formation process of nanotube Na2Ti2O4(OH)2,Dalton Trans.20(2003)3898–3901.[39]C.L.Wu,X.L.Qiao,J.G.Chen,H.S.Wang,F.T.Tan,S.T.Li,A novel chemical routeto prepare ZnO nanoparticles,Mater.Lett.60(2006)1828–1832.[40]X.P.Gao,Z.F.Zheng,H.Y.Zhu,G.L.Pan,J.L.Bao,F.Wu,D.Y.Song, Rotor-like ZnOby epitaxial growth under hydrothermal conditions,mun.12(2004) 1428–1429.[41]W.Wu,Y.W.Cai,J.F.Chen,S.L.Shen,A.Martin,L.X.Wen,Prepar ation and prop-erties of composite particles made by nanozinc oxide coated with titanium dioxide,J.Mater.Sci.41(2006)5845–5850.[42]D.L.Liao,C.A.Badour,B.Q.Liao,Preparation of nanosized TiO2/ZnO compos-ite catalyst and its photocatalytic activity for degradation of methyl orange,J.Photochem.Photobiol.A194(2008)11–19.[43]D.Robert,Photosensitization of TiO2by M x O y and M x S y nanoparticlesfor heterogeneous photocatalysis applications,Catal.Today122(2007)20–26.[44]M.W.Xiao,L.S.Wang,Y.D.Wu,X.J.Huang,Z.Dang,Preparatio n and charac-terization of CdS nanoparticles decorated into titanate nanotubes and their photocatalytic properties,Nanotechnology19(2008)015706.[45]J.C.Xu,M.Lu,X.Y.Guo,H.L.Li,Zinc ions surface-doped titanium dioxide nan-otubes and its photocatalysis activity for degradation of methyl orange in water, J.Mol.Catal.226(2005)123–127.[46]H.Y.Zhu,n,X.P.Gao,S.P.Ringer,Z.F.Zheng,D.Y.Song,J.C.Z hao,Phasetransition between nanostructures of titanate and titanium dioxides via simple wet-chemical reactions,J.Am.Chem.Soc.127(2005)6730–6736.。
Yiying Wu (吴屹影)The Ohio State University Phone: (614) 247-7810 Department of Chemistry Fax: (614)-292-1685 100 W 18th Avenue E-mail:***********************.edu Columbus, OH 43210EDUCATION:Dec. 2002 Ph.D. in Chemistry, University of California at Berkeley.Advisor: Prof. Peidong Yang.June. 1998 B.S. in chemical physics, University of Science and Technology of China.EMPLOYMENT:2005-present Assistant Professor, Chemistry Department, The Ohio StateUniversity. Interest: nanostructured functional materials.2003-2005 Postdoctoral Researcher, University of California at Santa Barbara, Department of Chemistry and Biochemistry, Advisor: Prof. Galen D.Stucky.HONORS:2010 NSF-CAREER Award2008 Cottrell Scholar Award, Research Corporation2001 MRS Graduate Student Silver Award, Boston.2001-2002Cal@Silicon Valley Fellowship, University of California at Berkeley. PROFESSIONAL MEMBERSHIPS:2001 American Chemical Society2001 Materials Research SocietyPUBLICATION LIST:u=undergraduate, g=graduate student, p=postdoc, s=senior personnel, *=corresponding author45. Y. Li g, G. Natu g, Y. Wu*. “LiFePO4/Graphene Composite as the CathodeMaterial for High-Power Lithium Ion Batteries” submitted to Nano Letters(2010).44. P. Hasin g, M. A. Alpuche-Aviles p, Y. Wu*.“Electrocatalytic activity ofgraphene multilayers towards I-/I3-: effect of preparation conditions andpolyelectrolyte modification” submitted to J. Physical Chemistry C (2010).43. G. Natu g, Y. Wu*. “Photoelectrochemical Study of the Ilmenite Polymorph ofCdSnO3 and its Photoanodic Application in Dye-Sensitized Solar Cells” J.Physical Chemistry C, accepted (2010).42. Y. Li g, P. Hasin g, Y. Wu*. “Ni x Co3-x O4 Nanowire Arrays for ElectrocatalyticOxygen Evolution”, Advanced Materials, accepted (2010).41. J. Baxter s, G. Chen s, D. Daniielson s, M. S. Dresselhaus s*, A. G. Fedorov s*, T. S.Fisher s, C. W. Jones s, E. Maginn s, U. Kortshagen s, A. Manthiram s, A. Nozik s, D.Rolison s, T. Sands s, L. Shi s*, D. Sholl s, Y. Wu s. “Nanoscale Design to Enablethe Revolution in Renewable Energy”, Energy & Environmental Science. 2(6), 559 (2009)40. Y. Li g, Y. Wu*. “Coassembly of Graphene Oxide and Nanowires for Large-Area Nanowire Alignment”, J. Am. Chem. Soc.131(16) 5851-5857 (2009).39. M. A. Alpuche-Aviles p, Y. Wu*. “Photoelectrochemical Study of the Bandstructure of Zn2SnO4Prepared by the Hydrothermal method”, J. Am. Chem.Soc.131(9) 3216-3224 (2009).38. P. Hasin g, M. A. Alpuche-Aviles p, Y. Li g, Y. Wu*. “Mesoporous Nb-dopedTiO2 as Pt Support for Counter Electrode in Dye-Sensitized Solar Cells”, J.Phys. Chem. C. 113(17) 7456-7460 (2009).37. Y. Li g, Y. Wu*. “Formation of Na0.44MnO2 nanowires via stress-inducedsplitting of birnessite nanosheets”,Nano Research, 2(1): 54-60 (2009). 36. Y. Li g, B. Tan p, Y. Wu*. "Mesoporous Co3O4 Nanowire Arrays for LithiumIon Batteries with High Capacity and Rate Capacity", Nano Letters, 8:265-270 (2008).35. Y. Li g, B. Tan p, Y. Wu*. "Ammonia-Evaporation-Induced Synthetic Methodfor Metal (Cu, Zn, Cd, Ni) Hydroxide/Oxide Nanostructures", Chem.Mater.20: 567-576 (2008).34. B. Tan p, E. Toman u, Y. Li g, Y. Wu*, "Zinc Stannate (Zn2SnO4) Dye-SensitizedSolar Cells", J. Am. Chem. Soc. 129(14), 4162 (2007).33. Y. Li g, B. Tan p, Y. Wu*, "Freestanding mesoporous quasi-single-crystallineCo3O4 nanowire arrays", J. Am. Chem. Soc. 128(44), 14258-14259 (2006)(highlighted by Nature Nanotech. (Oct. 2006)).32. B. Tan p, Y. Wu*, “Dye-Sensitized Solar Cells Based on Anatase TiO2Nanoparticle/Nanowire Composites”, J. Phys. Chem. B110: 15932-15938(2006).(Postdoc work)31. A. Thomas, M. Schierhorn, Y. Wu, G. Stucky, “Assembly of SphericalMicelles in 2D Physical Confinements and Their Replication intoMesoporous Silica Nanorods”, J. Mater. Chem. 17: 4558-4562 (2007). 30. M. Moskovits, D.H. Jeong, T. Livneh, Y.Y. Wu, G.D. Stucky, "Engineeringnanostructures for single-molecule surface-enhanced Raman spectroscopy", Isreal Journal. of Chemistry, 46: 283-291 (2006).29. Y. Zhang , J. Christofferson, A. Shakouri, D. Li, A. Majumdar, Y. Wu, R. Fan,P. Yang, “Characterization of heat transfer along Si Nanowire”, IEEETransactions on Nanotechnology, 5, 67 (2006).28.J. F. Wang, C.-K. Tsung, R. C. Hayward, Y. Wu, G. D. Stuck. “Single-crystal mesoporous silica ribbons”, Angew. Chem. Int. Ed.44: 332-336 (2005).27.Y. Wu, G. S. Cheng, K. Katsov, S. W. Sides, J. F. Wang, J. Tang, G. H.Fredrickson, M. Moskovits, G. D. Stucky, “Composite mesostructures bynano-confinement”, Nature Materials3, 816-822 (2004). (Highlighted byScience306, 943 (2004)).26.Y. Wu, T. Livneh, Y. X. Zhang, G. S. Cheng, J. F. Wang, J. Tang, M.Moskovits, G. D. Stucky, “Templat ed synthesis of highly orderedmesostructured nanowires and nanowire array”, Nano Letters 4, 2337(2004) (cover story).25.J. F. Wang, C.-K. Tsung, W. B. Hong, Y. Wu, J. Tang, G. D. Stucky,"Synthesis of mesoporous silica nanofibers with controlled porearchitectures", Chem. Mater. 16, 5169 (2004).24.J. Tang, Y. Wu, E. W. McFarland, G. D. Stucky, “Synthesis andphotocatalytic properties of highly crystalline and ordered mesoporousTiO2 thin films”, Chem. Comm. (14), 1670-1671 (2004).(Graduate work)23.A. R. Abramson, W. C. Kim, S. T. Huxtable, H. Q. Yan, Y. Wu, A. Majumdar,C.-K. Tien, P.D. Yang, "Fabrication and characterization of ananowire/polymer-based nanocomposite for a prototype thermoelectricdevice", Journal of Microelectromechanical Systems, 13(3), 505 (2004).).22.D. Y. Li, Y. Wu, R. Fan, P. D. Yang, A. Majumdar, “Thermal conductivity ofSi/SiGe longitudinal heterostructure nanowires” Appl. Phys. Lett. 83(15),3186 (2003).21.D. Y. Li, Y. Wu, P. Kim, L. Shi, N. Mingo, Y. Liu, P. D. Yang, A. Majumdar,“Thermal conductivity of individual silicon nanowires” Appl Phys. Lett.83(14), 2934 (2003).20.R. Fan, Y. Wu, D. Y. Li, M. Yue, A. Majundar, P. D. Yang, “Fabrication ofSilica Nanotube Arrays from Vertical Silicon Nanowire Templates”, J. Am.Chem. Soc.125(18), 5254-5255 (2003).19.Y. N. Xia, P. D. Yang, Y. Sun, Y. Wu, B. Mayers, B. Gates, Y. D. Yin, F. Kim,H. Yan, “One-dimensional Nanostructures: Synthesis, Characterization, andApplications”, Adv. Mater. 15(5), 353-389 (2003).18.Y. Wu, R. Fan, P. D. Yang, "Block-by-block growth of single-crystallineSi/SiGe superlattice nanowires", Nano letters, 2, 83 (2002).17.Y. Wu, H. Yan, M. Huang, B. Messer, J. Song, P. D. Yang, “Inoragnicsemiconductor nanowires: rational growth, assemblies and novel properties”, Chemistry, Euro. J., 8, 1260 (2002).16.Y. Wu, H. Yan, P. D. Yang, "Semiconductor nanowire array: potentialsubstrates for photocatalysis and photovoltaics", Topics in Catalysis, 19(2), 197 (2002).15.B. Gates, B. Mayers, Y. Wu, Y. Sun, B. Cattle, P. D. Yang, Y. N. Xia,“Synthesis and characterization of crystalline Ag2Se nanowires through atemplate-engaged reaction at room temperature”, Adv. Func. Mater. 12(10), 679-686 (2002).14.P. D. Yang, Y. Wu, R. Fan, “Inorganic semiconductor nanowires”,International Journal of Nanoscience,1(1), 1-39 (2002).13.B. Zheng, Y. Wu, P. D. Yang, J. Liu, “Synthesis of ultra-long and highly-oriented silicon oxide nanowires from alloy liquid”, Adv. Mater. 14, 122(2002).12.Y. Wu, P. D. Yang, “Direct observation of vapor-liquid-solid nanowiregrowth”, J. Am. Chem. Soc. 123, 3165 (2001).11.Y. Wu, B. Messer, P. D. Yang, "Superconducting MgB2 nanowires", Adv.Mater.13, 1487 (2001).10.Y. Wu, P. D. Yang, “Melting and welding semiconductor nanowires innanotubes”, Adv. Mater. 13, 520 (2001).9.M. Huang, S. Mao, H. Feick, H. Yan, Y. Wu, H. Kind, E. Weber, R. Russo, P.D. Yang, "Room-temperature ultraviolet nanowire nanolasers", Science,292, 1897 (2001).8.M. Huang, Y. Wu, H. Feick, N. Tran, E. Weber, P. D. Yang, “Catalytic growthof zinc oxide nanowi res through vapor transport”, Adv. Mater. 13(2), 113(2001).7.J. Song, Y. Wu, B. Messer, H. Kind, P. D. Yang, "Metal nanowire formationusing Mo3Se3- as reducing and sacrificing templates", J. Am. Chem. Soc.123, 10397 (2001).6. B. Gates, Y. Wu, Y. Yin, P. D. Yang, Y. D. Xia, “Single-crystalline nanowiresof Ag2Se can be synthesized by templating against nanowires of trigonalSe”, J. Am. Chem. Soc. 123, 11500 (2001).5.J. Song, B. Messer, Y. Wu, H. Kind P. D. Yang, "MMo3Se3 (M=Li+, Na+, Rb+,Cs+, NMe4+) nanowire formation via cation exchange in organic solution",J. Am. Chem. Soc. 123, 9714 (2001).4.Y. Li, J. Wang, Z. Deng, Y. Wu, X. Sun, S. Fan, D. Yu, P. D. Yang, “Bismuthnanotubes: a rational low-temperature synthetic route”, J. Am. Chem. Soc.123, 9904 (2001).3.Y. Wu, P. D. Yang, “Germanium/carbon core-sheath nanostructures”, Appl.Phys. Lett. 77, 43 (2000).2.Y. Wu, P. D. Yang, “Germanium nanowire growth via simple vapor transport”,Chem. Mater. 12, 605 (2000).1. B. Messer, J. H. Song, M. Huang, Y. Wu, F. Ki m, P. Yang, “Surfactantinduced mesoscopic assemblies of inorganic molecular chains”, Adv.Mater. 12, 1526 (2000).GRANTS and AW ARDS:9/07-8/10 Department of Energy, “Designing nanoparticle/nanowire composites and "nanotree" arrays as electrodes for efficient dye-sensitized solarcells”, $750,000 total9/06-9/08 Petroleum Research Fund PRF-43833, “Functional nanocrystal-nanowire composite materials: synthesis and electron transportproperties”, $35,000 total.7/08- Research Co rporation (Cottrell Scholar Award), “Searching for New Electrode Materials and Nanostructured Architectures for EfficientDye-Sensitized Solar Cells”; $100,000 total.2/10-2/15 NSF-CAREER, “Black Cobalt Oxide Nanowire Arrays: Synthesis, Properties, and Ene rgy Applications”; $575,000 totalINVITED PRESENTATIONS:Conferences/Workshops/Symposia16. FACCS conference, Lousville, KY, October 19, 2009.15. IMR Materials Week, Ohio State Unversity, August 31 – September 3, 2009.14. North American Solid State Conference, Ohio State University, June 17-20,2009.13. Central Regional Meeting of the American Chemical Society, Cleveland, May20-23, 2009.12. Materials Research Society meeting, San Francisco, April 13-17, 2009.11. Indo-US Workshop on nanoscale materials and interfaces, Purdue University,10-12 March 2009.10. Nanoparticles in Energy Applications Workshop, Argonne National Lab, Feb.23, 2009.9. ASME Heat transfer, Fluids, Energy Sustainability and Nanotechnology,Jacksonville, FL, Aug. 12, 20088. Central Regional Meeting of American Chemical Society, Columbus, OH,June 13, 20087. 35th Annual Spring Symposium, Michigan Chapter of the American VacuumSociety, Toledo, Oh, May 28, 20086. Wright Center PVIC Semi Annual meeting, Columbus, OH, April 17, 2008 5. 235th ACS National Meeting, New Orleans, LA, April 9, 20084. SPIE Optics East, Boston, MA, Sept. 9-12, 20073. Advanced Materials Workshop, Dalian, China, June 23-24, 20072. 223rd ACS national meeting, Chicago, IL, March 25-28, 20071. 41st ACS Midwest Regional Meeting, Quincy, IL, Oct. 25-27, 2006 Universities/Colleges13. IUPUI, Department of Mechanical Engineering, February 4, 2010.12. UC Davis, Department of Chemistry, January 5, 2010.11. University of Michigan, Department of Chemistry, October 30, 2009.10. Penn State University, Department of Chemistry &MRSEC, October 5, 2009.9. Purdue University, Department of Chemistry, September 16, 2009.8. The Ohio State University, ENCOMM, February 13, 20097. The Ohio State University, Department of Chemistry, January 14, 2009 (4th-year review).6. Indiana University, Department of Chemistry, April 22, 2008.5. Miami University, Department of Chemistry and Biochemistry, February 7,2008.4. Ohio University, Condensed matter and surface science seminar, May 17,2007.3. OSU, Department of Materials Science and Engineering, April 6, 2007.2. OSU, Department of Biomedical Engineering, February 2007.1. Kent State University, Department of Chemistry, September 22, 2005. PATENTS:4. “Graphene Compo sites as the Cathode Material of High-Power Lithium IonBatteries”, U.S. provisional patent, OSU1159-288A (2010).3. “Fluidic Nanotubes and Devices”, Patent No. US 7,355,216 B2 (April 8, 2008) 2. “Sacrificial Template Method of Fabricating a Nanotube”, Pa tent No.: US7,211,143 B2 (May 1, 2007).1. “Methods of fabricating nanostructures and nanowires and devices fabricatedtherefrom”, Patent N0.: WO02080280 (2002).LAB PERSONNEL:Present:Postdoctoral Associates:Dr. Dan Wang (May 2009-present)Graduate Students:Yanguang Li (5th year, Ph.D candidate); Panitat Hasin (3nd year); Gayatri Natu (3nd year); Ishika Sinha (3nd year); Tushar Kabre (2st year);。
Defects in ZnO Nanorods Prepared by a Hydrothermal MethodK.H.Tam,†C.K.Cheung,†Y.H.Leung,‡A.B.Djurisˇic´,*,†C.C.Ling,†C.D.Beling,†S.Fung,†W.M.Kwok,‡W.K.Chan,‡D.L.Phillips,‡L.Ding,§and W.K.Ge§Department of Physics,The Uni V ersity of Hong Kong,Pokfulam Road,Hong Kong,Department of Chemistry,The Uni V ersity of Hong Kong,Pokfulam Road,Hong Kong,and Department of Physics,The Hong KongUni V ersity of Science and Technology,Clear Water Bay,Hong KongRecei V ed:May26,2006;In Final Form:July18,2006ZnO nanorod arrays were fabricated using a hydrothermal method.The nanorods were studied by scanningelectron microscopy,photoluminescence(PL),time-resolved PL,X-ray photoelectron spectroscopy,and positronannihilation spectroscopy before and after annealing in different environments and at different temperatures.Annealing atmosphere and temperature had significant effects on the PL spectrum,while in all cases thepositron diffusion length and PL decay times were increased.We found that,while the defect emission canbe significantly reduced by annealing at200°C,the rods still have large defect concentrations as confirmedby their low positron diffusion length and short PL decay time constants.1.IntroductionFabrication of ZnO nanostructures1-4and the optical proper-ties of ZnO3-15have been extensively studied.Among the various methods for fabrication of ZnO nanostructures,the hydrothermal method1-4is of particular interest since it is a low cost,environmentally friendly method with growth tem-peratures as low as90°C.As a natural consequence of solution-phase growth at low temperature,the as-grown nanorods have large defect concentrations and typically exhibit weak UV but prominent defect emission at room temperature.3,4While the morphology and orientation of the nanorods can be significantly improved by using the ZnO seeds prepared from zinc acetate solution instead of ZnO nanoparticles,1improvements of their optical quality have not been investigated in detail.While it has been shown that the room-temperature photoluminescence (PL)spectra of nanorods can be changed by annealing under different conditions,3,15other techniques have not been used to conduct a comprehensive investigation of the effects of anneal-ing on their properties.It is generally assumed that a large UV to visible emission ratio implies excellent quality of the ZnO nanostructures,but typically,no other techniques are used to verify whether the defect density is indeed low.In addition, the origin of the visible emission is highly controversial.16ZnO can exhibit different emissions in the visible range(violet,blue, green,yellow,and orange-red)which are associated with defects in the material.Green emission is the most commonly observed defect emission in ZnO.However,there is still no consensus on the origin of this emission,and a number of different hypotheses have been proposed.16The possibility that green emissions in different samples can have different origins despite similar position and width has also been proposed.16If this is indeed the case,then the origin of the defect emission cannot be postulated simply by noting the similarities with previously published spectra for ZnO prepared by other fabrication methods.Therefore,considerable interest exists in studying the defect emissions in ZnO in general and ZnO nanorod arrays in particular due to their great potential for practical applications. Since applications of nanorod arrays in optoelectronic devices require control of their emission properties,it is necessary to perform a comprehensive study of their optical properties. Here,we report an investigation of the properties of ZnO nanorods using field emission scanning electron microscopy (SEM),variable temperature PL,time-resolved PL,X-ray photoelectron spectroscopy(XPS),and positron annihilation spectroscopy(PAS).We show that PL spectra do not provide sufficient evidence of defect density in the material.Contrary to common assumption,it is possible to have strong UV emission and weak defect emission and still have considerable defect concentrations in the sample.Thus,to fully characterize sample properties,other measurements in addition to PL spectroscopy are necessary.2.Experimental SectionThe nanorod arrays were prepared from solutions of zinc nitrate hydrate and hexamethylene tetramine on Si substrates with a seed layer prepared from zinc acetate solution.1Poly-ethyleneimine was added to the solution to increase the nanorod aspect ratio.2The morphology of the nanorods before and after annealing was examined using a Leo1530field emission SEM. The rods were annealed in a tube furnace at temperatures200, 400and600°C.The annealing atmospheres were air(atmo-spheric pressure,relative humidity∼55-60%),argon,nitrogen, and forming gas(90%N2/10%H2).For annealing in a gas flow, the gas flow rate was0.1Lpm and the pressure was∼1Torr. For variable temperature PL measurements,samples were mounted at the coldfinger and placed in a closed-cycle He cryostat(APD Cryogenics,Inc.model HC-2).The excitation source was a HeCd laser(325nm).The spectra were dispersed by a spectrometer SPEX500M and recorded by a photo-multiplier tube R943and PDA-512-USB(Control Development Inc.)fiberoptic spectrometer.Time-resolved PL was measured by using the Kerr-gated fluorescence technique17with1ps*To whom correspondence should be addressed.Tel:+852********. E-mail:dalek@hkusua.hku.hk.†Department of Physics,The University of Hong Kong.‡Department of Chemistry,The Univeristy of Hong Kong.§Department of Physics,The Hong Kong University of Science and Technology.20865J.Phys.Chem.B2006,110,20865-2087110.1021/jp063239w CCC:$33.50©2006American Chemical SocietyPublished on Web09/20/2006excitation pulses at 267nm.The decay times have been determined by fitting the decay curves monitored at the peak position of the UV emission (∼380nm).The decay times of the visible emission were considerably longer,of the order of nanoseconds,and thus could not be reliably determined,but it should be noted that annealing may affect both UV and visible emission decay times.It should also be noted that the ratios of emission peaks measured in different PL systems may be different due to the dependence of UV to defect emission ratio on excitation intensity.However,excitation intensity does not affect the peak positions.XPS spectra were obtained using PAL 102XPS,and the position of the carbon C 1s peak (285.0eV)was taken as a reference.In the positron annihilation experiments,low-energy positrons were focused to a ∼1mm diameter spot on the sample under magnetic guidance and the implantation energy of the positrons was varied between 0and 25keV.The principles of PAS have been reviewed in detail in refs 18and 19.The positrons implanted into the sample bulk would be rapidly thermalized and undergo diffusion.The diffusing positrons can be trapped by the neutral or negatively charged open volume defects or by the positron shallow traps (i.e.,ionized acceptors or disloca-tions).The positron would thus finally annihilate at the delocalized state or the localized defect state with a surrounding electron and emit a pair of gamma photons (511keV),which contain information about the electronic environment in which the positron annihilates.The Doppler broadening technique used in the present PAS study monitored the Doppler broadening of the 511keV annihilation radiation to obtain the so-called S parameter,which was defined as the ratio of the fixed central region of the 511keV annihilation peak to the total area of the peak.The measured S parameter represents a linear combination of the corresponding annihilation states,that is,S )Σf i S i ,where f i and S i are the fraction and the characteristic S parameter of the positrons annihilating at a state i .Thus,the measured S parameter is related to the fraction of positrons annihilating with the valence electrons.Because a positron annihilating from the trapped vacancy state usually has a higher overlap with the valance electrons which possess higher momentum with respect to the core electrons,the S parameter corresponding to the positron annihilating in the defect state is higher than that in the delocalized bulk state.On the other hand,the positron annihilating from the shallow trap state experiences a very similar electronic environment to the bulk and thus the corre-sponding S parameter is indistinguishable from the bulk value.Effective positron diffusion length L eff +,which is related to the mobility of the positron,was another parameter that could offer information of the positron trapping process,since trapping in a vacancy state or a shallow trap state reduces the L eff +value.The experimental data for “low-momentum”S parameter S (E )were fitted by the computer program VEPFIT,20taking into account positron implantation,positron diffusion,and positron annihilating at different possible sites.Relevant parametersobtained by positron annihilation experiments for ZnO nanorods (as-grown and annealed at different conditions)are summarized in Table 1.3.Results and Discussions3.1.Electron Microscopy Characterization.Figure 1shows the morphology of ZnO nanorods.It can be observed that the rods are ∼800nm long with diameters in the range from 55to 70nm,while the rod density is of the order of several hundred rods per µm 2.SEM images do not indicate significant changes of the nanorod morphology after annealing.To obtain better information on the nanorod structure and morphology,TEM measurements have been performed and the obtained results are shown in Figure 2.All of the rods grow along the [0001]direction.It can be observed that annealing in an oxidative environment (air,oxygen)does not affect the morphology of the nanorods but annealing in a reducing environment (forming gas)causes some surface damage and thinning of the rods.3.2.Photoluminescence and Positron Annihilation Spec-troscopy.While electron microscopy can provide information on overall morphology and structure of the nanorods,other experimental techniques are needed to study point defects.Thus,PL,time-resolved PL,PAS,and XPS have been used to examine the defects in ZnO nanorod arrays before and after annealing.It can be observed that annealing significantly affects the optical properties of the nanorods.Photoluminescence spectra have been measured at different temperatures to obtain more information about the nature of point defects in the rods.At low temperature,ZnO typically exhibits sharp bound exciton lines,commonly labeled I 0-I 11,6which correspond to the excitons bound to different donor and/or acceptor defects.The low-temperature (12K)PL spectra of the as-grown nanorods and nanorodsTABLE 1:Comparison of Properties of ZnO Nanorods Annealed under Different Conditions aannealing conditions L eff +(nm)S PL decay times O 1/Zn O 1/O 2(O 1+O 2)/Znnone2.80.54726ps,30ps 0.440.69 1.07600°C,air 140.54626ps,49ps 0.410.64 1.04600°C,oxygen 150.55421ps,47ps 0.390.58 1.05600°C,nitrogen 390.55626ps,61ps 0.420.46 1.35600°C,Ar280.55431ps,63ps 0.460.55 1.31600°C,forming gas 200.55726ps,120ps 0.320.29 1.41200°C,forming gas 50.56824ps,74ps 0.410.58 1.11400°C,forming gas240.55423ps,57ps0.440.411.50aThe areas of XPS peaks have been adjusted by the sensitivity factors,0.733for oxygen and 2.768forZn.Figure 1.Representative SEM image of the ZnO nanorods:(a)top view and (b)side view.20866J.Phys.Chem.B,Vol.110,No.42,2006Tam et al.annealed in different atmospheres exhibit considerable differ-ences,as shown in Figure 3.The spectra have been normalized for easier comparison of peak positions and peak widths.It can be observed that the as-grown nanorods exhibit a broad,asymmetric,featureless emission with a maximum at 3.379eV and a full-width at half-maximum (fwhm)of 25meV.Broad,featureless emission is expected in the case of a large defect concentration since energy band instead of discrete defect levels would be formed.On the other hand,the annealed samples exhibit sharp and narrow donor-bound exciton peaks.For all annealing conditions,the spectra are dominated by donor-bound exciton peaks,but the peak positions and consequently the identities of the donors are different.The PL intensity of the UV emission is also considerably enhanced after annealing,in agreement with the increase in the decay time (see Table 1).For annealing in air,the main peak is located at 3.364eV (fwhm )6meV)with a small shoulder at 3.369eV.The forming gas-annealed sample exhibits a peak at 3.366eV (fwhm )7meV)and a shoulder at 3.371eV,while the sample annealed in Ar shows only a peak at 3.366eV (fwhm )6meV).The sampleannealed in nitrogen exhibits a slightly broader peak with a fwhm of 9meV,which is centered at 3.368eV.All of the observed peaks are in good agreement with previously reported donor-bound exciton lines.6The weak peak at ∼3.337eV is likely a two-electron satellite of the donor-bound exciton peak or possibly related to excitons bound to structural defects.5To obtain more information about the nature of defects in the nanorods,we performed detailed investigation on the influence of annealing in an oxidative (air)and a reducing (forming gas)environment.Figure 4shows the variable tem-perature PL spectra of as-grown nanorods (parts a and b of Figure 4),nanorods annealed in air (parts c and d of Figure 4),and nanorods annealed in forming gas (parts e and f of Figure 4).It can be observed that the UV emission intensity is the lowest for as-grown nanorods and the highest fornanorodsFigure 2.Representative TEM images of ZnO nanorods:(a)as-grown,(b)annealed in forming gas at 600°C,(c)annealed in air at 600°C,and (d)annealed in oxygen at 600°C.The insets show corresponding HRTEMimages.Figure 3.12K PL spectra of ZnO nanorods annealed in different atmospheres.The spectra have been normalized for easier comparison of peakpositions.Figure 4.Temperature dependence of the UV and defect emission for ZnO nanorods (a and b)no annealing,(c and d)annealed in air,and (e and f)annealed in forming gas.ZnO Nanorods Prepared by a Hydrothermal Method J.Phys.Chem.B,Vol.110,No.42,200620867annealed in forming gas.The PL intensity in the UV spectral range at12K in the case of as-grown nanorods is∼67times smaller than that of nanorods annealed in forming gas(600°C) and∼41times smaller than that of nanorods annealed in air (600°C).We can also clearly observe different behavior of defect emissions with temperature.As-grown nanorods exhibit a peak shift and decreasing intensity of the defect emission with increasing temperature.After annealing in air at600°C,red and green emission peaks can be observed.The red emission decreases significantly with increasing temperature,while green emission intensities remain similar at all temperatures.After annealing in forming gas,there is no change in green emission intensity up to∼150K and then there is a small increase at 200and300K.Both green and red emissions show a negligible peak shift with increasing temperature.A different dependence on measurement temperature of the defect emissions observed indicates different origins of these emissions.It should also benoted that although emergence of the red band has been previously reported for ZnO single crystals annealed in air,16 the temperature dependence of the green and red bands was different from the one observed in nanorods.While the green emission in air-annealed ZnO single crystal quenched rapidly above200K,16this was not the case for ZnO nanorods.In addition,the dependence of green emission intensity on tem-perature cannot be described by the commonly used expressions since it does not decrease with increasing temperature.On the other hand,red and yellow defect emission intensities decrease with increasing temperature as expected.The PL emission intensity temperature dependence is usually described with21,22where R is the process rate parameter,E T is the activation energy,k is the Boltzmann constant,and T is temperature.The expression with two different activation energies E T1and E T221-23is also commonly used.Equation2can be used to describe two competitive nonradiative channels21or to describe different behaviors in low-temperature and high-temperature regions.22,23 The value of the activation energy dominant at low temperatures, E T1,is commonly very low.22,23One possible interpretation of this is that such a low value would be expected to occur as a result of donor ionization in the case of a donor-acceptor pair emission.22However,it has been shown that the small values of E T1are a consequence of T-2temperature dependence of the capture section for carriers at recombination centers.22 Figure5shows the temperature dependence of the emission intensity of the yellow and red bands(yellow for as-grown rods, red for rods annealed in air and forming gas).The temperature dependences can be fitted with eq2.For E T1,small values(∼6 meV for as-grown and rods annealed in air and16meV for rods annealed in forming gas)are obtained,in agreement with the literature.22Thermal activation energies E T2were253meV for yellow emission,47meV for red emission of samples annealed in air,and209meV for red emission of samples annealed in forming gas.For both annealing atmospheres,the emission in the visible spectral range could be decomposed into two Gaussian peaks,one in the red and one in the green spectral region.However,different activation energies indicate that despite the similarities of peak positions,the samples annealed in different atmospheres have very different nonradiative recombination rates and consequently different types and concentrations of point defects.The same conclusion can be reached from the comparison of the decay times of the UV emission(Table1).It should also be noted that,for the sample annealed in forming gas,there is an increase in green emission after the red emission is quenched(opposite to the air-annealed ZnO single crystals,where quenching of green emission leads to the rise in red emission16)which indicates possible competi-tion for holes between two different acceptor levels.16A similar phenomenon is also observed for blue and yellow defect emission bands in GaN.24The difference in temperature behavior of two different GaN samples(increase vs no increase of emission from one channel after the decrease of emission from the other channel),similar to that observed in air-and forming gas-annelaed ZnO nanorods,was explained by the differences in nonradiative recombination rates between the two samples.24 We have also investigated the influence of annealing tem-perature on the PL spectra.The room-temperature PL spectra for nanorods annealed in air and forming gas flow are shown in parts a and b of Figure6,while the comparisons between different annealing atmospheres at200and600°C are shown in parts c and d of Figure6.As-grown nanorods exhibit the UV emission peak and the broad yellow defect emission.They also have short PL decay times and a very short effective positron diffusion length.Since the effective positron diffusion length represents a measure of how much positrons trap into all of the defects,including both trapping and scattering defects, the short diffusion length for the as-grown sample is in good agreement with its poor luminescent properties.On the other hand,the S parameter is sensitive only to certain types of trapping defects,which in ZnO are Zn vacancy and vacancy clusters or complexes because O vacancy represents a weakly bound state similar to the ionized acceptor and the dislocation.25 Thus,the corresponding S parameter would not differ signifi-cantly from the bulk state.25This implies that a large measured S parameter would be associated with more positron events originating from the Zn vacancy and/or the vacancy cluster.On another hand,a low value of L eff+implies that more positrons are trapped in the various kinds of defects in ZnO,namely,O vacancy,Zn vacancy,vacancy cluster,and ionized acceptors. The high value of the S parameter and the short diffusion length in ZnO nanorods as compared with that of the ZnO epilayer grown on sapphire(measured to be0.502(0.002and76(1I(T))I1+R exp(-ET/kT)(1)I(T))I1+R1exp(-ET1/kT)+R2exp(-ET2/kT)(2)Figure5.Temperature dependence of the intensities of different visibleluminescence lines in ZnO.20868J.Phys.Chem.B,Vol.110,No.42,2006Tam et al.nm)indicate that there is a large concentration of the vacancy type defects in the samples.With the increase of annealing temperature,the positron diffusion length L eff +increases and so do the decay times obtained from time-resolved measurements.All of the samples exhibit biexponential decay,and the slow component exhibited a substantial increase after annealing,as shown in Table 1.After annealing at 200°C,the ratio of UV to visible emission is improved,with samples annealed in forming gas showing negligible defect emission,which is commonly considered as an indication of excellent crystal quality and low defect concentration.However,although L eff +has been increased after annealing at 200°C,it is still considerably lower than that of samples annealed at higher temperatures which exhibit larger defect emission.Also,annealing the samples in N 2,Ar,oxygen,or forming gas results in a higher value of the S parameter implying more Zn vacancy or vacancy cluster formation.However,the increase of the S parameter upon annealing in these samples was accompanied by the increase of L eff +,which could only be explained by the decrease in concentrations of weakly binding positron states such as O vacancy,ionized acceptor,or dislocations.It was plausible to conclude that annealing the samples in N 2,Ar,oxygen,and forming gas would have the effect of increasing the concentrations of Zn vacancy and/or vacancy cluster and decreasing the concentrations of O-vacancy,ionized acceptor,and/or dislocation.For the case of annealing in air,the S parameter had no significant change and L eff +increased with respect to the as-grown one,which implied no change in Zn vacancy/vacancy cluster concentration,while the concentration of weakly binding positron traps was slightly decreased.However,there is no obvious,direct relation-ship between the L d +and PL decay times,in agreement with a previous study on ZnO epitaxial layers.26Positron annihilation experiments also exhibit a lack of obvious correlation with visible emission,in agreement with a previous study which assigned visible emission to interstitial defects (zinc for green and oxygen for yellow emissions).27Imperfect correlation between L d +and radiative lifetime may indicate that crystal imperfections play a significant role in obtained results,similar to GaN where imperfect correlation between L d +and dislocation density,as well as the radiative lifetime and dislocation density,was found.28The lack of obvious relationship between L d +and the PL decay times is likely due to the large number of possible defects in ZnO.While L d +is a measure of total defect concentration,UV emission PL decay times are sensitive to defects which participate in carrier relaxation following optical excitation.While for all annealing atmospheres defect emission is reduced by annealing at 200°C,the UV to visible emission ratio worsens for annealing at 400°C and then improves again for 600°C.The defect peak shape is strongly dependent on the annealing atmosphere.After annealing in air at 400°C and 600°C,green and orange-red components can be observed.On the other hand,the samples annealed in forming gas show almost no visible emission for annealing at 200°C,while green emission appears for annealing at 400and 600°C.The samples annealed at 400°C exhibit longer L d +but shorter PL decay times and stronger defect emissions compared with samples annealed at 200°C.One possible explanation for this is that the nonradiative defect concentration is lower,but the inferior UV emission is caused by an increased career transfer to deep defect levels followed by their radiative relaxation and conse-quent decrease in the intensity ratio of UV and defect emissions.3.3.XPS Characterization.To clarify the issue of the possible origin of the observed defect emissions,XPS measure-ments were performed.The results obtained are shown in Figure 7and summarized in Table 1.The curves for samples annealed in air at 200°C (similar result as forming gas annealing at 200°C)and forming gas at 400°C (similar result as forming gas annealing at 600°C)have been omitted to improve the image clarity.The lower energy peak in the O 1s spectrum can be attributed to oxygen ions in the wurtzite ZnO structure,and the position of this peak in different reports was from 529to 530.7eV.29-31The higher energy peak,at 531-532eV,29-31is typically assigned to loosely bound oxygen on the surface,such as OH groups,30,31or O 2-ions in oxygen deficient regions.29Two peaks (O 1and O 2)are sufficient to achieve a good fit for O 1s spectra in all cases,although the shift of the higherenergyFigure 6.Room-temperature PL spectra of ZnO nanorods for:different annealing temperatures for samples annealed in the following:(a)air and (b)forming gas,(c)different annealing atmospheres for annealing at 200°C,and (d)different annealing atmospheres for annealing at 600°C.Figure 7.XPS spectra of ZnO nanorods annealed under different conditions:(a)O 1s (b)Zn 2p 2/3.ZnO Nanorods Prepared by a Hydrothermal Method J.Phys.Chem.B,Vol.110,No.42,200620869O2peak position for samples annealed in forming gas indicates a possible small contribution of an additional peak at higher energy(peak at∼533eV,attributed to water30,31).The peak shift of the O1s peak can also occur due to band bending.31As for the Zn2p3/2peak,small shifts to higher energy can be observed for all annealed samples.The O1/Zn ratio in all samples is lower than0.5,indicating oxygen deficiency in the bulk of the rods.3.4.Origins of Defect Emissions.The origin of the visible emission in ZnO is highly controversial.It has been shown that different defect centers are responsible for green,yellow,and red emissions.9,32Yellow and red emissions also exhibited different decay properties,which were attributed to different initial states(conduction band and shallow donors).8For the origin of green emission,a number of hypotheses have been proposed,such as singly ionized oxygen vacancy V o+,10V o2+ center,11oxygen antisite,12and zinc vacancy V Zn.13It has been suggested that the green emission is associated with oxygendeficiency,while the orange-red emission is associated with excess oxygen.5On the other hand,the red emission was also attributed to the interstitial zinc Zn i.14Yellow emission is commonly attributed to interstitial oxygen defects O i,3,4although some impurities such as Li could also contribute to this emission.4Unlike the green emission,the yellow emission was unaffected by surface modifications,4and assignment of the emission to O i has been confirmed by the reduction of this emission after annealing in a reducing environment.3,15Visible (green and yellow)emission in ZnO has also been attributed to the presence of Zn(OH)2on the surface.33,34Enhancement of the UV emission due to water desorption has also been demonstrated.35Hydrogen impurities also play a significant role in ZnO,36-38and the desorption temperatures of hydrogen and OH groups are different.35As-grown nanorods exhibit yellow defect emission,while after annealing typically red and green components are present in the emission spectra,and for some annealing conditions, defect emission becomes negligible.The yellow emission was reduced with annealing in all cases after annealing at temper-atures as low as200°C,although the decrease was lower in air.The desorption rate of hydroxyl groups peaks at∼150°C,35 and this desorption is likely responsible for the reduction of yellow defect emission after annealing at200°C.The assign-ment of this emission to the presence of hydroxyl groups is in agreement with previous reports on visible luminescence in ZnO nanocrystals.33,34Studies of the O-H local vibrational modes in ZnO also confirm that annealing at150°C results in the removal of OH groups,while H does not leave the sample for annealing at this temperature for30min.36However,O-H is only one type of hydrogen-related defect in ZnO,and the other defect has been shown to be thermally stable up to∼500°C.36 The study of hydrogen treatment of ZnO nanorods followed by annealing at400°C demonstrated that the presence of hydrogen improves the UV to visible emission ratio,while annealing at 400°C restores the original UV to visible emission ratio.37Thus, we can conclude that a decrease in the UV to visible emission ratio after annealing at400°C is most likely due to the removal of hydrogen.It should be noted that an increase in the defect (green)emission after hydrogen plasma treatment was also reported in ZnO,which was attributed to surface damage of the samples,similar to our results for forming gas annealing.38 Therefore,the yellow emission of the as-grown sample is likely due to the presence of OH groups,while worsening of the UV to visible emission ratio can be attributed to the removal of hydrogen.The green component of the emission(centered at∼2.47eV) is present in all annealed samples which exhibit defect emission. It is prominent in the samples annealed in forming gas,which exhibit evidence of surface damage(Figure2b).A similar observation has been reported for hydrogen plasma treatment of ZnO.38Thus,the green emission likely originates from surface defects,in agreement with previous reports.4,32The appearance of a green component of the emission is in most cases observed together with an increased positron diffusion length and S parameter,as well as lower O1/O2ratios.The increase in the S parameter with the appearance of green emission,as well as a decrease of O1/O2ratio,are in agreement with the involvement of V Zn14or V Zn complexes,as well as surface trapping by chemisorbed oxygen.11It should be noted that samples annealed in oxygen and argon at600°C also have similar values of the S parameter and thus similar concentrations of zinc vacancy related defects,but they exhibit a higher O1/O2ratio.Also, calculations of the energy levels of different defects predict that a transition involving V Zn would result in a blue emission.12,39 The summary of calculated energy levels from different studies12,39-41are shown in Figure8.It should be noted that the majority of calculations only predict energies of single point defects.While the energy of the V o Zn i complex has been calculated to be2.16eV below the conduction band minimum,39 energy levels of other defect complexes are unknown.Calcula-tions also predict that V Zn and V o have low formation energies,42 while Zn i is the most likely shallow donor candidate but it has a higher formation energy and it is a fast diffuser and thus not likely to be stable.42Electron irradiation experiments have shown that V Zn are a part of two different defect complexes and that one of those complexes anneals out simultaneously with neutral V O after annealing at∼550K.43Since all samples which exhibit green emission also exhibit a large S parameter value,while the opposite is not the case(i.e.,a large S parameter does not imply the existence of strong green emission),the likely origins of this emission are defect complexes related to V Zn and these defect complexes are mainly located at the surface.The assignment of this emission to a defect complex is also supported by the fact that single point defects,such as V Zn43and Zn i,42 are expected to be mobile at relatively low temperatures and thus would anneal out below600°C.Concerning red emission,it should be noted that there is a difference in the peak positions of the red components for samples annealed in forming gas(∼2.0eV)and samples annealed in air(∼1.8eV).A different peak position,together with different behaviors with increasing temperature,indicates Figure8.Energy levels of different defects in ZnO from different studies in the literature:(a)ref12,(b)ref40,(c)ref39,and(d)ref 41.V Zn,V Zn-,and V Zn2-denote neutral,singly charged,and doubly charged zinc vacancy,respectively.Zn i°and Zn i indicate neutral zinc interstitial while Zn i+denotes singly charged zinc interstial.V O°and V O denote neutral oxygen vacancy while V O+denotes singly charged oxygen vacancy.O i and H i represent oxygen and hydrogen interstitial, respectively.V O Zn i denotes a complex of oxygen vacancy and zinc interstitial.20870J.Phys.Chem.B,Vol.110,No.42,2006Tam et al.。