概统Ch7
- 格式:pptx
- 大小:821.01 KB
- 文档页数:21

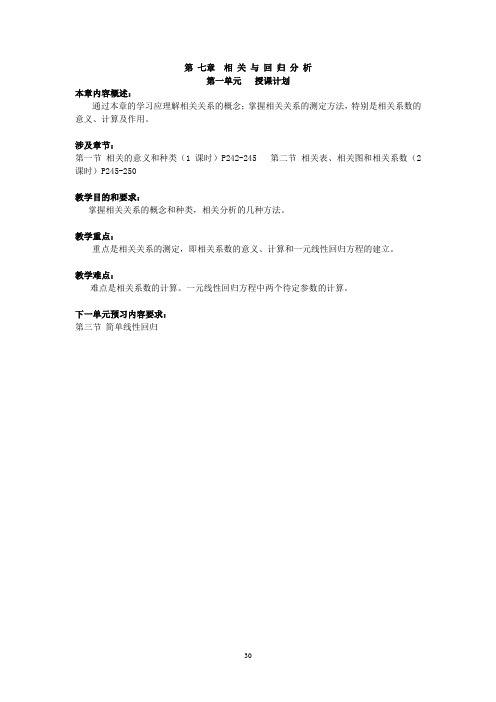
第七章相关与回归分析第一单元授课计划本章内容概述:通过本章的学习应理解相关关系的概念;掌握相关关系的测定方法,特别是相关系数的意义、计算及作用。
涉及章节:第一节相关的意义和种类(1课时)P242-245 第二节相关表、相关图和相关系数(2课时)P245-250教学目的和要求:掌握相关关系的概念和种类,相关分析的几种方法。
教学重点:重点是相关关系的测定,即相关系数的意义、计算和一元线性回归方程的建立。
教学难点:难点是相关系数的计算。
一元线性回归方程中两个待定参数的计算。
下一单元预习内容要求:第三节简单线性回归A 完全相关 B不相关 C不完全相关图 9-1按相关强度分类A正相关 B负相关图9-2按相关方向分类当变量x值发生变动,变量y值也随之而发生变动(增加或减少)不是均等的,如果画在图上,其观察点的分布表现为各种不同的曲线形式,这种相关关系称为非线性相关或曲线相关。
曲线相关的图形可以呈抛物线形,也可以呈双曲线形。
如图9-3所示。
x xA双曲线 B抛物线图9-3非线性相关第二节相关表、相关图和相关系数(2课时)教材P245-250 【讲授正文】第二单元授课计划第七章相关与回归分析本章内容概述:回归分析主要掌握一元线性回归,能够用最小平方法求回归方程,理解估计标准误差的概念及其作用,掌握其计算公式,还应该了解应用相关与回归分析时应该注意的几个问题。
涉及章节:第三节简单线性回归(2课时)P252-256 案例资料分析(1课时)教学目的和要求:在相关分析的基础用最小平方法建立回归模型,并在此基础上进行统计预测。
教学重点:重点是一元线性回归方程的建立。
教学难点:难点是一元线性回归方程中两个待定参数的计算。
思考与练习教材P259页第2、3、8、9、10题预习内容:第八章抽样推断。


CH7Nonrandom Sampling - Every unit of the population does not have the same probability of being included in the sampleRandom sampling - Every unit of the population has the same probability of being included in the sample.Random Sampling TechniquesSimple Random Sample – basis for other random sampling techniques Stratified Random SampleProportionate -- the percentage of the sample taken from each stratum is proportionate to the percentage that each stratum(層) is within the populationDisproportionate -- proportions of the strata within the sample are different than the proportions of the strata within the populationPopulation is divided into non-overlapping subpopulations called strata Researcher extracts a simple random sample from each subpopulation Stratified random sampling has the potential for reducing error Sampling error – a sample does not represent the populationStratified random sampling has the potential to match the sample closely to the population Stratified sampling is more costlyStratum should be relatively homogeneous, i.e. race, gender, religion Systematic Random SamplePopulation elements are an ordered sequence.With systematic sampling, every k th item is selected to produce a sample of size n from a population of size NSystematic sampling is evenly distributed across the frame Sample elements are selected at a constant interval, k, from the ordered sequence frame.Systematic sampling is based on the assumption that the source of the population is random Cluster (or Area) SamplingCluster sampling – involves dividing the population into non-overlapping areas Identifies the clusters that tend to be internally homogeneous Each cluster is a microcosm(縮圖) of the populationIf the cluster is too large, a second set of clusters is taken from each original cluster This is two stage samplingAdvantagesMore convenient for geographically dispersed populations Simplified administration of the surveyUnavailability of sampling frame prohibits using other random sampling methodsn =sample size N=population size k =size of selection intervalk =N nDisadvantagesStatistically less efficient when the cluster elements are similarCosts and problems of statistical analysis are greater than for simple random samplingNon-Random sampling – sampling techniques used to select elements from the population by any mechanism that does not involve a random selection processErrors:Data from nonrandom samples are not appropriate for analysis by inferential statistical methods.Sampling Error occurs when the sample is not representative of the populationNon-sampling Errors – all errors other than sampling errorsMissing Data, Recording, Data Entry, and Analysis ErrorsPoorly conceived concepts , unclear definitions, and defective questionnairesResponse errors occur when people do not know, will not say, or overstate in their answersCentral Limit Theorem(中央極限定理)Central limits theorem allows one to study populations with differently shaped distributionsCentral limits theorem creates the potential for applying the normal distribution to many problems when sample size is sufficiently largeAdvantage of Central Limits theorem is when sample data is drawn from populations not normally distributed or populations of unknown shape can also be analyzed because the sample means are normally distributed due to large sample sizesAs sample size increases, the distribution narrowsDue to the Std Dev of the meanStd Dev of mean decreases as sample size increasesZ Formula for Sample MeansSampling Distribution of PSample ProportionSampling DistributionnQ > 5 (P is the population proportion and Q = 1 - P.)The mean of the distribution is P.The standard deviation of the distribution is Z Formula for Sample Proportions.deviationstandardandmeanon withdistributinormalaisxofondistributithe,ofdeviationstandardandofmeanwithpopulationnormalafromnsizeofsamplerandomaofmeantheisxIfxxnσμσμσμ== nXXZX Xσμσμ-=-=P = Xn√(p∗q)/n。