支点交易法
- 格式:doc
- 大小:495.50 KB
- 文档页数:21
pivot point trading(支点交易法)你会喜欢本课程的。
支点(pivot points) 作为一种交易策略已经很长时间了,最初是场内交易员使用这种方法。
使用这种方法通过几个简单的计算就可以了解市场在一天中的去向。
支点法中的支点是一天中市场方向的转向点,通过简单地计算前日的高点、低点和收盘价,可以得到一系列点位。
这些点位可能形成关键的支撑和阻力线。
支点位,支撑和阻力位被统称为支点水位。
你所看到的市场每天都有开盘价、高价、低价及收盘价(有一些市场是24小时开盘,比如外汇市场,通常用5pm EST作为开盘和收盘时间)。
这些信息包含了你使用支点法的所有数据。
支点法之所以如此流行是因为它可以预测,而不是拖后。
你可以使用前一天的数据来计算你交易日(当前交易日)所可能发生的转向点因为有很多交易者按支点法进行交易,你会发现在这些关键位置市场是有反应的。
这给你了交易机会。
在我告诉你们如何计算这些支点以前,我要告诉你们,我已经放了一个在线计算器供你们免费下载。
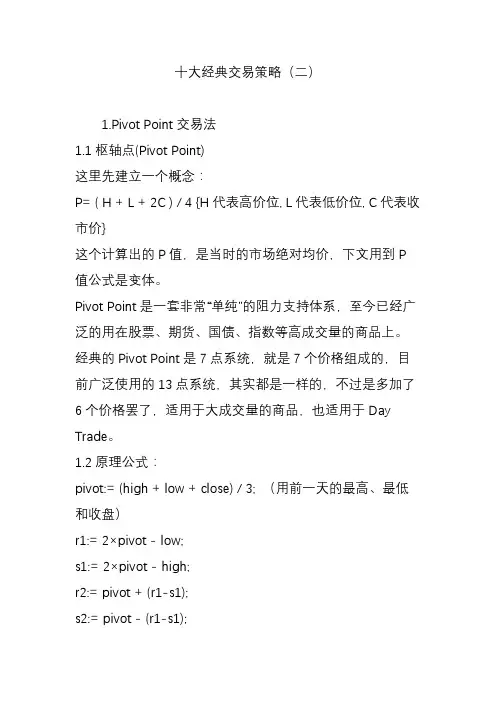
如果你想自己计算,我使用这组公式:阻力 3 = 高点 + 2*(支点 - 低点)阻力 2 = 支点 + (R1 - S1)阻力 1 = 2 *支点 - 低点支点 = ( 高点 + 收盘 + 低点 )/3支撑1 = 2 * 支点–高点支撑 2 = 支点 - (R1 - S1)支撑 3 = 低点 - 2*(高点–支点)从上面的公式你可以看出,只要知道前日的高点、低点以及收盘价,你就可以得到7个点,3个阻力位,3个支撑位以及一个实际支点。
如果市场在支点上方开盘,那么当天可能就是多头市场。
如果市场在支点下方开盘,市场可能就是空头市场。
最重要的三个支点是:R1, S1 及实际支点。
支点法的一般用法是观察对R1S1的突破。
当市场到达R2,R3 o或者S2,S3时,市场处于超买或者超卖,在这些水位上应该出场而不是入场。
最好的市场情况是这样的:市场在支点上方一些开盘,慢慢地升到R1位置,然后再升到R2位置。
你可以在r1点被突破的时候入场,目标位是r2,如果市场足够强,半场的时候在r2收盘(??),可能在剩下的时间内达到r3。
但是,生活不是如此简单的,我们必须尽我们所能处理好每一个交易日。
我从上周的市场中随机取出了一天,向大家说明在那天我们如果使用支点法进行交易。
04年8月12号欧元/美元的数据是这样的高点--1.2297低点--1.2213收盘--1.2249我们可以得出:r3--1.2377r2--1.2337r1--1.2293实际支点---1.2253s1--1.2209s2--1.2169s3--1.2125请看以下5分钟图绿线是支点,蓝色线是阻力线,红色线是支撑线用支点法有许多方法进行交易,我给你们讲几种,并且讨论一下在特定情况下,什么是好的,为什么有一些是不好的方法突破交易开始的时候,我们是在支点下面,所以我们倾向于做空。
我们可以画一个通道,这样你可以观察通道的突破,最好是向下突破。
在这种交易中,你可以把卖出订单放在低一级通道的下方,把止损订单放在上一个通道的上方,目标位是s1。
这一天的问题是,s1和突破位置很接近,交易没有多少油水(13点)。
对你来说,入场技术很好,只不过当日情况不是很好,而这并不意味着第二天情况就不太好。
拉回交易这是我喜欢的交易方式。
市场穿越s1,然后拉回,在支撑位下方放置一个入场订单,图上就是在拉回前的低点。
止损单在拉回点上方(最近的高点-----峰值),目标是s2。
又出来一个问题,这种方式下,目标s2太近,市场从来也没有到达前一级支撑,这种情况告诉我们,市场情绪要发生变化阻力位的突破随着行情的发展,市场开始回到s1位置,并形成一个通道(挤压区)。
这是另一个好的交易机会。
在通道上轨上方放置一个入场指令,止损放在通道下轨的下方,第一目标是支点线,如果你手里有不止一个头寸,在市场到达支点的时候,可以平仓一半头寸,上移止损,并观察市场对这个位置的反应。
市场没有在这个位置停住,你的下个目标位就是r1。
这个位置很快就达到了,我会在这个位置平仓所有头寸。
更高级的用法正如我前面提到的,支点法交易有很多种方式。
更高级的用法是使用两根移动平均线的穿越作为突破的确认。
你甚至可以使用指标来帮助你做出决定。
可以使两根移动平均线或者macd的穿越,但是必须是买入模式。
你可以用你喜欢的指标,但是记住,信号是水位的突破,指标只是用来确认。
我们已经研究了支点水位的失败形态,但是这不是这课的内容,我想我只是想介绍给你一种交易方式。
祝交易顺利。
Day Trading Forex Futures with Pivot PointsBy Eric UtleyPivot PointsPivot points are a popular tool used by futures traders in all sorts of markets, ranging from equity indices to crude oil. And, sure enough, pivot points are readily applied to trading currency futures.Pivot points are support and resistance levels derived from the previous period's high, low, and closing values.There are a variety of pivot values with which to trade, including monthly, weekly, and daily values. You could even calculate hourly values. When determining which period to trade with, you've got to consider your time frame as an individual and your particular style. I'll use daily pivot points for the purpose of this article since the focus is day trading.Daily pivot points give a structure to each new trading day in the currency market. With these values you can use traditional support and resistance techniques to enter and exit trades. But before I get to the strategy, I'll show you how to calculate pivot values.Pivot Point (PP) = (High + Low + Close) / 3Resistance 1 (R1) = (2 x Pivot Point) - LowSupport 1 (S1) = (2 x Pivot Point) - HighResistance 2 (R2) = Pivot Point + (Resistance 1 - Support 1)Support 2 (S2) = Pivot Point - (Resistance 1 - Support 1)(Pivot values for several different currency pairs are posted on the TradingMarkets web site every day.)The pivot values are plotted as horizontal levels which, in turn, serve as support and resistance. The pivot point itself can be thought of as the day's mid-point, or fulcrum. It's where the buyers and sellers meet to determine the day's trend in a currency pair. The support and resistance levels that are plotted around the pivot point are just that: potential support and resistance.A daily pivot point (in green), S2, S1, R1, and R2 values are plotted on the chart below of the EUR/USD FX future. The chart is a 5-minute interval. Notice how the Euro broke above the pivot point early in the day, and then proceeded to trade up to R1, where it met resistance and gyrated for the rest of the day.Source: Follow The Intraday TrendThe power of pivot points is unleashed when you follow an unfolding trend during the day, and use the pivot values to measure the magnitude of trend. Additionally, the pivot points can be used to determine entry points into a trade. Applying simple breakout and breakdown entries around pivot points is a powerful way of using the tool.An example of following the trend of the day as it unfolds, and entering trades on the break of pivot values, is illustrated on the 5-minute chart below of the JPY/USD contract.In this example, the Yen began the day near its pivot value, rolled over from R1, and proceeded tobreakdown below the pivot point, S1, and S2. The pair dropped by about 60 ticks, providing ample opportunity for a day trader to make money on each breakdown below support. These types of intraday trends unfold a few times throughout the trading week, and they are relatively easy to exploit by following the futures contract through its pivot values.Source: A second way of leveraging the power of pivots in the currency futures market is by adding a technical indicator that can pinpoint buy and sell signals.You will still want to use traditional support and resistance techniques around the pivot values.The purpose of adding to the indicator is to help in the timing of an entry into a trade. Above all else, though, you want to trade in the direction of the unfolding trend.The MACD (12,26,9) is added to the 5-minute Euro chart below.The MACD generates simple buy and sell signals with the crossing of the fast and slow lines. Quite simply, it's time to buy when the fast line crosses above the slow. Conversely, it's time to sell when the fast line crosses below the slow line.Only the buy signals are highlighted on the chart below because the Euro was in an upward trend during the day. The sell signals are ignored due to the upward trend in the contract.The Euro began the day at 1.2640 and ended near 1.2740 for a move of roughly 100 ticks. That's a lot of potential profit, part of which could have been captured by simply following the trend of the day and taking the buy signals coming from the MACD.Source: Pivot Point Tips And TricksTrading with pivot points is not a big secret. Floor traders and dealing desks have been applying the methodology for decades in the currency market. But what separates the profitable traders from the losers is the simple act of following the trend of the day, cutting losses short, and letting profits run to the next pivot value.In addition, there are a few observations I've made over the years that I can add to the simple truth of following the trend.The first tip I want to share is that the best trend days usually unfold when the currency begins the trading day near its pivot point. You might have already made this observation in the two above examples of the Euro and Yen.If you didn't, then take a second and jump back to the above charts, and note how the Euro and Yen began the day at or very near their pivot points. There are usually two or three days out of the week during which the majors such as the Euro, Yen, Pound, and Franc begin trading at their daily pivot. These are the days to look for a big trend to unfold.If the currency that you're trading begins the day far away from the pivot, either below S2 or above R2, then it's probably a day that you want to walk away from. When a currency opens the day at one of the daily pivot extremes, it usually spends the rest of the session gyrating around that level. Avoid trying to trade a reversal of the overnight trend. Occasionally it might occur, but more often than not a big overnight trend will stall out at R2 or S2. The temptation is there to try to squeeze out a small profit, or bet on a reversal of the overnight trend. But the reality is that these are the days that can destroy a trader's equity.You will find two examples below of strong overnight trends leading to massive gaps at the open of New York trading in the futures market. The first is an example of a gap up in the Euro. The pair opened at R2, where it spent the rest of the session. The second example is of a gap down in the Pound.The contract opened below S2, and spent the rest of the day gyrating in a tight range.Source: Source: These days are best left to the floor traders. In the long run, you'll be better off not even trying to trade during days when the currency futures stage a substantial gap, either high or lower. You'll be better of by waiting for those days when the currency futures open near their pivot points.Profit With PivotsDay trading with pivot points can be applied to the spot Forex market just as they are in the currency futures market. Support and resistance, and the techniques that accompany these price levels, are consistent across all markets. In fact, pivot points have been used across dealing desks for decades in the spot Forex market. To the individual investor, however, it makes more sense to use currency futures when day trading simply because of the lower costs associated with trading futures.The most important point to remember when applying pivot points to day trading currency futures is to follow the trend of the day, and simply look to enter into an unfolding trend as a pair makes its way through pivot values. Pay special attention to those days when the currency opens at or very near its pivot point. And avoid trading when a contract opens far away from its pivot point, at or beyond S2 and R2 values.PIVOTS AND THE FOREXThe Pivot techniques work well in markets with a wide daily trading range,su ch as the Forex. Pivot lines steers traders away from “no man’s land” and identifies “high activity” areas in which the equity has a high probability of reversal. These areas are important trading zone watched daily by floor traders and computer trading systems.The levels for the trading ranges and pivots are the support and resistance levels of the market in the next time interval. It is important to note that the predicted levels only give the range in the next time interval.They do not indicate when the levels will be reached by the currency price action. The pivot is a level at which the underlying asset can be expected to change direction and/or move rapidly away from.DAILY PIVOT DATAMy pivots program provides not only Pivot, R1, R2, S1, and S2, but also the M1, M2, M3, and M4 points as well. It is common to find many traders calculating only the Pivot, R1, R2, S1, and S2 levels.In the Forex market, however, you will find my additional points of support and resistance to be very significant indeed. These pivot data points are published daily and is available for access to you once you start the course. The Forexmentor video course also shows you how to calculate the Pivot points using our proprietary Pivot Calculator.After you have calculated the pivot numbers for the day, place horizontal lines on your 15 minute and 1 hour charts at the pivot numbers for the day, or at least as many lines as your chart has room for. These pivot points will guide your trading throughout the day.Pivot Point Trading- 7 Guidelines For SuccessBy Michael A. JonesWhat do we mean by pivot point trading? It simply means that Forex traders take into account pivot points calculated from the previous day's trading range and use them as reference points to identify support and resistance levels.Taking the high, low, close and open values of the previous day's price action, strategic levels can be identified which may or may not have an influence on price action. Pivot point trading puts emphasis on these levels, and uses them to guide entry and exit points for trades.However, as with any technical indicator, there are limitations and pivot point trading, to be high probability, needs to stay within certain parameters. The following 7 guidelines can help pivot point trading be more profitable:No. 1Pivot points should not be used as a standalone indicator. Do not enter or exit trades purely on the basis of pivot points. Use them in conjunction with other indicators such as candle patterns, Fibonacci levels, MACD, and moving averages to identify and confirm key levels of support and resistance which may provide trading opportunities.No. 2While some traders living in various parts of the world may calculate their pivot points according to the time zone in which they live, a fairly safe standard for calculating the levels of pivot point trading is to use GMT (Greenwich Meantime).Midnight GMT is a very quiet time in the market with very little volatility and provides a good opportunity to calculate more accurate pivot levels going from midnight GMT to midnight GMT the following day.No. 3It is good to understand what is going on behind the scenes when it comes to pivot point trading. Rather than just staring at candles on a chart, understand what they actually represent.Thousands of traders around the world, some working for large institutions and handling millions or even billions of dollars worth of currency, are taking positions according to previously established highs and lows in the market.Pivot points draw attention to these key levels which will often be strongly defended by traders who have a lot at stake. This is the reason pivot point trading can be so successful, once a trader understands underlying reasons for price action.No. 4It is good to calculate mid levels in addition to the S1, S2, R1, and R2 pivot levels. Sometimes there is a significant gap between these levels and calculating a mid point gives another point of reference. Price will often be seen respecting M1, M2, M3, or M4.To calculate mid levels, simply subtract the level below from the level above and divide by 2. (see the resource box for a free pivot point calculator)No. 5Pivot point trading can be a useful strategy for entering and exiting trades at the right time. A pivot point can provide a key level of support or resistance where price is likely to bounce for a 10-20 pip profit.Or in the case of a trend, price may retrace to a pivot level before continuing its run. The retracement point at the pivot level would be a good place to put an entry order to be taken in when price comes back to retest at the pivot level.No. 6The Euro - US dollar pair often puts in a daily average of between 75 and 100 pips. Watch for specific behavior around the time of the London market open. Price will often come back to test alevel which is a pivot point and form a distinctive candle pattern such as tweezers, or a hanging man, and then reverse and go on its 75-100 pip run for the day.If price comes back to the M1 level check your other indicators to see if they confirm this would be a good level to go long. Likewise, if price, just around London open, tests the M4 level, check your other indicators to see if this would be a good place to go short. You may be able to get a slice of the 75-100 pip run for the day.No. 7Pivot point trading helps mentally in establishing the buy zone and the sell zone. Traditionally, anything above the Central Pivot Point is a Sell area, and everything below the Central Pivot Point is a Buy area.If you go contrary to that, make sure you double check your analysis and have very good reasons for doing otherwise.Pivot point trading is just one of an arsenal of weapons available to Forex market participants. However, it must be stated that many successful traders use just a handful of tools that become their favorites. After all, too many indicators can lead to decision paralysis.For many traders, pivot points are a key element in their overall trading strategy. Use the 7 guidelines above to use them safely and responsibly.For a free pivot point calculator, Fibonacci calculator and the best free economic calendars click here:/Forex/tools.htmlClick here to learn how to use another indicator, the 200 EMA, in a simple yet powerful way:/Forex/Advisor/200EMA-forex-strategy.htmForex Strategy Using 200EMA: Extremely Powerful Yet Simple For New TradersAre you a relatively new trader looking for a solid forex strategy?A challenge facing many new traders when developing their forex strategy is the ability to identify the overall trend for intra-day trading.The 200 EMA (Exponential Moving Average) can solve the problem.The 200 EMA is one of the most popular indicators of all time with Forex traders the world over,and for that reason alone is worth noting due to the psychological effect on the market place price can have when hovering around the 200 EMA.To use this very powerful Forex strategy, create charts on 3 time frames:4 hour1 hour15 minuteNow plot a 200 EMA indicator on each chart and, as a suggestion, color it red, for easy visual impact.Preferably tile the 3 windows containing your 3 charts into a vertical fashion so you can see the 3 time frames next to each other. It will squeeze up the information on the charts somewhat but for the purpose of this strategy that doesn’t matter.Now scroll through the various currency pairs you like to trade. If you prefer to trade only pairs with a smaller pip spread, they amount to about 9. They are:EUR/USDGBP/USDUSD/CHFUSD/JPYEUR/JPYUSD/CADAUD/USDNZD/USDEUR/CHFWatch For This SetupWhat you are looking for is any currency pair that bucks the 200 EMA on the 15 minute chart.So for example, look at the EUR/USD pair and note the position of price relative to the 200 EMA on the 3 time frames.If price is well above the 200 EMA on the 4 hour chart, well above the 200 EMA on the 1 hour chart, but BELOW the 200 EMA on the 15 minute chart, price is bucking the trend.The overall trend is up, price has temporarily gone against the trend and is currently in a retracement.Using the fundamental trading principle of buy the dips in an uptrend, sell the rallies in a downtrend, look for a suitable entry point.In the example given above you would look for an opportunity to buy the EUR/USD, perhaps watching for a candle signal that price has exhausted it’s downward momentum, bucking the 15minute chart 200 EMA and will soon resume it’s upward momentum.An Easy Daily ExerciseThis is an easy exercise and it can be done once or twice a day, taking just a few minutes.Once you see price bucking the 200 EMA on the 15 minute chart, whereas it is on the opposite side on the 4 hour and 1 hour charts, sit up and take note. Watch carefully and grab the opportunity to get in and make some pips.After a little practice you will see how extremely powerful this simple Forex strategy is - certainly deserving a place in your trading tool kit.。