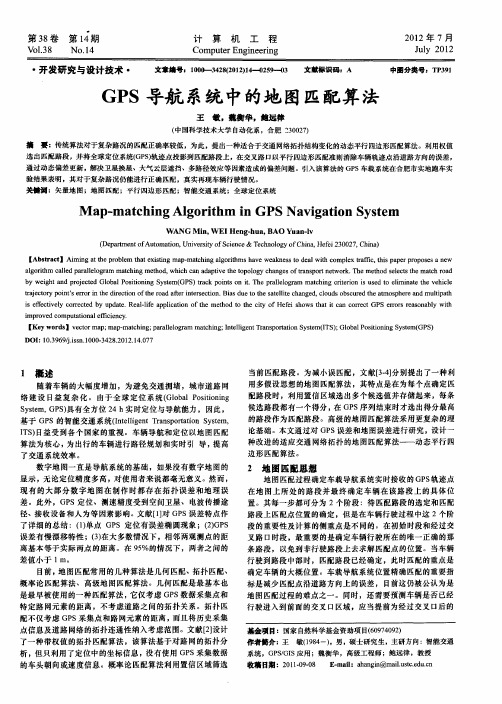
Map-Matching for Low-Sampling-Rate GPS Trajectories
- 格式:pdf
- 大小:1.48 MB
- 文档页数:10

航天返回与遥感第42卷第2期130SPACECRAFT RECOVERY & REMOTE SENSING2021年4月一种基于卫星图像匹配的无人机自主定位算法刘欣1吴俊娴2张占月1(1 航天工程大学,北京 101416)(2 空装驻北京地区第一军事代表室,北京 100854)摘要针对基于图象匹配的无人机自主定位易失效的问题,文章提出了一种基于卫星图像辅助的由粗到精的无人机自主定位框架。
首先设计了一种CNN-LSTM联合分类器,利用CNN网络抽取图像特征的优势,结合无人机图像时间维度上的连续性,实现无人机图像与卫星基准图像的区域匹配;然后从匹配后的区域提取同名点,结合光学成像的共线约束,设计了一种基于多点加权约束的无人机自主定位算法。
试验结果表明提出的算法鲁棒性好、精度高,适合用于无人机自主定位。
关键词无人机自主定位卷积神经网络图像匹配加权最小二乘估计遥感应用中图分类号: V279文献标志码: A 文章编号: 1009-8518(2021)02-0130-09DOI: 10.3969/j.issn.1009-8518.2021.02.015A UA V Autonomous Positioning Algorithm Based onSatellite Image MatchingLIU Xin1 WU Junxian2 ZHANG Zhanyue1(1 Space Engineering University, Beijing 101416, China)(2 The 1th Military Office in Beijing, Equipment Department of PLA Air Force, Beijing 100854, China)Abstract For the problem that autonomous positioning of UAVs based on image matching is easily invalid, the paper proposed a coarse-to-fine autonomous UAV positioning framework based on the assist by satellite images. Firstly, a CNN-LSTM joint classifier is designed to achieve regional matching between UAV image and satellite reference image, utilizing the advantage of CNN network to extract image features and combining with the continuity of UAV image in time dimension. Then, an autonomous UAV positioning algorithm based on multi-point weighted constraints is designed by extracting points of the same name from the matched region and combining with the collinear constraint of optical imaging. The experimental results show that this proposed algorithm is suitable for UAV autonomous positioning with good robustness and high precision.Keywords unmanned aerial vehicle (UA V); autonomous positioning; convolutional neural network; image matching; weighted least square estimation; remote sensing application0 引言无人机在执行任务时首先要解决的问题是确定自身在工作环境中的准确位置。


slam实现方法SLAM实现方法什么是SLAMSLAM,即Simultaneous Localization and Mapping,即同时定位与地图构建。
它是一种同时进行自主定位和地图建立的技术,通常用于无人机、自动驾驶和机器人等领域。
相关方法介绍基于视觉的SLAM方法基于视觉的SLAM方法主要利用摄像头获取环境信息,并通过图像处理和计算机视觉算法来实现同时定位和地图构建。
常用的方法包括:- 特征点法:通过提取图像中的特征点,利用这些特征点之间的匹配关系来计算相机的运动和地图的构建。
- 直接法:通过建立图像亮度的灰度残差模型,直接估计相机的运动和地图的构建。
- 深度学习法:利用深度学习的方法,通过训练神经网络来实现相机的定位和地图的构建。
基于激光的SLAM方法基于激光的SLAM方法主要利用激光雷达获取环境信息,并通过激光数据处理和SLAM算法来实现同时定位和地图构建。
常用的方法包括:- 自适应模型法:通过分析激光数据的反射特性,自适应地建立地图模型,同时进行定位。
- 点云拼接法:通过将多帧激光数据进行拼接,建立点云模型,同时进行定位。
- 分段匹配法:将激光数据进行分段匹配,利用匹配关系来计算相机的运动和地图的构建。
基于惯性传感器的SLAM方法基于惯性传感器的SLAM方法主要利用加速度计和陀螺仪等传感器来获取相机的运动信息,并通过滤波和融合算法来实现同时定位和地图构建。
常用的方法包括: - 扩展卡尔曼滤波法:通过预测和更新步骤,利用卡尔曼滤波算法来估计相机的位姿和地图的构建。
- 粒子滤波法:通过随机采样的方法,利用粒子滤波算法来估计相机的位姿和地图的构建。
- 单纯惯导法:通过积分惯性传感器的数据,估计相机的位姿变化,实现定位和地图构建。
结论SLAM是一种重要的技术,在无人机、自动驾驶和机器人等领域具有广泛应用。
基于视觉、激光和惯性传感器的SLAM方法都有各自的特点和适用场景,开发者可以根据具体应用需求选择合适的方法来实现SLAM。

SLAM(Simultaneous Localization and Mapping)即同时定位与地图构建,它是指在未知环境中,通过移动机器人进行感知和运动控制,实现机器人自身位置的估计和地图的构建。
SLAM问题可以用一组运动方程和观测方程来描述。
下面是常见的基于激光雷达的2D SLAM的运动方程和观测方程:
1. 运动方程:
- 里程计运动模型:通常使用简化的运动模型(如平移运动模型或增量式旋转运动模型),将机器人的运动表示为里程计度量值。
具体形式如下:
x_t = x_{t-1} + delta_x
y_t = y_{t-1} + delta_y
theta_t = theta_{t-1} + delta_theta
2. 观测方程:
- 激光雷达观测模型:通过激光雷达测量环境中的障碍物,可以获得一系列距离和角度观测值。
观测模型将这些观测值映射到机器人坐标系或世界坐标系中,以获得障碍物在地图中的位置信息。
具体形式如下:
z_t = h(x_t) + epsilon
在上述方程中,x_t、y_t和theta_t分别表示机器人在时间t的位置和姿态(方向),delta_x、delta_y和delta_theta表示机器人的增量运动,z_t表示激光雷达的观测值,
h(x_t)表示观测模型将机器人位置映射到地图坐标系中的函数,epsilon表示观测误差。
需要注意的是,SLAM问题是一个非线性的问题,通常需要使用滤波器(如扩展卡尔曼滤波器或粒子滤波器)来进行状态估计和地图构建。
在实际应用中,还可能根据具体情况引入其他传感器数据和环境模型,以提高定位和地图构建的精度与鲁棒性。


slam重定位方法Slam重定位方法1. 简介随着自主导航机器人和增强现实技术的发展,SLAM (Simultaneous Localization and Mapping)重定位方法变得越来越重要。
SLAM重定位旨在通过机器视觉和激光扫描等传感器数据,实现机器人在未知环境中的定位和地图构建。
2. SLAM重定位方法的分类类别一:基于特征点的方法基于特征点的SLAM重定位方法主要通过提取场景中的关键特征点,并与先前记录的地图进行匹配。
以下是几种常见的方法:•传统关键点匹配方法:根据特征描述子的相似度进行匹配,常用的算法包括SIFT、SURF和ORB等。
•基于BoW(Bag of Words)的方法:将特征描述子表示为词包,通过匹配词包的相似性来确定位姿。
•基于直方图的方法:以特征点的分布直方图为特征,通过直方图相似性度量进行匹配。
类别二:基于深度学习的方法近年来,深度学习技术的兴起为SLAM重定位带来了新的方法。
以下是几种基于深度学习的SLAM重定位方法:•基于深度神经网络的方法:利用卷积神经网络(CNN)或循环神经网络(RNN)等深度学习模型,直接从图像中学习定位和地图结构。
•基于生成对抗网络(GAN)的方法:通过对抗训练,生成逼真的场景图像,并与实际场景进行匹配。
•基于自编码器的方法:通过自编码器学习图像特征表示,实现定位匹配。
类别三:基于图优化的方法基于图优化的SLAM重定位方法将传感器数据抽象为图的节点和边,通过最小化误差函数,优化机器人位姿和地图模型。
以下是几种常见的方法:•基于最小二乘法的方法:利用最小二乘法建立误差模型,通过迭代优化参数,实现精确的位姿估计和地图构建。
•基于因子图的方法:将SLAM问题建模为因子图,在因子图上进行消息传递和推理,优化机器人位姿和地图拓扑结构。
•基于非线性优化的方法:利用非线性优化算法,如高斯牛顿法或Levenberg-Marquardt算法,解决SLAM重定位问题。
gmappinggmapping源码:git搜索 gmapping 下⾯两个即是:gmapping 原理很简单,通过“"实现定位。
具体通过粒⼦与已经产⽣的地图进⾏scanMatch,矫正⾥程计误差实现。
在定位的同时,每次经过map_update_interval_时间,进⾏地图更新 updateMap(*scan)。
相对cartographer,缺少闭环,所以计算量很⼩,实测,局部地图⽐carto 清晰,质量较好。
下⾯对代码进⾏梳理(梳理导航相关代码跟着laser⾛,会⽐较清晰)代码梳理1> ros 部分 (代码为简化版,⽅便梳理 ... 表⽰有省略代码)gmapping/src/main.cppint main(int argc, char** argv){ros::init(argc, argv, "slam_gmapping");SlamGMapping gn;gn.startLiveSlam();ros::spin();return(0);}gmapping/src/slam_gmapping.cppvoid SlamGMapping::startLiveSlam(){... // 订阅激光数据scan_filter_->registerCallback(boost::bind(&SlamGMapping::laserCallback, this, _1));}void SlamGMapping::laserCallback(const sensor_msgs::LaserScan::ConstPtr& scan){// We can't initialize the mapper until we've got the first scanif(!got_first_scan_){if(!initMapper(*scan))return;}GMapping::OrientedPoint odom_pose;if(addScan(*scan, odom_pose))// addscan:对新激光,结合⾥程计数据进⾏粒⼦滤波矫正得出最新位置{ // 以下通过getBestParticle的位置(即,当前激光位置)和⾥程计最终,算出map-to-odom,发布出去GMapping::OrientedPoint mpose = gsp_->getBestParticleIndex().pose;tf::Transform laser_to_map = tf::Transform(mpose...);tf::Transform odom_to_laser = tf::Transform(odom_pose...);map_to_odom_ = (odom_to_laser * laser_to_map).inverse();// 当满⾜⼀定时间间隔更新地图if(!got_map_ || (scan->header.stamp - last_map_update) > map_update_interval_){updateMap(*scan);last_map_update = scan->header.stamp;}}总结:其实以上便是gmapping主要程序框架,通过激光数据和odom数据,进⾏粒⼦滤波计算,不断更新⾃⼰的位置,同时间断的进⾏更新地图运算。
利⽤CMG-GEM组分模拟器模拟煤层⽓开采教程(⼆)利⽤CMG—GEM组分模拟器模拟煤层⽓开采教程(⼆)加拿⼤计算机模拟软件集团(CMG)教程2:矿场规模CBM模拟内容:(1)利⽤等温吸附线描述煤层含⽓量图(2)⽤户基于含⽓量输⼊煤层初始化数值(3)CMOST敏感性分析(4)CMOST辅助历史拟合可⽤数据:(1)Rescue格式的地质模型(2)测量不同井的等温线来表⽰三个主要煤层(3)主要煤层的含⽓量图⼀、打开BUILDER1.在Launcher中双击BUILDER图标打开BUILDER2.选择GEM模拟器,SI国际标准单位,DUALPOR,Gilman and Kazemi形状因⼦,开始⽇期2005-01-01。
3.单击OK两次。
⼆、输⼊输出控制部分(Input/Output Control Section)1.在树状图中单击I/O Control。
2.双击Titles And Case ID,输⼊“Multi Well CBM model”,按OK。
3.双击Restart,选择Enable restart writing,并使⽤REWIND 2。
4.单击,并在⽇期2005-01-01,点击两次OK。
三、油藏描述部分(Reservoir Description Section)1.打开⼀个RESCUE模型(rescue2009.bin)并导⼊⼀个地质⽹格及油藏属性,如下所⽰:2.将CMG关键字与rescue模型属性匹配,如下所⽰。
3.当展开Reservoir标签下的Array Properties时,会有⼀个红⾊叉号(),表明在这部分需要输⼊⼀些“必须的”内容。
4.单击Specify Property按键输⼊下⾯的油藏参数和值:Property Value for “Whole Grid”Porosity (Matrix ) 0.001Permeability I (Matrix) 0.001 mDPermeability J (Matrix) EQUALSIPermeability K (Matrix) EQUALSIPermeability J (Fracture ) EQUALSIPermeability K (Fracture) EQUALSI* 0.1Fracture Spacing I 0.05 mFracture Spacing J EQUALSI * 0.5Fracture Spacing K EQUALSI * 0.1Implicit Flag 3Implicit Flag – (Fracture) 35.按两次OK进⼊Calculate Property。
1、SIFT 尺度不变特征变换算法David Lowe关于SIFT算法,2004年发表在Int. Journal ofComputer Vision的经典论文中,对尺度空间(scale space)是这样定义的:It has been shown by Koenderink (1984) and Lindeberg (1994) that under a variety ofreasonable assumptions the only possible scale-space kernel is the Gaussian function.Therefore,the scale space of an image is defined as a function, L(x; y; delta) that is produced from the convolution of a variable-scale Gaussian, G(x; y; delta), with an input image, I(x; y):因此,一个图像的尺度空间,L(x,y,delta) ,定义为原始图像I (x,y)与一个可变尺度的2维高斯函数G(x,y,delta)卷积运算。
关于图象处理中的空间域卷积运算,可以参考经典的图像处理教材(比如美国冈萨雷斯的图象处理,第二版,或者其Matlab版,都有如何在离散空间进行运算的例子和说明)注:原文中delta为希腊字母,这里无法表示,用delta代替。
Sift 算法中,提到了尺度空间,请问什么是尺度和尺度空间呢?在上述理解的基础上,尺度就是受delta这个参数控制的表示。
而不同的L(x,y,delta)就构成了尺度空间(Space,我理解,由于描述图像的时候,一般用连续函数比较好描述公式,所以,采用空间集合,空间的概念正规一些),实际上,具体计算的时候,即使连续的高斯函数,都要被离散为(一般为奇数大小)(2*k+1) *(2*k+1)矩阵,来和数字图像进行卷积运算。
Map-Matching for Low-Sampling-Rate GPS Trajectories Yin Lou Microsoft Research Asia v-yilou@microsoft.com Xing Xie Microsoft Research Asia xingx@microsoft.com Chengyang Zhang Microsoft Research Asia v-chenz@microsoft.com Wei Wang Fudan University weiwang1@fudan.edu.cn Yu Zheng
Microsoft Research Asia yuzheng@microsoft.com
Yan Huang
University of North Texas huangyan@unt.edu
ABSTRACT
Map-matching is the process of aligning a sequence of observed user positions with the road network on a digital map. It is a fundamental pre-processing step for many applications, such as moving object management, traffic flow analysis, and driving directions. In practice there exists huge amount of low-sampling-rate (e.g., one point every 2-5 minutes) GPS trajectories. Unfortunately, most current map-matching approaches only deal with high-sampling-rate (typically one point every 10-30s) GPS data, and become less effective for low-sampling-rate points as the uncertainty in data increases. In this paper, we propose a novel global map-matching algorithm called ST-Matching for low-sampling-rate GPS trajectories. ST-Matching considers (1) the spatial geometric and topological structures of the road network and (2) the temporal/speed constraints of the trajectories. Based on spatio-temporal analysis, a candidate graph is constructed from which the best matching path sequence is identified. We compare ST-Matching with the incremental algorithm and Average-Fréchet-Distance (AFD) based global map-matching algorithm. The experiments are performed both on synthetic and real dataset. The results show that our ST-matching algorithm significantly outperform incremental algorithm in terms of matching accuracy for low-sampling trajectories. Meanwhile, when compared with AFD-based global algorithm, ST-Matching also improves accuracy as well as running time.
Categories and Subject Descriptors
H.2.8 [Database Applications]: Spatial Databases and GIS.
General Terms
Algorithms, Design
Keywords
Map-matching, GPS, trajectory, road network
1. INTRODUCTION The past years have seen a dramatic increase of handheld or dashboard-mounted travel guidance systems and GPS-embedded
PDAs and smart phones. The proliferation of these devices has enabled the collection of huge amount of GPS trajectories. More and more applications, such as route planner [7], hot route finder [16], traffic flow analysis [15], geographical social network [23], have started to use information from GPS data to achieve better quality of services.
Typically a GPS trajectory consists of a sequence of points with latitude, longitude, and timestamp information. However, this data is not precise due to measurement errors caused by the limitation of GPS devices and sampling error caused by the sampling rate [17]. Therefore the observed GPS positions often need to be aligned with the road network on a given digital map. This process is called map-matching. Map-matching is a fundamental pre-processing step for many trajectory-based applications, such as moving object management, traffic flow analysis, and driving directions. The difficulty of map-matching can greatly differ depending on GPS accuracy and the sampling rate.
This paper addresses the problem of sampling error in particular. In practice there exists large amount of low-sampling-rate (e.g., one point every 2 minutes) GPS trajectories. They are either application-logged data collected from ad-hoc location-based queries, or generated in the scenarios where saving of energy cost and communication cost are desired. For example, there are 60,000+ taxies in Beijing, among which many are GPS-embedded. Since taxi drivers travel very frequently, sampling rate has to be reduced in order to save energy consumption and achieve reasonable response time. Unfortunately, current map-matching approaches only deal with high-sampling-rate (typically one point every 10-30s) GPS data, and become less effective for low-sampling-rate points as the uncertainty in data increases.
Most existing map-matching approaches employ local or incremental algorithms that map current or neighboring positions onto vector road segments on a map. For an approach that only considers current positions, the result is greatly affected by measurement errors. The accuracy is generally low because the correlation of neighboring points is completely overlooked. The incremental matching algorithm in [8][7] pursues the local matching of a small portion of the trajectory. When matching a new position, its previous position and last matched edge are considered. Although fast in computation, this approach’s performance is sensitive to the decrease of sampling frequency.