Thermal X-ray emission of the remnants of ashperical Supernova explosions
- 格式:pdf
- 大小:93.32 KB
- 文档页数:4

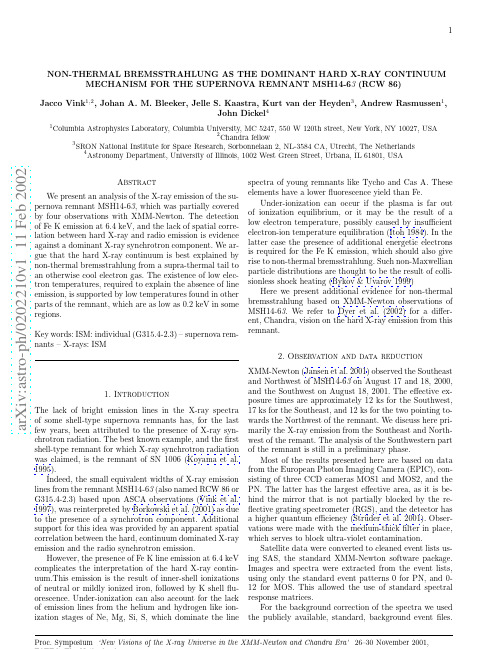
ar Xi v:a st ro -p h /0202210v 1 11 F e b 2002NON-THERMAL BREMSSTRAHLUNG AS THE DOMINANT HARD X-RAY CONTINUUMMECHANISM FOR THE SUPERNOV A REMNANT MSH14-63(RCW 86)Jacco Vink 1,2,Johan A.M.Bleeker,Jelle S.Kaastra,Kurt van der Heyden 3,Andrew Rasmussen 1,John Dickel 41Columbia Astrophysics Laboratory,Columbia University,MC 5247,550W 120th street,New York,NY 10027,USA2Chandra fellow3SRON National Institute for Space Research,Sorbonnelaan 2,NL-3584CA,Utrecht,The Netherlands 4Astronomy Department,University of Illinois,1002West Green Street,Urbana,IL 61801,USAAbstractWe present an analysis of the X-ray emission of the su-pernova remnant MSH14-63,which was partially covered by four observations with XMM-Newton.The detection of Fe K emission at 6.4keV,and the lack of spatial corre-lation between hard X-ray and radio emission is evidence against a dominant X-ray synchrotron component.We ar-gue that the hard X-ray continuum is best explained by non-thermal bremsstrahlung from a supra-thermal tail to an otherwise cool electron gas.The existence of low elec-tron temperatures,required to explain the absence of line emission,is supported by low temperatures found in other parts of the remnant,which are as low as 0.2keV in some regions.Key words:ISM:individual (G315.4-2.3)–supernova rem-nants –X-rays:ISMProc.Symposium ‘New Visions of the X-ray Universe in the XMM-Newton and Chandra Era’26–30November 2001,Figure1.Mosaic of exposure cor-rected EPIC PN and MOS images covering the SW,SE and NW of MSH14-63.The color coding is as follows.Red:0.54-1.0keV;green: 1.0-1.95keV;blue:1.95-6.8keV. The labels are referred to in the text and in Fig.2.Thefigure on the right shows the1.95-6.8keV X-ray emis-sion with radio emission as observed by ATCA(Dickel et al.2000)over-layed in contours.Unfortunately,these consist of observations taken with the thinfilter,possibly resulting in a background overes-timation at low photon energies.We therefore used addi-tional off-centerfields of the publicly available observation of G21.5-0.9,a small supernova remnant,which was ob-served with the mediumfilter.In practice we only used these data to estimate the background for the soft X-ray emission from the Southeast of MSH14-63.3.Data analysisFig.1shows a mosaic of the EPIC observations.It il-lustrates the dramatic change in morphology going from energies of0.5-1keV to those>1keV,in more detail than previously observed by ASCA and BeppoSAX(Vink et al.1997;Bocchino et al.2000).As shown in Fig.2a, the spectra of the soft X-ray regions are dominated by emission lines of O VII,O VIII,Fe XVII and Ne IX,with some spatial variation in relative strength of the line emis-sion.This is illustrated with better resolution by the RGS spectrum of the narrow,bright shell in the Northwest of MSH14-63(Fig.2c).The presence of O VII is especially indicative of a low ionization,which is the result of a low electron tempera-ture,and/or a small ionization time1.A lower limit to the electron temperature is obtained by assuming collisional ionization equilibrium(CIE).This gives temperatures for the spectra in Fig.2between0.10keV and0.17keV,see Table1.2More realistic non-equilibrium ionization(NEI) models result in higher temperature estimates and some-what better spectralfits(Table1).Although there are still discrepancies between the NEI models and the data,possi-bly as a result of sharp density and temperature gradients and projection effects,they indicate that at least some regions have electron temperatures as low as0.2keV.These temperatures are lower than indicated by the ASCA and the BeppoSAX data,but in accordance withLy alphaOVII He alphaFe XVII 2p−3sLy betaNe X Fe XVII 2p−3dNe IX He alphaOVIII Ly alphaOVIII Figure 2.a)Three EPIC PN spectra arbitrary normalized to show a sequence of increasingionizationfrom toptobottom.Thelabels refer to the regions indicated in Fig.1.b)Part of the EPIC-PN spectra from the total hard X-ray emitting region in the Southeast,showing Fe K emission around 6.4keV,indicating underionized iron.c)The first order RGS spectrum of the Northwestern rim,with labels identifying the line emission (cf.Fig.2a).the ROSAT PSPC data of the Northwestern rim (Bocchino et al.2000).The electron temperatures are also consistent with shock velocities of 310-605km/s,inferred from the width of the H αand H βlines,which,under the assump-tion of full electron-ion equilibration (Ghavamian 1999;Ghavamian et al.2001),translates into shock velocities of 310-605km/s,and post shock gas temperatures of 0.11-0.42keV.Spectra from regions dominated by hard X-ray emis-sion are characterized by a dominant continuum and very faint line emission.The spectrum from “hard region 1”,which is one of the brightest hard X-ray emitting regions,shows more prominent line emission than from “hard re-gion 2”.It is not clear whether the more prominent line emission is something intrinsic to this bright X-ray knot,or that this is caused by a superposition of a soft X-ray emitting region,as this part of MSH14-63has a compli-cated morphology.Good heuristic fits to the hard X-ray spectra consist of a power law continuum and a thermal components,but currently the spectral quality of this very diffuse component is not good enough to determine for instance whether the emission lines come from a plasma out of ionization-equilibrium.Clearly,the appearance of the hard spectra in itself can be explained by X-ray syn-chrotron emission,with the line emission belonging to the thermal plasma,which is superimposed on the hard synchrotron continuum,but the XMM-Newton data show that there are two problems with this interpretation.The first problem is that the hard X-ray emitting re-gion in the Southeast as a whole shows evidence for Fe K shell emission at 6.4keV (Fig.2).This confirms the ASCA detection of Fe K emission,but for a different region,and with a lower equivalent width of 0.24keV.Model calcula-tions show that for a solar iron abundance the measured equivalent width is consistent with electron temperatures in excess of ∼3keV,and/or a power law electron distri-bution with an electron index <∼3.3Therefore,only iftions,and the bremsstrahlung gaunt factors proposed by Haug(1997).The Lotz formula was used for Fe K shell ionization cross sections,and an approximate fluorescence yield of 0.3was assumed (see e.g.Mewe (1999)).than for SN1006,where the X-ray synchrotron emission seems confined to a region close to the shock front,and is highly limb brightened(Koyama et al.1995).4.Summary and ConclusionsWe have presented spatially resolved XMM-Newton spec-troscopy of the supernova remnant MSH14-63,which shows that the hard X-ray emission is not correlated with the radio emission.Fe K emission at6.4keV is also present. Both observations contradict the idea that the hard X-ray emission is dominated by synchrotron radiation.The Fe K emission indicates the presence of electrons with energies in excess of the ionization threshold(>∼7keV), but these electrons should also give rise to bremsstrahlung.A non-thermal electron distribution seems likely,as a ther-mal distribution requires electron temperatures kT e>3keV, which is at odds with both the measured shock velocities (Ghavamian1999)and the electron temperatures of the regions dominated by soft X-ray emission.Not discussed so far is the lack of line emission from O VII,which requires that the energetic electrons are part of an otherwise very cool electron distribution(kT e<30 eV).Although we presented evidence for very low temper-atures this clearly deserves future attention.Moreover,as most electrons have low energies it means that the elec-tron density is probably much higher than indicated by the X-ray data.Low temperatures may be the result of in-sufficient electron-ion temperature equilibration.Evidence for weak electron-ion equilibration was obtained from UV spectroscopy of SN1006,indicating T e∼0.05T i,where T i is the ion temperature(Laming et al.1996).Recent cal-culations of ionization fractions for non-thermal electron distributions show that the ion fractions are quite similar to those of the equivalent temperature of the Maxwellian part of the distribution,provided that the plasma is not in ionization equilibrium,as is usually the case in supernova remnants(Porquet et al.2001).Clearly,more model cal-culations are needed to assess the effects of non-thermal electron distributions on the line emission.The evidence for non-thermal bremsstrahlung,raises the question whether other remnants may not have a sim-ilar X-ray component.This may be true,but in general it is hard to judge from hard X-ray tails alone whether the emission is non-thermal bremsstrahlung or X-ray syn-chrotron emission.The situation in MSH14-63is more for-tunate,as the overall electron temperature is relatively cool,which causes the energetic electrons to betray them-selves by causing Fe Kfluorescence emission.Moreover, it is possible that we observe MSH14-63during a special period in its evolution,as non-thermal electron distribu-tions can only exist for a time scale comparable to the electron self-equilibration time scale(τee∼108/n e s,see Itoh1984).This suggests that the extreme properties of the X-ray emission from this remnant may be related to a recent interaction of the blast wave with the steep density Table1.Summary of spectralfits to the spectra of Fig.2a. The degrees of freedom were47for CIE models(i.e.no en-try in column3)and46for NEI models.Elemental abun-dances were assumed to be bels refer to Fig.1.Soft10.088+0.03−0.01-114+136−1049.0±0.11400.14±0.0111.6±0.23.3+1.5−1.16.9±0.2106 Soft20.15±0.01-1.2±0.36.7±0.21590.37±0.1010.3±0.20.06+0.08−0.035.1±0.560 Soft30.17±0.1-1.6±0.66.9±0.11051.1±0.69.9±0.10.02+0.02−0.014.2±0.593。
a r X i v :0804.0111v 1 [a s t r o -p h ] 1 A p r 2008N 2H +and HC 3N Observations of the Orion A Cloud Ken’ichi Tatematsu ,Ryo Kandori ,Tomofumi Umemoto ,and Yutaro SekimotoNational Astronomical Observatory of Japan,Mitaka,Tokyo 181-8588k.tatematsu@nao.ac.jp,kandori@optik.mtk.nao.ac.jp,umemoto@hotaka.mtk.nao.ac.jp,sekimoto.yutaro@nao.ac.jp(Received ;accepted )Abstract The “-shaped filament”of the Orion A giant molecular cloud was mapped in N 2H +J =1→0,and its northern end,the OMC-2/3region was observed also in HC 3N J =5→4and CCS J N =43→32and 76→65.The results are compared with maps of other molecular lines and the dust continuum emission.The N 2H +distribution is similar to the dust continuum distribution,except for the central part of the Orion Nebula.The distribution of H 13CO +holds resemblance to that of dust continuum,but the N 2H +distribution looks more similar to dust continuum distribution.The N-bearing molecules,N 2H +and NH 3seem to be more intense in OMC-2,compared with the H 13CO +and CS distribution.This suggests that OMC-2has higher abundance of N-bearing molecules or higher filling factor of the quiescent gas.We identified 34cloud cores from N 2H +data.Their average physical parameters are T ex =9.2±4.2K,∆v =0.92±0.52km s −1,R =0.086±0.025pc,and M =46±32M ⊙.The masses of cores identified in both N 2H +and H 13CO +in the OMC-2/3region are rather consistent.Over the Orion Nebula region,the N 2H +linewidth is large (1.1−2.1km s −1).In the OMC-2/3region,it becomes moderate (0.5−1.3km s −1),and it is smaller (0.3−1.1km s −1)in the south of the Orion Nebula.On the other hand,the gas kinetic temperature of the quiescent cores observed in N 2H +is rather constant (∼20K)over the -shaped filament.The average N 2H +excitation temperature in Orioncores is ∼1.6times as high as that in Taurus cores (∼5.7K).The N 2H +excitation temperature decreases toward the south,suggesting the core gas density or N 2H +abundance decreases toward the south.We found one peculiar H 13CO +core which is not prominent in either N 2H +,HC 3N,or dust.This core overlaps with the lobe of the intense outflow from a nearby protostar.We detected no CCS emission in the OMC-2/3region.In general,N 2H +and HC 3N distribution is quite similar in the OMC-2/3region,but we observed displacement between N 2H +and HC 3N over 2′scale in OMC-3,which has a chain of Class 0-I protostars (candidates).This displacement might be due to either chemical evolution or effect of protostellar outflows.Key words:ISM:clouds—ISM:individual(Orion Nebula,Orion Molecular Cloud)—ISM:molecules—ISM:structure—stars:formation1.IntroductionMost of stars in the Galaxy form in giant molecular clouds.The molecular cloud core is known to be the site of star formation(e.g.,Beichman et al.(1986)).The evolution of molecular cloud cores in giant molecular clouds is less known,compared with that of low-mass dark cloud cores.In dark clouds,molecules such as CCS,HC3N,NH3,and N2H+,and the neutral carbon atom C0are known to be good tracer of chemical evolution(e.g.,Hirahara et al.1992;Suzuki et al.1992;Maezawa et al.1999;Hirota et al.2002).The carbon chain molecules,CCS and HC3N tend to trace the early chemical evolutionary stage,whereas NH3and N2H+tend to trace the later stage.It is now well known that N2H+,which is less affected by depletion,is one of the best molecular tracers for low-mass star forming regions(e.g.,Caselli et al.1999;Aikawa et al. 2001;Bergin et al.2001;Bergin et al.2002;Caselli et al.2002b;Li et al.2002;Tafalla et al. 2002;Lee et al.2003;Shematovich et al.2003).The Orion A cloud is an archetypal giant molecular cloud.This cloud has been ex-tensively mapped in12CO J=1→0(Heyer et al.1992),in13CO J=1→0(Bally et al. 1987;Nagahama et al.1998),in CS J=1→0(Tatematsu et al.1993),in CS J=2→1 (Tatematsu et al.1998),in NH3(Batrla et al.1983;Cesaroni&Wilson1994),and in H13CO+ J=1→0(Ikeda et al.2007).The dust continuum emission in the Orion A cloud was studied by Chini et al.(1997),Lis et al.(1998),and Johnstone&Bally(1999).The region near Orion KL was studied in many molecular lines by Ungerechts et al.(1997).Of particular interest is the OMC-2/3region,which is the northernmost part of the Orion A cloud.This region is one of the best studied intermediate-mass star forming regions.Chini et al.(1997)investigated the distribution of the dust continuum emission and found at least21 protostellar dust condensations.Aso et al.(2000)observed H13CO+and CO in this region,and identified cloud cores and outflows.Outflows were also observed by Yu et al.(2000);Williams et al.(2003).Takahashi et al.(2006)studied a molecular cloud core and an outflow associated with the protostar MMS7in detail.Tsujimoto et al.(2002);Tsujimoto et al.(2003)investigated the properties of the X-ray sources observed with the Chandra Observatory,and identified/classified them on the basis of near infrared observations(Class I,Class II,and Class III+MS,brown dwarf candidates).Tsuboi et al.(2001)detected the X-ray emission from two protostar candidates in OMC-3.Tsujimoto et al.(2004)concluded that one of these two X-ray sources is the shock-induced X-ray emission by protostellar jet from Class I protostar(s).Johnstone et al.(2003) observed seven submillimeter sources in eight molecular lines and investigated the physical condition.In this study,we revisit the Orion A cloud,including the OMC-2/3region,through newmolecular-line observations.The purposes of this study are(1)to make clear the distribution of the quiescent molecular gas and to compare it with star formation activity,(2)to describe the chemical evolution in the OMC-2/3region,(3)to compare the physical properties of N2H+cores in the Orion massive star-forming region with those in the low-mass star forming dark cloud-shaped found in Taurus,and(4)to investigate variation in N2H+core properties along the“filament.”The distance to the Orion A cloud is assumed to be450pc(Genzel&Stutzki1989).At this distance,1′corresponds to0.13pc.2.ObservationsObservations were carried out by using the45m radio telescope of Nobeyama Radio Observatory from2005May11to20,and from2007March4to9.The employed receiver front ends were the25-element focal-plane SIS array receiver“BEARS”,and the single-element SIS receivers,“S100”and“S40”.We observed N2H+J=1→0at93.1737767GHz(Caselli et al.1995)by using receiver“BEARS”,CCS J N=43-32at45.379033GHz(Yamamoto et al.1990)by using receiver“S40”,CCS J N=76-65at81.505208GHz(Hirota&Yamamoto 2006)by using receiver“S100”,and HC3N J=5-4at45.490316GHz(Yamamoto et al.1990) by using receiver“S40”.CCS and HC3N were observed simultaneously,by using two receivers with the polarization splitter.The half-power beamwidth of the element beam of BEARS was17.′′8±0.′′4at93GHz.Those of S40and S100are38.′′4±0.′′1and18.′′2±0.′′1at43and86 GHz,respectively.The beam separation of“BEARS”is41.′′1.The spacing grid employed in mapping observations with“BEARS”was20.′′55,which is half of the beam separation of elements within the array and close to the half-power beamwidth.The spacing grid employed in“S40”and“S100”observations was40′′.The receiver back end for“BEARS”was a digital autocorrelator and that for“S40”and“S100”was acousto-optical spectrometers.The spectral resolution for“BEARS”was37.8kHz(corresponding to∼0.12km s−1at93GHz)and that for“S40”and“S100”was37kHz(corresponding to∼0.25km s−1at45GHz and0.14km s−1at81GHz).The map reference center is Orion KL at R.A.(J2000)=5h35m14s.5,Dec. (J2000)=−5◦22′30′′.Spectra were obtained in the position-switching mode.The employed offposition is either(∆R.A.,∆Dec.)=(−30′,5′)or(0′,−100′)with respect to Orion KL.We calibrated the gain of each“BEARS”element and obtained the absolute intensity scale in the way described in Tatematsu et al.(2004).The intensity is reported in terms of the corrected antenna temperature T∗A.The main-beam efficiency is0.77±0.03for“S40”,and0.51±0.02 for“S100”and“BEARS”.The telescope pointing was established by observing Orion KL in the43-GHz SiO maser line every1−1.5hours.The data were reduced by using the software package NewStar of Nobeyama Radio Observatory and IDL of Research Systems,Inc.3.Results and Discussion3.1.N2H+ObservationFigures1and2show the distribution of the velocity-integrated intensity of the N2H+ J=1→0F1=2→1hyperfine group.Because the linewidth is broad,we cannot separate hyperfine components well.Therefore,we integrated the three components including the most intense main component.The total length of thefilament is about12pc,and thefigures exhibit filamentary and clumpy structure well.Figures3and4show a comparison of N2H+J=1→0F1=2→1hyperfine group map with850µm thermal dust continuum emission map(Johnstone&Bally1999)in a closerFig.1.The grey-scale map of the velocity-integrated intensity of the N2H+J=1→0F1=2→1hyperfine group.The level interval for the contour is0.749K km s−1.Pluses represent Orion KL(labeled as“Orion KL”)and cores identified in N2H+.Fig.2.The coutour map of the velocity-integrated intensity of the N2H+J=1→0F1=2→1hyperfine group.The contour levels are0.749K km s−1×(1,2,4,8).The intensity maxima of the N2H+cores are shown as pluses.view of Orion KL.These maps show that the N2H+distribution resembles the dust continuum distribution very well.For example,V-shaped structure about15′south of Orion KL is very clear in both maps.However,it should be noted that the Orion bar,which is prominent in the dust continuum,is not seen in N2H+.N2H+is known to be sensitive to quiescent molecular gas,while the dust continuum is sensitive to the photodissociation region(PDR). The dust distribution is thinner in width and more compact than the N2H+distribution,because structures with scales larger than the largest chopper throw(65′′)are missing from the dust continuum map.We identified N2H+cores by using two sets of the velocity channel maps.Thefirst set is0.3km s−1-width velocity channel maps of the F1,F=0,1→1,2component,which is an isolated component of the seven hyperfine components.The advantage of this set is that we can separate molecular gas having different velocities easily.However,in some cases the signal-to-noise ratio is not sufficient.The second set is0.5km s−1-width velocity channel maps of F1 =2→1hyperfine group,which contains the most intense hyperfine component F1,F=2,3→1, 2and two neighboring hyperfine components.This hyperfine group has three components in the velocity range of less than2km s−1,and it is hard to derive detailed velocity structure.On the other hand,we can detect molecular gas having weaker intensities with this set.By taking advantages of these two sets,we have identified a total of34molecular cloud cores in N2H+. Table1summarizes the identification by eye and properties of N2H+cores.The value after ±in the antenna temperature,excitation temperature,optical depth,and linewidth shows the 1σuncertainty in the hyperfinefitting to the spectrum toward the intensity maximum.The bottom row with”ave”lists the average and standard deviation for all cores.The positions of the intensity maxima of the identified cores are illustrated in Figures1, 2,and3.Orion KL is not prominent in N2H+,and is not cataloged as a core.It is located on the eastern bay of the N2H+emission ridge.The basic physical parameters of the identified coresFig.3.The velocity-integrated map of the N2H+J=1→0F1=2→1hyperfine group in a closer view of Orion KL.The level interval for the contour is0.749K km s−1.Pluses represent Orion KL(labeled as “Orion KL”)and cores identified in N2H+.Fig.4.The850µm thermal dust continuum emission map(Johnstone&Bally1999).This map covers the same Dec.range of Figure2.The image is convolved for the angular resolution of the N2H+observation.The level interval for the contour is0.84Jy/beam.Pluses represent cores identified in N2H+.Fig.5.The N2H+spectrum toward the intensity maximum position of N2H+core4.The best-fit hyper-finefitting result is shown as a smooth curve.The velocity axis is for the main N2H+J=1→0component (F1,F=2,3→1,2).are summarized in Tables1and2.The HWHM(half of FWHM)core radius R is measured √asFig.7.The same as Figure5but for N2H+core23Fig.8.The same as Figure5but for N2H+core27We summarize the average physical parameters of N2H+cores with standard deviations. The line width is∆v=0.92±0.52km s−1,core size is R=0.086±0.025pc,column density is N(H2)=(6.7±2.6)×1022cm−2,average density is n(H2)=(1.2±0.4)×105cm−3,and core mass is M=46±32M⊙.We derived the virial parameter,which is defined as the virial mass divided by the core mass,to be0.39±0.32.One possibility is that the actual N2H+abundance is higher than the value we assumed.However,the mass estimation usually accompanies uncertainty-shaped by a factor of2-3.Furthermore,it seems that the N2H+abundance varies over thefilament(see discussion later).Therefore,it would be hard to derive a precise value of N2H+ abundance on the basis of simple analysis assuming virial equilibrium.When we compare Orion N2H+cores with Taurus N2H+cores(Tatematsu et al.2004), Orion cores have2.6,3.2,4.0and32times larger core size,linewidth,H2column density,and core mass than Taurus cores,respectively.The H2column density in Taurus used here is an average for central nine positions taking into account the difference in distance.Figures10and11show a comparison between N2H+(present study)and H13CO+(Aso et al.2000)in a closer view of the OMC-2/3region.Basically,the distribution of these tracers is similar.Close inspection lets us see some differences.First,the H13CO+core AC9is not prominent in N2H+.Second,N2H+core4does not have a tail toward the south,which is seen in the H13CO+and in the dust continuum(Figure4).Third,N2H+cores10and12are more prominent in N2H+than H13CO+counterparts.-shapedfilament.”Next,we investigate the variation of the core properties along the“Figure12plots the N2H+linewidth against the declination.By using the intrinsic N2H+-shapedfila-linewidth,we investigate the velocity dispersion of the quiescent gas along the“ment.”Over the Orion Nebula region,the linewidth is large(1.1−2.1km s−1).In the OMC-2/3 region,it becomes moderate(0.5−1.3km s−1),and it is smaller(0.3−1.1km s−1)in the south of the Orion Nebula.It is important that we observe the tendency in N2H+,which is the molecule least affected from star formation activities such as outflows(Womack et al.1993). It was suggeted that larger linewidths of the quiescent gas to form stars will lead to higher mass accretion rate onto protostars and eventually to more massive stars(see,e.g.,Tatematsu et al.1993).An argument against this idea is that larger linewidths might be a result of more massive star formation.The present study shows a trend in linewidth of the quiescent gas,andFig.9.The same as Figure5but for N2H+core32Fig.10.The velocity-integrated map of the N2H+J=1→0F1=2→1hyperfine group in a closer view of the OMC-2/3region.The level interval for the contour is0.749K km s−1.Pluses represent cores identified in N2H+.Thin straight lines represent the border between OMC-2and OMC-3used by Chini et al.(1997)Fig.11.Reproduction of H13CO+map of Aso et al.(2000),but in J2000coordinates.This map covers the same R.A.and Dec.range of Figure10.Contour intervals are0.36K km s−1starting at0.36K km s−1.The stars mark the1.3mm continuum sources(Chini et al.1997),and the triangles mark the350 km continuum sources(Lis et al.1998).might suggest that variation in linewidth could serve as difference in the initial condition for on-going star formation in the Orion cloud.The core radius does not show any prominent trend against the declination(figure not shown).Figure13shows the temperature variation along-shapedfilament.”The kinetic temperature from CO J=3→2seems to trace the outer, the“warmer,less-dense layer of the cloud externally heated(Wilson et al.1999;see also Castets et al.(1990)).The NH3rotation temperature is about20K over thefilament,implying that the gas temperature of the quiescent dense gas is rather constant.The average and standard devia-tion of the NH3rotation temperature are21.6and5.3K,respectively.A rotation temperature of∼20K corresponds to a gas kinetic temperature of∼20K(Danby et al.1988).Figure3 of Wilson et al.(1999)shows a clear variation in rotation temperature.However,at positions coincident with quiescent cloud cores identified in N2H+and CS,this variation is not seen.It is very interesting that the quiescent Orion cores show constant kinetic temperatures while their linewidth varies along thefilament.The kinetic temperature in quiescent Orion cores are twice as high as that in dark cloud cores(8-10K,see,e.g.,Benson&Myers(1980);Tatematsu et al.(1999))The N2H+excitation temperature decreases toward the south slightly,which means that the core density or N2H+abundance decreases toward the south.Tatematsu et al.(1993) and Tatematsu et al.(1998)suggested that the Orion A cloud has the average density decrease toward the south.In detail,the excitation temperature seems to have its peak around OMC-2.H13CO+in the Orion A cloud was observed by Aso et al.(2000)and Ikeda et al.(2007). The distribution in these maps is consistent in the OMC-2/3region,which was covered by both studies.Ikeda et al.(2007)used automated software to identify cores,while Aso et al. (2000)identified cores through visual inspection.The former identified two times as many cores as Aso et al.(2000)in the OMC-2/3region.Part of this difference might be due to different sensitivities,but we suspect that different core identification methods are the mainFig.12.The N2H+linewidth against the bels“OMC-2”and“OMC-3”represent the positions of N2H+cores4and10,respectively.Fig.13.The temperature against the declination.The gas kinetic temperature from CO J=3→2and NH3rotation temperature(Wilson et al.1999)of cores identified in both CS and N2H+,and N2H+ excitation temperature(present study)of N2H+cores are shown.The solid horizontal line represents20 K.Fig.14.The N2H+linewidth and H13CO+linewidth in the OMC-2/3region.Starless cores and star–forming cores are based on classification in Aso et al.(2000).reason for disparate core numbers.For comparison,we use Aso et al.(2000),which identified cores through visual inspection,for consistency.The cross identification is given in Table2. The column“Aso”lists H13CO+cores in Aso et al.(2000),and column“Paper I”lists CS J =1→0cores in Tatematsu et al.(1993).Using the cores identified in both N2H+and H13CO+,we compare the N2H+and H13CO+ cores in the OMC-2/3region(Figures14,15,and16).The N2H+linewidth tends to narrower than the H13CO+linewidth,which is consistent with the fact that N2H+traces the quiescent molecular gas.The core radius and core mass are rather consistent between these two lines,and it is likely that these two molecular lines trace similar density regions,although the linewidth is different to some extent.On the other hand,only eight cores out of14N2H+(cores1through 14)in the OMC-2/3region have H13CO+counterparts.N2H+cores10and12are more prominent in N2H+than H13CO+counterparts in OMC-2.Tatematsu et al.1993showed that,in a region containing Orion KL and OMC-2(see their Figure4),NH3tends to be stronger in the north(OMC-2)while CS tends to be stronger in the south.Ungerechts et al.(1997)studied molecular distribution around Orion KL(from6′south to6′north),and found that N2H+tends to be stronger in the north,H13CO+shows similar trend but less prominent,and other molecules show different trends(peaked around Orion KL orflat).Figure17shows the antenna temperature of N2H+cores(present study)and H13CO+cores(Ikeda et al.2007)against the declination.The dashed and solid lines delineate the rough upper boundary of the antenna temperature of N2H+and H13CO+,respectively,by connecting local maxima to guide the reader’s eye for the global trend.N2H+is intense in OMC-2(N2H+cores10and12)with respect to the H13CO+intensity variation.Figure18 shows the antenna temperature of N2H+cores(present study)and CS cores(Tatematsu et al. 1993)against the declination.Again,N2H+is relatively intense in OMC-2(N2H+cores10and 12)with respect to the CS intensity variation.The N-bearing molecules,N2H+and NH3seem to be more intense in OMC-2(N2H+cores10and12),compared with the H13CO+and CS distribution.The gas kinetic temperature of quiescent cores is rather constant judging fromFig.15.The N2H+core radius and H13CO+core radius in the OMC-2/3regionFig.16.The N2H+core mass and H13CO+core mass in the OMC-2/3regionFig.17.The antenna temperatures of N2H+(present study)and H13CO+(Ikeda et al.2007)against the declination.The dashed and solid lines connect local maximum intensities in N2H+and H13CO+, respectively,to guide the reader’s eye for the global trend.the NH3rotation temperature.This suggests that OMC-2has higher abundance of N-bearing molecules or higherfilling factor of the quiescent gas.Although OMC-2is known as active star cluster forming region(Johnson et al.1990),it seems that it still has a large reservoir of quiescent gas available for future star formation.Note that N-bearing molecules,N2H+and NH3are late-type molecules.Chini et al.(1997)showed that OMC-3has Class0protostars (candidates)and suggested evolutionary trend from north(OMC-3,younger)to south(OMC-2, older).This trend is consistent with the trend in the chemical properties(N-bearing late-type molecules are more abundant in OMC-2).3.2.HC3N and CCS ObservationsFigure19compares the N2H+with HC3N distribution in the OMC-2/3.Globally,their distribution is quite similar,although they are known to be late-type and early-type molecules in dark cloud chemistry,respectively(Hirahara et al.1992).Both are intense in OMC-2.This is in contrast with the fact that OMC-2is not very prominent compared with OMC-3in H13CO+. OMC-2is known as a cluster forming region(Johnson et al.1990).Although HC3N is known to be a tracer of early chemical evolutionary stage in dark clouds(Hirahara et al.1992),it is not always so.Ungerechts et al.(1997)shows that the HC3N J=10→9and12→11emission are peaked at Orion KL very clearly,although it shows prominent star formation already.On the other hand,Figure4shows that N2H+is rather weak near Orion KL,suggesting that very high temperature due to star formation activity destroys this molecule due to CO evaporation from the dust.The HC3N linewidth around N2H+cores9and10in OMC-2is∼1.2km s−1 and similar to or only slightly larger than the N2H+linewidth.HC3N seems to be abundant in dense,quiescent gas,even with prominent star formation activities.We found the displacement between N2H+and HC3N in OMC-3(Figure20).HC3N shows two emission peaks on both sides of N2H+core4.N2H+core4is associated with two X-ray protostar candidates TKH8and TKH10(Tsuboi et al.2001)(Figure21).Figure 22shows HC3N stamp map(profile map)near TKH8and TKH10.Tsujimoto et al.(2004)Fig.18.The antenna temperature of N2H+(present study)and CS(Tatematsu et al.1993)against the declination.The dashed and solid lines connect local maximum intensities in N2H+and CS,respectively, to guide the reader’s eye for the global trend.Fig.19.The N2H+distribution with the HC3N distribution in the OMC-2/3region.The grey scale represents N2H+and contours represent HC3N.The contour interval is0.227K km s−1.The grey scale ranges from0.2to8.0K km s−1,while the maximum intensity of the N2H+emission is9.3K km s−1.The crosses represent submillimeter protostars(candidates)by Chini et al.(1997)Fig.20.The same as Figure19but close-up for OMC-3.concluded that one of the X-ray emitting protostars,TKH8,is a Class I protostar emitting the X-ray emission from the protostellar jet.A possibility is that the displacement represents the chemical evolution.Another possibility is that the degree of molecular depletion varies along the ridge of OMC-3.It is interesting to check whether there is temperature variation.Wilson et al.(1999)shows that CS cores3,4,and5of Tatematsu et al.(1993)located in OMC-3have NH3rotation temperature T rot=15,19,and20K,respectively.CS core3is located at R.A. (J2000)=5h35m17s.6,Dec.(J2000)=−5◦0′30′′,and corresponds to a HC3N peak on NW side of N2H+core4.N2H+cores4,5,and6have an N2H+excitation temperature of T ex=9.3, 7.5,and6.6K,respectively.The dust spectral index is rather constant in the OMC-2/3region except for MMS6(Lis et al.1998;Johnstone&Bally1999),and the OMC-2/3region has no dust temperature variation except for MMS6.Because there is no evidence that N2H+core4 has lower temperature in OMC-3,it is not easy to explain the displacement between HC3N and N2H+in terms of different degrees of depletion.Tsujimoto et al.(2004)showed that the Class I X-ray protostar TKH8has near-infrared H2jets toward the west,although this jet is very small in size.Aso et al.(2000)showed larger-scale CO outflows in this region.N2H+is known to trace the quiescent gas,and will be suppressed in outflow affected gas.The displacement between HC3N and N2H+peaks observed in OMC-3could represent the chemical evolution or the effect of molecular outflow from protostars.CCS was not detected in the OMC-2/3region in either transitions.We observed CCS over the same region as HC3N(Figure19).We also carried out a strip scan along Dec.(J2000) =−5◦58′07′′,over the right ascension range R.A.(J2000)=5h35m3s.8−33s.2passing through-shapedfilament”but have not detected in either transitions of CCS. the southern part of the“The3σupper limit is0.10K in45.4-GHz CCS and0.25K in81.5-GHz CCS.This means that the Orion A cloud is not very young,which is consistent with a scenario that this cloud was being compressed from the north by the Orion superbubble,whosefirst OB stars formed1−2×10⁷yrs ago.(Bally et al.1987and references therein).There are other important observations showing the difference between the Orion A cloud and the dark cloud TMC-1.The neutral carbon atom C0and the CO isotopomer show very similar distribution in Orion A and B cloudsFig.21.The same as Figure20but with the positions of X-ray protostars(Tsuboi et al.2001).Fig.22.The Stamp map of the HC 3N profile around the X-ray protostars observed by Tsuboi et al.(2001).Spectra are 4-channel (148kHz)binned.The X-ray protostars TKH8and TKH10are shown (Tsuboi et al.2001)(Ikeda et al.1999;Ikeda et al.2002).On the other hand,C 0and the CO isotopomer show quite different distribution in TMC-1.The C 0cloud is located on the south-east side of the CO cloud containing TMC-1,suggesting a chemical evolution from younger C 0cloud to CO cloud (Maezawa et al.1999).This difference will be due to a fact that the Orion A cloud is rather older than TMC-1.The C 0gas in Taurus represents younger part of interstelar cloud,while Orion clouds are more evolved without having younger cloud.The origin of C 0in Orion is the photodissociation region inside clumpy molecular clouds penetrated by the UV radiation.The H 13CO +core AC9(Aso et al.2000,R.A.(J2000)=5h 35m 20s .5,Dec.(J2000)=−5◦5′13′′)is less prominent in N 2H +and dust continuum.We wonder whether this is a young core.Core AC9is not prominent in HC 3N and is not observed in CCS.There is no evidence that this core is young.According to Aso et al.(2000)and Williams et al.(2003),AC9is located at or near the lobe of the intense outflow from MMS9.We suspect that the H 13CO +enhancement is due to the effect of the intense outflow.4.SummaryWe observed N 2H +,HC 3N,and CCS in the Orion A cloud.The N 2H +distribution was found to be very similar to that of the dust continuum except for the central part of the Orion Nebula.The N-bearing molecules,N 2H +and NH 3seem to be more intense in OMC-2,compared with the H 13CO +and CS distribution.This suggests that OMC-2has higher abundance of N-bearing molecules or higher filling factor of the quiescent gas.We identified 34molecular cloud cores on the basis of N 2H +data.The N 2H +excitation temperature in the Orion A cloud is 1.6times as high as that in the Taurus cores.The excitation temperature decreases toward the south,suggesting the core gas density or N 2H +abundance decreases toward the south.The Orion cores have 2.6,3.2,4.0and 32times larger core size,linewidth,H 2column density,and core mass than Taurus cores,respectively.The N 2H +linewidth shows variation along the “ -shaped filament.”The N 2H +linewidth is large (1.1−2.1km s −1)over the Orion Nebula region,moderate (0.5−1.3km s −1)in the OMC-2/3region,and smaller (0.3−1.1km s −1)in the south of Orion Nebula.On the other hand,the gas kinetic temperature of the quiescent cores observed in N 2H +is rather constant (∼20K).The distribution of the HC 3N emission is globally similar to that of N 2H +.We have not detected CCS anywhere in the OMC-2/3region.We found a peculiar starless core,AC9,which is intense in H 13CO +,but is not prominent in the dust continuum or N 2H +.The reason of H 13CO +enhancement could be due to the effect of the lobe of the intense protostellar outflow from the adjacent protostar MMS9.We found。

成都理工大学学生毕业设计(论文)外文译文极,(b)光电子是后来ηNph,(c)这些∝ηNph电子在第一倍增极和到达(d)倍增极的k(k = 1,2…)放大后为δk 并且我们假设δ1=δ2=δ3=δk=δ的,并且δ/δ1≈1的。
我们可以得出:R2=Rlid2=5.56δ/[∝ηNph(δ-1)] ≈5.56/Nel (3)Nel表示第一次到达光电倍增管的数目。
在试验中,δ1≈10>δ2=δ3=δk,因此,在实际情况下,我们可以通过(3)看出R2的值比实际测得大。
请注意,对于一个半导体二极管(不倍增极结构)(3)也适用。
那么Nel就是是在二极管产生电子空穴对的数目。
在物质不均匀,光收集不完整,不相称和偏差的影响从光电子生产过程中的二项式分布及电子收集在第一倍增极不理想的情况下,例如由于阴极不均匀性和不完善的重点,我们有:R2=Rsci2+Rlid2≈5.56[(νN-1/Nel)+1/Nel] (4)νN光子的产生包括所有非理想情况下的收集和1/Nel的理想情况。
为了说明,我们在图上显示,如图1所示。
ΔE/E的作为伽玛射线能量E的函数,为碘化钠:铊闪烁耦合到光电倍增管图。
1。
对ΔE/E的示意图(全曲线)作为伽玛射线能量E功能的碘化钠:铊晶体耦合到光电倍增管。
虚线/虚线代表了主要贡献。
例如见[9,10]。
对于Rsci除了1/(Nel)1/2的组成部分,我们看到有两个组成部分,代表在0-4%的不均匀性,不完整的光收集水平线,等等,并与在0-400代表非相称keV的最大曲线。
表1给出了E=662Kev时的数值(137Cs)在传统的闪烁体资料可见。
从图一我们可以清楚的看到在低能量E<100Kev,如果Nel,也就是Nph增大的话,是可以提高能量分辨率的。
这是很难达到的,因为光额产量已经很高了(见表1)在能量E>300Kev时,Rsci主要由能量支配其能量分辨率,这是没办法减小Rsci 的。
然而,在下一节我们将会讲到,可以用闪烁体在高能量一样有高的分辨率。
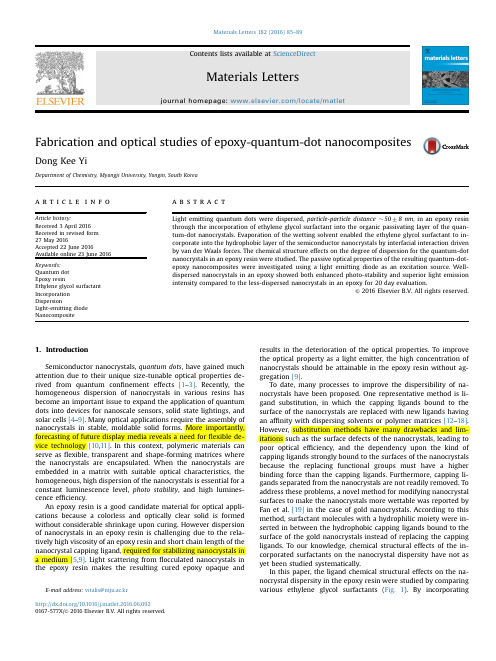
Fabrication and optical studies of epoxy-quantum-dot nanocompositesDong Kee YiDepartment of Chemistry,Myongji University,Yongin,South Koreaa r t i c l e i n f oArticle history:Received3April2016Received in revised form27May2016Accepted22June2016Available online23June2016Keywords:Quantum dotEpoxy resinEthylene glycol surfactantIncorporationDispersionLight-emitting diodeNanocompositea b s t r a c tLight emitting quantum dots were dispersed,particle-particle distance 5078nm,in an epoxy resinthrough the incorporation of ethylene glycol surfactant into the organic passivating layer of the quan-tum-dot nanocrystals.Evaporation of the wetting solvent enabled the ethylene glycol surfactant to in-corporate into the hydrophobic layer of the semiconductor nanocrystals by interfacial interaction drivenby van der Waals forces.The chemical structure effects on the degree of dispersion for the quantum-dotnanocrystals in an epoxy resin were studied.The passive optical properties of the resulting quantum-dot-epoxy nanocomposites were investigated using a light emitting diode as an excitation source.Well-dispersed nanocrystals in an epoxy showed both enhanced photo-stability and superior light emissionintensity compared to the less-dispersed nanocrystals in an epoxy for20day evaluation.&2016Elsevier B.V.All rights reserved.1.IntroductionSemiconductor nanocrystals,quantum dots,have gained muchattention due to their unique size-tunable optical properties de-rived from quantum confinement effects[1–3].Recently,thehomogeneous dispersion of nanocrystals in various resins hasbecome an important issue to expand the application of quantumdots into devices for nanoscale sensors,solid state lightings,andsolar cells[4–9].Many optical applications require the assembly ofnanocrystals in stable,moldable solid forms.More importantly,forecasting of future display media reveals a need forflexible de-vice technology[10,11].In this context,polymeric materials canserve asflexible,transparent and shape-forming matrices wherethe nanocrystals are encapsulated.When the nanocrystals areembedded in a matrix with suitable optical characteristics,thehomogeneous,high dispersion of the nanocrystals is essential for aconstant luminescence level,photo stability,and high lumines-cence efficiency.An epoxy resin is a good candidate material for optical appli-cations because a colorless and optically clear solid is formedwithout considerable shrinkage upon curing.However dispersionof nanocrystals in an epoxy resin is challenging due to the rela-tively high viscosity of an epoxy resin and short chain length of thenanocrystal capping ligand,required for stabilizing nanocrystals ina medium[5,9].Light scattering fromflocculated nanocrystals inthe epoxy resin makes the resulting cured epoxy opaque andresults in the deterioration of the optical properties.To improvethe optical property as a light emitter,the high concentration ofnanocrystals should be attainable in the epoxy resin without ag-gregation[9].To date,many processes to improve the dispersibility of na-nocrystals have been proposed.One representative method is li-gand substitution,in which the capping ligands bound to thesurface of the nanocrystals are replaced with new ligands havingan affinity with dispersing solvents or polymer matrices[12–18].However,substitution methods have many drawbacks and lim-itations such as the surface defects of the nanocrystals,leading topoor optical efficiency,and the dependency upon the kind ofcapping ligands strongly bound to the surfaces of the nanocrystalsbecause the replacing functional groups must have a higherbinding force than the capping ligands.Furthermore,capping li-gands separated from the nanocrystals are not readily removed.Toaddress these problems,a novel method for modifying nanocrystalsurfaces to make the nanocrystals more wettable was reported byFan et al.[19]in the case of gold nanocrystals.According to thismethod,surfactant molecules with a hydrophilic moiety were in-serted in between the hydrophobic capping ligands bound to thesurface of the gold nanocrystals instead of replacing the cappingligands.To our knowledge,chemical structural effects of the in-corporated surfactants on the nanocrystal dispersity have not asyet been studied systematically.In this paper,the ligand chemical structural effects on the na-nocrystal dispersity in the epoxy resin were studied by comparingvarious ethylene glycol surfactants(Fig.1).By incorporatingContents lists available at ScienceDirectjournal homepage:/locate/matletMaterials Letters/10.1016/j.matlet.2016.06.0920167-577X/&2016Elsevier B.V.All rightsreserved.E-mail address:vitalis@mju.ac.krMaterials Letters182(2016)85–89different ethylene glycol surfactants,both well-and inter-mediately-dispersed epoxy-nanocrystal-nanocomposites were prepared and their fluorescence ef ficiency and time dependent photostability were compared.2.Experimental SectionCadmium oxide,oleic acid,trioctylamine,sulfur,selenium,trioctylphosphine oxide,polyethylene glycol oleyl ether (Brij),Brij 52,Brij56,Brij 78,Brij 98,Tergitol NP-9,TX-100were obtained from Aldrich Chemicals and used as received.CdSeS quantum dots were synthesized as follows;cadmium oleate was prepared by reacting 1.6mmol of Cadmium oxide (CdO)and 6.4mmol of oleic acid (OA)in 20mL of trioctylamine (TOA)in a nitrogen atmosphere.The red color of the CdO in the solution faints away as the temperature is raised to 200°C.The solution should be kept at 300°C for at least 30s in order to prepare cadmium oleate to completion,until the solution is colorless.At this point,1mL of 0.2M Selenium:TOP (trioctylphosphine)solu-tion was injected into the resulting cadmium oleate solution and the mixture was maintained at 300o C for 90s.The color of the mixture becomes orange,red,dark red and so forth.Then as-prepared 1mL of 0.2M Sulfur:TOP solution was injected into the reactant drop by drop at the rate of approximately 1mL/min.A precipitate could be obtained by adding a small amount of ethanol.The precipitated nanocrystals were redispersed in chloroform.Subsequently,incorporation of ethylene glycol surfactant into nanocrystals was performed.10mg of CdSeS nanocrystals were dispersed in 1mL of chloroform,this solution was mixed with 500mg of ethylene glycol surfactant (typically Brij).At this point 1mL of ethanol was added to the nanocrystal/surfactant mixture and the chloroform was removed by a rotary evaporator (EYELA)to complete the incorporation processes.And the CdSeS nano-crystal mixture was centrifuged and the residual liquid,containing free surfactants,was decanted.2mL ethanol was added and the CdSeS particles were dispersed again.This washing for the non-binding surfactants was repeated one more time and the CdSeS particles were dried in a vacuum oven.Layered epoxy-nanocrystal composite samples were prepared on pre-cleaned quartz slides.First,dried 7578mg of the ligand-incorporated CdSeS nanocrystals were mixed with 1mL of an epoxy resin and stirred.The bifunctional epoxy prepolymer usedwas a liquid diglycidyl ether of bisphenol A (DGEBA)from Dow Chemical.The cyclo-aliphatic diamine curing agent used was iso-phorone-diamine from Fluka.The mixture was dropped onto a clean quartz slide,and another quartz slide was laid thereon.After inserting two cover glasses (thickness:about 150m m)on either side of the film to adjust its thickness,the quartz slides were fixed using a clip.The film was cured at 150°C for one hour to produce an optically transparent nanocrystal-containing thin film sample having a thickness of 13975m m (Fig.1).The cross-sectional area of the epoxy-nanocrystal composite samples was investigated using a transmission electron microscopy (TEM,Tecnai G2FEI).The fluorescent emission spectra and intensity of each nano-composite sample were measured using a home-made photo-in-tensity detecting system interfaced with USB 2000FL (Ocean op-tics),while UV-Vis spectroscopy was used to prepare samples of similar absorbance.In this system,excitation light sources emitted power-tunable light at 410nm and the excited epoxy-nanocrystal composite showed variable fluorescence intensity according to the power of the excitation light source.For understanding the time-dependent photostability,fluorescence intensity and spectra were analyzed for 20days continuously.3.Results and discussionThe effects of surfactant chemistry on the degree of dispersity of nanocrystals in the epoxy resin were studied with various ethylene glycol surfactants,which were incorporated with surface ligands of nanocrystals.For systematic approaches,chemical structure of ethylene glycol was classi fied by (1)number of ethy-lene glycol units,(2)existence of unsaturated double bond within a hydrocarbon chain,and (3)existence of bulky and stiff functional groups within a hydrocarbon chains (see Fig.1bottom).To de-termine the degree of dispersion of the nanocrystals as a function of the number of ethylene glycol units in the hydrophilic moiety of the surfactant,Brij98containing 20ethylene glycol units and Brij93containing 2ethylene glycol units were incorporated with nanocrystals,and the resulting nanocrystals were dispersed with an epoxy and passed through a syringe filter of 200nm pores via a mechanical injection system (320μL/s)(See the supporting in-formation).The degree of dispersion of the nanocrystals was evaluated,and characterized using the following criteria:(a)“dispersed ”;the mixture of the nanocrystals and the epoxyresinFig.1.A schematic view of the experiments;ethylene glycol surfactant was incorporated in between the surface ligands of the nanocrystals and the resulting epoxy-nanocrystal composites were prepared.D.K.Yi /Materials Letters 182(2016)85–8986was completely passed through the filter,(b)“intermediately dis-persed ”;the mixture was partially passed through the filter,and (c)“not dispersed ”;the mixture was not substantially passed through the filter.Fig.2shows that the nanocrystals between which the Brij98was incorporated are well dispersed in the epoxy prepolymer and thus transparent and homogeneous feature was obtained (Fig.2(a)left image),whereas the nanocrystals between which the Brij93was incorporated resulted in more opaque and non-homogeneous feature from the bottom to the top (Fig.2(a)right image).Further,the luminescence of each state of the dispersion was investigated under a UV excitation at 365nm.The Brij98incorporated nanocrystals exhibited more bright and homogeneous fluorescence (Fig.2(b)left image)over the whole area than the Brij93incorporated nanocrystals (Fig.2(b)right image).Since the UV lamp was placed below of the cuvette cell,the cuvette bottom shows the brightest emission for both cases.Next,the effects of saturated and unsaturated bonding on the dispersion property were studied using Brij98,unsaturated,and Brij78,saturated (see Fig.1bottom).Although the Brij78in-corporated nanocrystals exhibited comparable dispersion features (see Fig.2(c)left),the fluorescence image showed quite high in-homogeneity (see Fig.2(c)right)similar to that seen in the case of Brij93.Finally the effects of bulky and stiff groups on the disper-sion property were studied using Brij56,TX-100,and Tergitol NP-9(see Fig.1bottom).Comparing these three surfactants we note that they have the same number of ethylene glycol units,10,but the hydrocarbon chains have different chemical structures.Fol-lowing previously mentioned criteria for the degree of dispersion,TX-100showed dispersed nature,Brij56failed to disperse the nanocrystals,while Tergitol NP-9showed intermediate dispersing property (see supporting information).Fig.2(d)gives a summary for this chemical structural dependency of the dispersing proper-ties.These experimental results indicate that as the hydrocarbon chain increases in bulk and stiffness due to the presence of a benzene ring and a side chain,the insertion force of the surfactant increases and thus the degree of dispersion of the nanocrystals is improved.Further studies on the dispersity effects of the morphological and optical properties were carried out using two different sys-tems,(1)well dispersed,using Brij98,and (2)intermediately-dispersed,using Brij78.Fig.3shows layered epoxy-nanocrystal composites that are prepared using the epoxy resin and CdSeS nanocrystals dispersed in the resin;hereafter,EC98means epoxy-nanocrystal composites with Brij98and EC78means epoxy-na-nocrystal composites with Brij78.In comparison with EC98,EC78did not show opaqueness but showed less transparency due to scattering of penetrating light via the aggregation of nanocrystals,and TEM micrograph showed that particle-particle distance was about 470.5nm with dense array (Fig.3(a)).Aggregates of nanocrystals were also observed (Fig.3(a)right inset box).How-ever EC98exhibited higher transparency due to a loose array of nanocrystals,particle-particle distance 5078nm (Fig.3(b)).The resulting nanocomposites were exposed to tunable power light-emitting diodes (LED)(λemission ¼410nm).Both samples were prepared to absorb same incident light intensity (Fig.4(a),absor-bance spectra).Fluorescence spectra showed the improvement of fluorescence intensity of EC98compared to that of EC78;the use of Brij78surfactant decreased the ef ficiency about 43.1%(error less than 1%),and a red-shift of emission peak by 4nm compared to EC98was observed (Fig.4(a),fluorescence spectra).The red-shift of the emission spectrum can be ascribed to the existence of na-nocrystal aggregation [20,21].Furthermore,the emitted fluores-cence intensity was proportional to the current of the excitation LED for both samples (Fig.4(b)).In the entire current range of the LED,the well-dispersed system,EC98,showed higher intensity value.The lower fluorescence intensity of EC78is ascribed tobothFig.2.(a)Macroscopic images of epoxy-prepolymer-nanocrystal dispersion for the case of using Brij 98(left),and Brij 93(right),and (b)the corresponding fluorescence images,left for Brij 98,and right for Brij 93.(c)Non-fluorescence (left),and fluorescence (right)image for Brij 78.D.K.Yi /Materials Letters 182(2016)85–8987surface defects and the existence of aggregated nanocrystals;output light intensity is inversely proportional to the radius of the scattering particle by exponential cubic function [22].To in-vestigate the photostability,both EC78and EC98samples were exposed to the LED for 20days,and the output fluorescence was measured.Fig.4(c)shows normalized fluorescence intensities (error less than 2%)for comparing EC78(open square)and EC98(closed square).As aging time increases the epoxy resin undergoes photo-induced oxidation and light scattering points increased;especially UV light,like our experimental,can enhance the de-gradation of polymer structures and cause yellowing under the oxygen environment.Our thin film composite, 13975m m thick,is weaker to the environmental oxygen diffusion compared to bulk film.Consequently the scattering of fluorescence light increases and the measured fluorescence decreased.Although both EC78and EC98were under the effects of photo-curing,EC78showed prominent decrease of the light intensity over 13days.We spec-ulate that the curing effects synergistically froze the aggregated nanocrystals in the resin and induced increased scattering of fluorescent light.For long term photo-stability of the composites,it would be suggested to decrease the photo-oxidation of epoxy matrix by adoption of (1)vacuum curing (decreasing oxygen en-vironment),(2)stoichiometric control of curing agent feeding (for avoiding free amine involving in the progress of photo-oxidation),and (3)introduction of protecting function [23].Besides the con-trol of epoxy matrix,both quantum dot-matrix interface chemistry study and appropriate quantum dot surface passivation develop-ment are needed.4.ConclusionsFor improving compatible and optically effective nanocrystal-epoxy resin nanohybrids,the effects of surfactant structures on the degree of dispersity of the nanocrystals in the epoxy resin were studied.The resulting correlation of degree of dispersity and li-gand chemical structure can expand our understanding of nano-particle dispersion phenomena.Furthermore,the optical proper-ties of the well-dispersed and intermediately-dispersed hybrids were compared.Nanocrystal dispersity plays a key roleinFig.3.TEM cross sectional views for the epoxy-nanocrystal composites.(a)By using Brij 78(intermediately-dispersed case),and by (b)using Brij 98(well-dispersed case).D.K.Yi /Materials Letters 182(2016)85–8988improving outputfluorescent light intensity and stability.Our work can be further extended to create advancedflexible quantum dot-LED systems and various nanocomposite-based electronic devices.AcknowledgmentThis work was supported by2015Research Fund of Myongji University in Korea.Appendix.Supporting informationSupplementary data associated with this article can be found in the online version at /10.1016/j.matlet.2016.06.092.References[1]S.A.Empedocles,D.J.Norris,M.G.Bawendi,Phys.Rev.Lett.77(1996)3873.[2]D.J.Norris,M.G.Bawendi,Phys.Rev.B53(1996)16338.[3]A.P.Alivisatos,J.Phys.Chem.100(1996)13226.[4]Z.J.Jiang,Zh Huang,P.P.Yang,J.F.Chen,Compos.Sci.Technol.68(2008)3240.[5]M.Kazes,T.Saraidarov,V.Banin,Adv.Mater.21(2009)1716.[6]J.H.Zhou,H.Yan,Y.Z.Zheng,Adv.Funct.Mater.19(2009)324.[7]E.Mani,E.Sanz,P.G.Bolhuis,W.K.Kegel,J.Phys.Chem.C114(2010)7780.[8]J.Ziegler,S.Xu,E.Kucur,Adv.Mater.20(2008)4068.[9]D.Z.Sun,H.J.Sue,N.Miyatake,J.Phys.Chem.C112(2008)16002.[10]T.H.Kim,et al.,Nat.Photonics5(2011)176.[11]M.K.Kim,D.K.Yi,U.Paik,Langmuir26(2010)7552.[12]S.J.Choi,D.K.Yi,J.Y.Choi,J.-B.Park,I.-Y.Song,E.Jang,J.I.Lee,M.An,J.D.Hong,S.M.Yoon,H.J.Shin,J.Nanosci.Nanotechnol.(2009)2841.[13]D’Unger Daniel,Measuring Ligand Exchange on the Surface of Gold Nano-particles:A Study of Competitive Binding of Ligands utilizing Fluorescent re-sonamce Energy Transfer(Thesis Paper),Clemson University,2012.[14]K.S.Mayya,B.Schoeler,F.Caruso,Adv.Funct.Mater.13(2003)183.[15]E.Zillner,S.Fengler,P.Niyamakom,F.Rauscher,K.Köhler,T.Dittrich,J.Phys.Chem.C116(2012)16747.[16]H.Y.Fan,E.W.Leve,C.B.Jeffrey,Nano Lett.5(2005)645.[17]T.Pellegrino,L.Manna,W.J.Parak,Nano Lett.4(2004)703.[18]S.Rana,A.Bajaj,R.Mout,V.M.Rotello,Adv.Drug Deliv.Rev.64(2012)200.[19]H.Y.Fan,K.Yang,D.M.Boye,T.Sigmon,K.J.Malloy,H.F.Xu,G.P.Lopez,C.J.Brinker,Science304(2004)567.[20]C.B.Murray,C.R.Kagan,M.G.Bawendi,Annu.Rev.Mater.Sci.30(2000)545.[21]L.Spanhel,M.A.Anderson,J.Am.Chem.Soc.113(1991)2826.[22]B.M.Novak,Adv.Mater.5(1993)422.[23]P.Musto,M.Abbate,M.Pannico,G.Scarinzi,G.Ragosta,Polymer53(2012)5016.Fig.4.(a)Absorbance(left axis),andfluorescent emission intensity(right axis),(b)emission dependency on the excitation light power;solid line for epoxy-na-nocrystal composites using Brij98(EC98),and dotted line for the composites usingBrij78(EC78).(c)Time dependent emission intensity of EC78(open squares)andEC98(closed squares).D.K.Yi/Materials Letters182(2016)85–8989。

热敏传感器英语作文Title: The Application and Principle of Thermistor Sensors。
Thermistor sensors play a crucial role in modern technology, particularly in areas such as temperature measurement, control systems, and electronic devices. In this essay, we will delve into the application and principle of thermistor sensors, exploring their significance and functionality in various fields.Firstly, let's understand what a thermistor sensor is.A thermistor is a type of resistor whose resistance varies significantly with temperature. It consists of a semiconductor material that exhibits a large change in resistance proportional to a small change in temperature. This unique characteristic makes thermistors invaluable in temperature sensing applications.One of the primary applications of thermistor sensorsis in temperature measurement. They are widely used in industries such as automotive, aerospace, and manufacturing, where precise temperature monitoring is essential for ensuring optimal performance and safety. Thermistor sensors are integrated into thermometers, thermostats, and temperature control systems to accurately measure and regulate temperature variations in various environments.Another significant application of thermistors is in electronic devices, particularly in circuits requiring temperature compensation. Due to their predictable and consistent resistance-temperature relationship, thermistors are utilized to stabilize and calibrate electronic circuits, ensuring their reliable operation across different temperature ranges. They are commonly employed inelectronic thermometers, HVAC systems, and consumer electronics to maintain consistent performance undervarying thermal conditions.Now, let's delve into the principle behind thermistor sensors. The resistance of a thermistor varies inverselywith temperature, meaning that as the temperature increases,the resistance decreases, and vice versa. This behavior is governed by the material's temperature coefficient of resistance (TCR), which quantifies the rate of change in resistance per unit change in temperature.There are two main types of thermistors: negative temperature coefficient (NTC) and positive temperature coefficient (PTC). NTC thermistors exhibit a decrease in resistance with an increase in temperature, whereas PTC thermistors show the opposite behavior, with resistance increasing as temperature rises. The choice between NTC and PTC thermistors depends on the specific application requirements and temperature range.The relationship between resistance (R) and temperature (T) in a thermistor can be described by the Steinhart-Hart equation:\[ \frac{1}{T} = A + B \cdot \ln(R) + C \cdot(\ln(R))^3 \]Where \( A \), \( B \), and \( C \) are constantsspecific to the thermistor material and configuration.In conclusion, thermistor sensors are indispensable components in modern technology, facilitating precise temperature measurement and control in various applications. Their unique resistance-temperature characteristics,coupled with the principles of semiconductor physics,enable them to play a vital role in temperature sensing and compensation systems. As technology continues to advance, thermistors will undoubtedly remain integral to theevolution of temperature-sensitive devices and systems.。
黑洞吞噬恒星作文英语Title: The Phenomenon of Black Holes Devouring Stars。
Introduction:The universe, a vast expanse filled with mysteries beyond comprehension, houses some of the most enigmatic entities known to humanity. Among these, black holes stand as enigmatic giants, capable of consuming entire stars with their gravitational might. In this discourse, we delve into the intricate phenomenon of black holes engulfing stars, exploring the mechanisms behind such cosmic events andtheir profound implications for our understanding of the universe.Formation of Black Holes:Black holes originate from the collapse of massive stars at the end of their life cycle. When a star exhausts its nuclear fuel, it undergoes gravitational collapse,compressing its core into an incredibly dense state. If the remnant mass exceeds a critical threshold known as the Chandrasekhar limit, gravitational forces overwhelm all other forces, leading to the formation of a black hole.The Event Horizon:At the heart of a black hole lies the singularity, a point of infinite density where the laws of physics as we know them break down. Surrounding the singularity is the event horizon, an invisible boundary beyond which escape becomes impossible due to the overwhelming gravitational pull. It is at this boundary that the fate of stars becomes intertwined with the destiny of black holes.The Stellar Dance:When a star ventures too close to a black hole, it becomes ensnared in a lethal gravitational embrace. The intense tidal forces exerted by the black hole deform the star, stretching it into a long, thin structure known as a tidal tail. As the star spirals inward, its outer layersare gradually stripped away, forming a swirling accretion disk around the black hole.The Final Plunge:As the remnants of the star's outer layers accrete onto the disk, they release an immense amount of energy in the form of radiation. This process, known as accretion, generates powerful jets of high-energy particles thatstream outward from the black hole's poles. Meanwhile, the star's core, now exposed and vulnerable, hurtles toward the event horizon, crossing the point of no return known as the photon sphere. In a final, cataclysmic act, the star's core is consumed by the black hole, adding to its mass and extending its reach across the cosmos.Cosmic Significance:The phenomenon of black holes devouring stars holds profound implications for our understanding of the universe. By studying the emission signatures associated with these events, astronomers can glean insights into the propertiesof black holes, such as their mass, spin, and accretion rate. Furthermore, the gravitational waves produced by such cataclysmic events provide a unique opportunity to probe the fabric of spacetime itself, offering clues about the nature of gravity and the structure of the universe on the largest scales.Conclusion:In the vast tapestry of the cosmos, the interplay between black holes and stars represents a cosmic ballet of destruction and creation. From the fiery demise of stars to the inexorable pull of black holes, these celestial phenomena shape the evolution of galaxies and the destiny of the universe itself. As we continue to unravel the mysteries of the cosmos, the phenomenon of black holes devouring stars stands as a testament to the awe-inspiring power and beauty of the cosmos.。
一种热解炭在金属钠中的相变徐子颉*吉涛王玮衍夏炳忠马超甘礼华(同济大学化学系,上海200092)摘要:通过酚醛树脂的裂解和碳化所形成的热解炭与金属钠在氩气保护气氛中加热,得到一种无定形碳在常压和较低温度下进行石墨化的方法,并研究了热解炭在金属钠熔体中的相变.对所得样品用X 射线粉末衍射(XRD)、光散射拉曼光谱、透射电子显微镜(TEM)以及Brunauer-Emmett-Teller (BET)法氮气吸附进行表征与分析.结果表明:热解炭在金属钠熔体中于800°C 加热24h,发生明显的石墨化;于900°C 加热24h,所得样品的石墨化度为40%,石墨化碳的平均厚度约为40nm,孔结构由微孔转变为介孔.探讨了金属钠在无定形碳中的渗透扩散导致其相变的原因.关键词:酚醛树脂;热解炭;石墨化;金属钠;相变中图分类号:O642;O792Phase Transformation of Pyrocarbon in Molten Sodium MetalXU Zi-Jie *JI TaoWANG Wei-YanXIA Bing-ZhongMA ChaoGAN Li-Hua(Department of Chemistry,Tongji University,Shanghai 200092,P .R.China )Abstract :A method to graphitize amorphous carbon was carried out by annealing pyrocarbon from crackedphenolic resin in molten sodium metal at a lower temperature and ambient pressure and the phase transformation of pyrocarbon from amorphous carbon to crystallized carbon was studied.X-ray diffraction (XRD),Raman scattering spectroscopy,transmission electron microscopy (TEM),and nitrogen gas physisorption by the Brunauer-Emmett-Teller (BET)method were used to probe the prepared samples for carbon composition,particle size,and morphology.The graphitization of amorphous carbon was obvious when being annealed in molten sodium metal in argon atmosphere at 800°C for 24h.For the sample annealed at 900°C for 24h,the degree of graphitization was 40%and the average thickness of the graphitized carbon layers was about 40nm.The effect of sodium metal infiltration into the matrix of amorphous carbon on the graphitization is also discussed.Key Words :Phenol resin;Pyrocarbon;Graphitization;Sodium metal;Phase transformation[Article]物理化学学报(Wuli Huaxue Xuebao )Acta Phys.⁃Chim.Sin .,2011,27(1):262-266JanuaryReceived:August 9,2010;Revised:September 12,2010;Published on Web:November 15,2010.∗Corresponding author.Email:xuzijie-tj@;Tel:+86-21-65982654-8430ⒸEditorial office of Acta Physico ⁃Chimica Sinica炭/炭复合材料是一种多相非均质混合物,因其具有高比强度、高比模量等显著的材料结构性能,逐渐成为新一代航空航天材料的发展方向.然而炭/炭复合材料的石墨化,会影响该类材料的力学性能、物理性能和化学性能,是最重要的结构控制因素之一,通过调整该类材料的石墨化状态,可改善其综合性能,从而满足不同的使用要求.因此,开展无定形碳材料在较低温度下的石墨化研究对炭/炭复合材料的应用具有重要的意义.无定形碳的石墨化就是在一定的二维平面范围内有序的乱层结构碳的残片进行定向重排的相变过程.由于在该相变过程中,无定形碳容易形成亚稳态,使得这种相变的阻力增大,因此商品化石墨的生产一般都在2700°C 左右进行.但是,在如此高温条件下进行石墨化,使得材料的力学和电学性能受到损害,如无定形碳材料在2700°C 经石墨化262No.1徐子颉等:一种热解炭在金属钠中的相变所得样品的放电容量为74mAh·g-1,而在1000℃温度条件下石墨化后,所得样品的放电容量为250 mAh·g-1[1].目前,基于溶解再析出和碳化物转化机理的催化石墨化方法可以有效地降低石墨化温度,具体方法主要有两类:其一,在碳基质中加入过渡金属及其氧化物,如Fe、Mn、Cr等过渡金属及其氧化物[2-3];其二,在碳基质中形成三组分的插层化合物,如Tanaike等[4]将金属Li、Na和K溶于四氢呋喃中,获得相应的有机金属化合物,结果表明所得材料的石墨化度很低.Rojas-Cervantes[5]和Oya[6]等合成了分别含有金属Na、K、Mg和Zr的碳的干凝胶,在1000°C氮气气氛中烧结,没有发现这些金属的催化活性,得到的仍然是无定形碳.由于酚醛树脂产碳量高,常被用作制备先进碳材料的先驱物.选用酚醛树脂类物质作为碳源,经热解后得到热解炭,开展其石墨化的研究近年来已引起人们的重视.张福勤等[7]研究了化学气相沉积热解炭的可石墨化性;王永刚等[8]采用化学气相渗透对泡沫碳进行复合处理,在2500°C得到石墨化泡沫碳;周德凤等[9]报道了在酚醛树脂中加入氯化锌,可以改变热解炭的微观结构及石墨化程度;Chen等人[10-11]使用硝酸镨作催化剂研究其对酚醛树脂热解炭的石墨化作用,在催化剂含量为15%(w)以及2400°C时获得最优化的石墨化条件,他们还用含量为29%(w)的石墨氧化物作催化剂在2400°C时获得较完整的石墨结构;Cai等[12]使用含量为5%(w)的铁镍催化剂,在外加磁场以及1200°C时实现酚醛树脂的石墨化.除此之外,还有文章报道[13]使用金属钇作催化剂研究酚醛树脂的催化石墨化.本文通过将酚醛树脂裂解和碳化后形成的热解炭与金属钠在氩气保护下加热,开展无定形碳在金属钠熔体中的相变研究.采用X射线粉末衍射(XRD)以及激光散射拉曼光谱技术,对所得样品碳组成的相态以及层内、层间碳原子的状态进行表征;通过透射电子显微镜(TEM)观察碳组成的形貌,通过比表面积分析研究热解炭在石墨化前后孔结构特征的变化.探讨了金属钠在无定形碳基质中的渗透与扩散对无定形碳相变产生的影响.该方法可用于新型结构的炭/炭复合材料的石墨化研究中.1实验1.1热解炭的制备将市售酚醛树脂(2130型,无锡久耐防腐材料有限公司)放入烘箱(102A-2型,上海试验仪器总厂)中,调节温度到80°C,保温10h,再升温至120°C,保温10h,继续升温至140°C并保温24h,使酚醛树脂完全固化.将固化后的酚醛树脂放入管式炉(SK2-15-13T型,上海实验电阻炉厂)中,通入氩气保护,以10°C·min-1的升温速率升温至200°C,保温3 h,再以相同的升温速率升温至800°C并保温4h,得到热解炭.1.2石墨化方法称取5g按上述方法制备的热解炭,放入带盖的坩埚中,在充有氩气的手套箱(ZKX1型,南京南大仪器厂)内切割金属钠块,并称取3g放置其表面,再将坩埚置于管式炉(SK2-15-13T型,上海实验电阻炉厂)中并通入氩气保护,以10°C·min-1的升温速率升温至所设定温度并保温24h,本实验所设定的温度分别是600、700、800和900°C;将所得样品用蒸馏水超声清洗,直至洗液的pH值为7,再将清洗后的用品在烘箱(102A-2型,上海试验仪器总厂)内于120℃干燥.1.3表征方法使用D8FOCUS型X射线粉末衍射仪(德国, Bruker AXS)对样品进行XRD表征,测试条件为40 kV,40mA,Cu Kα射线;使用Renishaw inVia激光拉曼光谱仪(英国,Renishaw)对所得样品进行拉曼光谱分析;使用S-TWIN F20型场发射透射电镜(荷兰, FEI)对样品进行TEM形貌表征;使用Micromeritics Tristar3000比表面积测定仪(美国,Micromeritics),采用Brunauer-Emmett-Teller(BET)法分析样品的比表面积、孔径分布以及孔结构特征.2结果与讨论选用酚醛树脂作为碳源,经800°C热解、碳化后得到热解炭,用以研究无定形碳材料在金属钠熔体中的相变.由于残存于样品中的金属钠在样品的后处理中遇到空气被氧化,形成的氧化钠成分在XRD检测时会产生很强的衍射峰,干扰了对碳组成的表征,因此,样品在表征前必须经蒸馏水洗涤,去除氧化钠组分.2.1不同温度条件下热解炭在金属钠中的相变图1是热解炭在不同温度条件下进行热处理所得样品的XRD谱.图谱(1)为在没有金属钠存在的条件下,将热解炭在900°C保温24h,所得样品的碳组成仍然是典型的无定形碳,表明无定形碳在此温263Vol.27Acta Phys.⁃Chim.Sin.2011度时没有发生相变.当热解炭与金属钠在600°C 加热24h,得到谱(2),根据文献[6]的解释,表明金属粒子已经渗透和扩散在无定形碳的基质中,使得其中的乱碳结构残片开始在局部进行重新取向,导致2θ分别在25°和45°附近出现较为明显的漫衍射峰.当热解炭与金属钠中的加热温度为700°C 时,得到谱(3),从中可见其特征衍射峰已经明显锐化,表明此时热解炭中的无定形碳已经晶格化.当加热温度升高至900°C ,得到谱(4),显示石墨化碳的特征衍射峰更加锐化.当样品的加热温度从700°C 升高至900°C 时,样品的衍射数据也相应发生变化,其中2θ值从25.9°增加至26.3°,相应的d 002值从0.3433nm 变为0.3406nm.根据Mering 和Maire 公式[14],样品的石墨化度可由G =((0.3440-d 002)/(0.3440-0.3354))×100%计算得到,当加热温度从700°C 升高至900°C 时,所得样品的石墨化度分别从8.5%增加至40%.对一系列样品的XRD 表征结果的分析表明,在金属钠熔体中,无定形碳的碳组成发生明显的变化,随着加热温度的升高,热解炭的石墨化特征愈加明显.图2是所选样品的拉曼谱图.在1350、1570和2700cm -1处的谱峰被分别称为D 、G 和G ′峰.图谱中D 峰是发生于相同碳原子间的拉曼振动模式,G 峰则表示两种不同碳原子之间的光子振动模式,而G ′峰表示一种源自晶面之间的碳原子所发生的光子振动模式,是一种二阶拉曼散射过程.谱图(1)是酚醛树脂裂解碳在没有金属钠存在的条件下,经过900°C 加热后所得样品的拉曼谱图,图谱中D 峰强度高于G 峰并且两峰没有完全分离,另外,图谱中无G ′峰,表明样品对激光的漫散射分别在乱碳结构残片内部的碳原子以及乱碳结构残片间进行,这种光子振动模式证明了热解炭中的无定形碳含有二维有序的乱碳结构而且呈现杂乱无章地堆积.图谱(2)是热解炭在金属钠中,经过700°C 加热所得样品的拉曼谱图,此时D 峰强度降低,G 峰强度增加并呈现两峰分离的迹象,表明激光在样品中不同碳原子间的光子振动模式加强.另外,图谱中同时呈现一个明显的G ′峰,表明光子振动发生在石墨化层间的碳原子之间,进一步说明乱碳结构残片在此时已经发生明显的定向重排.图谱(3)是热解炭在金属钠中,经过900°C 加热所得样品的拉曼谱图,此时D 峰强度明显降低,G 峰强度明显增加而且两峰完全分离,表明光子的振动模式主要发生在晶面之间的碳原子中,说明该样品中的碳原子已经转变为石墨结构.2.2金属钠在无定形碳中的渗透与扩散对其相变的影响根据对所得样品进行的XRD 和拉曼谱分析知,在没有金属钠存在时,热解炭在900°C 加热条件下没有发生相变,而有金属钠存在的条件下,无定形碳在700°C 加热24h 后,观察到无定形碳开始向结晶态碳转化,随着加热温度的升高,这种相态转化更加明显.因此,金属钠的存在是导致热解炭在加热条件下发生相变的必要因素.虽然目前对金属钠与碳组成的相互作用机制进行原位的实时表征和分析还比较困难,但是,根据XRD 和拉曼的表征结果,不仅证实了这种相变的发生,而且揭示金属钠对该相变的重要影响,即金属钠原子在无定形碳中的渗透与扩散引起了其中乱碳结构残片的重排与取向.当金属图1热解炭在不同条件下退火24h 的XRD 图谱Fig.1XRD patterns of pyrocarbons annealed at differentconditions for 24h(1)900°C without sodium metal;(2)600°C,(3)700°C,and(4)900°C in molten sodiummetal2热解炭在900°C (1)以及在金属钠中于700°C (2)和900°C (3)加热24h 的拉曼图谱Fig.2Raman spectra of pyrocarbons annealed at 900°Cwithout sodium metal (1)and at 700°C (2),900°C(3)in molten sodium metal for 24hNo.1徐子颉等:一种热解炭在金属钠中的相变钠原子渗入到乱碳结构残片间,钠原子外层电子的高活泼性,影响了残片中碳原子周围的电场环境,同时渗透与扩散在其中的钠原子可以形成金属钠的连续相,并充当优良的导热介质,使得无定形碳在石墨化过程中的结晶潜热能够通过导热介质及时地向周围环境释放,从而有利于无定形碳在较低温度条件下发生相变.金属钠在无定形碳中的渗透、扩散与加热温度密切相关.随着加热温度的升高,对所得样品的XRD 和拉曼表征结果都表现出了高度的一致性,即石墨化度增加.无定形碳在金属钠中的相变过程示意图如图3所示.对样品形貌学的观察进一步证实了金属钠对热解炭在其中发生相变的影响.图4(a)是热解炭与金属钠在700°C 加热24h 所得样品的TEM 照片,图中“A ”所在区域为无定形碳,“T ”所在区域显现出湍流碳的形貌特征,“G ”区域则显现出石墨化碳的形貌特征.通过对样品不同区域进行TEM 观察,发现湍流碳总是出现在无定形碳和石墨化碳的过渡区域,其形貌特征显示出无定形碳中的乱碳结构残片已在有限范围内进行了定向重排,但不够完整.在700°C 加热条件下,金属钠在无定形碳中的渗透与扩散不完全,没有形成均匀的金属钠连续相,使得乱碳结构残片的定向重排过程不能在长程范围内连续进行.湍流碳的出现使得无定形碳向石墨化碳转化的阻力增加,这也是商品化石墨必须在高温条件下生产的主要原因.图4(b)是热解炭与金属钠在900°C 加热24h 所得样品的TEM 照片,随着加热温度的升高,石墨化碳的厚度与长度显著增加,所得样品中石墨化碳的平均厚度约为40nm,显然升高温度加速了金属钠在碳基质中的渗透与扩散,有利于无定形碳向石墨化碳的转化.2.3在金属钠作用下热解炭中孔结构特征的变化图5是热解炭在金属钠中发生相变前后样品的对氮气的吸附-脱附等温线.从图中可见,热解炭样品的吸附-脱附等温线属于类型I,插图所示的孔分布曲线表明热解炭中存在大量孔径小于2nm 的微孔,等温线中很小的滞后环表明热解炭中的微孔对氮气的吸附与脱附具有良好的可逆性,这些孔结构特征反映出热解炭中的微孔分布在无定形的乱碳结构残片之间并具有良好的连通性.然而当热解炭与金属钠在900°C 加热24h 所得石墨化热解炭样品的氮气吸附-脱附等温线出现一个较大的滞后环(如等温线2所示),插图中的孔分布曲线显示样品中的孔径尺寸主要集中在4-5nm 之间,属于介孔尺寸,表明热解炭在石墨化前后孔结构发生由微孔向介孔发生转变.导致孔结构转化的原因是由于热解炭中图3无定形碳在金属钠中的相变过程示意图Fig.3Sketch map of the phase transformation of amorphous carbons in molten sodium metalThe conditions of (1)-(4)are the same as those inFig.1.图4热解炭与金属钠在700(a)和900°C (b)加热24h 所得样品的TEM 照片Fig.4TEM image of pyrocarbons annealed in molten sodium metal at 700°C (a)and 900°C (b)for 24hArea A denotes amorphous carbons,aera T denotes turbostraticcarbons,and area G denotes graphitic carbons.图5样品的氮气吸附-脱附等温线Fig.5Nitrogen adsorption desorption isotherms ofselected samplesIsotherm 1represents the sample of pyrocarbon and isotherm 2represents the sample of graphitized pyrocarbon.Inset is pore sizedistributioncurve.265Vol.27 Acta Phys.⁃Chim.Sin.2011的乱碳结构残片在金属钠原子的作用下定向重排,使得原先分布在其中的相互连通的微孔发生合并增大,形成了分布在石墨化碳层间的插层状孔,由于此时毛细管作用力的增强,导致样品对氮气的脱附滞后.另外,从图中可见,热解炭发生石墨化后,随着乱碳结构残片的定向重排使得石墨化热解炭样品的比表面积有所下降.酚醛树脂热解炭在金属钠作用下,其孔结构特征的改变是碳组成发生相变的结果,同时也进一步证实了金属钠原子在乱碳结构残片间的渗透与扩散有利于其发生定向重排,从而导致热解炭能够在较低的温度条件下实现石墨化.催化石墨化是通过在碳基质中引入催化剂,以降低石墨化温度,但是,目前的方法对于一些新型碳材料的石墨化显现出一定的缺陷.首先,在材料的制备阶段必须将催化剂加到碳材料的基质中,这势必增加了材料制备的难度,甚至对材质特性产生不良影响.例如,对碳气凝胶材料的石墨化,如果采用现有的催化石墨化方法,就需要在碳气凝胶制备所必经的溶胶-凝胶过程中加入催化剂,它可能改变胶体离子的微环境,继而影响了碳气凝胶的结构特性.其次,目前所采用的催化剂多数是过渡金属的氧化物,在碳材料石墨化以后,很难将催化剂从碳材料的基质中去除干净,这可能对转型后碳材料的电学特性或电化学催化特性等产生影响.再者,现有催化石墨化方法[4-6]对于碳气凝胶的石墨化效果仍不理想.酚醛树脂热解炭在金属钠作用下发生相变进行石墨化,该方法不仅具有操作简单的特点,而且可以避免在碳基质中加入催化剂给材质纯度、特性带来的不利影响并且可以降低材料的制备难度.另外,该方法有利于一些新型多孔性碳材料的石墨化,因为多孔性结构十分有利于金属钠在碳基质中的渗透与扩散.而实现这类材料的低温石墨化,可以使无定形碳材料的多孔特性与石墨晶体材料的材质特性相结合,有助于扩展碳材料在传感器、探测器、航天以及新能源电池等领域的应用范围.我们以自制的碳气凝胶通过文中方法进行石墨化研究,初步结果表明在800°C实现了碳气凝胶的石墨化,相关研究工作正在进行中.3结论由酚醛树脂经过裂解碳化后得到的热解炭,通过与金属钠一起在氩气保护下,在800°C加热24h 可以观察到明显的石墨化现象.金属钠在无定形碳中的渗透与扩散引起乱碳结构残片的定向重排,湍流碳的形成是金属钠在其中的渗透与扩散不均匀所致,是无定形碳向石墨化碳转化的中间相态,通过升高加热温度,可以改善金属钠在其中的扩散,从而提高了石墨化程度.热解炭在金属钠作用下发生石墨化使得样品中的孔结构由微孔转化为介孔,在900°C时石墨化度达到40%,样品中石墨化碳层的平均厚度达到40nm.致谢:本文实验研究过程中的部分分析测试工作得到同济大学化学系实验中心的支持.References1Skowroński,J.M.;Knofczyński,K.;Inagaki,M.Solid State Ionics,2007,178:1372Oya,A.;Otani,S.Carbon,1979,17:1313Curtis,B.J.Carbon,1966,4:4834Tanaike,O.;Inagaki,M.Carbon,1997,35:8315Rojas-Cervantes,M.L.;Alonso,L.;Díaz-Terán,J.;López-Peinado,A.J.;Martín-Aranda,R.M.;Gómez-Serrano,V.Carbon,2004,42:15756Oya,A.;Mochizuki,M.;Otani,S.;Tomizuka,I.Carbon,1979, 17:717Zhang,F.Q.;Huang,Q.Z.;Zou,L.H.;Huang,B.Y.;Xiong,X.;Zhang,C.F.Journal of Inorganic Materials,2004,19(5):1118[张福勤,黄启忠,邹林华,黄伯云,熊翔,张传福.无机材料学报,2004,19(5):1118]8Wang,Y.G.;Lin,X.C.;Yang,H.J.;Zhang,J.S.;Xu,D.P.Journal of Materials Science&Engineering,2008,26(3):365[王永刚,林雄超,杨慧君,张江松,许德平.材料科学与工程学报,2008,26(3):365]9Zhou,D.F.;Xie,H.M.;Zhao,Y.L.;Wang,R.S.Journal of Functional Material,2005,36(1):83[周德凤,谢海明,赵艳玲,王荣顺.功能材料,2005,36(1):83]10Yi,S.J.;Chen,J.H.;Xiao,X.;Liu,L.;Fan,Z.J.Rare Earths, 2010,28(1):6911Yi,S.J.;Chen,J.H.;Li,H.Y.;Liu,L.;Xiao,X.;Zhang,X.H.Carbon,2010,48:91212Xu,S.H.;Zhang,F.Y.;Kang,Q.;Liu,S.H.;Cai,Q.Y.Carbon, 2009,47:323313Ni,Z.C.;Li,Q.T.;Yan,L.;Gong,I.L.;Zhu,D.Z.Carbon,2008, 46:36514Zou,L.H.;Huang,Q.Z.;Zou,Z.Q.Carbon(China),1998,93(1): 8[邹林华,黄启忠,邹志强.炭素,1998,93(1):8]266。
a r X i v :a s t r o -p h /9902313v 1 22 F eb 1999THE NATURE OF THE LUMINOUS X-RAY EMISSION OF NGC 6240STEFANIE KOMOSSA Max-Planck-Institut f¨u r extraterrestrische Physik,Postfach 1603,D-85740Garching,Germany;skomossa@xray.mpe.mpg.de AND HARTMUT SCHULZ Astronomisches Institut der Ruhr-Universit¨a t,D-44780Bochum,Germany 1.Abstract We briefly review and extend our discussion of the ROSAT detection of the extraordinarily luminous (>1042erg/s)partly extended (>30kpc diam-eter)X-ray emission from the ultraluminous infrared galaxy NGC 6240.The ‘standard’-model of starburst outflow is contrasted with alternatives and a comparison with the X-ray properties of ellipticals is performed.2.Introduction The double-nucleus galaxy NGC 6240is outstanding in several respects:its infrared H 22.121µm and [FeII]1.644µm line luminosities and the ratio of H 2to bolometric luminosities are the largest currently known (van derWerf et al.1993).Its huge far-infrared luminosity of ∼1012L ⊙(Wright et al.1984)comprises nearly all of its bolometric luminosity.Hence,owing to its low redshift of z =0.024,NGC 6240is one of the nearest members of the class of ultraluminous infrared galaxies (hereafter ULIRGs).1Its optical morphology (e.g.,Zwicky et al.1961,Fried &Schulz 1983)and its large stellar velocity dispersion of 360km/s (among the highest values ever found in the center of a galaxy:e.g.,Doyon et al.1994)suggest that it is a1We continue to refer to NGC 6240as ULIRG but note that,owing to the method to integrate over the IRAS bands and the adopted value of H 0,most authors now attribute an IR luminosity <1012L ⊙to NGC 6240rendering it a LIRG instead of a ULIRG2STEFANIE KOMOSSA AND HARTMUT SCHULZmerging system on its way to become an elliptical.Like other ULIRGs,the object contains a compact,luminous CO(1-0)emitting core of molecular gas(Solomon et al.1997).Within this core most of the ultimate power source of the FIR radiation appears to be hidden.There is now growing evidence that LIRGs are predominantly powered by star-formation and that the AGN contribution increases with FIR lu-minosity(e.g.,Shier et al.1996,Lutz et al.1998a,Rigopolou et al.1998; see Sanders&Mirabel1996and Genzel et al.1998for recent reviews) while essentially all of the HyLIRGs contain QSOs(e.g.,Hines et al.1995 and these proceedings).In the‘transition region’around L FIR≃1012L⊙it then requires a careful object-by-object analysis tofind out the majour power source.Concerning NGC6240,at least four scenarios have been sug-gested:Heating of dust by a superluminous starburst,by an AGN,by an old stellar population,and by UV radiation from molecular cloud colli-sions.In particular,previous hints for an AGN included(i)the strength of NIR recombination lines(de Poy et al.1986,depending on the applied reddening correction,though),(ii)the presence of compact bright radio cores(Carral et al.1990but see Colbert et al.1994),(iii)the discovery of a high-excitation core in the southern nucleus with HST(Barbieri et al.1994, 1995,Rafanelli et al.1997),and the detection of the[OIV]25.9µm emission line with ISO(Lutz et al.1996–but see Lutz et al.1998b who discovered this line in a number of starburst galaxies;Egami,this meeting).X-rays are a powerful tool to investigate both,the presence of an AGN and starburst-superwind activity.It is the aim of the present contribution to review briefly and discuss ourfindings of evidence for a hard X-ray component in the ROSAT PSPC spectrum of NGC6240(Schulz et al.1998, SKBB hereafter)and the detection of luminous extended emission based on ROSAT HRI data(Komossa et al.1998)in combination with the discovery of an FeK line and hard X-ray component by ASCA(first reported by Mitsuda1995).Luminosities given below were calculated using H0=50km/s/Mpc. 3.Scenarios to explain the luminous X-ray emission of NGC6240 3.1.SPECTRAL PROPERTIES AND ORIGIN OF THE HARD COMPONENTIn our analysis of ROSAT PSPC data of NGC6240we tested a large vari-ety of models to explain the X-ray spectrum(SKBB).One-componentfits turned out to be unlikely.E.g.,a single Raymond-Smith model requires a huge absorbing column along the line-of-sight,the consequence being an intrinsic(absorption corrected)luminosity of L X,0.1−2.4≃41043erg/s, almost impossible to reach in any starburst-superwind scenario.The oneNATURE OF THE LUMINOUS X-RAY EMISSION OF NGC 62403-173.38170.686171.36-172.706Figure 1.ROSAT HRI X-ray contours showing the presence of luminous extended emission overlaid on an optical image of NGC 6240.The lowest contour is at ∼2σabove the background.model that does not require excess absorption is a single black body.Al-though physically implausible,this description does allow to derive a lower limit on the intrinsically emitted X-ray luminosity which any model has to explain:L X ∼>2.51042erg/s in the (0.1-2.4)keV band (Fricke &Pa-paderos 1996obtained 3.81042erg/s by fitting a thermal bremsstrahlung model and allowing for some excess absorption).Successful two-component models require the presence of a hard X-ray component,in form of either very hot thermal emission (kT ≃7keV)or a powerlaw.2Due to its large luminosity of several 1042erg/s we interpret the hard component to arise from an AGN.Both,the essential lack of non-X-ray evidence for an unobscured AGN,and the high equivalent width of the FeK2The requirement of a second component in the ROSAT band can be omitted if strongly depleted metal abundances are allowed for.This has been reported for other objects as well and the low inferred X-ray abundances are quite puzzling given that other methods yield much higher abundances (as also stressed by Netzer at this meeting).A recent discussion of this issue is given in Komossa &Schulz (1998)and Buote &Fabian (1998)who give arguments in favour of two-component X-ray spectral models of ∼solar abundances in the Raymond-Smith component instead of single-component models of very subsolar abundances.In particular,Buote &Fabian conclude that the necessity of a second X-ray component cannot be circumvented by details of the modelling of the Fe L emission.4STEFANIE KOMOSSA AND HARTMUT SCHULZof NGC6240diagram,comparedof elliptical galax-Canizares et al.1987,&Bregman1998);ellipticals areenviron-circle gives the(0.1-2.4keV)of NGC6240,theone for the favouredmodel(Sect. 3.1;row of their Tab.triangle correspondsL x from HeckmanB was calculated us-in NED.line observed by ASCA(e.g.,Mitsuda et al.1995)suggest we see the AGN mainly in scattered light.Indeed,the X-ray spectrum can be successfully described by a‘warm scatterer’(cf.Fig.4of Komossa et al.1998),highly ionized material seen in reflection which could also explain the strong FeK line seen by ASCA.Our model,which was suggested to explain the hard component,is quite similar to the one suggested by Netzer et al.(1998) who,however,explained the whole ASCA spectrum in terms of scattering. In this respect,we emphasize that the widely extended X-ray component detected with the ROSAT HRI(Komossa et al.1998;cf.next Sect.)is likely of different origin,given the low efficiency of a hugely extended scattering mirror(SKBB).With an X-ray luminosity in scattered emission of a few1042erg/s one obtains an intrinsic luminosity of order1044−45erg/s,depending on the covering factor of the scatterer.Variousfits of ASCA spectra(e.g.,Mit-suda1995,Kii et al.1997,Iwasawa1998,Netzer et al.1998,Nakagawa, these proceedings)revealing the extension of the hard component up to10 keV support this conclusion;the various approaches differ in the descrip-tion of the soft component(s)and the amount of absorption of the hard component,though.In any case,the AGN contributes an appreciable frac-tion of the total L bol(NGC6240)=41045erg/s.If L bol(AGN)≃L Edd a black hole mass of M bh≃107M⊙results.NGC6240is expected to form an L∗elliptical galaxy rather than a giant elliptical after having completed its merging epoch(Shier&Fischer1997).However,to match the relation M bh≈0.002M gal(Lauer et al.1997)for the evolved elliptical the black hole has still to grow by an order of magnitude which would require anotherNATURE OF THE LUMINOUS X-RAY EMISSION OF NGC62405 109yrs of accretion while the merger is settling down.Alternatively,the present accretion rate could be below the Eddington rate.The inferred X-ray luminosity is an appreciable fraction of the FIR luminosity,suggesting that both,the starburst(e.g.,Lutz et al.1996)and the AGN power the FIR emission of this ULIRG.3.2.EXTENDED EMISSIONThe HRI images(Komossa et al.1998)reveal that part of the huge X-ray luminosity arises in a roughly spherical source with strong(≥2σabove background)emission out to a radius of20′′(∼14kpc;Fig.1).Hence, NGC6240is the host of one of the most luminous extended X-ray sources in isolated galaxies(see Fig.2where L X is compared with a sample of elliptical galaxies and Arp220).Analytical estimates based on the Mac Low &McCray(1988)models show that the extended emission can be explained by superwind-shell interaction from the central starburst(SKBB).A puzzle is the high circular symmetry of the X-ray bubble,in contrast to the bicone-symmetry expected in a wind-driven supershell scenario so that it seems worthwhile to look for further potential contributors to the X-ray emission.An additional small contribution may come from a wind induced by the large velocity dispersion of350km/s(Lester&Gaffney1994)leading to shocks in the gas expelled by the red giant population.Another inter-esting point is that the extended X-ray bubbles around elliptical galaxies are usually brighter in the inflow phases or‘when caught in the verge of experiencing their central cooling catastrophe’(Ciotti et al.1991,Friaca &Terlevich1998).Although time scales and details for an ongoing merger are certainly different,it is conceivable that NGC6240experiences a lack of heating when a majour starburst period has ended.In this case,a cooling flow would commence boosting L x and presumably shock heating the ISM in the central kiloparsecs.Due to fragmentation,shock velocities could be enhanced causing the LINER like line ratios in the two nuclei(gravitational centers)and,with lower velocities,excite the molecular cloud complex be-tween the nuclei leading to the extreme H2luminosity found there(van der Werf et al.1993).Its exceptional X-ray properties make NGC6240a prime target for fu-ture X-ray satellites like XMM and AXAF.AcknowledgementsSt.K.acknowledges support from the Verbundforschung under grant No. 50OR93065and thanks the organizers for the very efficient workshop and the pleasant workshop atmosphere.6STEFANIE KOMOSSA AND HARTMUT SCHULZ ReferencesBarbieri C.,Rafanelli P.,Schulz H.,Komossa S.,1994,Astron.Ges.Abstr.Ser.10,217 Barbieri C.,Rafanelli P.,Schulz H.,Komossa S.,Baruffolo A.,1995,in17th Texas Symp.on Relativistic Astrophysics and Cosmology,MPE Report261,W.Voges et al.(eds) Brown B.A.,Bregman J.N.,1998,ApJ495,L75Buote D.A.,Fabian A.C.,1998,MNRAS296,977Carral P.,Turner J.L.,Ho P.T.P.,1990,ApJ362,434Canizares C.R.,Fabbiano G.,Trinchieri G.,1987,ApJ312,503Ciotti L.,D’Ercole A.,Pellegrini S.,Renzini A.,1991,ApJ376,380Colbert E.J.M.,Wilson A.S.,Bland-Hawthorne J.,1994,ApJ436,89de Poy D.L.,Becklin E.E.,Wynn-Williams C.G.,1986,ApJ307,116Doyon R.,Wells M.,Wright G.S.et al.,1994,ApJ437,23Friaca A.C.S.,Terlevich R.J.,1998,MNRAS298,399Fricke K.J.,Papaderos P.,1996,in MPE Report263,377Fried J.,Schulz H.,1983,A&A118,166Genzel R.,Lutz D.,Tacconi L.,1998,Nat394,859Heckman T.M.,Dahlem M.,Eales S.A.et al.,1996,ApJ457,616Hines D.C.,Schmidt G.D.,Smith P.S.et al.,1995,ApJ450,L1Iwasawa K.,1998,astro-ph/9808313,to appear in MNRASKii T.,Nakagawa T.,Fujimoto R.et al.,1997,in X-ray Im.and Spectr.of Cosm.Hot Plasmas,F.Makino&K.Mitsuda(eds),Universal Academy Press:Tokyo,161 Komossa S.,Schulz H.,Greiner J.,1998,A&A334,110Komossa S.,Schulz H.,1998,A&A339,345Lauer T.R.,Faber S.M.,Tremaine S.et al.,1997,ASP Conf.Ser.116,113Lester D.F.,Gaffney N.I.,1994,ApJ431,L13Lutz D.,Genzel R.,Sternberg A.et al.,1996,A&A315,L137Lutz D.,Spoon H.W.W.,Rigopoulou D.,Moorwood A.F.M.,Genzel R.,1998a,ApJ505, L103Lutz D.,Kunze D.,Spoon H.W.W.,Thornley M.D.,1998b,A&A333,L75Mac Low M-M.,McCray R.,1988,ApJ324,776Mitsuda K.,1995,in17th Texas Symp.on Relativistic Astrophysics and Cosmology,H.B¨o hringer,G.E.Morfill,J.E.Tr¨u mper(eds),Ann.N.Y.Acad.Sc.759,213Netzer H.,Turner T.J.,George I.M.,astro-ph/9803205,to appear in ApJRafanelli P.,Schulz H.,Barbieri C.et al.,1997,A&A327,901Rigopoulou D.,Genzel R.,Lutz D.et al.1998,Astron.Ges.Abstr.Ser.14,45Sanders D.B.,Mirabel I.F.,1996,ARA&A34,749Schulz H.,Komossa S.,Bergh¨o fer T.,Boer B.,1998,A&A330,823(SKBB)Shier L.M.,Rieke M.J.,Rieke G.H.,1996,ApJ470,222Shier L.M.,Fisher J.,1997,ASP Conf.Ser.116,502Solomon P.M.,Downes D.,Radford S.J.E.,Barrett J.W.,1997,ApJ478,144van der Werf P.P.,Genzel R.,Krabbe A.et al.,1993,ApJ405,522Wright G.S.,Joseph R.D.,Meikle W.P.S.,1984,Nat309,430Zwicky F.,Herzog E.,Wild P.,1961,Catalogue of Galaxies and Clusters of Galaxies, Pasadena:Caltech,Vol.I,89To appear in the proc.of the Ringberg workshop on‘Ultraluminous Galax-ies:Monsters or Babies’(Ringberg castle,Sept.1998);Ap&SS,in press。
VERY HIGH ENERGY GAMMA RAYS FROM THE VELAPULSAR DIRECTIONT.Yoshikoshi1,2,T.Kifune2,S.A.Dazeley3,P.G.Edwards3,4,T.Hara5,Y.Hayami1, F.Kakimoto1,T.Konishi6,A.Masaike7,Y.Matsubara8,T.Matsuoka8,Y.Mizumoto9, M.Mori10,H.Muraishi11,Y.Muraki8,T.Naito12,K.Nishijima13,S.Oda6,S.Ogio1, T.Ohsaki1,J.R.Patterson3,M.D.Roberts2,G.P.Rowell3,T.Sako8,K.Sakurazawa1, R.Susukita7,14,A.Suzuki6,T.Tamura15,T.Tanimori1,G.J.Thornton2,3,S.Yanagita11and T.Yoshida11Received;accepted1Department of Physics,Tokyo Institute of Technology,Meguro-ku,Tokyo152,Japan 2Institute for Cosmic Ray Research,University of Tokyo,Tanashi,Tokyo188,Japan 3Department of Physics and Mathematical Physics,University of Adelaide,Adelaide, South Australia5005,Australia4Institute of Space and Astronautical Science,Sagamihara,Kanagawa229,Japan5Faculty of Management Information,Yamanashi Gakuin University,Kofu,Yamanashi 400,Japan6Department of Physics,Kobe University,Kobe,Hyogo637,Japan7Department of Physics,Kyoto University,Kyoto,Kyoto606,Japan8Solar-Terrestrial Environment Laboratory,Nagoya University,Nagoya,Aichi464,Japan 9National Astronomical Observatory of Japan,Mitaka,Tokyo181,Japan10Department of Physics,Miyagi University of Education,Sendai,Miyagi980,Japan11Faculty of Science,Ibaraki University,Mito,Ibaraki310,Japan12Department of Earth and Planetary Physics,University of Tokyo,Bunkyo-ku,Tokyo 113,Japan13Department of Physics,Tokai University,Hiratsuka,Kanagawa259,Japan14Institute of Physical and Chemical Research,Wako,Saitama351-01,Japan15Faculty of Engineering,Kanagawa University,Yokohama,Kanagawa221,JapanABSTRACTWe have observed the Vela pulsar region at TeV energies using the3.8m imagingˇCerenkov telescope near Woomera,South Australia between January1993and March1995.Evidence of an unpulsed gamma-ray signal has been detected at the5.8σlevel.The detected gamma-rayflux is(2.9±0.5±0.4)×10−12photons cm−2sec−1above2.5±1.0TeV and the signal is consistent with steady emission over the two years.The gamma-ray emission region is offset from the Vela pulsar position to the southeast by about0.◦13. No pulsed emission modulated with the pulsar period has been detected and the95%confidenceflux upper limit to the pulsed emission from the pulsar is (3.7±0.7)×10−13photons cm−2sec−1above2.5±1.0TeV.Subject headings:gamma rays:observations—ISM:individual(Vela SNR)—ISM:magneticfields—pulsars:individual(Vela pulsar)—supernova remnants1.IntroductionIt is highly likely that high energy particles are accelerated by non-thermal processes in the vicinity of pulsars,and extensive searches have been made for very high energy(VHE; typically at the TeV energy)gamma rays from this class of objects(Kifune1996;references therein).Positive evidence has been obtained for the Crab(e.g.Weekes et al.1989;Vacanti et al.1991;Tanimori et al.1994)and PSR B1706−44(Kifune et al.1995)using the technique of imagingˇCerenkov light from extensive air showers which VHE gamma rays initiate in the upper atmosphere.The Vela pulsar,PSR B0833−45,is one of the100MeV gamma-ray pulsars detected by EGRET of the Compton Gamma Ray Observatory,together with the Crab and PSR B1706−44(e.g.Ramanamurthy et al.1995).There have been some claims for VHE gamma-ray emission from the Vela pulsar so far (Grindlay et al.1975;Bhat et al.1987).However,no positive evidence has been found in later observations(Bowden et al.1993;Nel et al.1993;Edwards et al.1994).In these observations,period analyses were used to reduce cosmic-ray background counts and to search for pulsed gamma-ray emission.On the contrary,VHE emission from the Crab and PSR B1706−44is apparently unpulsed.Therefore,it is important to look for the unpulsed VHE gamma-ray signal also from the Vela pulsar.For the Crab pulsar,intense X-ray emission is observed as an X-ray synchrotron nebula of which the inverse Compton counterpart is the source of VHE gamma rays.The energy injection,which is close to the spindown luminosity of the Crab pulsar(PSR B0531+21),is through aflow of relativistic electrons and positrons,i.e.a“pulsar wind”(Kennel&Coroniti1984).The shock generated when the pulsar wind collides with circumstellar matter is likely to be the site of particle acceleration.It is likely that a similar process takes place at the Vela pulsar.The Vela pulsar is relatively close to us,at a distance of about500pc,and we can expect to resolve the structure of the pulsar wind and nebula better than in the case of theCrab(at a distance of∼2kpc).In the X-ray energy band,a compact nebula was detected by the Einstein satellite with fainter extended emission(Harnden et al.1985),which was later identified as an X-ray jet by the ROSAT satellite extending from the pulsar to the south-southwest direction and which Markwardt&¨Ogelman(1995)argued may be evidence of a pulsar wind from the Vela pulsar.The“head”of the Vela jet has been observed also by the ASCA satellite and the authors explored the possibility that the jet emission is non-thermal(synchrotron)radiation rather than thermal(Markwardt&¨Ogelman1997). If the X-ray emission is of non-thermal origin,the detection of Compton-boosted VHE gamma rays would provide direct and clear evidence of non-thermal electrons.2.Instruments and ObservationsThe3.8m telescope of the CANGAROO collaboration(Hara et al.1993)detectsˇCerenkov photons from extensive air showers generated by primary gamma rays or cosmic rays,and has an imaging camera of256Hamamatsu R2248square photomultiplier tubes. One photomultiplier tube views an angular extent of0.◦12×0.◦12,and the totalfield of view of the camera is about3◦across.The tracking accuracy of the telescope has been checked by monitoring the tracks of bright stars in thefield of view.Monte Carlo simulations show the accuracy of calibrating the target position using star tracks to be better than0.◦02(Yoshikoshi1996).At least four bright stars of visual magnitude5∼6are in the3◦field of view around the Vela pulsar and the telescope pointing has been checked night by night.The Vela pulsar has been observed by the3.8m telescope from January1993to March 1995.The on-source data amount to about174hours in total with a cosmic-ray event rate of about1Hz.Almost the same amount of off-source data has been taken,in pairedon-source and off-source runs each night.About119hours usable on-source data remain after rejecting the data affected by clouds.Only the data taken without cloud are used in the following analyses.3.Analyses and ResultsTheˇCerenkov imaging analysis is based on parameterization of the shape,location and orientation of approximately ellipticalˇCerenkov images detected by an imaging camera.The commonly used parameters are“width”,“length”,“conc”(shape),“distance”(location)and“alpha”(orientation)(Hillas1985;Weekes et al.1989;Reynolds et al.1993) and the gamma-ray selection criteria in the present analysis are0.◦01<width<0.◦09, 0.◦1<length<0.◦4,0.3<conc,0.◦7<distance<1.◦2and alpha<10◦.Monte Carlo simulations show that more than99%of background events are rejected after the above selections are made,while∼50%of gamma-ray images from a point source remain.First,we searched for a gamma-ray signal from the pulsar position and found a significant excess of on-source events above the background(off-source)level.However,the peak profile of the excess distribution against the orientation angle“alpha”was broader than expected from a point source.Next,the assumed position of gamma-ray emission was shifted from the pulsar position,to scan a2◦×2◦area around the pulsar within thefield of view.The position of the maximum excess counts was searched for and found to be offset from the pulsar by about0.◦13.Figure1shows the alpha distributions for the position of the maximum excess counts after the other selection criteria have been applied.EDITOR:PLACE FIGURE1HERE.The statistical significance of the excess after including the selection of alpha is at the5.2σlevel,where the statistical significance is calculated by(N on−N off)/√N on+N off,and N onand N offare the numbers of gamma-ray-like events in the on-source and off-source data, respectively.In the usual image analysis,the image parameters are calculated from the mean and second moments of light yield,i.e.assuming gamma-ray images to have a simple elliptical shape.Gamma-ray images,however,are asymmetrical along their major axes,havingan elongated,comet-like shape with the“tail”pointing away from the source position. This feature can be characterized and quantified by another image parameter called the “asymmetry”,which is the cube root of the third moment of the image along the major axis normalized by“length”(Punch1993).Figure2(a)shows the asymmetry distributions for gamma-ray images for a point source and background(proton)images,inferred from Monte Carlo simulations.EDITOR:PLACE FIGURE2HERE.About80%of gamma-ray images have positive values of“asymmetry”in the simulation, while the distribution of background images is almost symmetrical because of their isotropic arrival directions.The asymmetry analysis has been applied assuming the source lies at the position of the maximum excess counts,to examine the gamma-ray-like feature of the excess events.The on-source distribution appears nearly symmetrical as shown in Figure2(b). However,after subtracting the off-source distribution,the distribution of the excess events in Figure2(c)is asymmetrical with the peak on the positive side as expected from the simulation.This result gives clear corroborative evidence that the detected excess events of Figure1are truly due to gamma rays.The significance of5.2σfor the excess counts in the alpha distribution of Figure1increases to5.8σby adding asymmetry>0to the gamma-ray selection criteria.As an alternative method to calculating the alpha parameter,it is possible to infer andassign the true direction of a gamma ray from the location and orientation of its observed ˇCerenkov image.We have calculated a probability density for the true direction for each observed gamma-ray image using Monte Carlo simulations(Yoshikoshi1996).Thus,a density map of gamma-ray directions can be obtained by adding up all of the probability densities of the gamma-ray-like images.The contribution of the gamma-ray source in the field of view can then be found as an event excess in the on-source map over the background (off-source)map.Figure3shows the density map of the excess events for the Vela pulsar data plotted as a function of right ascension and declination.EDITOR:PLACE FIGURE3HERE.The significant excess due to a gamma-ray source near the pulsar exists in this map.The position of maximum emission is offset from the pulsar,which is indicated by the“star”mark in the map,to a position southeast by about0.◦13.The alpha distribution of Figure1 is plotted for the position of maximum emission.The gamma-ray integralflux calculated for the position of the maximum excess counts is(2.9±0.5±0.4)×10−12photons cm−2sec−1above2.5TeV,where thefirst and second errors are statistical and systematic respectively.Theflux from the pulsar position is1.4×10−12photons cm−2sec−1above2.5TeV.However,the excess counts which are calculated for the positions of the maximum excess counts and the pulsar are not independent of each other and all of theflux measured from the pulsar position is possibly contamination by the events from the position of the maximum excess counts. The threshold energy is defined as the energy of the maximum differentialflux of detected gamma-ray-like events and has been estimated from Monte Carlo simulations to be2.5TeV, assuming a power law spectrum with a photon index of−2.5.The systematic error for this threshold energy is about±1.0TeV,which is due to uncertainties in the photon index, the trigger conditions and the reflectivity of the mirror.The data have been divided tocalculate year-by-yearfluxes and thefluxes are consistent with no variation having been detected on the time scale of two years.The periodicity of the events detected from the Vela pulsar direction and the direction of the maximum excess counts has been investigated using our1994and1995data for which a global positioning system(GPS)was available.A derivative of the TEMPO programs(Taylor&Weisberg1989)has been used to transform the event arrival timesto solar system barycentric(SSB)arrival times.The solar system ephemeris used in the analysis comes from the Jet Propulsion Laboratory(JPL)and is based on epoch2000(DE 200)(Standish1982).We have applied the Z22test(Buccheri et al.1983)to the data set after the gamma-ray selection with the period of the Vela pulsar using ephemerides from the Princeton data base(Arzoumanian et al.1992),and the test has been done coherently for each year.No significant value of the Z22statistic has been found for either the excess direction nor the pulsar direction.The95%confidence upper limit to the pulsedflux has been calculated for the pulsar position as(3.7±0.7)×10−13photons cm−2sec−1above 2.5TeV from the values of Z22using the method of Protheroe(1987).4.DiscussionThe luminosity of VHE gamma rays from the position of the maximum excess counts near the Vela pulsar is calculated to be∼6.0×1032erg sec−1,assuming that the distance to the gamma-ray emission region is500pc,the photon index of the power law spectrum is−2.5,the maximum gamma-ray energy is10TeV and the emission is isotropic. The VHE luminosity corresponds to∼8.6×10⁻⁵of the pulsar’s spindown energy of 6.9×1036erg sec−1,and is smaller by an order of magnitude than the luminosity of pulsed emission in the range from100MeV to2GeV(Kanbach et al.1994).The luminosity of VHE gamma rays from the pulsar position is estimated to be∼2.9×1032erg sec−1,whichshould rather be interpreted as an upper limit because a majority of the excess events at the pulsar position are common with the events of the maximum excess position.The emission region of VHE gamma rays appears to differ by about0.◦13to the southeast from the Vela pulsar position.We have investigated whether the effect of statisticalfluctuations could cause a change in the observed source position,using Monte Carlo simulations.The position error derived for a point source of this strength is estimated to be about0.◦04,and so the observed offset of the detected peak position from the pulsar corresponds to a significance of more than3σ.In this estimation,we ignored the effect due to the source extent and,in fact,the peak profile which appears in Figure3seems to be rather more extended than the point spread function(HWHM∼0.◦18).We note also that separate maps of each year’s data show consistent offsets.The3.8m mirror has recently been recoated and the Vela pulsar region has been observed with a better reflectivity (∼90%)again in1997further to confirm the offset.We have found a gamma-ray-like event excess from the1997data with a significance of more than4σand the position of maximum excess counts,indicated by the“cross”in Figure3,agrees with that from the 1993to1995data within the statistical error.The southeast offset of0.◦13corresponds to about1pc for the distance of500pc,much larger than the size of the light cylinder,and thus,we can exclude the possibility that the detected signal is from the pulsar magnetosphere or from the X-ray jet.This conclusion is consistent with there being no pulsation detected at the pulsar period.Unpulsed VHE emission at a distance of∼1pc from the pulsar may suggest that the mechanism for generating relativistic particles and inverse Compton gamma rays in the Vela pulsar and nebula is similar to the case of the Crab pulsar and nebula.A shock due to the confinement of the pulsar wind by the nebula may exist or have formed at the position southeast of the Vela pulsar by about0.◦13.This position of the VHE emission agrees with the birthplaceof the Vela pulsar(¨Ogelman et al.1989;Bailes et al.1989).Accelerated electrons could survive longer than the pulsar age if the magneticfield is not strong,and the VHE emission may be due to such long-lived electrons as pointed out by Harding&de Jager(1997). Recent X-ray observations show that a number of young pulsars are accompanied by possible synchrotron nebulae(Kawai&Tamura1996),which are offset from the pulsars. The existence of relativistic electrons in a region displaced from the pulsar may be rather a common feature observed in pulsar/nebula systems.VHE gamma rays could well be produced by electrons in such displaced regions as we observe in the case of the Vela pulsar and nebula.In the ROSAT X-ray image(Markwardt&¨Ogelman1995),a“bright spot”can be found where we have detected the VHE gamma-ray signal.Assuming that the X-rays originate in synchrotron emission from the same electrons that,through inverse Compton scattering,produce the VHE gamma rays,we can estimate the magneticfield fromthe relation L syn/L iC=U B/U ph of inverse Compton luminosity L iC and synchrotron luminosity L syn,where U B=B2/8πand U ph are the energy densities of the magneticfield and the photonfield,respectively.The X-ray luminosity from the bright spotat the pulsar birthplace is estimated from the ROSAT image to be smaller than that from the1 X-ray nebula around the pulsar,1.3×1033erg sec−1per decade of energy (¨Ogelman et al.1993),while the VHE gamma-ray luminosity is∼1.0×1033erg sec−1per decade.An upper limit for the magneticfield at the bright spot is then estimated to be B∼<4×10⁻⁶(U ph/0.24eV cm−3)1/2G,where0.24eV cm−3is the energy density of the microwave background photons.As for the compact X-ray nebula,a lower limit for the magneticfield can be estimated from the upper limit for the VHE gamma-ray luminosity from the pulsar position,i.e.B∼>5×10⁻⁶(U ph/0.24eV cm−3)1/2G.This limit is compatible with an estimate obtained by de Jager et al.(1996)from a confinement condition for the progenitor electrons.A plausible scenario is thus that the VHE gamma-ray emission occursfrom the X-ray bright spot offset0.◦13from the pulsar to the southeast where there issufficient density of relativistic electrons,but a smaller magneticfield.This work is supported by International Scientific Research Program of a Grant-in-Aid in Scientific Research of the Ministry of Education,Science,Sports and Culture,Japan,and by the Australian Research Council.T.Kifune and T.Tanimori acknowledge the support of the Sumitomo Foundation.The receipt of JSPS Research Fellowships(P.G.E.,T.N., M.D.R.,K.S.,G.J.T.and T.Yoshikoshi)is also acknowledged.REFERENCESArzoumanian,Z.,Nice,D.&Taylor,J.H.1992,GRO/radio timing data base,Princeton UniversityBailes,M.,et al.1989,ApJ,343,L53Bhat,P.N.,et al.1987,A&A,178,242Bowden,C.C.G.,et al.1993,Proc.23rd Int.Cosmic Ray Conf.(Calgary),1,294 Buccheri,R.,et al.1983,A&A,128,245de Jager,O.C.,Harding,A.K.&Strickman,M.S.1996,ApJ,460,729Edwards,P.G.,et al.1994,A&A,291,468Grindlay,J.E.,et al.1975,ApJ,201,82Hara,T.,et al.1993,Nucl.Inst.Meth.Phys.Res.A,332,300Harding,A.K.&de Jager,O.C.1997,Proc.32nd Rencontres de Moriond,in press Harnden,F.R.,et al.1985,ApJ,299,828Hillas,A.M.1985,Proc.19th Int.Cosmic Ray Conf.(La Jolla),3,445Kanbach,G.,et al.1994,A&A,289,855Kawai,N.&Tamura,K.1996,Proc.IAU Colloquium160,“Pulsars:Problems and Progress”,ed.S.Johnston,M.A.Walker and M.Bailes,p.367Kennel,C.F.&Coroniti,F.V.1984,ApJ,283,694Kifune,T.,et al.1995,ApJ,438,L91Kifune,T.1996,Proc.IAU Colloquium160,“Pulsars:Problems and Progress”,ed.S.Johnston,M.A.Walker and M.Bailes,p.339Markwardt,C.B.&¨Ogelman,H.1995,Nature,375,40Markwardt,C.B.&¨Ogelman,H.1997,ApJ,480,L13Nel,H.I.,et al.1993,ApJ,418,836¨Ogelman,H.,Koch-Miramond,L.&Auri´e re,M.1989,ApJ,342,L83¨Ogelman,H.,Finley,J.P.&Zimmermann,H.U.1993,Nature,361,136 Protheroe,R.J.1987,Proc.Astron.Soc.Aust.,7(2),167Punch,M.1993,Ph.D.thesis,National University of Ireland Ramanamurthy,P.V.,et al.1995,ApJ,447,L109Reynolds,P.T.,et al.1993,ApJ,404,206Standish,E.M.1982,A&A,114,297Tanimori,T.,et al.1994,ApJ,429,L61Taylor,J.H.&Weisberg,J.M.1989,ApJ,345,434Vacanti,G.,et al.1991,ApJ,377,467Weekes,T.C.,et al.1989,ApJ,342,379Yoshikoshi,T.1996,Ph.D.thesis,Tokyo Institute of Technology This manuscript was prepared with the AAS L A T E X macros v4.0.Fig.1.—Distributions of the image orientation angle“alpha”with respect to the direction of the maximum excess counts,which is offset by about0.◦13to the southeast from the Vela pulsar and corresponds to the peak position in Figure3:(a)on-source(solid line)and off-source(dashed line)distributions;(b)distribution of the excess counts of the on-source above the background(off-source)level.For gamma-ray-like events,one expects this angle to be close to zero.Fig.2.—Distributions of the“asymmetry”parameter for simulated and observedˇCerenkov images:(a)distributions of gamma-ray images for a point source(solid line)and background (proton)images(dashed line)inferred from Monte Carlo simulations;(b)on-source(solid line)and off-source(dashed line)distributions of gamma-ray-like events for the direction of the maximum excess counts,which is the same as in Figure1;(c)distribution of the excess counts of the on-source above the background.This parameter measures the pointing of the images toward the source,as indicated by positive values.Fig. 3.—A density map of excess counts around the Vela pulsar plotted as a function of right ascension and declination;north is up and east is to the left.The gray scale at the right is in counts degree−2.The“star”at the origin of the map indicates the position of the Vela pulsar.We have observed the samefield of view also in1997with a reduced energy threshold,to confirm the offset of the source from the pulsar.The position of the maximum excess counts from the1997data is indicated by the“cross”in the map.Alpha (degrees)C o u n t s0200400600800100012001400160002004006008001000-2-1012Asymmetry C o u n t s(a)100200300400500600AsymmetryC o u n t s20406080100120140160AsymmetryE x c e s s C o u n t s-1-0.50.51-200020040060080010001200Right Ascension (degrees)D e c l i n a t i o n (d e g r e e s )。
a r X i v :a s t r o -p h /0103412v 1 26 M a r 2001THERMAL X-RAY EMISSION OF THE REMNANTS OF ASPHERICAL SUPERNOV A EXPLOSIONSO.Petruk 1c20001Institute for Applied Problems in Mechanics and Mathematics National Academy of Sciences of Ukraine 3-b Naukova St.,79053Lviv,Ukrainee-mail:petruk@astro.franko.lviv.uaINTRODUCTIONIn some models of supernova explosion the energy is realised anisotropically [1,5].Aspherical explosion of supernova (SN)may cause a barrel-like supernova remnant (SNR)[4].Observations show that SN may really be aspherical,as e.g.in well-known case of SN1987A [12,6,7,8].High birth velocities of pulsars aslo suggest anizotropy in SN explosion [10].In the past,the morphological evolution and instabilities of asymmetric SN explosion were investigated in [3,2,16].In present work we consider properties of thermal X-ray emission of adiabatic remnants of aspherical SN explosions.Hydrodynamics is modelled here with an approximate method for description of the adiabatic phase of a remnant of aspherical SN explosion in an arbitrary large-scale nonuniform medium [9].Equilibrium thermal X-ray emission model is taken from [14]and approximation for the Gaunt factor from [11].ASPHERICAL SN EXPLOSION IN A UNIFORM MEDIUMSpherical adiabatic SNR in uniform medium is described by self-similar Sedov solutions [15]where distributions of thermodynamic parameters are self-similar downstream:ρ(r,t )=ρs ·r ),P (r,t )=P s ·r ),T (r,t )=T s ·r ),where distance from the center ρ,pressure T are normalized on the values at the shock:R s ,ρs ,P s ,T s .Let us consider aspherical supernova explosionE (ϑ,φ)=E o ψ(ϑ,φ)where2π 0dφπψ(ϑ,φ)sinϑdϑ=4π.(1)As an example of aspherical energy distribution we will consider the function:ψ(ϑ,φ)=1−b·∂ln−·Luminosity of a remnant of aspherical SN explosion E(ϑ,φ)=E oψ(ϑ,φ)in uniform medium isL x=C(γ,µ)·E51n H˜T−1s·I(˜T s)erg/s,(10)where integralI(˜T s)=2πdφπψ(ϑ,φ)3/5sinϑdϑ1Λ(˜T sψ(ϑ,φ)2/5n2(r)r2dr.(11)Thermal X-ray spectral index of such SNR isα=−∂T(r))√X-ray properties of an SNR essentially depend on features of a disturbed plasmaflow behind the shock because emission depends on density squared and temperature on velocity squared.Therefore,surface dis-tributions of X-ray emission charateristics are a sensitive test on the conditions in which the object evolves. Asphrericity of explosion reveals itself in surface distributions of thermal X-ray characteristics.In the case of an axially-symmetrical explosion in uniform medium and when the axis of symmetry lies in the plan of projec-tion,the profiles of X-ray surface brightness and spectral index along the lines perpendicular to the axis are re-normalized profiles of relevant distributions of the Sedov SNR.References[1]Bisnovatyi-Kogan,G.,About the mechanism of explosion of rotating star as supernova//Astron.Zhurn.–1970.–47.–P.813.[2]Bisnovatyi-Kogan,G.Spherization of the remnants of asymmetrical SN explosion in a uniform medium//Super-nova Remnants and Their X-Ray Emission(ed.J.Danzinger&P.Gorenstein).–Dortrecht:Reidel,1983.–P.125. [3]Bisnovatyi-Kogan,G.,Blinnikov S.Spherization of the remnants of asymmetrical SN explosion in a uniformmedium//Astron.Zhurn.–1982.–59.–P.876.[4]Bisnovatyi-Kogan,G.,Lozinskaja,T.,Silich,S.Axially-symmetrical supernova remnant//Astrophys.SpaceSci.–1990.–166.–P.277.[5]Bodenheimer,P.,Woosly,S.A two-dimensional supernova model with rotation and nuclear burning//Astro-phys.J.–1983.–269.–P.281.[6]Chevalier,R.,Soker,N.Asymmetric envelope expansion of supernova1987A//Astrophys.J.–1989.–341.–P.867.[7]Chugaj N.Assymetry of an SN1987A envelope//Astron.Zhurn.–1991.–68.–P.349.[8]Gaensler,B.M.,et al.The Asymmetric Radio Remnant of SN1987A//Astrophys.J.–1997.–479.–P.845.[9]Hnatyk,B.,Petruk,O.Evolution of supernova remnants in the interstellar medium with a large-scale densitygradient.I.General properties of shape evolution and X-ray emission.//Astron.&Astrophys.–1999.–344.–P.295.[10]Lyne A.,Lorimer,D.High birth velocities of radio pulsars//Nature.–1994.–369.–P.127.[11]Mewe,R.,Lemen,J.R.,van den Oord,G.H.J.Calculated X-radiation from optically thin plasmas.VI.Improvedcalculations for continuum emission and approximation formulae for nonrelativistic average Gaunt factors.//As-tron.&Astrophys.Suppl.–1986.–65.–P.511.[12]Papaliolios,C.,et al.Asymmetry of the envelope of supernova1987A//Nature.–1989.–338.–P.565.[13]Petruk,O.Evolution of supernova remnants in the interstellar medium with a large-scale density gradient.III.Rem-nants of aspherical supernova explosions,in preparation[14]Raymond,J.,Smith,B.Soft X-ray spectrum of a hot plasma//Astrophys.J.Suppl.–1977.–35.–P.419.[15]Sedov,L.Similarity and Dimensional Methods in Mechanics.–New York:Academic,1959[16]Yamada,S.,Sato,K.Rayleigh-Taylor instability in the asymmetric supernova explosion//Astrophys.J.–1991.–382.–P.594.4。