Eric Bogatin著信号完整性 PCBSI2008SH-1~2
- 格式:ppt
- 大小:1.48 MB
- 文档页数:53
SIGNAL INTEGRITYRaymond Y. Chen, Sigrid, Inc., Santa Clara, CaliforniaIntroductionIn the realm of high-speed digital design, signal integrity has become a critical issue, and is posing increasing challenges to the design engineers. Many signal integr ity problems are electromagnetic phenomena in nature and hence related to the EMI/EMC discussions in the previous sections of this book. In this chapter, we will discuss what the typical signal integrity problems are, where they come from, why it is important to understand them and how we can analyze and solve these issues. Several software tools available at present for signal integrity analysis and current trends in this area will also be introduced.The term Signal Integrity (SI) addresses two concerns in the electrical design aspects – the timing and the quality of the signal. Does the signal reach its destination when it is supposed to? And also, when it gets there, is it in good condition? The goal of signal integrity analysis is to ensure reliable high-speed data transmission. In a digital system, a signal is transmitted from one component to another in the form of logic 1 or 0, which is actually at certain reference voltage levels. At the input gate of a receiver, voltage above the reference value Vih is considered as logic high, while voltage below the reference value Vil is considered as logic low. Figure 14-1 shows the ideal voltage waveform in the perfect logic world, whereas Figure 14-2 shows how signal will look like in a real system. More complex data, composed of a string of bit 1 and 0s, are actually continuous voltage waveforms. The receiving component needs to sample the waveform in order to obtain the binary encoded information. The data sampling process is usually triggered by the rising edge or the falling edge of a clock signal as shown in the Figure 14-3. It is clear from the diagram that the data must arrive at the receiving gate on time and settle down to a non-ambiguous logic state when the receiving component starts to latch in. Any delay of the data or distortion of the data waveform will result in a failure of the data transmission. Imagine if the signal waveform in Figure 14-2 exhibits excessive ringing into the logic gray zone while the sampling occurs, then the logic level cannot be reliably detected.SI ProblemsT ypical SI Problems“Timing” is everything in a high-speed system. Signal timing depends on the delay caused by the physical length that the signal must propagate. It also depends on the shape of the waveform w hen the threshold is reached. Signal waveform distortions can be caused by different mechanisms. But there are three mostly concerned noise problems:•Reflection Noise Due to impedance mismatch, stubs, visa and other interconnect discontinuities. •Crosstalk Noise Due to electromagnetic coupling between signal traces and visa.•Power/Ground Noise Due to parasitic of the power/ground delivery system during drivers’ simultaneous switching output (SSO). It is sometimes also called Ground Bounce, Delta-I Noise or Simultaneous Switching Noise (SSN).Besides these three kinds of SI problems, there is other Electromagnetic Compatibility or Electromagnetic Interference (EMC/EMI) problems that may contribute to the signal waveform distortions. When SI problems happen and the system noise margin requirements are not satisfied – the input to a switching receiver makes an inflection below Vih minimum or above Vil maximum; the input to a quiet receiver rises above V il maximum or falls below Vih minimum; power/ground voltage fluctuations disturb the data in the latch, then logic error, data drop, false switching, or even system failure may occur. These types of noise faults are extremely difficult to diagnose and solve after the system is built or prototyped. Understanding and solving these problems before they occur will eliminate having to deal with them further into the project cycle,and will in turn cut down the development cycle and reduce the cost[1]. In the later part of thischapter, we will have further investigations on the physical behavior of these noise phenomena, their causes, their electrical models for analysis and simulation, and the ways to avoid them.1. Where SI Problems HappenSince the signals travel through all kinds of interconnections inside a system, any electrical impact happening at the source end, along the path, or at the receiving end, will have great effects on the signal timing and quality. In a typical digital system environment, signals originating from the off-chip drivers on the die (the chip) go through c4 or wire-bond connections to the chip package. The chip package could be single chip carrier or multi-chip module (MCM). Through the solder bumps of the chip package, signals go to the Printed Circuit Board (PCB) level. At this level, typical packaging structures include daughter card, motherboard or backplane. Then signals continue to go to another system component, such as an ASIC (Application Specific Integrated Circuit) chip, a memory module or a termination block. The chip packages, printed circuit boards, as well as the cables and connecters, form the so-called different levels of electronic packaging systems, as illustrated in Figure 14-4. In each level of the packaging structure, there are typical interconnects, such as metal traces, visa, and power/ground planes, which form electrical paths to conduct the signals. It is the packaging interconnection that ultimately influences the signal integrity of a system.2. SI In Electronic PackagingTechnology trends toward higher speed and higher density devices have pushed the package performance to its limits. The clock rate of present personal computers is approaching gigahertz range. As signal rise-time becomes less than 200ps, the significant frequency content of digital signals extends up to at least 10 GHz. This necessitates the fabrication of interconnects and packages to be capable of supporting very fast varying and broadband signals without degrading signal integrity to unacceptable levels. While the chip design and fabrication technology have undergone a tremendous evolution: gate lengths, having scaled from 50 µm in the 1960s to 0.18 µm today, are projected to reach 0.1 µm in the next few years; on-chip clock frequency is doubling every 18 months; and the intrinsic delay of the gate is decreasing exponentially with time to a few tens of Pico-seconds. However, the package design has lagged considerably. With current technology, the package interconnection delay dominates the system timing budget and becomes the bottleneck of the high-speed system design. It is generally accepted today that package performance is one of the major limiting factors of the overall system performance.Advances in high performance sub-micron microprocessors, the arrival of gigabit networks, and the need for broadband Internet access, necessitate the development of high performance packaging structures for reliable high-speed data transmission inside every electronics system.Signal integrity is one of the most important factors to be considered when designing these packages (chip carriers and PCBs) and integrating these packages together.3、SI Analysis3.1. SI Analysis in the Design FlowSignal integrity is not a new phenomenon and it did not always matter in the early days of the digital era. But with the explosion of the information technology and the arrival of Internet age, people need to be connected all the time through various high-speed digital communication/computing systems. In this enormous market, signal integrity analysis will play a more and more critical role to guarantee the reliable system operation of these electronics products. Without pre-layout SI guidelines, prototypes may never leave the bench; without post-layout SI verifications, products may fail in the field. Figure 14-5 shows the role of SI analysis in the high-speed design process. From this chart, we will notice that SI analysis is applied throughout the design flow and tightly integrated into each design stage. It is also very common to categorize SI analysis into two main stages: reroute analysis and post route analysis.In the reroute stage, SI analysis can be used to select technology for I/Os, clock distributions, chip package types, component types, board stickups, pin assignments, net topologies, and termination strategies. With various design parameters considered, batch SI simulations on different corner cases will progressively formulate a set of optimized guidelines for physical designs of later stage. SI analysis at this stage is also called constraint driven SI design because the guidelines developed will be used as constraints for component placement and routing. The objective of constraint driven SI design at the reroute stage is to ensure that the signal integrity of the physical layout, which follows the placement/routing constraints for noise and timing budget, will not exceed the maximum allowable noise levels. Comprehensive and in-depth reroute SI analysis will cut down the redesign efforts and place/route iterations, and eventually reduce design cycle.With an initial physical layout, post route SI analysis verifies the correctness of the SI design guidelines and constraints. It checks SI violations in the current design, such as reflection noise, ringing, crosstalk and ground bounce. It may also uncover SI problems that are overlooked in the reroute stage, because post route analysis works with physical layout data rather than estimated data or models, therefore it should produce more accurate simulation results.When SI analysis is thoroughly implemented throughout the whole design process, a reliable high performance system can be achieved with fast turn-around.In the past, physical designs generated by layout engineers were merely mechanical drawings when very little or no signal integrity issues were concerned. While the trend of higher-speed electronics system design continues, system engineers, responsible for developing a hardware system, are getting involved in SI and most likely employ design guidelines and routing constraints from signal integrity perspectives. Often, they simply do not know the answers to some of the SI problems because most of their knowledge is from the engineers doing previous generations of products. To face this challenge, nowadays, a design team (see Figure 14-6) needs to have SI engineers who are specialized in working in this emerging technology field. When a new technology is under consideration, such as a new device family or a new fabrication process for chip packages or boards, SI engineers will carry out the electrical characterization of the technology from SI perspectives, and develop layout guideline by running SI modeling and simulation software [2]. These SI tools must be accurate enough to model individual interconnections such as visa, traces, and plane stickups. And they also must be very efficient so what-if analysis with alternative driver/load models and termination schemes can be easily performed. In the end, SI engineers will determine a set of design rules and pass them to the design engineers and layout engineers. Then, the design engineers, who are responsible for the overall system design, need to ensure the design rules are successfully employed. They may run some SI simulations on a few critical nets once the board is initially placed and routed. And they may run post-layout verifications as well. The SI analysis they carry out involves many nets. Therefore, the simulation must be fast, though it may not require the kind of accuracy that SI engineers are looking for. Once the layout engineers get the placement and routing rules specified in SI terms, they need to generate an optimized physical design based on these constraints. And they will provide the report on any SI violations in a routed system using SI tools. If any violations are spotted, layout engineers will work closely with design engineers and SI engineers to solve these possible SI problems.3.2.Principles of SI AnalysisA digital system can be examined at three levels of abstraction: log ic, circuit theory, and electromagnetic (EM) fields. The logic level, which is the highest level of those three, is where SI problems can be easily identified. EM fields, located at the lowest level of abstraction, comprise the foundation that the other levels are built upon [3]. Most of the SI problems are EM problems in nature, such as the cases of reflection, crosstalk and ground bounce. Therefore, understanding the physical behavior of SI problems from EM perspective will be very helpful. For instance, in the following multi-layer packaging structure shown in Figure 14-7, a switching current in via a will generate EM waves propagating away from that via in the radial direction between metal planes. The fields developed between metal planes will cause voltage variations between planes (voltage is the integration of the E-field). When the waves reach other visa, they will induce currents in those visa. And the induced currents in that visa will in turn generate EM waves propagating between the planes. When the waves reach the edges of the package, part of them will radiate into the air and part of them will get reflected back. When the waves bounce back and forth inside the packaging structure and superimpose to each other, resonance will occur. Wave propagation, reflection, coupling and resonance are the typical EM phenomena happening inside a packaging structure during signal transients. Even though EM full wave analysis is much more accurate than the circuit analysis in the modeling of packaging structures, currently, common approaches of interconnect modeling are based on circuit theory, and SI analysis is carried out with circuit simulators. This is because field analysis usually requires much more complicated algorithms and much larger computing resources than circuit analysis, and circuit analysis provides good SI solutions at low frequency as an electrostatic approximation.Typical circuit simulators, such as different flavors of SPICE, employ nodal analysis and solve voltages and currents in lumped circuit elements like resistors, capacitors and inductors. In SI analysis, an interconnect sometimes will be modeled as a lumped circuit element. For instance, a piece of trace on the printed circuit board can be simply modeled as a resistor for its finite conductivity. With this lumped circuit model, the voltages along both ends of the trace are assumed to change instantaneously and the travel time for the signal to propagate between the two ends is neglected. However, if the signal propagation time along the trace has to be considered, a distributed circuit model, such as a cascaded R-L-C network, will be adopted to model the trace. To determine whether the distributed circuit model is necessary, the rule of thumb is – if the signal rise time is comparable to the round-trip propagation time, you need to consider using the distributed circuit model.For example, a 3cm long stripling trace in a FR-4 material based printed circuit board will exhibits 200ps propagation delay. For a 33 MHz system, assuming the signal rise time to be 5ns, the trace delay may be safely ignored; however, with a system of 500 MHz and 300ps rise time, the 200ps propagation delay on the trace becomes important and a distributed circuit model has to be used to model the trace. Through this example, it is easy to see that in the high-speed design, with ever-decreasing signal rise time, distributed circuit model must be used in SI analysis.Here is another example. Considering a pair of solid power and ground planes in a printed circuit board with the dimension of 15cm by 15cm, it is very natural to think the planes acting as a large, perfect, lumped capacitor, from the circuit theory point of view. The capacitor model C= erA/d, an electro-static solution, assumes anywhere on the plane the voltages are the same and all the charges stored are available instantaneously anywhere along the plane. This is true at DC and low frequency. However, when the logics switch with a rise time of 300ps, drawing a large amount of transient currents from the power/ground planes, they perceive the power/ground structure as a two-dimensional distributed network with significant delays. Only some portion of the plane charges located within a small radius of the switching logics will be able to supply the demand. And voltages between the power/ground planes will have variations at different locations. In this case, an ideal lumped capacitor model is obviously not going to account for the propagation effects. Two-dimensional distributed R-L-C circuit networks must be used to model the power/ground pair.In summary, as the current high-speed design trend continues, fast rise time reveals the distributed nature of package interconnects. Distributed circuit models need to be adopted to simulate the propagation delay in SI analysis. However, at higher frequencies, even the distributed circuit modeling techniques are not good enough, full wave electromagnetic field analysis based on solving Maxwell’s equations must come to play. As presen ted in later discussions, a trace will not be modeled as a lumped resistor, or a R-L-C ladder; it will be analyzed based upon transmission line theory; and a power/ground plane pair will be treated as a parallel-plate wave guide using radial transmission line theory.Transmission line theory is one of the most useful concepts in today’s SI analysis. And it is a basic topic in many introductory EM textbooks. For more information on the selective reading materials, please refer to the Resource Center in Chapter 16.In the above discussion, it can be noticed that signal rise time is a very important quantity in SI issues. So a little more expanded discussion on rise time will be given in the next section.信号完整性介绍在高速数字设计领域,信号完整性已经成为一个严重的问题,是造成越来越多的挑战的设计工程师。
第6卷 第4期2013年8月 中国光学 Chinese Optics Vol.6 No.4Aug.2013 收稿日期:2013⁃04⁃11;修订日期:2013⁃06⁃13 基金项目:国家自然科学基金面上项目(No.31270680,No.61076064);江苏省“六大高峰人才”资助项目(No.2011⁃XCL⁃018);江苏高校优势学科建设工程资助项目文章编号 1674⁃2915(2013)04⁃0490⁃11激光诱导击穿光谱技术及应用研究进展侯冠宇1,王 平1∗,佟存柱2(1.南京林业大学化学工程学院,江苏南京210037;2.中国科学院长春光学精密机械与物理研究所发光学及应用国家重点实验室,吉林长春130033)摘要:激光诱导击穿光谱(LIBS)技术是一种基于原子发射光谱学的元素定性、定量检测手段。
本文介绍了LIBS 技术的原理、应用方式、检测元素种类及检测极限;综述了该项技术在固体、液体、气体组分检测方面的技术发展,以及在环境检测、食品安全、生物医药、材料、军事、太空领域的应用进展。
最后,提出了高功率、高稳定的激光光源和准确的定量分析方法是LIBS 技术目前所面临的问题和挑战。
关 键 词:激光诱导击穿光谱;激光产生等离子体;元素分析;检测限中图分类号:O433.54;O657.319 文献标识码:A doi:10.3788/CO.20130604.0490Progress in laser⁃induced breakdown spectroscopyand its applicationsHOU Guan⁃yu 1,WANG Ping 1∗,TONG Cun⁃zhu 2(1.College of Chemical Engineering ,Nanjing Forestry University ,Nanjing 210037,China ;2.State Key Laboratory of Luminescence and Applications ,Changchun Institute of Optics ,Fine Mechanics and Physics ,Chinese Academy of Sciences ,Changchun 130033,China )∗Corresponding author ,E⁃mail :wp_lh@ Abstract :Laser⁃induced Breakdown Spectroscopy(LIBS)based on atomic emission spectral technology is a kind of convenient and sensitive approach for the qualitative and quantitative detection of elements.In this pa⁃per,the mechanism,detecting element types,detection limit and the recent progress of LIBS technology are reviewed.The progress of LIBS technology in component testing for solid,liquid and gas samples is expoundedin detail.The applications of LIBS in the environment test,food security,biological and medicines,material sciences,military and space fields are also presented.Finally,the challenges and problems for the LIBS tech⁃nology in high power and stable laser sources and accurately quantitative analysis method are discussed.Key words :laser⁃induced breakdown spectroscopy;laser⁃induced plasmon,element analysis;detection limit1 引 言 激光诱导击穿光谱(Laser⁃Induced Breakdown Spectroscopy,简称LIBS)技术是利用激光照射被测物体表面产生等离子体[1⁃2],通过检测等离子体光谱而获取物质成分和浓度的分析技术。
詹苑丽,王凯,曹潇,等. 羟丙基双淀粉磷酸酯糊液的屈服应力及触变性研究[J]. 食品工业科技,2024,45(6):100−109. doi:10.13386/j.issn1002-0306.2023060222ZHAN Yuanli, WANG Kai, CAO Xiao, et al. Study on Yield Stress and Thixotropy of Hydroxypropyl Distarch Phosphate Paste[J].Science and Technology of Food Industry, 2024, 45(6): 100−109. (in Chinese with English abstract). doi: 10.13386/j.issn1002-0306.2023060222· 研究与探讨 ·羟丙基双淀粉磷酸酯糊液的屈服应力及触变性研究詹苑丽1,2,王 凯1,曹 潇2,张书艳2,陈思谦2, *,朱 杰2,*(1.华南农业大学食品学院,广东广州 510642;2.东莞理工学院生命健康与技术学院,中国轻工业健康食品开发与营养调控重点实验室,东莞市特色食品精准设计重点实验室,食品营养健康工程与智能化加工研究中心,广东东莞 523808)摘 要:为研究羟丙基双淀粉磷酸酯(Hydroxypropyl distarch phosphate ,HPDSP )糊液的屈服应力和触变性行为,本文以不同链支比的玉米淀粉(CS )和蜡质玉米淀粉(WS )为原料的HPDSP 为研究对象,讨论了HPDSP 糊液在不同温度条件下的临界质量分数、屈服应力及触变特性。
结果表明,HPDSP 在5 ℃时的稀溶液-半稀溶液、半稀溶液-浓溶液临界质量分数分别为3wt%和6wt%。
5wt%时玉米淀粉-羟丙基双淀粉磷酸酯(CS-HPDSP )和蜡质玉米淀粉-羟丙基双淀粉磷酸酯(WS-HPDSP )的屈服应力与温度相关性较低,而6wt%时两者屈服应力随温度升高(至85 ℃)显著下降了69.52%和77.95%(P <0.05)。
文章编号:1006-3110(2008)05-1342-03 论 著 LC-ICP-M S联用测定海产品中有机锡丘红梅1,刘桂华1,于振花2,张慧敏1,申治国1,黎雪慧1,邓 利3摘要: 目的 采用液相色谱与电感耦合等离子体质谱联用分析法(L C-I CP-M S),测定广东沿海海域海产品中三丁基锡、三苯基锡含量,探明广东沿海海产品有机锡的污染状况。
方法 有代表性地采集广东海域17个海区及部分市售海产品,样品冻干处理制成干粉,加入流动相经超声萃取、离心、过滤等处理后,用LC-ICP-M S法测定三丁基锡、三苯基锡含量。
结果 所检测的32种共112个海产品样品中,以湿重计算的三丁锡含量最高的为58.7ngSn/g,平均浓度是8.6ngSn/g,以湿重计算的三苯基锡含量最高的为324.1ngSn/g,平均浓度是44.9ng Sn/g。
结论 广东沿海海域海产品已受到一定程度的有机锡污染,而其中三苯基锡的污染情况比三丁基锡严重。
关键词: 三丁基锡;三苯基锡;L C-ICP-M S;海产品中图分类号:R155 文献标识码:ASpeciation Analysis of TBT and TPT in Seafood by Liquid Chromatography Linked to Inductively Coupled Plasma Mass Spec-trometry QI U Hong-mei,LIU Gui-hua,YU Zhen-hua,et al.(Shenzhen Municipal Center f or Disease Contro l and Prevention,Shenzhen518020,Guangdong,China)Abstract: Objective To determine the concentration of TBT and TPT in seafood by li qui d chromatography linked to in-ducti vely coupled plasm a m as s spectrom etry(LC-ICP-M S),and to investigate the levels of organotin polluti on i n seafood around the coast of Guangdong Province. Methods The samples were collected widel y and representatively from17com-mercial s eafood beds and som e retai lers around G uangdong Province.After the lyophili z ati on step,the sam ples were treated with acetonitrile/water/acetic aci d(65/23/12)containing0.05%trethylam ine i n an ultr asoni c bath to extract TBT and TPT from seafood samples.The extracts were centrali zed and filtered before analyz i ng by LC-ICP-MS. Results The highest concentration of TBT was58.7ngSn/g wet weight in112s am ples,and the aver age concentration was8.6ngSn/g wet weight.The highest concentrati on of TPT was324.1ngSn/g wet wei ght,and the average concentration was44.9ngSn/g wet weight.C onclusions The res ults indicate that the seafood from Guangdong is polluted by organotin in a certain degree.The pollu-tion by TPT is more s erious than the pollution by TBT.Key words: TBT;TPT;LC-IC P-MS;Seafood随着工农业生产和经济的发展,有机锡化合物尤其是三苯基锡(T PT)和三丁基锡(T BT)作为杀虫剂、P VC稳定剂、船舶防污涂料等得到广泛应用。
DOI :10.19965/ki.iwt.2023-0164第 44 卷第 2 期2024年 2 月Vol.44 No.2Feb.,2024工业水处理Industrial Water Treatment 循环冷却水系统的电化学水质稳定技术案例分析张延进1,张泽坤1,徐星2,韩英强2,高宪2,江波3,徐浩1,2(1.西安交通大学环境科学与工程系,陕西西安 710049; 2.山东深信节能环保科技有限公司,枣庄市工业循环水处理工程技术中心,山东滕州 277531; 3.青岛理工大学环境与市政工程学院,山东青岛 266033)[摘要]水垢沉积和金属腐蚀会导致循环冷却水系统传热效率下降和能耗增加,严重影响工业生产的安全稳定运行。
以某厂循环水系统的电化学除垢设备为案例,通过分析其处理效果和经济效益,为电化学技术处理循环冷却水的应用推广提供依据。
现场所得运行数据表明,该厂所采用的电化学除垢设备能够有效改善水质,防止结垢,控制循环冷却水系统的腐蚀情况。
每年减少循环水系统补水量和排污量各4.38×10⁵ t ,并显著降低药剂投加量。
经济核算显示该电化学系统每年可节省约212.9万元。
[关键词] 循环冷却水;电化学除垢;水质稳定技术[中图分类号] TQ085 [文献标识码]B [文章编号] 1005-829X (2024)02-0184-06Case analysis of electrochemical water quality stabilization technologyfor circulating cooling water systemZHANG Yanjin 1,ZHANG Zekun 1,XU Xing 2,HAN Yingqiang 2,GAO Xian 2,JIANG Bo 3,Xu Hao 1,2(1.Department of Environmental Science Engineering ,Xi ’an Jiaotong University ,Xi ’an 710049,China ;2.Shandong Shenxin Energy Saving and Environmental Protection Technology Co., L td., R ecycled Water Engineering Technology Center of Zaozhuang City ,Tengzhou 277531,China ;3.College of Environmental and Municipal Engineering ,Qingdao Technological University ,Qingdao 266033,China )Abstract :Scale deposits and metal corrosion in circulating cooling water systems can lead to reduced heat transfer efficiency and increased energy consumption in circulating water systems ,seriously affecting the safe and stable op⁃eration of industrial production. This paper takes the electrochemical descaling equipment of a plant ’s circulating water system as a case study ,and provides a basis for the application of electrochemical technology for the treatment of circulating cooling water by analyzing its treatment effects and economic benefits. Operational results from the site show that the electrochemical descaling equipment used in the plant can effectively improve water quality ,pre⁃vent scaling and control the corrosion of the circulating cooling water system. It can reduce 4.38×10⁵ t of water re⁃charge and discharge from the circulating water system each year ,and significantly reduce the amount of chemicalsadded. Economic calculations show that the electrochemical descaling equipment can save approximately 2.129 mil⁃lion yuan per year.Key words :circulating cooling water ;electrochemical descaling ;water quality stabilization technology工业用水量在我国总用水量中占有较大比例,其中循环冷却水又在工业用水中占据着最重要的地位〔1〕。

中图分类号:S 852.723 文献标识码:A 文章编号:167324696(2008)0120020205柔嫩艾美球虫免疫与鸡盲肠扁桃体TNF 2α基因表达动态的关系王彩霞,徐 赓,王黎霞,安 健3(北京农学院动物科学技术系,北京 102206) 摘要:根据GenBank 上鸡β2actin 、TN F 2α的基因序列设计引物,应用逆转录2聚合酶链式反应(R T 2PCR )技术克隆获得了β2actin 和TN F 2α基因,采用β2actin 为内参的半定量方法检测TN F 2αmRNA 在鸡柔嫩艾美球虫免疫前后不同时间的表达情况,以探讨TN F 2α基因的表达动态与柔嫩艾美球虫免疫的关系。
结果显示,TN F 2α基因在两次免疫期间的表达量整体上呈现双峰模式,首免后第9d 达到一个高峰,二免后第7d 达到另一个高峰。
结果表明,TN F 2α在抗球虫感染中有一定的作用。
关键词:β2actin 基因;柔嫩艾美球虫;盲肠扁桃体;R T 2PCR ;TN F 2α基因R elationship bet w een Eimeria tenella immunity and kineticexpression of TNF 2αgene in chicken cecal tonsil WAN G Cai 2xia ,XU Geng ,WAN G Li 2xia ,AN Jian(De partment of A ni mal S cience and Technolog y ,B ei j ing College of A g riculture ,B ei j ing 102206,China ) Abstract :According to chicken β2actin and TN F 2αgene sequences in GenBank ,primers were de 2signed ,and t he gene sequences were amplified by reverse t ranscriptase 2polymerase chain reaction (R T 2PCR )f rom t he cecal tonsil of chicken experimentally immunized wit h Ei meri a tenell a .The exp ression le 2vel of TN F 2αmRNA at different time after immunization was detected by semi 2quantitative R T 2PCR wit h β2actin gene as internal reference to st udy t he relationship between E.tenell a immunizatio n and t he kineticexpression of TN F 2αgene in chicken cecal tonsil.The result s showed t hat t he level of expression of TN F 2αgene reached 1st peak on day 9po st 21st 2immunization ,and reached 2nd peak on day 7post 2booster 2immunization.It was concluded t hat TN F 2αhad some effect against E.tenell a infection.K ey w ords :β2actin gene ;Ei meri a tenell a ;cecal tonsil ;R T 2PCR ;t umor necrosis factor 2αgene 鸡球虫病是由艾美属球虫寄生于鸡小肠和盲肠上皮细胞引起的一类原虫病,对养鸡业的危害相当严重。
信号完整性基本教材1 High Speed Digital Design: A Handbook of Black Magic (Prentice Hall Modern Semiconductor Design Series' Sub Series: PH Signal Integrity Library) (Hardcover) 1993-04-08High Speed Signal Propagation: Advanced Black Magic (Prentice Hall Modern Semiconductor Design Series' Sub Series: PH Signal Integrity Library) (Hardcover) 2003-02-28中文版:高速数字设计by Howard W. Johnson (Author)译者: 陈宏伟等电子工业出版社 2004.06版 353页2 High-Speed Digital System Design: A Handbook of Interconnect Theory and Design Practices (Hardcover)2000-08-25中文版:高速数字系统设计(互连理论和设计实践手册)机械工业出版社by Stephen H. Hall (Author), Garrett W. Hall (Author), James A. McCall (Author) "The speed of light is just too slow..." (more) 译者:伍薇等3 Digital Signal Integrity: Modeling and Simulation with Interconnects and Packages (Prentice Hall Modern Semiconductor Design Series' Sub Series: PH Signal Integrity Library) (Paperback) 2000-10-09by Brian Young (Author)4 High-Speed Circuit Board Signal Integrity (Artech House Microwave Library) (Hardcover) 2004-09-24by Stephen, C. Thierauf (Author) "This is a book about high-speed signaling on printed wiring boards (PWBs)..."5 Handbook of Digital Techniques for High-Speed Design: Design Examples, Signaling and Memory Technologies, Fiber Optics, Modeling, and Simulation to Ensure ... Sub Series: PH Signal Integrity Library) (Hardcover) 2004-05-24by Tom Granberg (Author)6 High-Speed Digital System Design (Synthesis Lectures on Digital Circuits and Systems) (Paperback) 2007-04-25by Justin Davis (Author)7 High-Speed VLSI Interconnections (Wiley Series in Microwave and Optical Engineering) (Hardcover) 2007-09-17by Ashok K. Goel (Author)8 Signal and Power Integrity in Digital Systems: TTL, CMOS, and BiCMOS (Hardcover) 1995-12-22by James E. Buchanan (Author), Bert D. Buchanan (Illustrator)9 Timing Analysis and Simulation for Signal Integrity Engineers (Prentice Hall Modern Semiconductor Design Series' Sub Series: PH Signal Integrity Library) (Hardcover) 2007-10-22by Greg Edlund (Author)10 Semiconductor Modeling: For Simulating Signal, Power, and ElectromagneticIntegrity (Hardcover) 2006-10-31by Roy G. Leventhal (Author), Lynne Green (Author), D.J. Carpenter (Cont ributor)11 Electromagnetic Compatibility of Integrated Circuits: Techniques for low emission and susceptibility (Hardcover)2005-09-09by Sonia Ben Dhia (Editor), Mohamed Ramdani (Editor), Etienne Sicard (Editor) 12 Synthesis of Power Distribution to Manage Signal Integrity in Mixed-Signal ICs (Hardcover) 1996-05-31by Balsha R. Stanisic (Author), Rob A. Rutenbar (Author), L. Richard Carley (Author) "The focus of this research is to generate analog power distribution for analog or mixed-signal ASICs..."13 Signal Integrity Issues and Printed Circuit Board Design (Prentice Hall Modern Semiconductor Design Series' Sub Series: PH Signal Integrity Library) (Hardcover) 2003-08-24中文版:信号完整性问题和印制电路板设计机械工业出版社by Douglas Brooks (Author)译者: 刘雷波等14 Jitter, Noise, and Signal Integrity at High-Speed (Prentice Hall Modern Semiconductor Design Series' Sub Series: PH Signal Integrity Library) (Hardcover) 2007-11-27by Mike Peng Li (Author)15 Power Integrity Modeling and Design for Semiconductors and Systems (Prentice Hall Modern Semiconductor Design Series' Sub Series: PH Signal Integrity Library) (Hardcover) 2007-11-28by Madhavan Swaminathan (Author), Ege Engin (Author)16 Designing High-Speed Interconnect Circuits: An Introduction for Signal Integrity Engineers (Hardcover) 2004-08-01by Dennis Miller (Author)17 Emc & the Printed Circuit Board: Design, Theory, & Layout Made Simple (Hardcover) 1998-08-31by Mark I. Montrose (Author) "This book seeks primarily to help engineers minimize harmful interference between components, circuits, and systems..." 18 Printed Circuit Board Design Techniques for EMC Compliance: A Handbook for Designers (IEEE Press Series on Electronics Technology) (Hardcover) 2000-06-20by Mark I. Montrose (Author) "The following basic terms are used throughout this book..."19 Integrated Circuit Design for High-Speed Frequency Synthesis (Artech House Microwave Library) (Hardcover) 2006-01-31by John Rogers (Author), Calvin Plett (Author), Foster Dai (Author) "Over the past few decades, therehas been an incredible growth in the electronics industry..."20 High Speed Integrated Circuit Technology : Towards 100 GHZ Logic(Selected Topics in Electronics and Systems) (Selected Topics in Electronics and Systems) (Hardcover) 2001-04-24by Mark J. W. Rodwell (Editor) "Demand has been increasing for high-speed serial data link systems usinghigh-speed large-scale integrated circuits (LSIs) with speeds in the gigahertz range..."21 Advanced Signal Integrity for High-Speed Digital Designs (Hardcover) 2008-07-31by Stephen H. Hall (Author), Howard L. Heck (Author)。
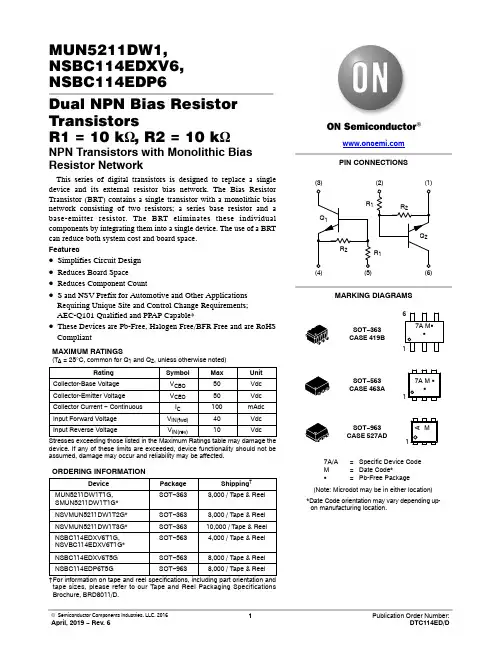
MUN5211DW1,NSBC114EDXV6,NSBC114EDP6Dual NPN Bias Resistor TransistorsR1 = 10 k W, R2 = 10 k WNPN Transistors with Monolithic Bias Resistor NetworkThis series of digital transistors is designed to replace a single device and its external resistor bias network. The Bias Resistor Transistor (BRT) contains a single transistor with a monolithic bias network consisting of two resistors; a series base resistor and a base-emitter resistor. The BRT eliminates these individual components by integrating them into a single device. The use of a BRT can reduce both system cost and board space.Features•Simplifies Circuit Design•Reduces Board Space•Reduces Component Count•S and NSV Prefix for Automotive and Other Applications Requiring Unique Site and Control Change Requirements;AEC-Q101 Qualified and PPAP Capable*•These Devices are Pb-Free, Halogen Free/BFR Free and are RoHS CompliantMAXIMUM RATINGS(T A = 25°C, common for Q1 and Q2, unless otherwise noted)Rating Symbol Max Unit Collector-Base Voltage V CBO50Vdc Collector-Emitter Voltage V CEO50Vdc Collector Current − Continuous I C100mAdc Input Forward Voltage V IN(fwd)40Vdc Input Reverse Voltage V IN(rev)10Vdc Stresses exceeding those listed in the Maximum Ratings table may damage the device. If any of these limits are exceeded, device functionality should not be assumed, damage may occur and reliability may be affected. ORDERING INFORMATIONDevice Package Shipping†MUN5211DW1T1G,SMUN5211DW1T1G*SOT−3633,000 / Tape & Reel NSVMUN5211DW1T2G*SOT−3633,000 / Tape & Reel NSVMUN5211DW1T3G*SOT−36310,000 / Tape & Reel NSBC114EDXV6T1G,NSVBC114EDXV6T1G*SOT−5634,000 / Tape & Reel NSBC114EDXV6T5G SOT−5638,000 / Tape & ReelNSBC114EDP6T5G SOT−9638,000 / Tape & Reel†For information on tape and reel specifications, including part orientation and tape sizes, please refer to our Tape and Reel Packaging SpecificationsMARKING DIAGRAMSPIN CONNECTIONS7A M GG17A/A=Specific Device CodeM=Date Code*G=Pb-Free Package (Note: Microdot may be in either location) *Date Code orientation may vary depending up-on manufacturing location.SOT−363CASE 419BSOT−563CASE 463A(1)(2)(3)(6)(5)(4)SOT−963CASE 527ADM1A7A M GG16THERMAL CHARACTERISTICSCharacteristic Symbol Max Unit MUN5211DW1 (SOT−363) ONE JUNCTION HEATEDTotal Device DissipationT A = 25°C(Note1)(Note2)Derate above 25°C(Note1)(Note2)P D1872561.52.0mWmW/°CThermal Resistance,(Note1) Junction to Ambient(Note2)R q JA670490°C/WMUN5211DW1 (SOT−363) BOTH JUNCTION HEATED (Note3)Total Device DissipationT A = 25°C(Note1)(Note2)Derate above 25°C(Note1)(Note2)P D2503852.03.0mWmW/°CThermal Resistance,Junction to Ambient(Note1)(Note2)R q JA493325°C/WThermal Resistance, Junction to Lead(Note1)(Note2)R q JL188208°C/WJunction and Storage Temperature Range T J, T stg−55 to +150°C NSBC114EDXV6 (SOT−563) ONE JUNCTION HEATEDTotal Device DissipationT A = 25°C(Note1)Derate above 25°C(Note1)P D3572.9mWmW/°CThermal Resistance,Junction to Ambient(Note1)R q JA350°C/WNSBC114EDXV6 (SOT−563) BOTH JUNCTION HEATED (Note3)Total Device DissipationT A = 25°C(Note1)Derate above 25°C(Note1)P D5004.0mWmW/°CThermal Resistance,Junction to Ambient(Note1)R q JA250°C/WJunction and Storage Temperature Range T J, T stg−55 to +150°C NSBC114EDP6 (SOT−963) ONE JUNCTION HEATEDTotal Device DissipationT A = 25°C(Note4)(Note5)Derate above 25°C(Note4)(Note5)P D2312691.92.2MWmW/°CThermal Resistance,Junction to Ambient(Note4)(Note5)R q JA540464°C/WNSBC114EDP6 (SOT−963) BOTH JUNCTION HEATED (Note3)Total Device DissipationT A = 25°C(Note4)(Note5)Derate above 25°C(Note4)(Note5)P D3394082.73.3MWmW/°CThermal Resistance,Junction to Ambient(Note4)(Note5)R q JA369306°C/WJunction and Storage Temperature Range T J, T stg−55 to +150°C 1.FR−4 @ Minimum Pad.2.FR−4 @ 1.0×1.0 Inch Pad.3.Both junction heated values assume total power is sum of two equally powered channels.4.FR−4 @ 100mm2, 1 oz. copper traces, still air.5.FR−4 @ 500mm2, 1 oz. copper traces, still air.ELECTRICAL CHARACTERISTICS (T A=25°C, common for Q1 and Q2, unless otherwise noted)Characteristic Symbol Min Typ Max Unit OFF CHARACTERISTICSCollector-Base Cutoff Current (V CB=50V, I E=0)I CBO−−100nAdcCollector-Emitter Cutoff Current (V CE=50V, I B=0)I CEO−−500nAdcEmitter-Base Cutoff Current (V EB=6.0V, I C=0)I EBO−−0.5mAdcCollector-Base Breakdown Voltage (I C=10m A, I E=0)V(BR)CBO50−−VdcCollector-Emitter Breakdown Voltage (Note6) (I C=2.0mA, I B=0)V(BR)CEO50−−VdcON CHARACTERISTICSDC Current Gain (Note6) (I C=5.0mA, V CE=10V)h FE3560−Collector-Emitter Saturation Voltage (Note6) (I C=10mA, I B=0.3mA)V CE(sat)−−0.25VInput Voltage (Off)(V CE=5.0V, I C=100m A)V i(off)− 1.2−VdcInput Voltage (On)(V CE=0.2V, I C=10mA)V i(on)−2.0−VdcOutput Voltage (On)(V CC=5.0V, V B=2.5V, R L=1.0k W)V OL−−0.2VdcOutput Voltage (Off)(V CC=5.0V, V B=0.5V, R L=1.0k W)V OH4.9−−Vdc Input Resistor R17.01013k W Resistor Ratio R1/R20.8 1.0 1.2Product parametric performance is indicated in the Electrical Characteristics for the listed test conditions, unless otherwise noted. Product performance may not be indicated by the Electrical Characteristics if operated under different conditions.6.Pulsed Condition: Pulse Width=300ms, Duty Cycle ≤2%.Figure 1. Derating CurveAMBIENT TEMPERATURE (°C)PD,POWERDISSIPATION(mW)(1) SOT−363; 1.0×1.0 Inch Pad(2) SOT−563; Minimum Pad(3) SOT−963; 100mm2, 1 oz. Copper TraceTYPICAL CHARACTERISTICS MUN5211DW1, NSBC114EDXV6Figure 2. V CE(sat) vs. I CI C , COLLECTOR CURRENT (mA)1010.1Figure 3. DC Current GainFigure 4. Output Capacitance 0.10.010.001I C , COLLECTOR CURRENT (mA)100010010I C , COLLECTOR CURRENT (mA)Figure 5. Output Current vs. Input Voltage1010.1V in , INPUT VOLTAGE (V)Figure 6. Input Voltage vs. Output Current3.62.80.41.20V R , REVERSE VOLTAGE (V)V C E (s a t ), C O L L E C T O R −E M I T T E R V O L T A G E (V )h F E , D C C U R R E N T G A I N0.81.62.02.43.2C o b , O U T P U T C A P A C I T A N C E (p F )I C , C O L L E C T O R C U R R E N T (m A )V i n , I N P U T V O L T A G E (V )TYPICAL CHARACTERISTICSNSBC114EDP6Figure 7. V CE(sat) vs. I CFigure 8. DC Current GainI C , COLLECTOR CURRENT (mA)I C , COLLECTOR CURRENT (mA)0.010.11Figure 9. Output CapacitanceFigure 10. Output Current vs. Input VoltageV R , REVERSE VOLTAGE (V)V in , INPUT VOLTAGE (V)Figure 11. Input Voltage vs. Output CurrentI C , COLLECTOR CURRENT (mA)V C E (s a t ), C O L L E C T O R −E M I T T E R V O L T A G E (V )h F E , D C C U R R E N T G A I NC o b , O U T P U T C A P A C I T A N C E (p F )I C , C O L L E C T O R C U R R E N T (m A )V i n , I N P U T V O L T A G E (V )SC −88/SC70−6/SOT −363CASE 419B −02ISSUE YDATE 11 DEC 2012SCALE 2:1NOTES:1.DIMENSIONING AND TOLERANCING PER ASME Y14.5M, 1994.2.CONTROLLING DIMENSION: MILLIMETERS.3.DIMENSIONS D AND E1 DO NOT INCLUDE MOLD FLASH,PROTRUSIONS, OR GATE BURRS. MOLD FLASH, PROTRU-SIONS, OR GATE BURRS SHALL NOT EXCEED 0.20 PER END.4.DIMENSIONS D AND E1 AT THE OUTERMOST EXTREMES OF THE PLASTIC BODY AND DATUM H.5.DATUMS A AND B ARE DETERMINED AT DATUM H.6.DIMENSIONS b AND c APPLY TO THE FLAT SECTION OF THE LEAD BETWEEN 0.08 AND 0.15 FROM THE TIP .7.DIMENSION b DOES NOT INCLUDE DAMBAR PROTRUSION.ALLOWABLE DAMBAR PROTRUSION SHALL BE 0.08 TOTAL IN EXCESS OF DIMENSION b AT MAXIMUM MATERIAL CONDI-TION. THE DAMBAR CANNOT BE LOCATED ON THE LOWER RADIUS OF THE FOOT.XXXM G G XXX = Specific Device Code M = Date Code*G = Pb −Free Package GENERICMARKING DIAGRAM*16STYLES ON PAGE 2DIM MIN NOM MAX MILLIMETERS A −−−−−− 1.10A10.00−−−0.10dddb 0.150.200.25C 0.080.150.22D 1.80 2.00 2.20−−−−−−0.0430.000−−−0.0040.0060.0080.0100.0030.0060.0090.0700.0780.086MIN NOM MAX INCHES0.100.004E1 1.15 1.25 1.35e 0.65 BSC L 0.260.360.462.00 2.10 2.200.0450.0490.0530.026 BSC0.0100.0140.0180.0780.0820.086(Note: Microdot may be in either location)*Date Code orientation and/or position may vary depending upon manufacturing location.*For additional information on our Pb −Free strategy and soldering details, please download the ON Semiconductor Soldering and Mounting Techniques Reference Manual, SOLDERRM/D.SOLDERING FOOTPRINT*DIMENSIONS: MILLIMETERS0.306XRECOMMENDEDSIDE VIEWEND VIEWPLANEDETAIL AE A20.700.90 1.000.0270.0350.039L20.15 BSC 0.006 BSC aaa 0.150.006bbb 0.300.012ccc 0.100.0046X*This information is generic. Please refer to device data sheet for actual part marking.Pb −Free indicator, “G” or microdot “G ”, may or may not be present. Some products may not follow the Generic Marking.MECHANICAL CASE OUTLINEPACKAGE DIMENSIONSSTYLE 1:PIN 1.EMITTER 22.BASE 23.COLLECTOR 14.EMITTER 15.BASE 16.COLLECTOR 2STYLE 3:CANCELLEDSTYLE 2:CANCELLEDSTYLE 4:PIN 1.CATHODE2.CATHODE3.COLLECTOR4.EMITTER5.BASE6.ANODESTYLE 5:PIN 1.ANODE2.ANODE3.COLLECTOR4.EMITTER5.BASE6.CATHODESTYLE 6:PIN 1.ANODE 22.N/C3.CATHODE 14.ANODE 15.N/C6.CATHODE 2STYLE 7:PIN 1.SOURCE 22.DRAIN 23.GATE 14.SOURCE 15.DRAIN 16.GATE 2STYLE 8:CANCELLEDSTYLE 11:PIN 1.CATHODE 22.CATHODE 23.ANODE 14.CATHODE 15.CATHODE 16.ANODE 2STYLE 9:PIN 1.EMITTER 22.EMITTER 13.COLLECTOR 14.BASE 15.BASE 26.COLLECTOR 2STYLE 10:PIN 1.SOURCE 22.SOURCE 13.GATE 14.DRAIN 15.DRAIN 26.GATE 2STYLE 12:PIN 1.ANODE 22.ANODE 23.CATHODE 14.ANODE 15.ANODE 16.CATHODE 2STYLE 13:PIN 1.ANODE2.N/C3.COLLECTOR4.EMITTER5.BASE6.CATHODE STYLE 14:PIN 1.VREF2.GND3.GND4.IOUT5.VEN6.VCCSTYLE 15:PIN 1.ANODE 12.ANODE 23.ANODE 34.CATHODE 35.CATHODE 26.CATHODE 1STYLE 17:PIN 1.BASE 12.EMITTER 13.COLLECTOR 24.BASE 25.EMITTER 26.COLLECTOR 1STYLE 16:PIN 1.BASE 12.EMITTER 23.COLLECTOR 24.BASE 25.EMITTER 16.COLLECTOR 1STYLE 18:PIN 1.VIN12.VCC3.VOUT24.VIN25.GND6.VOUT1STYLE 19: PIN 1.I OUT2.GND3.GND4.V CC5.V EN6.V REF STYLE 20:PIN 1.COLLECTOR2.COLLECTOR3.BASE4.EMITTER5.COLLECTOR6.COLLECTORSTYLE 22:PIN 1.D1 (i)2.GND3.D2 (i)4.D2 (c)5.VBUS6.D1 (c)STYLE 21:PIN 1.ANODE 12.N/C3.ANODE 24.CATHODE 25.N/C6.CATHODE 1STYLE 23:PIN 1. Vn2.CH13.Vp4.N/C5.CH26.N/CSTYLE 24:PIN 1.CATHODE2.ANODE3.CATHODE4.CATHODE5.CATHODE6.CATHODESTYLE 25:PIN 1.BASE 12.CATHODE3.COLLECTOR 24.BASE 25.EMITTER6.COLLECTOR 1STYLE 26:PIN 1.SOURCE 12.GATE 13.DRAIN 24.SOURCE 25.GATE 26.DRAIN 1STYLE 27:PIN 1.BASE 22.BASE 13.COLLECTOR 14.EMITTER 15.EMITTER 26.COLLECTOR 2STYLE 28:PIN 1.DRAIN2.DRAIN3.GATE4.SOURCE5.DRAIN6.DRAINSTYLE 29:PIN 1.ANODE2.ANODE3.COLLECTOR4.EMITTER5.BASE/ANODE6.CATHODESC−88/SC70−6/SOT−363CASE 419B−02ISSUE YDATE 11 DEC 2012STYLE 30:PIN 1.SOURCE 12.DRAIN 23.DRAIN 24.SOURCE 25.GATE 16.DRAIN 1Note: Please refer to datasheet forstyle callout. If style type is not calledout in the datasheet refer to the devicedatasheet pinout or pin assignment.SOT −563, 6 LEADCASE 463A ISSUE HDATE 26 JAN 2021SCALE 4:16MECHANICAL CASE OUTLINEPACKAGE DIMENSIONSSOT −563, 6 LEADCASE 463A ISSUE HDATE 26 JAN 2021XX = Specific Device Code M = Month Code G = Pb −Free PackageXX MG GENERICMARKING DIAGRAM*1*This information is generic. Please refer todevice data sheet for actual part marking.Pb −Free indicator, “G” or microdot “G ”, may or may not be present. Some products maynot follow the Generic Marking.SOT −963CASE 527AD −01ISSUE EDATE 09 FEB 2010SCALE 4:1GENERICMARKING DIAGRAM*X = Specific Device Code M = Month Code*This information is generic. Please refer to device data sheet for actual part marking.Pb −Free indicator, “G” or microdot “ G ”,may or may not be present.DIM MIN NOM MAX MILLIMETERS A 0.340.370.40b 0.100.150.20C 0.070.120.17D 0.95 1.001.05E 0.750.800.85e 0.35 BSC 0.95 1.00 1.05HE ANOTES:1.DIMENSIONING AND TOLERANCING PER ASME Y14.5M, 1994.2.CONTROLLING DIMENSION: MILLIMETERS3.MAXIMUM LEAD THICKNESS INCLUDES LEAD FINISH THICKNESS. MINIMUM LEADTHICKNESS IS THE MINIMUM THICKNESS OF BASE MATERIAL.4.DIMENSIONS D AND E DO NOT INCLUDE MOLD FLASH, PROTRUSIONS, OR GATE BURRS.XM 1STYLE 1:PIN 1.EMITTER 12.BASE 13.COLLECTOR 24.EMITTER 25.BASE 26.COLLECTOR 1STYLE 2:PIN 1.EMITTER 12.EMITTER23.BASE 24.COLLECTOR 25.BASE 16.COLLECTOR 1STYLE 3:PIN 1.CATHODE 12.CATHODE 13.ANODE/ANODE 24.CATHODE 25.CATHODE 26.ANODE/ANODE 1STYLE 4:PIN 1.COLLECTOR2.COLLECTOR3.BASE4.EMITTER5.COLLECTOR6.COLLECTOR STYLE 6:PIN 1.CATHODE2.ANODE3.CATHODE4.CATHODE5.CATHODE6.CATHODE STYLE 5:PIN 1.CATHODE2.CATHODE3.ANODE4.ANODE5.CATHODE6.CATHODE STYLE 7:PIN 1.CATHODE2.ANODE3.CATHODE4.CATHODE5.ANODE6.CATHODE STYLE 8:PIN 1.DRAIN2.DRAIN3.GATE4.SOURCE5.DRAIN6.DRAINSTYLE 9:PIN 1.SOURCE 12.GATE 13.DRAIN 24.SOURCE 25.GATE 26.DRAIN 1STYLE 10:PIN 1.CATHODE 12.N/C3.CATHODE 24.ANODE 25.N/C6.ANODE 1TOP VIEW SIDE VIEWDIMENSIONS: MILLIMETERSRECOMMENDED MOUNTING FOOTPRINTL 0.19 REF L20.050.100.156X MECHANICAL CASE OUTLINEPACKAGE DIMENSIONSPUBLICATION ORDERING INFORMATIONTECHNICAL SUPPORT North American Technical Support:Voice Mail: 1 800−282−9855 Toll Free USA/Canada Phone: 011 421 33 790 2910LITERATURE FULFILLMENT :Email Requests to:*******************onsemi Website: Europe, Middle East and Africa Technical Support:Phone: 00421 33 790 2910For additional information, please contact your local Sales Representative ◊。
第46卷 第5期2024年5月系统工程与电子技术SystemsEngineeringandElectronicsVol.46 No.5May 2024文章编号:1001 506X(2024)05 1682 09 网址:www.sys ele.com收稿日期:20230724;修回日期:20230920;网络优先出版日期:20231024。
网络优先出版地址:http:∥kns.cnki.net/kcms/detail/11.2422.TN.20231024.1454.024.html基金项目:中央高校基本科研业务费(22120230184)资助课题 通讯作者.引用格式:刘虎沉,李珂,王鹤鸣,等.基于质量4.0的印制电路板智能缺陷检测研究[J].系统工程与电子技术,2024,46(5):1682 1690.犚犲犳犲狉犲狀犮犲犳狅狉犿犪狋:LIUHC,LIK,WANGHM,etal.IntelligentdefectdetectionbasedonQuality4.0:acasestudyofprintedcircuitboard[J].SystemsEngineeringandElectronics,2024,46(5):1682 1690.基于质量4.0的印制电路板智能缺陷检测研究刘虎沉1,李 珂1,王鹤鸣1,施 华2,(1.同济大学经济与管理学院,上海200092;2.上海电机学院材料学院,上海201306) 摘 要:新一代信息技术的高速发展为制造业的转型与发展提供了机遇,同时也推动了制造质量管理方式的重大变革。
本文结合制造业发展实际情况,概述了质量4.0的基本理论及关键技术,并进一步探讨了质量4.0的实施与落地应用。
具体而言,将印制电路板(printedcircuitboard,PCB)缺陷检测作为研究案例,设计了基于质量4.0的PCB智能缺陷检测方案,并提出了缺陷检测的5个关键评价标准;提出的检测方案可有效帮助PCB制造企业过滤缺陷假点、控制产品良率、获取缺陷解决建议,并为员工掌握专业检测技能提供学习和培训平台。
信号通路研究经典文献信号通路研究是电子工程领域的一个重要方向,涉及到信号传输、处理和控制等方面。
以下是关于信号通路研究的经典文献:1.《信号与系统》(原书第2版)- 阿兰·V·奥泽尔(Alan V. Oppenheim)、艾伯特·S·威尔斯基(Alan S. Willsky)、苏南德·纳迪尼尼(S. Hamid Nawab)合著。
这本经典教材是信号与系统领域的权威教材,全面介绍了信号与系统的基本理论和应用。
2.《数字信号处理》(原书第4版)- 约翰·G·普罗阿基斯(JohnG. Proakis)、德米特里斯·K·马南尼斯(Dimitris K. Manolakis)合著。
这本教材详细介绍了数字信号处理的理论和应用,包括离散时间信号与系统、数字滤波器设计等内容。
3.《信号处理的MATLAB实现》- 理查德·高尔德(Richard G. Lyons)著。
这本书以MATLAB为工具,详细介绍了信号处理的基本原理和实现方法,包括滤波、谱分析、信号重构等内容。
4.《模拟信号处理》(原书第2版)- 约翰·G·普罗阿基斯(JohnG. Proakis)、马萨赫特·塔鲁卡(Masoud Salehi)合著。
这本书系统地介绍了模拟信号处理的基本理论和方法,包括模拟信号的采样与重构、模拟滤波器设计等内容。
5.《通信系统工程》(原书第2版)- 约翰·G·普罗阿基斯(JohnG. Proakis)、马萨赫特·塔鲁卡(Masoud Salehi)合著。
这本书详细介绍了通信系统的基本原理和设计方法,包括调制与解调、信道编码与解码等内容。
6.《数字通信原理与应用》(原书第4版)- Bernard Sklar著。
这本书全面介绍了数字通信的理论和应用,包括数字调制、信道编码、误码性能分析等内容。