Molecular Fluorescence Thermometry
- 格式:pdf
- 大小:856.49 KB
- 文档页数:3
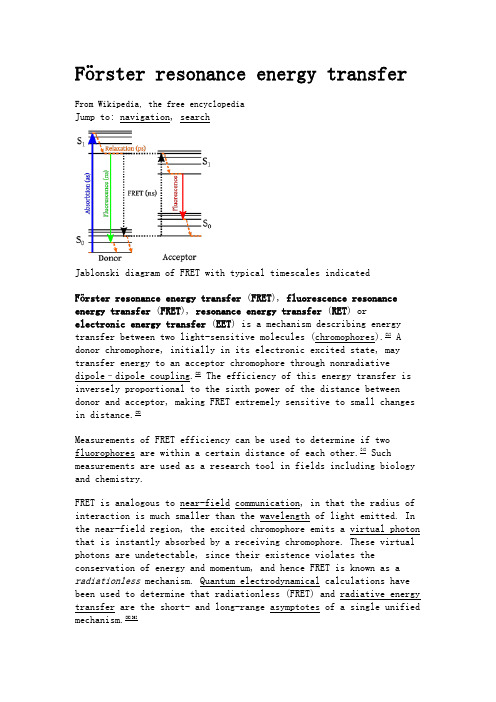
Förster resonance energy transferFrom Wikipedia, the free encyclopediaJump to: navigation, searchJablonski diagram of FRET with typical timescales indicatedFörster resonance energy transfer (FRET), fluorescence resonance energy transfer (FRET), resonance energy transfer (RET) orelectronic energy transfer (EET) is a mechanism describing energy transfer between two light-sensitive molecules (chromophores).[1] A donor chromophore, initially in its electronic excited state, may transfer energy to an acceptor chromophore through nonradiative dipole–dipole coupling.[2] The efficiency of this energy transfer is inversely proportional to the sixth power of the distance between donor and acceptor, making FRET extremely sensitive to small changes in distance.[3]Measurements of FRET efficiency can be used to determine if two fluorophores are within a certain distance of each other.[4] Such measurements are used as a research tool in fields including biology and chemistry.FRET is analogous to near-field communication, in that the radius of interaction is much smaller than the wavelength of light emitted. In the near-field region, the excited chromophore emits a virtual photon that is instantly absorbed by a receiving chromophore. These virtual photons are undetectable, since their existence violates the conservation of energy and momentum, and hence FRET is known as a radiationless mechanism. Quantum electrodynamical calculations have been used to determine that radiationless (FRET) and radiative energy transfer are the short- and long-range asymptotes of a single unified mechanism.[5][6]Contents[hide]∙ 1 Terminology∙ 2 Theoretical basis∙ 3 Experimental co nfirmation of the Förster resonance energy transfer theory∙ 4 Methods to measure FRET efficiencyo 4.1 Sensitized emissiono 4.2 Photobleaching FRETo 4.3 Lifetime measurements∙ 5 Fluorophores used for FRETo 5.1 CFP-YFP pairso 5.2 BRETo 5.3 Homo-FRET∙ 6 Applicationso 6.1 Biology∙7 Other methods∙8 See also∙9 References∙10 External linksTerminology[edit]Förster resonance energy transfer is named after the German scientist Theodor Förster.[7] When both chromophores are fluorescent, the term "fluorescence resonance energy transfer" is often used instead, although the energy is not actually transferred by fluorescence.[8][9]In order to avoid an erroneous interpretation of the phenomenon that is always a nonradiative transfer of energy (even when occurring between two fluorescent chromophores), the name "Förster resonance energy transfer" is preferred to "fluorescence resonance energy transfer;" however, the latter enjoys common usage in scientific literature.[10] It should also be noted that FRET is not restricted to fluorescence. It can occur in connection with phosphorescence as well.[8]Theoretical basis[edit]The FRET efficiency () is the quantum yield of the energy transfer transition, i.e. the fraction of energy transfer event occurring per donor excitation event:[11]where is the rate of energy transfer, the radiative decayrate, and the 's are the rate constants of any other de-excitation pathways.[12]The FRET efficiency depends on many physical parameters that can be grouped as follows:∙The distance between the donor and the acceptor (typically in the range of 1-10 nm)∙The spectral overlap of the donor emission spectrum and the acceptor absorption spectrum.∙The relative orientation of the donor emission dipole moment and the acceptor absorption dipole moment.depends on the donor-to-acceptor separation distance with an inverse 6th power law due to the dipole-dipole coupling mechanism:with being the Förster distance of this pair of donor andacceptor, i.e. the distance at which the energy transfer efficiency is 50%.[12]The Förster distance depends on the overlap integral of the donor emission spectrum with the acceptor absorption spectrum and their mutual molecular orientation as expressed by the following equation.[13][14]where is the fluorescence quantum yield of the donor in the absence of the acceptor, κ2 is the dipole orientation factor, is the refractive index of the medium, is Avogadro's number, and is the spectral overlap integral calculated aswhere is the normalized donor emission spectrum, and is the acceptor molar extinction coefficient.[15] The orientation factor κ is given by,Where denotes the normalized transition dipole moment of therespective fluorophore and denotes the normalized inter-fluorophore displacement. κ2 =2/3 is often assumed. This value is obtained when both dyes are freely rotating and can be considered to beisotropically oriented during the excited state lifetime. If either dye is fixed or not free to rotate, then κ2 =2/3 will not be a valid assumption. In most cases, however, even modest reorientation of the dyes results in enough orientational averaging that κ2 = 2/3 doesnot result in a large error in the estimated energy transfer distance due to the sixth power dependence of R0 on κ2. Even when κ2 is quite different from 2/3 the error can be associated with a shift in R0 and thus determinations of changes in relative distance for a particular system are still valid. Fluorescent proteins do not reorient on a timescale that is faster than their fluorescence lifetime. In this case 0 ≤ κ2≤ 4.[15]The FRET efficiency relates to the quantum yield and the fluorescence lifetime of the donor molecule as follows:[16]where and are the donor fluorescence lifetimes in the presenceand absence of an acceptor, respectively, or aswhere and are the donor fluorescence intensities with and without an acceptor, respectively.Experimental confirmation of the Förster resonance energy transfer theory[edit]The inverse sixth-power distance dependence of Förster resonance energy transfer was experimentally confirmed by Wilchek, Edelhoch and Brand[17][18] using tryptophyl peptides. Stryer, Haugland and Yguerabide[19] also experimentally demonstrated the theoretical dependence ofFörster resonance ene rgy transfer on the overlap integral by using a fused indolosteroid as a donor and a ketone as an acceptor. However, a lot of contradictions of special experiments with the theory was oserved. The reason is that the theory has approximate character and gives overstimated distances of 50-100 Angstrems (Vekshin N.L. Energy Transfer in Macromolecules, SPIE, 1997; Vekshin N.L. Photonics of Biopolymers, Springer, 2002).Methods to measure FRET efficiency[edit]In fluorescence microscopy, fluorescence confocal laser scanning microscopy, as well as in molecular biology, FRET is a useful tool to quantify molecular dynamics in biophysics and biochemistry, such as protein-protein interactions, protein–DNA interactions, and protein conformational changes. For monitoring the complex formation between two molecules, one of them is labeled with a donor and the other with an acceptor. The FRET efficiency is measured and used to identify interactions between the labeled complexes. There are several ways of measuring the FRET efficiency by monitoring changes in the fluorescence emitted by the donor or the acceptor.[20]Sensitized emission[edit]One method of measuring FRET efficiency is to measure the variationin acceptor emission intensity.[14] When the donor and acceptor are in proximity (1–10 nm) due to the interaction of the two molecules, the acceptor emission will increase because of the intermolecularFRET from the donor to the acceptor. For monitoring protein conformational changes, the target protein is labeled with a donor and an acceptor at two loci. When a twist or bend of the protein brings the change in the distance or relative orientation of the donor and acceptor, FRET change is observed. If a molecular interaction or a protein conformational change is dependent on ligand binding, this FRET technique is applicable to fluorescent indicators for the ligand detection.Photobleaching FRET[edit]FRET efficiencies can also be inferred from the photobleaching rates of the donor in the presence and absence of an acceptor.[14] This method can be performed on most fluorescence microscopes; one simply shines the excitation light (of a frequency that will excite the donor but not the acceptor significantly) on specimens with and without the acceptor fluorophore and monitors the donor fluorescence (typically separated from acceptor fluorescence using a bandpass filter) over time. The timescale is that of photobleaching, which is seconds to minutes, with fluorescence in each curve being given bywhere is the photobleaching decay time constant and depends on whether the acceptor is present or not. Since photobleaching consists in the permanent inactivation of excited fluorophores, resonance energy transfer from an excited donor to an acceptor fluorophore prevents the photobleaching of that donor fluorophore, and thus high FRET efficiency leads to a longer photobleaching decay time constant:where and are the photobleaching decay time constants of thedonor in the presence and in the absence of the acceptor, respectively. (Notice that the fraction is the reciprocal of that used for lifetime measurements).This technique was introduced by Jovin in 1989.[21] Its use of anentire curve of points to extract the time constants can give it accuracy advantages over the other methods. Also, the fact that time measurements are over seconds rather than nanoseconds makes it easierthan fluorescence lifetime measurements, and because photobleaching decay rates do not generally depend on donor concentration (unless acceptor saturation is an issue), the careful control of concentrations needed for intensity measurements is not needed. It is, however, important to keep the illumination the same for the with- and without-acceptor measurements, as photobleaching increases markedly with more intense incident light.Lifetime measurements[edit]FRET efficiency can also be determined from the change in the fluorescence lifetime of the donor.[14] The lifetime of the donor will decrease in the presence of the acceptor. Lifetime measurements of FRET are used in Fluorescence-lifetime imaging microscopy.Fluorophores used for FRET[edit]If the linker is intact, excitation at the absorbance wavelength of CFP (414nm) causes emission by YFP (525nm) due to FRET. If the linker is cleaved by a protease, FRET is abolished and emission is at the CFP wavelength (475nm).CFP-YFP pairs[edit]One common pair fluorophores for biological use is a cyan fluorescent protein (CFP) – yellow fluorescent protein (YFP) pair.[22] Both are color variants of green fluorescent protein (GFP). Labeling with organic fluorescent dyes requires purification, chemical modification, and intracellular injection of a host protein. GFP variants can be attached to a host protein by genetic engineering which can be more convenient. Additionally, a fusion of CFP and YFP linked by a protease cleavage sequence can be used as a cleavage assay.[23]BRET[edit]A limitation of FRET is the requirement for external illumination to initiate the fluorescence transfer, which can lead to background noise in the results from direct excitation of the acceptor or to photobleaching. To avoid this drawback, Bioluminescence Resonance Energy Transfer (or BRET) has been developed.[24] This technique uses a bioluminescent luciferase (typically the luciferase from Renilla reniformis) rather than CFP to produce an initial photon emission compatible with YFP.Homo-FRET[edit]In general, "FRET" refers to situations where the donor and acceptor proteins (or "fluorophores") are of two different types. In many biological situations, however, researchers might need to examine the interactions between two, or more, proteins of the same type—or indeed the same protein with itself, for example if the protein folds or forms part of a polymer chain of proteins[25] or for other questions of quantification in biological cells.[26]Obviously, spectral differences will not be the tool used to detect and measure FRET, as both the acceptor and donor protein emit light with the same wavelengths. Yet researchers can detect differences in the polarisation between the light which excites the fluorophores andthe light which is emitted, in a technique called FRET anisotropy imaging; the level of quantified anisotropy (difference in polarisation between the excitation and emission beams) then becomes an indicative guide to how many FRET events have happened.[27]Applications[edit]Biology[edit]FRET has been used to measure distance and detect molecular interactions in a number of systems and has applications in biology and chemistry.[28] FRET can be used to measure distances between domains in a single protein and therefore to provide information about protein conformation.[29] FRET can also detect interaction between proteins.[30] Applied in vivo, FRET has been used to detect the location and interactions of genes and cellular structures including intergrins and membrane proteins.[31] FRET can be used to obtain information about metabolic or signaling pathways.[32] FRET is also used to study lipid rafts in cell membranes.[33]FRET and BRET are also the common tools in the study of biochemical reaction kinetics and molecular motors.The applications of Fluorescence Resonance Energy Transfer (FRET) have expanded tremendously in the last 25 years, and the technique has become a staple technique in many biological and biophysical fields. FRET can be used as spectroscopic ruler in various areas such as structural elucidation of biological molecules and their interactions in vitro assays, in vivo monitoring in cellular research, nucleic acid analysis, signal transduction, light harvesting and metallic nanomaterial etc. Based on the mechanism of FRET a variety of novel chemical sensors and biosensors have been developed.[34]Other methods[edit]A different, but related, mechanism is Dexter Electron Transfer.An alternative method to detecting protein–protein proximity is the bimolecular fluorescence complementation (BiFC) where two halves of a YFP are fused to a protein. When these two halves meet they form a fluorophore after about 60 s – 1 hr.[35]See also[edit]∙Förster coupling∙Surface energy transfer∙Dexter electron transfer∙Time-resolved fluorescence energy transferReferences[edit]1.Jump up ^ Cheng, Ping-Chin (2006). "The Contrast Formation in OpticalMicroscopy". In Pawley, James B. Handbook Of Biological Confocal Microscopy(3rd ed.). New York, NY: Springer. pp. 162–206. doi:10.1007/978-0-387-45524-2_8. ISBN 978-0-387-25921-5.2.Jump up ^ Helms, Volkhard (2008). "Fluorescence Resonance Energy Transfer".Principles of Computational Cell Biology. Weinheim: Wiley-VCH. p. 202.ISBN 978-3-527-31555-0.3.Jump up ^ Harris, Daniel C. (2010). "Applications of Spectrophotometry".Quantitative Chemical Analysis (8th ed.). New York: W. H. Freeman and Co.pp. 419–44. ISBN 978-1-4292-1815-3.4.Jump up ^ Zheng, Jie (2006). "Spectroscopy-Based Quantitative FluorescenceResonance Energy Transfer Analysis". In Stockand, James D.; Shapiro, MarkS. Ion Channels: Methods and Protocols. Methods in Molecular Biology,Volume 337. Totowa, NJ: Humana Press. pp. 65–77. doi:10.1385/1-59745-095-2:65. ISBN 978-1-59745-095-9.5.Jump up ^ Andrews, David L. (1989). "A unified theory of radiative andradiationless molecular energy transfer". Chemical Physics135 (2): 195–201. Bibcode:1989CP....135..195A. doi:10.1016/0301-0104(89)87019-3.6.Jump up ^ Andrews, David L; Bradshaw, David S (2004). "Virtual photons,dipole fields and energy transfer: A quantum electrodynamical approach".European Journal of Physics25 (6): 845. doi:10.1088/0143-0807/25/6/017.7.Jump up ^Förster, Theodor (1948). "Zwischenmolekulare Energiewanderung undFluoreszenz" [Intermolecular energy migration and fluorescence]. Annalender Physik (in German) 437: 55–75. Bibcode:1948AnP...437...55F.doi:10.1002/andp.19484370105.8.^ Jump up to: a b Valeur, Bernard; Berberan-Santos, Mario (2012). "ExcitationEnergy Transfer". Molecular Fluorescence: Principles and Applications, 2nded. Weinheim: Wiley-VCH. pp. 213–261. doi:10.1002/9783527650002.ch8.ISBN 9783527328376.9.Jump up ^ FRET microscopy tutorial from Olympus10.Jump up ^Glossary of Terms Used in Photochemistry (3rd ed.). IUPAC. 2007.p. 340.11.Jump up ^ Moens, Pierre. "Fluorescence Resonance Energy Transferspectroscopy". Retrieved July 14, 2012.12.^ Jump up to: a b Schaufele, Fred; Demarco, Ignacio; Day, Richard N. (2005)."FRET Imaging in the Wide-Field Microscope". In Periasamy, Ammasi; Day, Richard. Molecular Imaging: FRET Microscopy and Spectroscopy. Oxford:Oxford University Press. pp. 72–94. doi:10.1016/B978-019517720-6.50013-4.ISBN 978-0-19-517720-6.13.Jump up ^Förster, Th. (1965). "Delocalized Excitation and ExcitationTransfer". In Sinanoglu, Oktay. Modern Quantum Chemistry. IstanbulLectures. Part III: Action of Light and Organic Crystals3. New York and London: Academic Press. pp. 93–137. Retrieved 2011-06-22.14.^ Jump up to: a b c d Clegg, Robert (2009). "Förster resonance energytransfer—FRET: what is it, why do it, and how it's done". In Gadella,Theodorus W. J. FRET and FLIM Techniques. Laboratory Techniques inBiochemistry and Molecular Biology, Volume 33. Elsevier. pp. 1–57.doi:10.1016/S0075-7535(08)00001-6. ISBN 978-0-08-054958-3.15.^ Jump up to: a b Demchenko, Alexander P. (2008). "Fluorescence DetectionTechniques". Introduction to Fluorescence Sensing. Dordrecht: Springer.pp. 65–118. doi:10.1007/978-1-4020-9003-5_3. ISBN 978-1-4020-9002-8. 16.Jump up ^ Majoul, Irina; Jia, Yiwei; Duden, Rainer (2006). "PracticalFluorescence Resonance Energy Transfer or Molecular Nanobioscopy of Living Cells". In Pawley, James B. Handbook Of Biological Confocal Microscopy (3rd ed.). New York, NY: Springer. pp. 788–808. doi:10.1007/978-0-387-45524-2_45. ISBN 978-0-387-25921-5.17.Jump up ^ Template:ISRAEL JOURNAL OF CHEMISTRY. Vol. 1. No. Sa. 196318.Jump up ^ {Edelhoch, H., Brand, L., Wilchek, M. (1967). "Fluorescencestudies with tryptophyl peptides". Biochemistry 6 (2): 547–559.doi:10.1021/bi00854a024. PMID 6047638}19.Jump up ^ Lakowicz, Joseph R., ed. (1991). Principles. New York: PlenumPress. p. 172. ISBN 978-0-306-43875-2.20.Jump up ^ "Fluorescence Resonance Energy Transfer Protocol". WellcomeTrust. Retrieved 24 June 2012.[dead link]21.Jump up ^Szöllősi, János; Alexander, Denis R. (2007). "The Application ofFluorescence Resonance Energy Transfer to the Investigation ofPhosphatases". In Klumpp, Susanne; Krieglstein, Josef. ProteinPhosphatases. Methods in Enzymology, Volume 366. Amsterdam: Elsevier.pp. 203–24. doi:10.1016/S0076-6879(03)66017-9. ISBN 978-0-12-182269-9. 22.Jump up ^ Periasamy, Ammasi (July 2001). "Fluorescence resonance energytransfer microscopy: a mini review". Journal of Biomedical Optics6 (3): 287–291. Bibcode:2001JBO.....6..287P. doi:10.1117/1.1383063.PMID 11516318.23.Jump up ^ Nguyen, AW; Daugherty, PS (March 2005). "Evolutionaryoptimization of fluorescent proteins for intracellular FRET.". Naturebiotechnology23 (3): 355–60. doi:10.1038/nbt1066. PMID 15696158.24.Jump up ^ Bevan, Nicola; Rees, Stephen (2006). "Pharmaceutical Applicationsof GFP and RCFP". In Chalfie, Martin; Kain, Steven R. Green FluorescentProtein: Properties, Applications and Protocols. Methods of Biochemical Analysis, Volume 47 (2nd ed.). Hoboken, NJ: John Wiley & Sons. pp. 361–90. doi:10.1002/0471739499.ch16. ISBN 978-0-471-73682-0.25.Jump up ^ Gautier, I.; Tramier, M.; Durieux, C.; Coppey, J.; Pansu, R.B.;Nicolas, J.-C.; Kemnitz, K.; Coppey-Moisan, M. (2001). "Homo-FRETMicroscopy in Living Cells to Measure Monomer-Dimer Transition of GFP-Tagged Proteins". Biophysical Journal80 (6): 3000–8.Bibcode:2001BpJ....80.3000G. doi:10.1016/S0006-3495(01)76265-0.PMC 1301483. PMID 11371472.26.Jump up ^ Bader, Arjen N.; Hofman, Erik G.; Voortman, Jarno; Van Bergen EnHenegouwen, Paul M.P.; Gerritsen, Hans C. (2009). "Homo-FRET ImagingEnables Quantification of Protein Cluster Sizes with SubcellularResolution". Biophysical Journal97 (9): 2613–22.Bibcode:2009BpJ....97.2613B. doi:10.1016/j.bpj.2009.07.059. PMC 2770629.PMID 19883605.27.Jump up ^ Gradinaru, Claudiu C.; Marushchak, Denys O.; Samim, Masood;Krull, Ulrich J. (2010). "Fluorescence anisotropy: From single molecules to live cells". The Analyst135 (3): 452–9. Bibcode:2010Ana...135..452G.doi:10.1039/b920242k. PMID 20174695.28.Jump up ^ Lakowicz, Joseph R. (1999). Principles of fluorescencespectroscopy (2nd ed.). New York, NY: Kluwer Acad./Plenum Publ. pp. 374–443. ISBN 978-0-306-46093-7.29.Jump up ^ Truong, Kevin; Ikura, Mitsuhiko (2001). "The use of FRET imagingmicroscopy to detect protein–protein interactions and proteinconformational changes in vivo". Current Opinion in Structural Biology11(5): 573–8. doi:10.1016/S0959-440X(00)00249-9. PMID 11785758.30.Jump up ^ Pollok, B; Heim, R (1999). "Using GFP in FRET-basedapplications". Trends in Cell Biology9 (2): 57–60. doi:10.1016/S0962-8924(98)01434-2. PMID 10087619.31.Jump up ^ Sekar, R. B.; Periasamy, A (2003). "Fluorescence resonance energytransfer (FRET) microscopy imaging of live cell protein localizations". The Journal of Cell Biology160 (5): 629–33. doi:10.1083/jcb.200210140.PMC 2173363. PMID 12615908.32.Jump up ^ Ni, Qiang; Zhang, Jin (2010). "Dynamic Visualization of CellularSignaling". In Endo, Isao; Nagamune, Teruyuki. Nano/Micro Biotechnology.Advances in Biochemical Engineering/Biotechnology, Volume 119. Springer.pp. 79–97. Bibcode:2010nmb..book...79N. doi:10.1007/10_2008_48.ISBN 978-3-642-14946-7. PMID 19499207.33.Jump up ^ Silvius, John R.; Nabi, Ivan Robert (2006). "Fluorescence-quenching and resonance energy transfer studies of lipid microdomains in model and biological membranes (Review)". Molecular Membrane Biology23(1): 5–16. doi:10.1080/09687860500473002. PMID 16611577.34.Jump up ^ S. A., Hussain et al. (2015). "Fluorescence Resonance EnergyTransfer (FRET) sensor" (PDF). J. Spectrosc. Dyn.5 (7): 1–16.35.Jump up ^ Hu, Chang-Deng; Chinenov, Yurii; Kerppola, Tom K. (2002)."Visualization of Interactions among bZIP and Rel Family Proteins in Living Cells Using Bimolecular Fluorescence Complementation". Molecular Cell9(4): 789–98. doi:10.1016/S1097-2765(02)00496-3. PMID 11983170。

光纤荧光测温发展现状光纤荧光测温(Fiber Optic Fluorescence Thermometry)是一种基于光纤传感技术的温度测量技术。
它利用光纤传输的特性和荧光材料之间的温度敏感性相结合,实现对温度的高精度测量。
随着科技的不断发展和应用领域的需求增加,光纤荧光测温技术得到了广泛的关注和应用。
光纤荧光测温技术的发展可以追溯到上世纪80年代末期。
当时,由于光纤传感技术的快速发展,人们开始探索利用光纤传感技术进行温度测量的可能性。
光纤荧光测温技术以其高精度、高稳定性和无电磁干扰等优势,迅速成为温度测量的重要手段。
光纤荧光测温技术的关键在于荧光材料的选择和设计。
荧光材料是光纤荧光测温技术的核心部件,其温度敏感性决定了测温的精度和可靠性。
目前常用的荧光材料有硅藻土、染料和荧光纳米颗粒等。
其中,硅藻土是一种具有优异的温度敏感性和良好的热稳定性的材料,被广泛应用于光纤荧光测温技术中。
光纤荧光测温技术在很多领域都得到了广泛的应用。
首先,在工业领域中,光纤荧光测温技术可以实现对高温、特殊环境和瞬时温度变化的实时测量,帮助工程师提高生产效率和确保生产安全。
其次,在医疗领域中,光纤荧光测温技术可以用于监测人体温度的变化,帮助医生及时发现并处理患者的异常情况。
此外,光纤荧光测温技术还可以应用于环境监测、能源领域和科学研究等方面。
随着科技的不断进步,光纤荧光测温技术也在不断演进和创新。
近年来,研究人员通过引入纳米材料和新型荧光材料,进一步提高了光纤荧光测温技术的灵敏度和精度。
另外,基于光纤传感网络的发展,光纤荧光测温技术在大规模监测和实时温度监控方面也取得了显著的进展。
综上所述,光纤荧光测温技术在温度测量领域具有广阔的应用前景。
随着技术的不断创新和应用需求的增加,光纤荧光测温技术将进一步发展。
相信在不久的将来,光纤荧光测温技术将成为温度测量领域的重要手段,为各行各业提供更加精准、可靠的温度测量解决方案。

氧化石墨烯荧光传感技术在分子诊断领域的应用郭爽;张国军;姚群峰【摘要】Graphene oxide-based fluorescent sensing technology is developing rapidly, which has been used to detect nucleic acids, proteins, and small bio-molecules. This method has many outstanding advantages such as low consumption, simple and quick. Also, it could provide accurate, real-time and multiplexed analysis results. Therefore, it shows wide application and development prospects in molecular diagnostics. In this paper, we summarized the principle of fluorescent biosensors based on graphene oxide as well as their research progress and the future perspectives in the filed of molecular diagnostics.%氧化石墨烯荧光生物传感技术发展迅速,已成功实现了对核酸、蛋白质以及其他生物小分子的检测。
该分析方法操作简单,实验成本低,可提供准确、实时及多通道的结果,在分子诊断领域显示出了广阔的发展和应用前景。
本文综述了氧化石墨烯荧光传感技术的基本检测原理以及在分子诊断领域的研究应用进展。
【期刊名称】《分子诊断与治疗杂志》【年(卷),期】2014(000)001【总页数】5页(P52-56)【关键词】氧化石墨烯;荧光;传感;分子诊断【作者】郭爽;张国军;姚群峰【作者单位】湖北中医药大学检验学院,湖北,武汉430065;湖北中医药大学检验学院,湖北,武汉430065;湖北中医药大学检验学院,湖北,武汉430065【正文语种】中文以核酸和蛋白质等生物大分子为检测对象的分子诊断技术在感染性疾病、遗传性疾病、肿瘤的诊断治疗及个体化医疗等领域正发挥越来越重要的作用。

高二英语生物分类单选题50题1. Which of the following belongs to the phylum Arthropoda?A. EarthwormB. StarfishC. ButterflyD. Sponge答案:C。
解析:节肢动物门(Arthropoda)的典型特征包括具有分节的附肢等。
蝴蝶(Butterfly)属于节肢动物门。
蚯蚓(Earthworm)属于环节动物门 Annelida)。
海星 Starfish)属于棘皮动物门Echinodermata)。
海绵 Sponge)属于多孔动物门 Porifera)。
2. The organism which is classified in the class Mammalia should have the following feature:A. Gills for breathingB. Feathers on the bodyC. Hair or fur and produce milk to feed their youngD. Scales on the body答案:C。
解析:哺乳纲(Mammalia)的生物具有毛发或皮毛并且能够产奶哺育幼崽。
用鳃呼吸(Gills for breathing)是鱼类等水生生物的特征,它们属于鱼纲等,不属于哺乳纲。
身上有羽毛(Feathers on the body)是鸟类的特征,鸟类属于鸟纲(Aves)。
身上有鳞片(Scales on the body)是爬行动物等的特征,爬行动物属于爬行纲(Reptilia)。
3. Which kingdom does the mushroom belong to?A. AnimaliaB. PlantaeC. FungiD. Protista答案:C。
解析:蘑菇属于真菌界(Fungi)。
动物界(Animalia)的生物具有能运动、异养等特点。

第42卷㊀第11期2021年11月发㊀光㊀学㊀报CHINESE JOURNAL OF LUMINESCENCEVol.42No.11Nov.,2021文章编号:1000-7032(2021)11-1763-11㊀㊀收稿日期:2021-07-05;修订日期:2021-07-20㊀㊀基金项目:广西重点科研项目(2016GXNSFDA380026)资助Supported by Key Scientific Research Projects in Guangxi(2016GXNSFDA380026)Ce 3+掺杂对NaYF 4ʒYb 3+,Tm 3+纳米粒子上转换发光性能的影响及其荧光温度特性应用蒙铭周,张㊀瑞,法信蒙,杨江华,欧㊀俊∗(桂林理工大学材料科学与工程学院,广西有色金属及特色材料加工重点实验室,广西桂林㊀541004)摘要:采用溶剂热法制备了一系列不同Ce 3+含量的Yb 3+/Tm 3+/Ce 3+共掺NaYF 4纳米粒子㊂样品在980nm激光激发下,可以观察到强烈的上转换蓝色荧光㊂探究了不同Ce 3+含量对发光强度的影响,发现在Ce 3+含量从0%增加到0.5%的过程中,紫外到可见的上转换发光随着Ce 3+浓度的增加先增强后减弱,在0.2%时荧光达到最强,比不掺Ce 3+时荧光增强高达5倍左右,其中475nm 的蓝光更是增强了6倍㊂此外,对其机理进行了深入细致的探究,一方面,掺杂Ce 3+后,Tm 3+中的(3F 3,3H 4)与Ce 3+中的(2F 7/2,2F 5/2)发生交叉弛豫,有效地防止了电子跃迁回到基态,以致整体荧光明显增强;另一方面,当掺入Ce 3+后,形成的(Yb 3+-Yb 3+-Ce 3+)Trimers 把能量传递给1G 4能级,发出475nm 的蓝光,导致蓝光很强㊂将其应用于荧光强度比测温,绝对灵敏度高达0.0350K -1㊂关㊀键㊀词:Ce 3+掺杂;上转换发光;强蓝光;(Yb 3+-Yb 3+-Ce 3+)Trimers;荧光强度比测温中图分类号:O482.31㊀㊀㊀文献标识码:A㊀㊀㊀DOI :10.37188/CJL.20210227Effect of Ce 3+Doping on Upconversion Luminescence of NaYF 4ʒYb 3+,Tm 3+Nanoparticles and Application of Fluorescence Temperature CharacteristicsMENG Ming-zhou,ZHANG Rui,FA Xin-meng,YANG Jiang-hua,OU Jun ∗(Guangxi Key Laboratory of Nonferrous Metals and Special Materials Processing ,College of Material Science and Engineering ,Guilin University of Technology ,Guilin 541004,China )∗Corresponding Author ,E-mail :gloujun @Abstract :A series of Yb 3+/Tm 3+/Ce 3+co-doped NaYF 4nanoparticles with different Ce 3+contents were produced by solvothermal method.Strong upconversion blue fluorescence can be observed un-der 980nm laser excitation.The influence of different Ce 3+content on the luminescence intensity was investigated.It was found that the upconversion luminescence from UV to visible enhanced firstlyand then weakened with the increase of Ce 3+concentration when the mole fraction of Ce 3+increased from 0%to 0.5%.The fluorescence intensity reached the maximum at 0.2%,which was about 5times stronger than that without Ce 3+doping,and the blue light at 475nm was enhanced by 6times.In addition,the mechanism was explored in detail.On the one hand,the cross relaxation be-tween(3F 3,3H 4)in Tm 3+and (2F 7/2,2F 5/2)in Ce 3+occured after doping Ce 3+,which effectivelyprevented the electron transition from going back to the ground state,resulting in the overall fluores-cence enhancement.On the other hand,the (Yb 3+-Yb 3+-Ce 3+)Trimers formed by doping Ce 3+transfered energy to 1G 4level and emitted 475nm blue light,which led to strong blue light.When it1764㊀发㊀㊀光㊀㊀学㊀㊀报第42卷was applied to the fluorescence intensity ratio thermometry measurement,the absolute sensitivity wasas high as0.0350K-1.Key words:Ce3+doped;upconversion luminescence;strong blue light;(Yb3+-Yb3+-Ce3+)Trimers;fluorescence intensity ratio thermometry1㊀引㊀㊀言上转换发光是指当一束长波长的光激发时,物质会转换发出短波长的光,这是一种反斯托克斯发光现象,即把能量低的光子转换成能量高的光子[1-3]㊂它独特的发光特性在生物荧光成像㊁医疗㊁能源等多方面得到了广泛应用[4-6]㊂目前, 980nm红外激光器比较高效且价格低廉,可为上转换纳米材料发光提供稳定可靠的激励能量,因此上转换发光材料的应用前景显得越来越重要㊂在许多镧系基质中,氟化物具备声子能量低㊁稳定性好以及透光率高等优势[7],NaYF4声子能量只有360cm-1,因此NaYF4成为最理想的基质材料[8-9]㊂Tm3+作为目前发光效率较高的稀土元素,成为纳米晶理想的激活剂㊂Yb3+与980nm 激发光能量匹配,为激活剂提供能量传递作用,可作为纳米晶理想的敏化剂㊂因此,NaYF4ʒYb3+, Tm3+是目前较为理想的上转换纳米晶[10-12]㊂但目前稀土上转换发光效率依然非常低,为了解决这一问题,进一步增强纳米粒子发光强度,使NaYF4ʒYb3+,Tm3+更好地满足日益旺盛的社会需求,人们往往只是通过控制纳米粒子的大小[13]㊁改变掺杂离子的百分比等方式提高发光效率,但其有一定的局限性㊂然而,近年来,王元生课题组把Ca2+掺入NaGdF4ʒYb3+,Er3+上转换纳米粒子中,发现发光强度比不掺Ca2+时大幅度提高[6,8-9,13-15]㊂显然,通过掺杂异质离子可以明显提高上转换发光效率,是一种非常可行且有效的方法[16-18]㊂Ce3+掺杂引起了研究人员的广泛关注㊂李英杰课题组发现Ce3+提高了CaO表面电子的电导率,增加了CO2捕集,促使水煤气变换和蒸汽甲烷重整反应[19]㊂杨振东课题组发现与纯Zn-CO2O4相比,Ce3+掺杂的ZnCO2O4纳米球具有较高的过氧化物酶样活性和较弱的氧化酶样活性[20]㊂Jacobsohn课题组通过沉淀法制备了Ce3+掺杂的六方相BiPO4,观察到Ce3+与宿主之间的强相互作用,Ce3+的掺入导致在约445nm(2.79 eV)和490nm(2.53eV)处产生两个部分重叠的带[21]㊂这些结果使人们对Ce3+掺杂材料内在和外在特性的认识得到了增强㊂目前,Ce3+的掺杂很大程度上促进了材料本身的性能,因此把Ce3+掺杂到NaYF4ʒYb3+,Tm3+纳米粒子中是提高其各方面性能的可行方法㊂本文通过溶剂热法制备出Ce3+掺杂的NaYF4ʒYb3+,Tm3+纳米粒子,并调控Ce3+的浓度,有效地使更多电子布居在3H4能级,防止电子跃迁回到基态,从而使更多电子向更高能级跃迁㊂尽管稀土上转换纳米粒子中发光离子在980nm处吸收截面小㊁上转换量子效率低[22],但通过掺杂Ce3+,即不需要高功率激光激发也可发出明亮的荧光㊂结果表明,Ce3+的掺杂可以明显提高其发光性能,并在475nm出现强烈的蓝光,且寿命长㊂通过光谱分析,结合稀土元素的能级结构,对Ce3+掺杂NaYF4ʒYb3+,Tm3+上转换荧光增强的机理进行了详尽的讨论㊂近年来,基于稀土上转换发光的光学温度传感引起了国内外的广泛关注㊂传统以氧化物为基质的测温材料,不仅上转换效率低,而且测温灵敏度也低,无法满足目前的社会需求,因此急需研究一种快捷㊁灵敏的测温技术㊂通过荧光强度比(FIR)测温提供了一种新型的非接触式测温方法,该方法只与材料本身荧光特性有关,因此可以有效地避免传统测温方法对测温环境的依赖㊂另外,稀土元素拥有丰富的能级结构,能够更好地满足现代生产生活对测温的需求㊂本文将合成的高荧光强度NaYF4ʒYb3+, Tm3+,Ce3+纳米粒子应用于灵敏的测温技术,其最大绝对灵敏度高达0.0350K-1㊂2㊀实㊀㊀验2.1㊀试剂与仪器氯化钇(YCl3㊃6H2O)㊁氯化镱(YbCl3㊃6H2O)㊁氯化铥(TmCl3㊃6H2O)㊁氯化铈(CeCl3㊃7H2O)㊁油酸(OA)㊁一-十八烯(ODE),均为分析㊀第11期㊀㊀蒙铭周,等:Ce3+掺杂对NaYF4ʒYb3+,Tm3+纳米粒子上转换发光性能的影响及其荧光温度特性应用1765㊀纯(AR),阿拉丁化学试剂有限公司;氢氧化钠(NaOH)㊁氟化铵(NH4F)㊁无水甲醇㊁无水乙醇㊁环己烷,均为分析纯(AR),西陇化工股份有限公司;高纯氩气(99.999%),桂林弘润气体㊂通过X射线粉末衍射仪(X Pert-pro,荷兰帕纳科计分析仪器公司)表征上转换发光纳米粒子的晶相结构;场发射透射电子显微镜(TEM)(JSF 2100F,日本高新技术公司/英国牛津)表征纳米粒子的形貌;粒度与Zeta电位分析仪(ZEN3600,英国马尔文公司)表征粒径大小;VARIAN荧光分光光度仪(美国安捷伦公司)表征纳米子的荧光强度;QuantaMater8000瞬态稳态荧光光谱仪(美国HORIBA公司)表征荧光寿命和变温荧光㊂2.2㊀样品制备将含YCl3㊃6H2O㊁YbCl3㊃6H2O㊁TmCl3㊃6H2O㊁CeCl3㊃7H2O不同比例㊁总稀土离子含量为0.5mmol的水溶液(1mL)加入到50mL烧瓶中,在磁力搅拌器的作用下,搅拌蒸发溶液中的水分;待水分完全蒸发后,先后加入3.75mL油酸(OA)和7.5mL1-十八烯(ODE),并在氩气保护下使混合物加热至120ħ,保持30min,以除去OA和ODE中的水分㊂升高体系的温度到160ħ,反应60min后自然冷却到室温㊂在剧烈搅拌下,逐滴加入5mL含1.25mmol NaOH和2mmol NH4F 的甲醇溶液,并在室温下剧烈搅拌30min;随后在通入保护气的条件下升高体系温度到100ħ,除去反应混合液中的甲醇溶液㊂最后,待甲醇除干净后,在氩气保护下将温度迅速升温至300ħ,且保持90min,反应结束后停止加热㊂待反应体系自然冷却到室温后,用过量的无水乙醇沉淀产物,并用无水乙醇㊁环己烷的混合溶液对产物进行多次洗涤㊂最后将反应产物在常温下真空干燥24 h,即得到β-NaYF4ʒYb3+,Tm3+,Ce3+纳米粒子㊂3㊀结果与讨论3.1㊀结构表征掺杂不同Ce3+含量的NaYF4ʒ18%Yb3+, 0.5%Tm3+纳米粒子样品经过干燥后,对其进行X射线衍射(XRD)表征,通过表征图(图1(a))可以看出所有样品的衍射位置很好地对应标准JDPDS卡片No.28-1192中的各个衍射峰位置㊂在基质NaYF4中掺入Ce3+,既不会产生任何NaYF4新峰,也不会破坏任何现有的NaYF4衍射峰,这证明得到的是纯β相的NaYF4㊂图1㊀(a)Ce3+掺杂(0.1%/0.2%/0.3%/0.4%/0.5%)NaYF4ʒ18%Yb3+,0.5%Tm3+(Ⅱ㊁Ⅲ㊁Ⅳ㊁Ⅴ㊁Ⅵ)和无Ce3+掺杂NaYF4ʒ18%Yb3+,0.5%Tm3+(Ⅰ)纳米粒子的XRD图,(100)㊁(110)㊁(101)㊁(201)㊁(211)晶面对应衍射峰在图中标注;(b)放大不同Ce3+浓度的纳米粒子(201)晶面的XRD图谱㊂Fig.1㊀(a)XRD patterns of Ce3+-doped(0.1%/0.2%/0.3%/0.4%/0.5%)NaYF4ʒ18%Yb3+,0.5%Tm3+(Ⅱ,Ⅲ,Ⅳ,Ⅴ,Ⅵ)and Ce3+-free NaYF4ʒ18%Yb3+,0.5%Tm3+(Ⅰ)nanoparticles,the corresponding diffraction peaks of (100),(110),(101),(201),(211)crystal planes are indicated.(b)X-ray diffraction patterns of(201)nanoparti-cle with different Ce3+concentration.为了更深入验证Ce3+是否成功掺入β-NaYF4ʒYb3+,Tm3+纳米粒子的基质晶格中,我们选取(201)晶面对应的衍射角进行局部放大,如图1(b)所示㊂根据布拉格方程2d sinθ=kλ[23],其中d为晶面间距,θ为衍射角,k为正整数,λ为X射线的波长㊂掺杂Ce3+后,(201)晶面对应的衍射角向小角度偏移,即衍射角θ比不掺Ce3+的要小,而k和λ不变,因此d值变大,这说明晶格1766㊀发㊀㊀光㊀㊀学㊀㊀报第42卷发生膨胀㊂由于Ce3+的半径(102pm)大于Y3+的半径(90pm),因此进一步证明了纳米粒子(201)晶面间距变大是由于Ce3+(10个配位数)被成功掺进基质晶格中取代了Y3+(8个配位数)的位置㊂一个Ce3+的掺入会引起两个空位的形成,进而导致晶格收缩,使得发光中心Tm3+附近晶体场的对称性遭到破坏,提高了宇称禁阻4f-4f 的跃迁几率[24-25],使得上转换发光明显增强㊂此外,Ce3+的半径(102pm)大于Tm3+的半径(88pm),当掺入的离子比发光中心离子大时, Yb3+与Ce3+距离更近,促使Yb3+与Ce3+能级结合形成新的能级,把能量传递给Tm3+激发态1G4,发出475nm的蓝色荧光,增强了蓝光强度㊂3.2㊀形貌表征图2(a)是NaYF4ʒ18%Yb3+,0.5%Tm3+, 0.2%Ce3+样品的透射电镜图,可以看出纳米粒子排列有序㊁尺寸分布均匀,无团聚现象,形貌近似呈六方结构㊂其他掺杂比例的样品大小和均匀情况与之类似㊂NaYF4的高分辨TEM图像(图2(b))图2㊀(a)NaYF4ʒ18%Yb3+,0.5%Tm3+,0.2%Ce3+LR-TEM;(b)HR-TEM;(c)DLS图㊂Fig.2㊀LR-TEM(a),HR-TEM(b)and DLS(c)of NaYF4ʒ18%Yb3+,0.5%Tm3+,0.2%Ce3+.显示其晶面间距为0.28nm,对应NaYF4的(110)晶面,表明合成的纳米粒子结晶性良好㊂粒度与Zeta电位分析仪表征的NaYF4纳米粒子样品的粒径分布如图2(c)所示,可以看出样品的水合动力学直径d=(29.5ʃ1.46)nm,粒径较小㊂根据Debye-Scheller公式[26],d=KλB M cosθ, NaYF4纳米颗粒的粒径可由XRD最强衍射峰的半峰宽计算,其中K=0.89为Scherrer常数,λ= 0.154056nm为Cu Kα射线的波长,B M是衍射峰的半峰宽,θ是最大衍射峰对应的布拉格角㊂由此估算出平均晶体尺寸为28~32nm,进一步表明与粒径分析仪测得的粒径一致㊂图3是上转换纳米粒子的TEM能谱图,从图中清晰地看出F㊁Y㊁Yb㊁Tm㊁Ce各掺杂元素的面扫描分布,可知各元素分布都很均匀,这再次表明成功合成了Ce3+掺杂NaYF4ʒYb3+,Tm3+上转换纳米粒子㊂图3㊀NaYF4ʒ18%Yb3+,0.5%Tm3+,0.2%Ce3+的TEM 及其面扫描图Fig.3㊀NaYF4ʒ18%Yb3+,0.5%Tm3+,0.2%Ce3+TEM and its surface scan3.3㊀荧光光谱分析在980nm近红外光激发下测定了NaYF4ʒ18%Yb3+,0.5%Tm3+,x%Ce3+的荧光光谱,从图4中可以看出合成的纳米粒子发射出强烈的蓝光和紫外光,发射峰主要集中在362,451,475, 646,700nm附近,分别对应1D2ң3H6㊁1D2ң3F4㊁1G4ң3H6㊁1G4ң3F4和3F3ң3H6㊂为了实现多光子上转换发射,我们根据文献[27]报道的18% Yb3+和0.5%Tm3+的比例合成该纳米粒子,另外通过掺杂不同含量的Ce3+发现荧光强度明显增强㊂当掺入Ce3+含量由0升至0.2%时,荧光强㊀第11期㊀㊀蒙铭周,等:Ce 3+掺杂对NaYF 4ʒYb 3+,Tm 3+纳米粒子上转换发光性能的影响及其荧光温度特性应用1767㊀度随着掺入量增大而明显增强;当Ce 3+含量继续增加时,荧光强度逐渐减弱;当Ce 3+含量为0.2%时,荧光强度最强,比不掺Ce 3+增强5倍左右;特别是在可见光475nm (1G 4ң3H 6)波段出现强烈的蓝光,比不掺Ce 3+增强高达6倍左右㊂并且从图中可以看出475nm 蓝光很强,为其应用于荧光成像奠定了基础㊂图4㊀不同Ce 3+含量掺杂的NaYF 4ʒYb 3+,Tm 3+,Ce 3+(18%,0.5%,x %)(x =0.1,0.2,0.3,0.4,0.5)荧光光谱,插图为上转换荧光积分强度之和随Ce 3+掺杂浓度的变化(激光器:980nm,功率密度:7.5W /cm 2)㊂Fig.4㊀Fluorescence spectra of NaYF 4ʒYb3+,Tm3+,Ce3+(18%,0.5%,x %)(x =0.1,0.2,0.3,0.4,0.5)doped with different Ce3+content,the illustrationshows the change of the sum of upconversion fluores-cence integral intensity with Ce 3+doping concentra-tion(laser:980nm,power density:7.5W /cm 2)3.4㊀荧光寿命分析为了进一步研究掺杂Ce 3+对上转换荧光增强原理,以475nm 发射波长为例,在室温下通过980nm 激光器测量不同Ce 3+浓度的NaYF 4ʒYb 3+,Tm 3+纳米粒子的荧光寿命㊂从图5可以看出,随着Ce 3+掺杂浓度由0%增加至0.2%,发光中心Tm 3+中1G 4能级的寿命由0.72ms 增加到0.76ms;而当Ce 3+浓度继续增加时,寿命明显降低㊂根据荧光寿命公式[28]τ=1k =1k F + k i,其中k F 表示荧光发射速率的衰减常数,ki表示各种辐射过程的衰减常数㊂由于Ce 3+掺杂增加了稀土离子4f-4f 间的跃迁几率,因此使非辐射跃迁得到有效抑制,从而使ki减小,荧光寿命增加㊂这表明Ce 3+掺杂的NaYF 4ʒYb 3+,Tm 3+相对于没有Ce 3+掺杂的NaYF 4ʒYb 3+,Tm 3+纳米粒子来说,Tm 3+的1G 4能级上的电子有更大的几率发射辐射跃迁,从而产生更强的发射荧光㊂然而,当Ce 3+含量从0.2%增加到0.5%时,荧光寿命缩短,表明Ce 3+浓度猝灭,导致非辐射弛豫增加,荧光寿命缩短㊂图5㊀不同Ce 3+含量掺杂的NaYF 4ʒYb 3+,Tm 3+在475nm发射波长处的上转换荧光衰减曲线(激光器:980nm,功率密度:4W /cm 2)Fig.5㊀Upconversion fluorescence decay curves of NaYF 4ʒYb 3+,Tm 3+doped with different Ce 3+contents at475nm emission wavelength(laser:980nm,power density:4W /cm 2)目前,生物示踪㊁荧光标记㊁细胞成像等方面紧紧依靠于可见光来辨别目标部位㊂对于NaYF 4ʒYb 3+,Tm 3+纳米粒子而言,特别需要依靠475nm 处的可见光,而本课题组研制出的0.2%Ce 3+掺杂的NaYF 4ʒYb 3+,Tm 3+(18/0.5%),其发射波长在475nm 处,不仅达到荧光最强,而且荧光寿命也最长㊂3.5㊀基于荧光强度比的测温荧光峰值强度比(FIR)测温技术需满足两个条件,其一是辐射跃迁的荧光强度足够大,足以避免光学噪音对测温的影响;其二是两个能级向下跃迁的荧光强度变化趋势相反,且它们之间的能级差大约为200~2000cm -1[34-35]之间㊂我们结合图6和图7可以看出,646nm 和800nm 的荧光强度随着温度的升高逐渐降低,700nm 的荧光强度随温度的升高而增大㊂且通过计算可知,Tm 3+发光中心波长646nm 和800nm 与700nm 的能级差分别为1255cm -1和1790cm -1,均符合热耦合能级的要求㊂这表明Ce 3+㊁Tm 3+㊁Yb 3+三掺杂的NaYF 4纳米粒子可用于灵敏测温㊂1768㊀发㊀㊀光㊀㊀学㊀㊀报第42卷表1 不同样品的灵敏度对比Tab.1㊀Sensitivity comparison of different samples材料㊀㊀辐射跃迁绝对灵敏度/K -1测温范围/K参考文献NaYF 4ʒYb 3+/Tm 3+/Ce 3+1G 4ң3F 4,3F 3ң3H 60.0350300~495本文α-NaYF 4ʒYb 3+/Tm 3+@CaF 23H 4(α),3H 4(β)ң3H 60.0043313~373[29]Y 2TiO 7ʒLi +/Yb 3+/Er 3+2H 11/2,4S 3/2ң4I 15/20.0067298~673[30]NaLuF 4ʒYb 3+/Er 3+/Tm 3+4F 9/2ң4I 15/2,3F 3ң3H 60.0076300~600[31]Gd 2O 3ʒYb 3+/Ho 3+5F 4,5S 2ң5I 80.0092300~673[32]NaLuF 4ʒYb 3+/Tm 3+1D 2,1G 4ң3H 60.0047300~550[33]图6㊀NaYF 4ʒYb 3+,Tm 3+,Ce 3+纳米晶在不同温度下的荧光光谱,插图为发射波长在300~750nm 的放大荧光光谱(激光器:980nm,功率密度:4W /cm 2)㊂Fig.6㊀Fluorescence spectra of NaYF 4ʒYb 3+,Tm 3+,Ce 3+nanocrystals at different temperatures,the illustra-tion shows the fluorescence spectra with emission wavelengths ranging from 300nm to 750nm (laser:980nm,power density:4W /cm 2)㊂根据两个热耦合能级的电子从高能级向低能级跃迁辐射的荧光强度比公式[36-41]ln R =-ΔEkT+ln C ,其中R 为荧光强度比,C =ω2A 20g 2ω1A 10g 1,ΔE 为能级差对应的能量,k 为玻尔兹曼常数,T 为开尔文温度㊂将700nm 与646nm 和700nm 与800nm 两对荧光强度比的对数与温度的倒数做线性拟合得到如图8,拟合结果良好,表明合成的纳米粒子在温度传感方面具有独特优势㊂根据灵敏度的数学定义可知[42-46],S A =d Rd T=R ΔE kT ,S R =1R d R d T ʈΔE kT 2,S A 为绝对灵敏度,S R 为相对灵敏度㊂拟合曲线如图9所示,可知在室温图7㊀不同发射波长峰位荧光强度随温度的变化Fig.7㊀Variation of fluorescence intensity at different emis-sion wavelengths with temperature至200ħ的测温范围内,Ce 3+掺杂的NaYF 4ʒYb 3+,Tm 3+纳米粒子在980nm 激光器的激发下应用于FIR 测温技术得到的绝对灵敏度曲线随着温度升高而单调递增,而相对灵敏度曲线随着温度升高而单调递减㊂这说明FIR 绝对增长速率越来越快,但同时FIR 也在变大,因此FIR 的相对变化越来越小,表明该能级更适用于较低温度的测量㊂但不同荧光峰位FIR 应用于测温,灵敏度各不相同㊂值得一提的是,由图9(a)可知3F 3ң3H 6(700nm)与1G 4ң3F 4(646nm)热耦合能级对的绝对灵敏度从0.0061K -1升至0.0350K -1,最大灵敏度高达0.0350K -1,比3F 3ң3H 6(700nm)㊀第11期㊀㊀蒙铭周,等:Ce 3+掺杂对NaYF 4ʒYb 3+,Tm 3+纳米粒子上转换发光性能的影响及其荧光温度特性应用1769㊀图8㊀(a)700nm 与646nm 的荧光强度峰值比与温度的线性拟合;(b)700nm 与800nm 的荧光强度峰值比与温度的线性拟合㊂Fig.8㊀(a)Linear fitting of fluorescence intensity peak ratio at 700nm and 646nm with temperature.(b)Linear fitting of the ra-tio of peak fluorescence intensity at 700nm to 800nm withtemperature.图9㊀(a)FIR 测温的绝对灵敏度曲线;(b)FIR 测温的相对灵敏度曲线㊂Fig.9㊀(a)Absolute sensitivity curve of FIR temperature measurement.(b)Relative sensitivity curve of FIR temperature meas-urement.与3H 4ң3H 6(800nm)能级对的绝对灵敏度高两个数量级,进一步说明700nm 与646nm 热耦合能级对更有应用优势㊂主要原因是Ce 3+掺杂的NaYF 4ʒYb 3+,Tm 3+纳米粒子非辐射跃迁减少,导致上能级与下能级粒子数之比增大,从而使得向下辐射的上转换荧光强度比增大,这不仅可以带来更大的测温灵敏度,还能带来更好的测试分辨率㊂在现代生产生活中,测温具有很大的应用前景㊂3.6㊀机理分析3.6.1㊀多光子发射机理分析在980nm 低功率激光器激发下,可以清晰地看出Ce 3+掺杂的NaYF 4ʒYb 3+,Tm 3+纳米粒子发出明亮的上转换发光㊂但这种发光不仅仅可以通过直观的可见光发光证实,更重要的是,可以通过相关的功率依赖关系证明这种上转换发光是一种非线性多光子发光过程㊂根据发光强度(I UC )与980nm 激光功率密度(P NIR )的关系可知,I UC ɖP n NIR[47],即I UC 与P NIR 的n 次方成正比,其中n 代表的是上转换UC 发光过程发射一个光子需要吸收980nm 近红外光的光子数㊂1I 6ң3H 6㊁1D 2ң3H 6㊁1D 2ң3F 4㊁1G 4ң3H 6和1G 4ң3F 4的荧光强度与功率密度依赖关系如图10所示㊂通过线性拟合结果可知,1I 6ң3H 6能级跃迁的n 值为4.39,表明该能级为五光子吸收过程;1D 2ң3H 6㊁1D 2ң3F 4能级跃迁n 值分别为3.72和3.14,表明该能级为四子吸收过程;1G 4ң3H 6能级跃迁的n 值为2.82,表明该能级为三光子吸收过程;1G 4ң3F 4能级跃迁的n 值为1.83,表明该能级为双光子吸收过程㊂这些跃迁过程涉及多光子吸收均与Yb 3+ңTm 3+能量传递涉及的多光子数目相同㊂NaYF 4ʒYb 3+,Tm 3+,Ce 3+纳米粒子中,NaYF 4作为基质,Yb 3+作为敏化剂,Tm 3+作为激活剂㊂1770㊀发㊀㊀光㊀㊀学㊀㊀报第42卷图10㊀在980nm 激发下,NaYF 4ʒYb3+,Tm3+,Ce3+的上转换发射强度与激发光功率密度的双对数关系㊂Fig.10㊀Double logarithm relationship between upconversionemission intensity and excitation light power density of NaYF 4ʒYb 3+,Tm 3+,Ce 3+excited at 980nm图11㊀(a)980nm 激光激发下的NaYF 4ʒYb 3+,Tm 3+,Ce 3+纳米粒子上转换发射原理图;(b)纳米粒子的能量转移机制示意图㊂Fig.11㊀(a)NaYF 4ʒYb 3+,Tm 3+,Ce 3+nanoparticle upcon-version emission principle diagram under 980nm la-ser excitation.(b)Schematic diagram of the energytransfer mechanism of nanoparticles.980nm 激光与Yb 3+中2F 7/2与2F 5/2的能级差能量吻合,在980nm 激光的激发下,Yb 3+粒子吸收激光能量后,从基态2F 7/2能级跃迁到激发态2F 5/2能级,由于激发态不稳定,很容易跃迁回到基态2F 7/2,在该过程能量以光子的形式释放出去,释放出去的能量传递给Tm 3+,使得Tm 3+中产生3H 6ң3H 5㊁3F 4ң3F 3㊁3H 4ң1G 4㊁1G 4ң1D 2和1D 2ң3P 2能级跃迁[48]㊂在传统方法不掺入Ce 3+时,发光中心Tm 3+绝大多数电子吸收两个光子跃迁到3F 3后以光子的形式辐射回到基态,只有少数电子继续往上跃迁㊂当掺入Ce 3+后,Tm 3+中(3F 3,3H 4)与Ce 3+中(2F 2/7,2F 2/5)发生交叉弛豫㊂从图11我们可以看出,交叉弛豫过程(3F 3,3H 4)ң(2F 2/7,2F 2/5),使更多的电子布居在3H 4能级中,有效地防止了电子跃迁回到基态,从而使更多的电子向更高的能级跃迁,使得三光子㊁四光子㊁五光子跃迁几率大大增加㊂进一步说,由于发光中心Tm 3+-Tm 3+容易发生交叉弛豫,产生非辐射跃迁,导致荧光降低[49]㊂Ce 3+的掺入既减少了Tm 3+之间的交叉弛豫,又能有效地增加辐射跃迁㊂当Ce 3+含量大于0.2%时,Ce 3+的掺入量较大,过量的Ce 3+阻断了敏化剂离子把能量传递给激活剂离子的过程,造成Tm 3+不能很好地与Yb 3+配位,使得Yb 3+吸收980nm 红外光后不能有效地传递给Tm 3+,从而导致发光效率低㊂然而,当掺杂量为0.2%时,Ce 3+的掺入恰好与Tm 3+匹配,没有多余的Ce 3+,也不会因为掺杂量过多导致Ce 3+没有完全进入晶格而形成的杂质㊂因此,Ce 3+掺杂量为0.2%时,结晶度最好㊂且结合图4不同Ce 3+含量掺杂的荧光光谱可以看到,Ce 3+掺杂量为0.2%时,发光效率最高㊂3.6.2㊀强蓝光机理分析结合图4,我们可以看出NaYF 4ʒ18%Yb 3+,0.5%Tm 3+,0.2%Ce 3+中1G 4ң3H 6(475nm)对应的峰非常尖锐㊂从图12原理图可以看出,这是由于掺入稀土Ce 3+后,在980nm 激光的激发下,Yb 3+中4f 层中的电子吸收能量后,由2F 7/2基态跃迁到2F 5/2激发态,Ce 3+中4f 层的电子吸收能量后,由2F 5/2跃迁到2F 7/2㊂两个同处激发态且距离相近的Yb 3+合作跃迁形成(Yb 3+-Yb 3+)dimers [50-52],再与处于激发态的Ce 3+形成(Yb 3+-Yb 3+-Ce 3+)Trimers㊂两个Yb 3+能级差约为20800cm -1,一个Ce 3+能级差约为2257cm -1,即(Yb 3+-Yb 3+-Ce 3+)Trimers 能级差约为23057cm -1[53],而一个Tm 3+激发态1G 4与基态的能级差为21172cm -1㊂由于(Yb 3+-Yb 3+-Ce 3+)Trimers 能级与Tm 3+的1G 4㊀第11期㊀㊀蒙铭周,等:Ce3+掺杂对NaYF4ʒYb3+,Tm3+纳米粒子上转换发光性能的影响及其荧光温度特性应用1771㊀能级非常匹配,因此(Yb3+-Yb3+-Ce3+)Trimers把能量传递给Tm3+,基态3H6吸收该能量后跃迁到激发态1G4,由于1G4能级非常不稳定,很容易往低能级跃迁回到基态(1G4ң3H6)发出相应的荧光,该荧光刚好对应荧光光谱中475nm波段的蓝光,从而使得蓝光大大增强㊂图12㊀980nm激光激发下的上转换纳米粒子发射强蓝光(475nm)机理示意图Fig.12㊀Mechanism of strong blue light(475nm)emitted by upconversion nanoparticles excited by980nm laser 4㊀结㊀㊀论本文采用溶剂热法制备出高荧光强度㊁长寿命蓝光发射的NaYF4ʒYb3+,Tm3+,Ce3+上转换纳米粒子㊂通过TEM和XRD对其形貌和结晶度进行分析,结果表明我们制备的纳米粒子呈六方相结构,分布均匀且结晶度良好㊂通过瞬态稳态荧光光谱仪对其荧光寿命进行分析,结果表明当Ce3+含量为0.2%时,475nm可见光对应的荧光寿命最长㊂在探究不同Ce3+百分比对荧光的影响时,通过荧光分光光度计对其表征分析,结果表明,掺杂Ce3+比不掺时荧光强度明显增大,当Ce3+含量为0.2%时,荧光最强,比不掺Ce3+增强了5倍左右㊂我们对此进行了机理分析,一方面,掺杂Ce3+后,Tm3+中(3F3,3H4)与Ce3+中(2F7/2,2F5/2)发生交叉弛豫,使更多电子布居在3H4能级中,有效地防止了电子跃迁回到基态,以致整体荧光明显增强;另一方面,当掺入Ce3+后,(Yb3+-Yb3+)dimers 会与Ce3+形成(Yb3+-Yb3+-Ce3+)Trimers,它与激活剂Tm3+的激发态1G4能级非常匹配,吸收能量后跃迁回到基态,发出475nm的蓝光,导致蓝色荧光增强㊂通过FIR测温的对比分析可知,700nm (3F3ң3H6)与646nm(1G4ң3F4)热耦合能级对的绝对灵敏度高达0.0350K-1㊂综上所述,我们制备出的上转换纳米粒子在测温以及生物成像领域均具有很大的应用价值㊂本文专家审稿意见及作者回复内容的下载地址: /thesisDetails#10.37188/ CJL.20210227.参㊀考㊀文㊀献:[1]AUZEL F.Upconversion and anti-stokes processes with f and d ions in solids[J].Chem.Rev.,2004,104(1):139-174.[2]DONG H,SUN L D,YAN C H.Energy transfer in lanthanide upconversion studies for extended optical applications[J].Chem.Soc.Rev.,2015,44(6):1608-1634.[3]WU M,YAN L,WANG T,et al.Controlling red color-based multicolor upconversion through selective photon blocking[J].Adv.Funct.Mater.,2019,29(25):1804160-1-11.[4]OU J,ZHENG W H,XIAO Z Y,et al.Core-shell materials bearing iron(Ⅱ)carbonyl units and their CO-release via anupconversion process[J].J.Mater.Chem.B,2017,5(41):8161-8168.[5]WANG Y,GAI S L,NIU N,et al.Synthesis of NaYF4microcrystals with different morphologies and enhanced up-conver-sion luminescence properties[J].Phys.Chem.Chem.Phys.,2013,15(39):16795-16805.[6]LEI L,CHEN D Q,XU J,et al.Highly intensified upconversion luminescence of Ca2+-doped Yb/ErʒNaGdF4nanocrystalsprepared by a solvothermal route[J]n J.,2014,9(3):728-733.[7]SUYVER J F,GRIMM J,KRAMER K W,et al.Highly efficient near-infrared to visible up-conversion process in NaYF4ʒEr3+,Yb3+[J].J.Lumin.,2005,114(1):53-59.[8]WANG F,LIU X G.Recent advances in the chemistry of lanthanide-doped upconversion nanocrystals[J].Chem.Soc.Rev.,2009,38(4):976-989.[9]YI G S,CHOW G M.Water-soluble NaYF4ʒYb,Er(Tm)/NaYF4/polymer core/shell/shell nanoparticles with significantenhancement of upconversion fluorescence[J].Chem.Mater.,2007,19(3):341-343.[10]SHEN J,SUN L D,YAN C H.Luminescent rare earth nanomaterials for bioprobe applications[J].Dalton Trans.,2008,1772㊀发㊀㊀光㊀㊀学㊀㊀报第42卷(42):5687-5697.[11]WANG L Y,LI Y D.Green upconversion nanocrystals for DNA detection[J]mun.,2006,(24):2557-2559.[12]HU H,XIONG L Q,ZHOU J,et al.Multimodal-luminescence core-shell nanocomposites for targeted imaging of tumor cells[J].Chem.Eur.J.,2009,15(14):3577-3584.[13]WANG F,LIU X G.Upconversion multicolor fine-tuning:visible to near-infrared emission from lanthanide-doped NaYF4nanoparticles[J].J.Am.Chem.Soc.,2008,130(17):5642-5643.[14]ZHAO Q,SHAO B Q,LÜW,et al.Doping alkaline-earth:a strategy of stabilizing hexagonal GdF3at room temperature[J].Dalton Trans.,2013,42(43):15482-15488.[15]LEI L,CHEN D Q,HUANG P,et al.Modifying the size and uniformity of upconversion Yb/ErʒNaGdF4nanocrystalsthrough alkaline-earth doping[J].Nanoscale,2013,5(22):11298-11305.[16]WANG M,MI C C,WANG W X,et al.Immunolabeling and NIR-excited fluorescent imaging of hela cells by using NaYF4ʒYb,Er upconversion nanoparticles[J].ACS Nano,2009,3(6):1580-1586.[17]HAASE M,SCHÄFER H.Upconverting nanoparticles[J].Angew.Chem.Int.Ed.,2011,50(26):5808-5829.[18]WANG F,HAN Y,LIM C S,et al.Simultaneous phase and size control of upconversion nanocrystals through lanthanide do-ping[J].Nature,2010,463(7284):1061-1065.[19]YAN X Y,LI Y J,SUN C Y,et al.Hydrogen production from absorption-enhanced steam gasification of Enteromorpha pro-lifera and its char using Ce-doped CaO material[J].Fuel,2021,287:119554-1-12.[20]YIN D X,YANG H,WANG S,et al.Ce-doped ZnCo2O4nanospheres:synthesis,double enzyme-like performances,catalytic mech-anism and fast colorimetric determination for glutathione[J].Colloids Surf.A Physicochem.Eng.Aspects,2020,607:125466.[21]PAN L,KOEHLER K,JACOBSOHN L G.Luminescence of undoped and Ce-doped hexagonal BiPO4[J].J.Lumin.,2020,228:117626.[22]ZHOU J,LIU Q,FENG W,et al.Upconversion luminescent materials:advances and applications[J].Chem.Rev.,2015,115(1):395-465.[23]杨南如.无机非金属材料测试方法[M].武汉:武汉工业大学出版社,1990.YANG N R.Testing Methods of Inorganic Nonmetallic Materials[M].Wuhan:Wuhan University of Technology Press, 1990.(in Chinese)[24]JUDD B R.Optical absorption intensities of rare-earth ions[J].Phys.Rev.,1962,127(3):750-761.[25]PATRA A,FRIEND C S,KAPOOR R,et al.Effect of crystal nature on upconversion luminescence in Er3+ʒZrO2nanocrys-tals[J].Appl.Phys.Lett.,2003,83(2):284-286.[26]WARREN B E.X-ray Diffraction[M].New York:Dover Publications Inc.Press,1990.[27]ZHANG X,TIAN G,YIN W Y,et al.Controllable generation of nitric oxide by near-infrared-sensitized upconversion nano-particles for tumor therapy[J].Adv.Funct.Mater.,2015,25(20):3049-3056.[28]房喻,王辉.荧光寿命测定的现代方法与应用[J].化学通报,2001,64(10):631-636.FANG Y,WANG H.Fluorescence lifetime measurements:modern methods and applications[J].Chemistry,2001,64(10):631-636.(in Chinese)[29]WU R Z,ZHOU J J,LEI L,et al.α-NaYF4ʒYb3+-Tm3+@CaF2nanocrystals for NIR-to-NIR temperature sensing[J].Chem.Phys.Lett.,2017,667:206-210.[30]SINGH B P,PARCHUR A K,NINGTHOUJAM R S,et al.Enhanced up-conversion and temperature-sensing behaviour ofEr3+and Yb3+co-doped Y2Ti2O7by incorporation of Li+ions[J].Phys.Chem.Chem.Phys.,2014,16(41): 22665-22676.[31]LU H Y,HAO H Y,SHI G,et al.Optical temperature sensing inβ-NaLuF4ʒYb3+/Er3+/Tm3+based on thermal,quasi-thermal and non-thermal coupling levels[J].RSC Adv.,2016,6(60):55307-55311.[32]SINGH P,SHAHI P K,RAI A,et al.Effect of Li+ion sensitization and optical temperature sensing in Gd2O3ʒHo3+/Yb3+[J].Opt.Mater.,2016,58:432-438.[33]LI H,ZHANG Y D,SHAO L,et al.High performance silica micro-tube optical temperature sensor based onβ-NaLuF4ʒYb3+/Tm3+nanocrystals[J].Opt.Mater.,2017,69:238-243.[34]DU P,LUO L H,YU J S.Upconversion emission,cathodoluminescence and temperature sensing behaviors of Yb3+ions。
乙腈不同温度下的表面蒸气压概述及解释说明1. 引言1.1 概述乙腈(化学式CH3CN)是一种常用的有机溶剂,广泛应用于化学实验室、工业生产和科研领域。
乙腈的表面蒸气压是其在不同温度下从液态向气态转变时产生的压强。
了解乙腈在不同温度下的表面蒸气压变化规律对于科学研究及工业应用有着重要意义。
1.2 文章结构本文将首先介绍乙腈的物性特点,包括分子结构、物理性质和化学性质等方面。
接着将对表面蒸气压的概念进行解释,并探讨影响乙腈表面蒸气压变化的因素。
最后,通过实验方法与结果分析,详细讨论不同温度下乙腈表面蒸气压的变化规律,并总结归纳实验结果。
1.3 目的本文旨在深入探讨乙腈在不同温度下的表面蒸气压变化规律,并通过实验结果分析验证相关理论模型。
通过研究乙腈的表面蒸气压,可以拓宽我们对乙腈及相关有机溶剂的认识,并为实验室操作、工业生产以及科学研究提供技术参考和应用前景展望。
2. 正文2.1 乙腈的物性介绍乙腈是一种常见的有机溶剂,化学式为CH3CN。
它具有无色、透明、有刺激性气味以及良好的溶解性等特点,在化工、制药等多个领域广泛应用。
乙腈的分子量为41.05 g/mol,密度为0.786 g/cm^3。
它的沸点为81.6°C,熔点为-45°C。
2.2 表面蒸气压的概念和影响因素表面蒸气压指在一定温度下,液体与其饱和蒸气之间达到动态平衡时所对应的气相压强。
表面蒸气压受多种因素影响,包括温度、分子间吸引力以及液体分子挥发速率等。
较高温度和较强分子间相互作用力会提高液体表面上的分子挥发速率,从而增加表面蒸气压。
2.3 不同温度下乙腈表面蒸气压的变化规律随着温度升高,乙腈的表面蒸气压将增加。
根据饱和蒸气压与温度之间的关系,一般而言,液体的饱和蒸气压随着温度的升高而增加。
对于乙腈来说也是如此。
以常规大气压下为例,乙腈在25°C时的表面蒸气压约为76.15 mmHg,在50°C时增至131.3 mmHg。